Embed Size (px)
Citation preview

Johnson & Wales UniversityScholarsArchive@JWU
MBA Student Scholarship The Alan Shawn Feinstein Graduate School
5-3-2012
Analysis of the Upscale/Fine Dining Sector in theRestaurant IndustryVolha BanJohnson & Wales University - Providence, [email protected]
Follow this and additional works at: http://scholarsarchive.jwu.edu/mba_studentPart of the Business Administration, Management, and Operations Commons, Business and
Corporate Communications Commons, Finance and Financial Management Commons, Food andBeverage Management Commons, and the Marketing Commons
This Research Paper is brought to you for free and open access by the The Alan Shawn Feinstein Graduate School at ScholarsArchive@JWU. It has beenaccepted for inclusion in MBA Student Scholarship by an authorized administrator of ScholarsArchive@JWU. For more information, please [email protected].
Repository CitationBan, Volha, "Analysis of the Upscale/Fine Dining Sector in the Restaurant Industry" (2012). MBA Student Scholarship. Paper 10.http://scholarsarchive.jwu.edu/mba_student/10

1
Analysis of the Upscale
An industry Analysis Submitted in Partial Fulfillmentof the Requirements for the MBA Degree
Faculty Advisor, Martin Sivula, Ph.D.
Feinstein Graduate School
Analysis of the Upscale/Fine Dining Sector in the Restaurant Industry
An industry Analysis Submitted in Partial Fulfillment of the Requirements for the MBA Degree
Course: MGMT 6800
Instructor, Paul C. Boyd Ph.D. Faculty Advisor, Martin Sivula, Ph.D.
Volha Ban
May 3, 2012
in the Restaurant Industry

INDUSTRY ANALYSIS i
Executive Summary
Upscale segment of the restaurant industry makes up approximately 10% of total U.S.
restaurant sales (Trends in Fine Dining, 2011a). Severe impact of the economic downturn on the
fine-dining segment demonstrated the 13% decline in customer visits in 2009 what triggered
steep decline in sales.
In 2011 industry experienced positive tendency and renewed interest to high-profile
steakhouse chains and upscale seafood restaurants. As National Restaurant News stated “…fine-
dining restaurants will remain popular as long as they continue to offer individuality, food
quality and more casual setting …”(Trends in Fine Dining, 2011a). Trend of casualization in
fine dining led to the implementing of two different concepts within one establishment: casual
bar area with small-plate offerings and formal dining space for the whole experience.
Ruth’s Hospitality Group, Inc. (Ruth’s) is one of the leading companies in the segment
that demonstrated positive trend in revenue within five years (2007- $319.17M, 2008 -
$393.65M, 2009 - $344.63M, 2010 - $357.63M, 2011 - $369.57M) (Ruth’s Hospitality Group,
Inc., 2012a). Balance sheet of the company confirms Ruth’s capability of paying its bills and
investing in the future growth.
Dealing with economical factors, change in customer preferences and strong competition
Ruth’s proved the strength of the company with overall success. Leaders of the company use its
competitive capabilities and resources with reasonable and fair adjustments in order to stay true
to the tradition and culture of Ruth’s, obtain the profits, expand nationwide and internationally.
INDUSTRY ANALYSIS ii
Table of contents
Executive Summary ....................................................................................................................... i
Industry Analysis .......................................................................................................................... 1
Introduction ......................................................................................................................... 1
Upscale Segment Overview ................................................................................................ 2
Companies ..................................................................................................................................... 5
Ruth’s Hospitality Group, Inc. ............................................................................................ 5
History. ......................................................................................................................................................... 5
Vision and Mission ................................................................................................................................... 5
Strategy ........................................................................................................................................................ 5
Ruth’s Hospitality Group Competitors. .............................................................................. 6
Fertitta's Morton's Restaurants, Inc. ................................................................................................ 6
History .............................................................................................. 6
Vision and Mission ........................................................................... 6
Strategy ............................................................................................. 7
Il Fornaio Corporation. .......................................................................................................................... 7
History .............................................................................................. 7
Vision and Mission ........................................................................... 7
Strategy ............................................................................................. 8
Competitive Advantage ..................................................................... 8
Del Frisco’s Restaurant Group, LLC. ................................................................................................. 8
History .............................................................................................. 8
Vision and Mission ........................................................................... 8
Strategy ............................................................................................. 8
Companies’ Key Performance Indicators ........................................................................... 9
External Environment Analysis................................................................................................. 10
General Environment ........................................................................................................ 10
Trends and Factors of Technology ................................................................................... 15
Demographic Factors ........................................................................................................ 15
Economic Factors.............................................................................................................. 15
Political Factors ................................................................................................................ 16
Sociocultural Factors ........................................................................................................ 16
INDUSTRY ANALYSIS iii
Global Factors ................................................................................................................... 17
Industry Environment ................................................................................................................ 18
The five-Forces Model of Competition ............................................................................ 18
Rivalry......................................................................................................................................................... 19
Threat of new entrants ........................................................................................................................ 19
Threat of Suppliers ................................................................................................................................ 19
Threat of Buyers ..................................................................................................................................... 20
Substitutes ................................................................................................................................................ 20
Strategic Group Map ......................................................................................................... 20
Competitor Environment .................................................................................................. 22
Current Strategies and Future Objectives ......................................................................... 22
Driving Forces .................................................................................................................. 23
Key Success Factors ......................................................................................................... 23
Internal Environment ................................................................................................................. 24
Tangible Resources ........................................................................................................... 24
Financials .......................................................................................................................... 25
Balance Sheet Analysis ........................................................................................................................ 25
Key ratio analysis. .................................................................................................................................. 28
Intangible Resources ......................................................................................................... 30
Human Resources .................................................................................................................................. 30
Trademarks, Franchise Rights and Goodwill ............................................................................. 30
Relationships ........................................................................................................................................... 31
Capabilities ............................................................................................................................................... 31
Resource and Capability Analysis .................................................................................... 32
SWOT Analysis ................................................................................................................ 33
Strategy Analysis ......................................................................................................................... 34
Final Analysis .............................................................................................................................. 36
Key Areas of Concerns ..................................................................................................... 36
Objectives ......................................................................................................................... 37
Franchise system.................................................................................................................................... 37
Profitability improvement ................................................................................................................. 37
Conclusion ................................................................................................................................... 38

INDUSTRY ANALYSIS iv
Recommendations ....................................................................................................................... 39
References ..................................................................................................................................... 40
Appendix A ................................................................................................................................... 45
List of figures and tables
Figure 1. Restaurant Industry Sales Trend. ..................................................................................... 1
Figure 2. Customer Visits Trend ..................................................................................................... 3
Figure 3. Principal Key External Driver. Per Capita Disposable Income Change ...................... 11
Figure 4. Principal Key External Driver. Healthy Eating Index.. ................................................ 12
Figure 5. Principal Key External Driver. Consumer Spending ................................................... 13
Figure 6. Principal Key External Drivers. Price of Red Meat. Per Capita Beef Consumption. .. 14
Figure 7. Porter's Five-Forces Model of Competition. ................................................................. 18
Figure 8. Strategic Competitive Group Map................................................................................. 21
Table 1. Sales of the Leading Fine Dining Restaurants .................................................................. 3
Table 2. Key Performance Indicators ............................................................................................. 9
Table 3. Balance Sheet .................................................................................................................. 25
Table 4. Key Ratios....................................................................................................................... 28
Table 5. SWOT Analysis .............................................................................................................. 33
INDUSTRY ANALYSIS 1
Industry Analysis
Introduction
The American restaurant industry was contributing and changing American culture since
the early twentieth century (Huber, 2011). Significant development of the industry in early
twenty-first century brought it to the nation’s largest private-sector employer. Today industry
employs approximately 12.9 million people (National Restaurant Association, 2012a).
According to the projections the job count will increase to 14.1 million by 2020, what brings a
very important point to consider: necessity of learning the major segment of the industry in order
to operate effectively not only for the big strong chains but also small business owners (Akers,
NA).
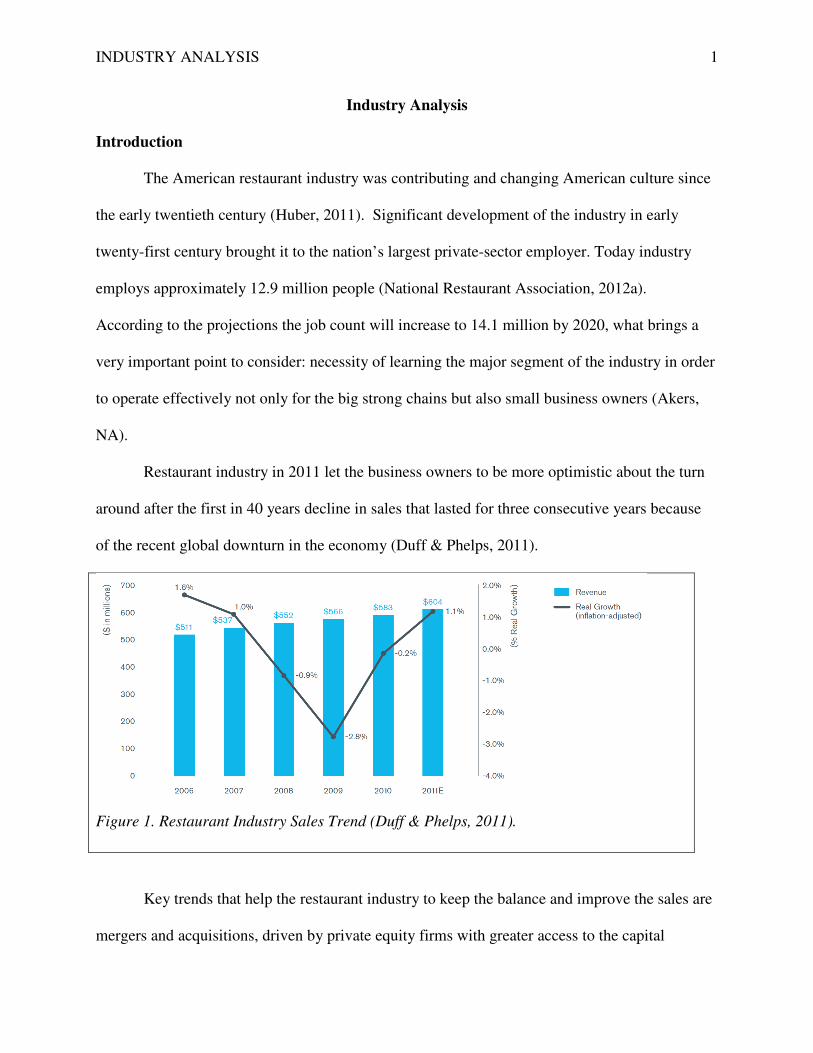
Restaurant industry in 2011 let the business owners to be more optimistic about the turn
around after the first in 40 years decline in sales that lasted for three consecutive years because
of the recent global downturn in the economy (Duff & Phelps, 2011).
Figure 1. Restaurant Industry Sales Trend (Duff & Phelps, 2011).
Key trends that help the restaurant industry to keep the balance and improve the sales are
mergers and acquisitions, driven by private equity firms with greater access to the capital

INDUSTRY ANALYSIS 2
markets; open credit markets with improved rates, terms and required equity contributions (Duff
& Phelps, 2011) and the focus on the local sourcing, sustainability, and nutrition that top menu
trends (National Restaurant Association, 2012b).
Upscale Segment Overview
Restaurant industry has four general segments according to the service customers receive:
full service, quick service, eating and drinking place and retail host (Akers, NA). Full service
dining locations do not require any food preparation by customer as well as service of food.
Fast-food chains that offer buffets and take-out service represent quick service locations. Eating
and drinking place sector includes caterers and refreshment stand vendors. And the retail host is
located within the gas stations and retail-host restaurants (Akers, NA).
The 2011 Restaurant, Food & Beverage Market Research Handbook states:
Fine dining restaurants are full-service restaurants with an upscale menu and extensive
beverage offerings. The restaurants generally have a more sophisticated décor and
ambiance, the wait staff is usually highly trained and often wears more formal attire, and
there is often a dress code for patrons (Trends in Fine Dining, 2011a, p. 102).
Authors of The 2011 Restaurant, Food & Beverage Market Research Handbook also
highlighted the most important factors that customers expect from the upscale dining
establishment: food quality, service and VIP treatment (Trends in Fine Dining, 2011a, p. 103).
Fine dinning restaurants are generally classified as independents but in the last decade
rapid growth of the higher end dining establishments in the full service segment like PF Changs,
Legal Seafoods, McCormick and Schmick’s, Ruth’s Chris, Morton’s and other brands was
driven in some cases by corporate growth (Lagesen, NA, p. 38). Fast expansion in order to
provide the customer with more dining options was delivered through acquisitions: Morton’s and
INDUSTRY ANALYSIS
McCormick and Schmick’s were acquired by Texas based Landry’
2011, Mitchell Fish Market and Cameron Steakhouse were acquired by Ruth’s Hospitality
Group, Inc. in 2008.
According to the Restaurant Management M
dining segment experienced upward
Table 1 Sales of the Leading Fine Dining Restaurants
Company 2010Ruth’s Chris Steak House Morton’s Steak House Capital Grille Melting Pot Fleming’s Prime Fogo de Chao Texas de Brazil Shula’s Steak House Palm Restaurant Smith & Wollensky TOTAL
(Rmgt, 2012)
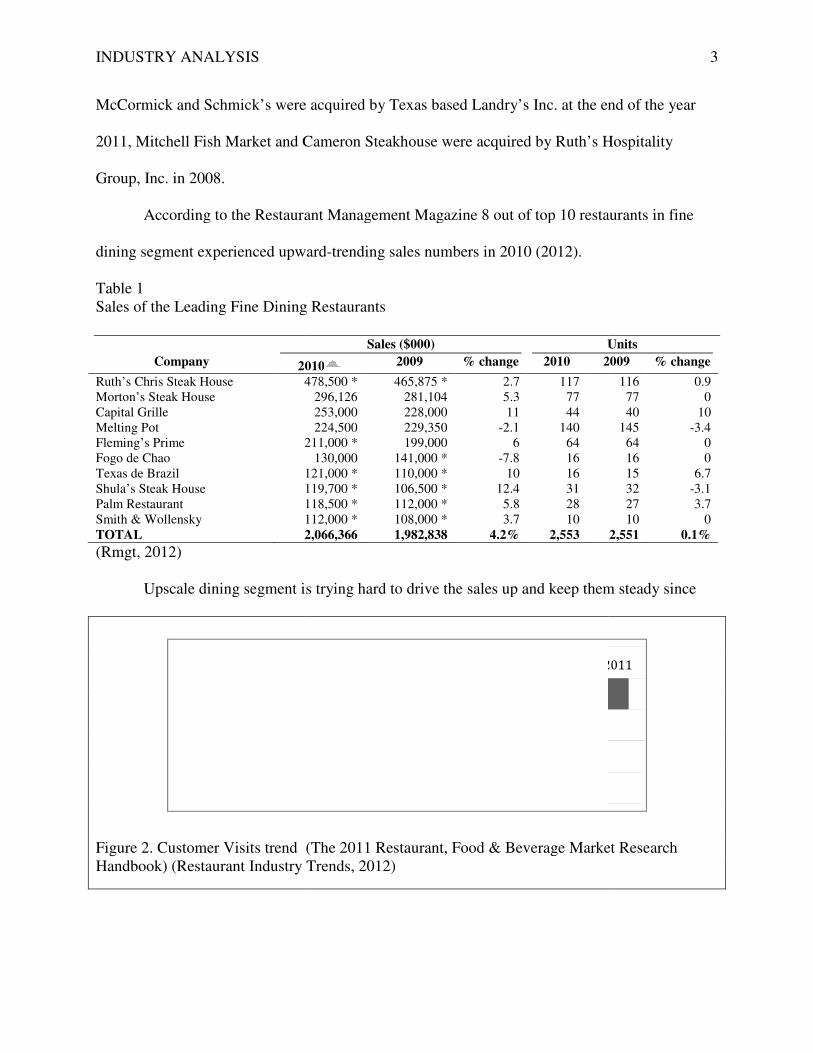
Upscale dining segment is trying hard to drive the sales up and keep them steady since
Figure 2. Customer Visits trend (Handbook) (Restaurant Industry Trends, 2012)
2004
2005
-15
-10
-5
0
5
10
McCormick and Schmick’s were acquired by Texas based Landry’s Inc. at the end of the year
2011, Mitchell Fish Market and Cameron Steakhouse were acquired by Ruth’s Hospitality
g to the Restaurant Management Magazine 8 out of top 10 restaurants in fine
dining segment experienced upward-trending sales numbers in 2010 (2012).
Sales of the Leading Fine Dining Restaurants
Sales ($000) Units
2010 2009 % change 2010 2009
478,500 * 465,875 * 2.7 117 296,126 281,104 5.3 77 253,000 228,000 11 44 224,500 229,350 -2.1 140
211,000 * 199,000 6 64 130,000 141,000 * -7.8 16
121,000 * 110,000 * 10 16 119,700 * 106,500 * 12.4 31 118,500 * 112,000 * 5.8 28 112,000 * 108,000 * 3.7 10 2,066,366 1,982,838 4.2% 2,553
Upscale dining segment is trying hard to drive the sales up and keep them steady since
. Customer Visits trend (The 2011 Restaurant, Food & Beverage Market Research ) (Restaurant Industry Trends, 2012)
2005
20062007
2008
2009
2010
2011Customer Visits in %
3
nc. at the end of the year
2011, Mitchell Fish Market and Cameron Steakhouse were acquired by Ruth’s Hospitality
agazine 8 out of top 10 restaurants in fine
Units
2009 % change
116 0.9 77 0 40 10
145 -3.4 64 0 16 0 15 6.7 32 -3.1 27 3.7 10 0
2,551 0.1%
Upscale dining segment is trying hard to drive the sales up and keep them steady since
The 2011 Restaurant, Food & Beverage Market Research
2011

INDUSTRY ANALYSIS 4
the customer visits to the fine dining restaurants have been declining in the past several years.
The profit of fine dining establishments depends for the most part on business
entertaining, and the volume of the business people that charge their dinners on expense accounts
declined dramatically as well. As the result upscale segment is reconsidering their offerings very
carefully in order to be able to compete on the market and attract the customer. Since the
consumers are still watching their spending majority of upscale dining restaurants went in the
direction of new pricing strategies and innovations as well as casualization in fine dining.
INDUSTRY ANALYSIS 5
Companies
Ruth’s Hospitality Group, Inc.
History. Ruth’s Hospitality Group, Inc. portfolio includes legendary Ruth's Chris
Steak House brand, Mitchell's/Columbus Fish Market, Mitchell's/Cameron's Steakhouse brands,
which were acquired by the Company in February 2008. Ruth Fertel found the Ruth’s Chris
Steak House in 1965 when she mortgaged her home for $22,000 to purchase the "Chris Steak
House" that had 60-seats and was located in New Orleans, Louisiana (Ruth’s Hospitality Group,
Inc., 2010a). First franchise was opened in 1976 in Baton Rouge and started the growth of the
company that was expanding and competing with other upscale steak houses that were getting on
the market (Fundinguniverse, 2012a). With acquisition of Mitchell's Fish Markets, two Mitchell's
Steakhouses and one Cameron's Steakhouse in February 2008 Company changed the name form
Ruth’s Chris Steak House, Inc. to Ruth’s Hospitality Group, Inc. since it owned not only steak
houses but also seafood restaurant (Ruth’s Hospitality Group, Inc., 2010a).
Vision and Mission. “The mission of Ruth's Chris Steak House is to build a growing,
profitable restaurant business in which the highest standards of quality, value and hospitality are
expressed” (Fundinguniverse, 2012a).
Strategy. As stated in the annual report company’s growth and strong competitive
position reflect in its strategies of continuous sales and profitability improvement (consistency of
food quality, educational programs for management, brand awareness through media and
innovative marketing programs) and relationship expansion with New and Existing Franchisees
by providing operational guidance and sharing “best practices” (Ruth’s Hospitality Group, Inc.,
2010a).
INDUSTRY ANALYSIS 6
Ruth’s Hospitality Group Competitors.
Fertitta's Morton's Restaurants, Inc.
History. Morton’s Restaurant Group, Inc. owns and operates Morton’s of Chicago, a
high-end steakhouse restaurant chain and Trevi that offers Italian specialties. Arnie Morton and
his partner Klaus Fritsch opened first Morton’s, a Chicago steakhouse in 1978. Restaurant with
the short and simple menu to be done by broiler cook, as well as already aged and cut meat
developed by 1987 to $ 12.4 million chain and was sold to Lexington Investment Co. First
public offering of stock was made in 1992 when chain belonged to Quantum Restaurant Group,
its first profitable year. Morton’s of Chicago remained Quantum’s high-end restaurant chain
with trained chefs that prepare and present every dish to exact company specifications, with the
same ingredients and recipes. Quantum Restaurant Group renamed itself in 1996 to Morton’s
Restaurant Group (Fundinguniverse, 2012b). December 16, 2011 Tilman J. Fertitta announced
that his wholly-owned company, Fertitta's Morton's Restaurants, Inc. and his wholly owned
subsidiary Fertitta Morton's Acquisition, Inc. have signed an Agreement to acquire 100% of
Morton's Restaurant Group, Inc. (PR Newswire,2011).
Vision and Mission. Fertitta's Morton's Restaurants, Inc. mission statement is
“ Identify, acquire and grow time-tested restaurants groups which are clearly distinguished in
their market niches”. Two strategies were refined: expanding and replicating the continuing
success of the Morton’s of Chicago steakhouse and Trevi (Fundinguniverse, 2012b). Since
Morton’s of Chicago steakhouse accounts for the most part of the company’s revenue it is
important to mention the mission statement of the high-end steakhouse chain - “Our mission at
Morton's The Steakhouse is always to exceed our guests' expectations” (Morton’s, 2012).
INDUSTRY ANALYSIS 7
Strategy. Morton’s business strategy is continuous focus on the mission statement, core
values and simplicity that will allow delivering an exceptional dining experience. As well as
maintaining operating margins through a combination of menu price increases, cost controls,
careful evaluation of property and equipment needs, and efficient purchasing practices
(Morton’s, 2012).
Il Fornaio Corporation.
History. Creating Il Fornario Baking School and gathering centuries-old recipes from
different regions in Italy was the starting point for Il Fornario Corporation in the year 1972 –
New Italian Bakery Concept. Concept was introduced to the U.S. in 1980 when the company
acquired exclusive rights in the United States to the Il Fornaio trademark and to certain recipes
that remained central to the company's bakery concept. Development of full-service restaurant
with creatively prepared, premium-quality Italian cuisine based on authentic regional recipes was
new business strategy in 1987. Restaurants, wholesale bakeries, and retail markets worked
together to reinforce the image of Il Fornario’s as a provider of authentic Italian food. Today Il
Fornario Corporation owns and operates 22 full-service restaurants, two "Panificios" (wholesale
bakeries) that produce fresh, handmade breads, pastries. In conjunction with the restaurant and
bakeries, Il Fornaio also operates catering facilities at such prestigious locations as The Hotel St.
Claire and The Garden Court Hotel in Palo Alto (Il Fornario, 2012a).
Vision and Mission. Il Fornaio's mission is to provide customers with the most
authentic Italian experience outside of Italy by being students and teachers of Italian culinary
traditions, preparations and presentations, by putting employees first so that customers can come
first. Company realizes its mission by executing a profitable business strategy that rewards
shareholders without compromising the quality of the products and by developing an atmosphere
of camaraderie and fun in all endeavors (Fundinguniverse, 2012c).
INDUSTRY ANALYSIS 8
Strategy. Since company was acquired by Atlanta-based Roark Capital Group last year
in June it is not really clear what direction it will go and if the new private owner will shift away
from the strategy of continuous growing and expanding of the concepts with pursuing the
mission of the company.
Competitive Advantage. Il Fornaio's strategy focused on differentiating its
restaurants from other restaurants in the Italian food segment by offering creatively prepared,
premium-quality Italian cuisine based on authentic regional recipes (Fundinguniverse, 2012c).
Del Frisco’s Restaurant Group, LLC.
History. Del Frisco's Restaurant Group, LLC was founded in 1981 and has its
headquarters in Wichita, Kansas (Bloomberg BusinessWeek, 2012). Today with about 30
locations in more than 15 states Del Frisco's Restaurant Group operates two upscale steakhouse
chains, Del Frisco's Double Eagle Steak House and Sullivan's. Together with casual chain Del
Frisco's Grille restaurants company offers service of premium cuts of beef along with seafood,
lamb, and pork dishes as well as an extensive wine list. Del Frisco's Restaurant Group controlled
by Dallas-based private equity firm Lone Star Funds that filed to go public in 2012 (Hoovers,
2012c). Formerly company was known as LSF5 Wagon Investments, LLC and changed its name
to Del Frisco's Restaurant Group, LLC in 2006 (Bloomberg BusinessWeek, 2012).
Vision and Mission. Research of the company demonstrated that mission and vision are
not defined clear, but their webpage gives one loud statement that describes their culture “Do
Right and Fear No Man” (Del Frisco’s Restaurant Group, LLC, 2012a). Company strives to
embody the “rich tradition of fine American steak houses, amazing guests through the
impeccable chef-driven cuisine, extensive award-winning wine list and unparalleled hospitality”
(Del Frisco’s Restaurant Group, LLC, 2012a).
Strategy. Main strategies that Del Frisco’s pursues are focused on the growth of the
INDUSTRY ANALYSIS 9
company through disciplined new unit expansion, growth of our existing restaurant sales and
further growth of private dining business (Del Frisco’s Restaurant Group, LLC, 2012b
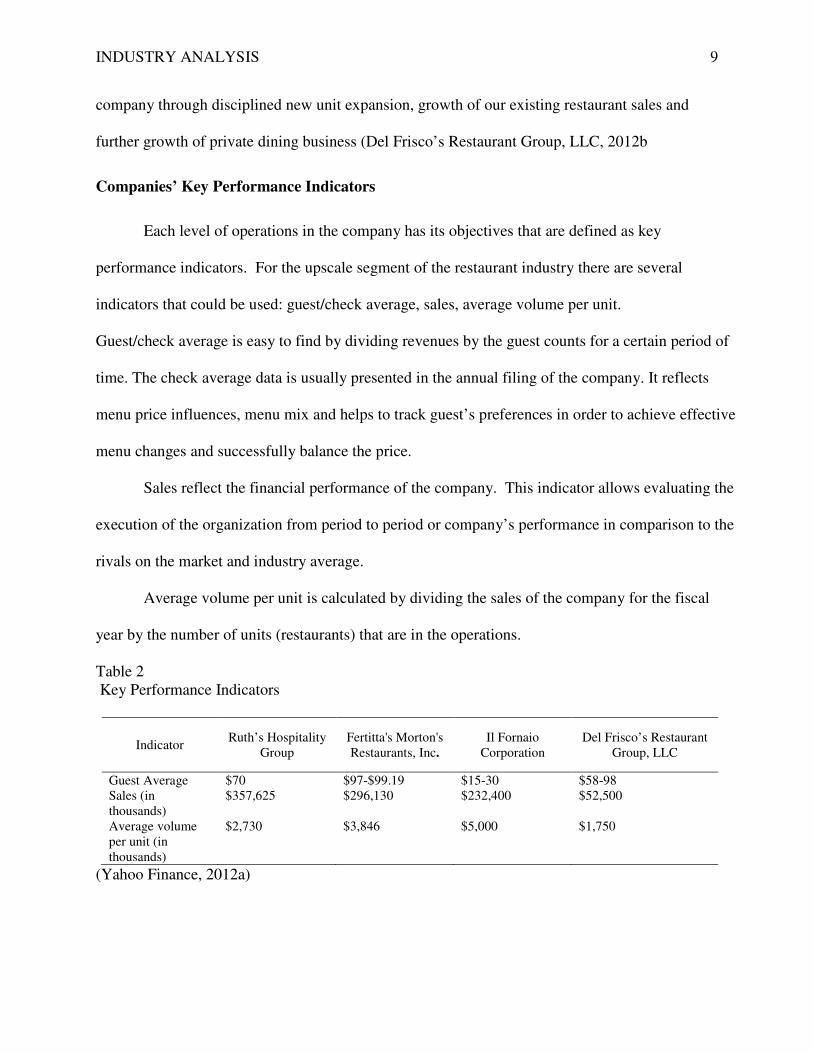
Companies’ Key Performance Indicators
Each level of operations in the company has its objectives that are defined as key
performance indicators. For the upscale segment of the restaurant industry there are several
indicators that could be used: guest/check average, sales, average volume per unit.
Guest/check average is easy to find by dividing revenues by the guest counts for a certain period of
time. The check average data is usually presented in the annual filing of the company. It reflects
menu price influences, menu mix and helps to track guest’s preferences in order to achieve effective
menu changes and successfully balance the price.
Sales reflect the financial performance of the company. This indicator allows evaluating the
execution of the organization from period to period or company’s performance in comparison to the
rivals on the market and industry average.
Average volume per unit is calculated by dividing the sales of the company for the fiscal
year by the number of units (restaurants) that are in the operations.
Table 2 Key Performance Indicators
Indicator Ruth’s Hospitality
Group Fertitta's Morton's Restaurants, Inc.
Il Fornaio Corporation
Del Frisco’s Restaurant Group, LLC
Guest Average $70 $97-$99.19 $15-30 $58-98 Sales (in thousands)
$357,625 $296,130 $232,400 $52,500
Average volume per unit (in thousands)
$2,730 $3,846 $5,000 $1,750
(Yahoo Finance, 2012a)
INDUSTRY ANALYSIS 10
External Environment Analysis
General Environment
Environment that company operates goes far beyond the industry and even farther than
the industry segment where company has business. That environment is defined as company’s
Macro-Environment and has seven components that have potential to affect the company and its
competitive environment: trends of technology, demographics, economic conditions, political
and regulatory factors, social forces and global factors (Thompson, Peteraf, Gamble, &
Strickland, 2011). These entire factors can influence the company in different ways and to
different degrees, but company itself has no power to make an impact on the macro-environment
(P. Boyd, personal communication, March 2012).
External drivers of the upscale dining segment in the restaurant industry are per capita
disposable income, employment status, healthy eating index, consumer spending and consumer
sentiment index.
Per capita disposable income determines the ability of the population to spend money on
goods and services. Rising corporate profits and boosted customer sentiment led to the positive
0.9% in 2010, but the lower income population will still remain under the pressure of rising
prices. Wealthier group will be influenced by the tax rates and rising prices on the high end and
luxury goods that will slow down the real income growth in 2013-2017 (IBISWorld, 2012a).
This trend defines limited amount of visitors to the restaurants within the time period 2013-2017,
especially fine dining establishments.

INDUSTRY ANALYSIS 11
Figure 3. Principal Key External Driver. Per capita disposable income change (IBISWorld,
2012a).
Employment status is positively correlated with the dining out and choice of where and
how often. Rising national unemployment rate can negatively affect the restaurant traffic, the
upscale segment specifically. As research shows dining out by full-time employed adults was
consistent in the past three years what can turn the trend around because of rising trust and
confidence of the population (Packaged Facts, 2012).
Healthy eating index is the percentage of a recommended diet that an average American
consumes. The overall trend towards vegetable drove up the vegetable prices as well as produce
prices that where affected by high oil prices for the most part. Another trend is low-carb, high-
protein diets that will increase the meat consumption. Recovering economy and growth in the
income leads the overconsumption of the produce and drives the healthy index down
(IBISWorld, 2011b).

INDUSTRY ANALYSIS 12
Figure 4. Principal Key External Driver. Healthy Eating Index. (IBISWorld, 2012b).
Consumer spending is defined as amounts spent by the population on services and goods
inside the country and abroad. Extended payroll tax cut was favorable government policy that
will support the growth of spending power. Brighter outlook of the economic recovery and
higher employment drive the increase in consumer spending rather than savings (IBISWorld,
2011c)

INDUSTRY ANALYSIS 13
Figure 5. Principal Key External Driver. Consumer spending (IBISWorld, 2012c).
Consumer sentiment index was affected by growing corporate profits in the last two years
and ability of businesses to keep wage costs down by restoring the stock portfolios and
generating income. All of that stimulated the customer sentiment. Population finally
experienced a slight relief because of getting on the way of stabilization. In April 2012
consumer sentiment index reaches its highest for the last year that will be reflected hopefully
later in the increase of restaurants visits (Woeller, 2012).
Price of red meat and beef consumption, two external drivers that move in opposite
directions. Red meat especially beef and pork have been in higher demand till the consumer
preferences, diet concerns and price point change the trend. Preferences shift towards the poultry
did not affect the increasing price of the red meat because oil prices went up simultaneously.
Beef consumption decreased because of health concerns and consumers awareness of the
outbreaks (IBISWorld, 2011d). Both drivers negatively affect the upscale restaurant industry

INDUSTRY ANALYSIS 14
because increased prices on beef increase the food costs and declined beef consumption leads to
the choice of cheaper product like fish and poultry that bring less income.
Figure 6. Principal Key External Drivers. Price of Red Meat. Per Capita Beef Consumption.
(IBISWorld, 2011d).

INDUSTRY ANALYSIS 15
Trends and Factors of Technology
Going mobile and moving faster is the technology trend in the restaurant industry that
shapes all the segments through different innovations. Use of a smartphone and ability to access
restaurant booking system from anywhere decreased the number of phone calls for reservation as
well as allowed the restaurant operators to gather certain data for marketing purposes. Another
trend is “check in services” like Foursquare that represents “context-aware” type of advertising
and attracts the customer with its sophistication. Mobile payment system like GOOGLE wallet
that stores all the credit cards and loyalty cards as well as enables redeeming of promotional
offers will speed up the payment process and secure the customer information (Packaged Facts,
2012).
Demographic Factors
Results of survey conducted by Packaged Facts in June 2011 revealed that population of
age 24-35 is the most frequent visitor to the fine dining establishments – 31% compared to other
age groups; based on the income the leader is the population with House Hold income of
$100K+ (2012). Returning back to growth economy influenced the earnings of the higher
income households and showed a slight increase over the past two years; according to the
IBISWorld the momentum will retain and by 2016 growth rate will reach 22.9% (2011). That is
great insight for the marketing department of the fine dining segment to study the preferences
and address them as well as it is a clear target for the attraction.
Economic Factors
Still low measures of consumer sentiment and cautiousness of firms about the full-speed
operations, still weak labor market conditions and slight gains in manufacturing production as
well as elevated risk premiums indicate slow process of economic upturn. But the situation will

INDUSTRY ANALYSIS 16
improve cautiously through 2014 with bringing positive outcome for all the industries as well as
fine dining sector of food service (Packaged Facts, 2012).
Political Factors
There are many policies and regulations that can affect the upscale segment of the
restaurant industry, many of them related to the health and food issues, jobs and career as well as
profitability of the business.
If final regulations that are related to nutrition disclosure issues will be published in 2012,
when the law takes effect, restaurants with 20 or more locations will be required to provide
calories on menus (National Restaurant Association, 2012c).
There are two bills still pending in Congress to make the 15-year restaurant depreciation
schedule permanent, which will allow restaurants to write off, or depreciate, the cost of
improvements and new construction over 15 years, rather than 39 years. This uncertainty is
holding many companies from capital expenditures since it reduces the cash flow by approx. 4.1
K a year (National Restaurant Association, 2012c).
Business meal deduction from 100 percent to 50 percent in 1992 decreased the
profitability of restaurants and affected the upscale segment that is heavily relies on conference
room business. Proposed 80 percent business meal deduction would increase business meal sales
by $7 billion (National Restaurant Association, 2012c).
Sociocultural Factors
Sociocultural forces that include attitude of the society, families’ lifestyles and change in
values impact the industry over the time. Shift in preferences is obvious: people are looking for
healthy and freshly prepared food, leaning towards premium products and value. Another trend
is that people prefer to eat home to going out, which was the consequence of the economical

INDUSTRY ANALYSIS 17
downturn. The NDP group defined two different mindsets when it comes to spending: people
that spend free and those who cannot. It is clear that dichotomy between these two groups
shapes the restaurant segment of upscale dining. The agency defined that 24 percent are
optimists and 76 percent are controlling their spending (Restaurant Industry Trends, 2012).
Global Factors
Global forces correlate with the economic situation in the world that is slowly reviving
and demonstrating healthy indicators. Another factor that can influence the industry – change in
climate. Environmental matters lead to new initiatives of reducing water consumption and
pressing with tax on the emission. Paying out the tax and possible requirements of equipment
change can create extra operational costs for the companies.

INDUSTRY ANALYSIS
In order to analyze the industry environment of upscale dining segment, define
competitors and mark the position of the company Porter’s Five
Force Model of Competition is the most powerful and useful tool in order to diagnose the
competitive pressure in the industry. It enables to identify different parties that are involved and
specific factors that bring about competit
The five-Forces Model of Competition
Figure 7. Porter's Five-Forces Model of Competition (Thompson et al., 2011).
Industry Environment
In order to analyze the industry environment of upscale dining segment, define
competitors and mark the position of the company Porter’s Five-Force Model will be used. Five
Force Model of Competition is the most powerful and useful tool in order to diagnose the
competitive pressure in the industry. It enables to identify different parties that are involved and
specific factors that bring about competitive pressures (Thomson et al., 2012).
Forces Model of Competition
Forces Model of Competition (Thompson et al., 2011).
18
In order to analyze the industry environment of upscale dining segment, define
el will be used. Five-
Force Model of Competition is the most powerful and useful tool in order to diagnose the
competitive pressure in the industry. It enables to identify different parties that are involved and

INDUSTRY ANALYSIS 19
Rivalry. The upscale segment in restaurant industry is highly competitive because of
slowly growing buyers’ demand, no cost of choosing another restaurant to dine, substantial
amount of restaurants. Customers are expecting great value of food and quality of service with
respect to price and promotions. Revenues of the restaurants depend on customer traffic that can
be influenced by strong and aggressive marketing. Competitive advantage can be also obtained
through changing prices and differentiating strategies.
Threat of new entrants. The threat of the new entrants is extremely high because of
low entry barriers. Buyers’ demand is in the stage of growing after the economic downturn and
promises to be steady. Product differentiation is relatively weak because all the upscale
restaurants are offering the highest quality product and striving to provide quality service.
Capital requirements to start a new business are relatively low. The cost of opening of a new
restaurant is on average $500,000 (Restaurant Owner, 2012). That is relatively low to start up a
new business. Another factor is franchise component of the industry that allows new business
owners obtain equipment, premises, furniture from the owner, which lowers initial cost of a start-
up (IBISWorlde).
Threat of Suppliers. Suppliers’ bargaining power in upscale segment of the restaurant
industry is very weak, since each company in the segment accounts for the big fraction of the
supplier’s sales. For example Ruth’s company owned restaurants purchase more than 60 percent
of their USDA Prime and Choice grade beef from one supplier, more than 80 percent of their
seafood is purchased from two vendors (Ruth’s Hospitality Group, Inc., 2012b). The reason
behind it is maintaining consistent quality throughout all the restaurants in the chain. The cost of
switching to a different supplier is relatively low as well as there are good substitutes for
supplier’s product.

INDUSTRY ANALYSIS 20
Threat of Buyers. Buyers’ bargaining power is very strong due to absence of switching
costs when choosing different restaurant to dine. Customers are very well informed about the
pricing and quality of the product that upscale segment offers as well as there is an option
existent of postponing the visit to the fine dining establishment. In todays slowly reviving
economy buyer is very price-sensitive, which puts upscale segment on the spot of reconsidering
their price point and offering the alternative.
Substitutes. Competitive pressure from the sellers that offer substitute products goes
both ways: if there is a substitute of equal quality available there is almost no difference to
switch over and customers loyalty comes in to play as well, but if guest is looking for quality
food with less focus on the overall experience and atmosphere that fine dining offers they switch
to lower cost provider, casual dining.
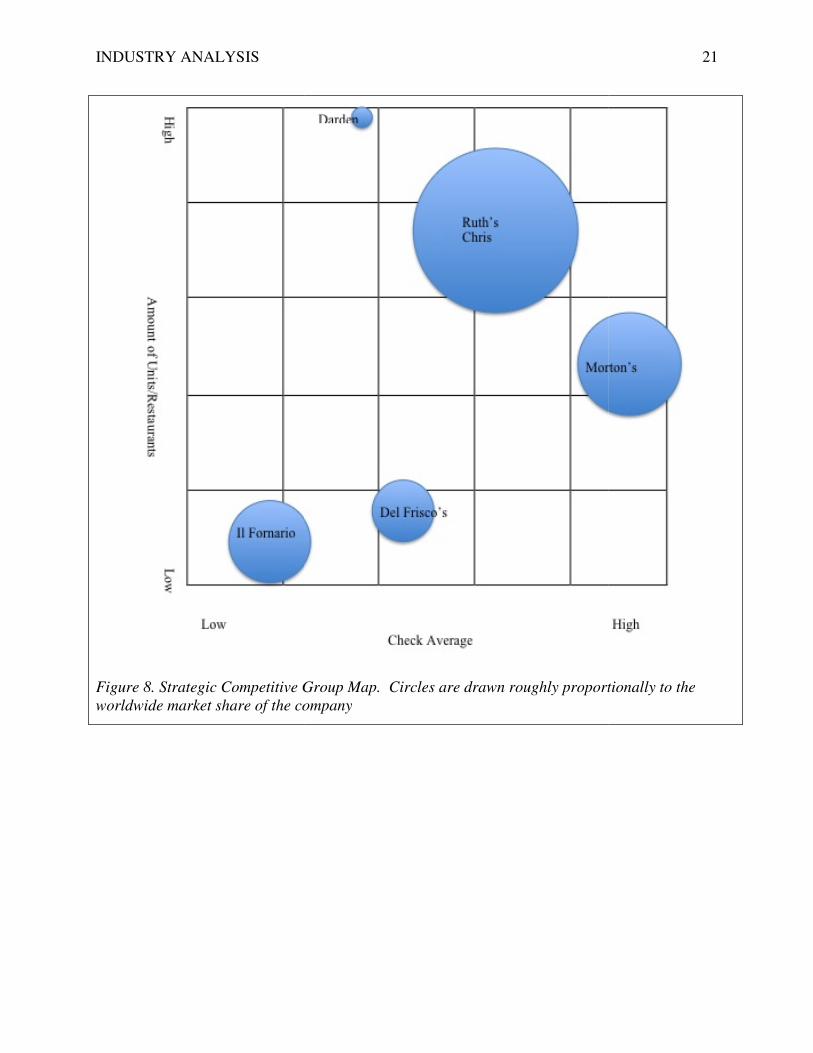
Strategic Group Map
In order to assess the market positions of a key competitor it is helpful to use strategic
group map. The competitive characteristics that differentiate fine dining restaurants in the
segment of the restaurant industry are amount of units (geographical coverage), check average
(price range) and sales. According to the results of the group mapping it is clear that Ruth’s
Hospitality Group, Inc. is located in the favorable position with high level of geographical
coverage and relatively high price range. In terms of the amount of units Darden Inc. can be one
of the competitors, but Darden, Inc. offers different types of restaurants with casual service, there
are not many steak houses on the list that can compare to Ruth’s. On the other hand Morton’s is
a strong competitor, but Ruth’s has advantage of the price range that matters today more than
ever and geographical coverage.
INDUSTRY ANALYSIS
Figure 8. Strategic Competitive Group Map. Circles are dra
worldwide market share of the company
Strategic Competitive Group Map. Circles are drawn roughly proportionally to the
worldwide market share of the company
21
wn roughly proportionally to the
INDUSTRY ANALYSIS 22
Competitor Environment
Restaurant business is very competitive in general and highly fragmented. Upscale
segment of the industry is competing based on the quality of the food, price, customer service,
reputation of the brand name and locations. Upscale chain restaurants that offer prime quality
steak and seafood compete with family owned restaurants in their markets and within the region
or nationwide. Level and degree of the competition depends on the degree of rival’s
establishment in the market where company intends to expand (Ruth’s Hospitality Group, Inc.,
2012b). Competition increases due to amount of culinary schools graduates that enter the
industry with intention to provide that fine dining and introduce their skill. Revenues of the
restaurants in the upscale segment depend on the business travel and corporate dinners at higher
degree than in casual segment (Morton’s, 2010). According to the Inc.com the best places for
business dinner are only fine dining restaurants (2012).
Current Strategies and Future Objectives
Most of the upscale segment chain restaurants are focused on the expansion strategy
nationwide or internationally. Companies strongly believe that one of the best ways to grow the
revenue is opening of new units. Another strategy that is common for the segment is focus on
sales and profitability through marketing, cost control, monitoring of financial statements and
quality control (Del Frisco’s Restaurant Group, LLC, 2012b) (Ruth’s Hospitality Group, Inc.,
2012b). One of the future objectives is improvement of customer service that is critical for fine
dining overall experience and is a differentiating point in restaurant industry. Close attention to
the changes in the customer’s tastes and preferences and adequate reaction to it are critical
objectives in order to be attractive to the guest and generate the revenue.

INDUSTRY ANALYSIS 23
Driving Forces
Many of driving forces come from the external environment, but many of them are
generated in the competitive environment. The key driving force of the upscale segment in the
restaurant industry is marketing of the product as well as the way of differentiating the product
from other competitors. Providing and maintaining great quality product under the brand name
is another driving force in the fine dining industry.
Key Success Factors
According to the IBISWorld (2011f) there are several key success factors:
• Ability to react fast and adequate to the changes and regulations in areas of food safety
and handling;
• “Access to multi-skilled and flexible workforce”. In order to meet customer demand due
to the seasonality of the business it is important to be able to obtain skilled and trained staff
(IBISWorld, 2011f).
• “Ability to control stock on hand” (IBISWorld, 2011f). Cost control can improve profit.
• Adaptability of new technologies will increase profitability and lower the cost of labor.
• “Proximity to key markets” (IBISWorld, 2011f). Following customer’s preferences in
favorable location increases guest traffic.
INDUSTRY ANALYSIS 24
Internal Environment
Tangible Resources
Tangible resources of a company are represented with physical resources, financial
resources, organizational resources and technological assets (Thompson et al., 2012). Ruth’s
Hospitality Group, Inc. has 131 Ruth’s Chris Steak House restaurants (63 are company-owned
and 68 are franchisee-owned), operates 19 Mitchell’s Fish Markets and three Cameron’s Steak
House restaurants. Geography of the locations goes beyond the U.S. boundaries; there are
Ruth’s Chris restaurants in Aruba, Canada, China, Mexico, Japan, Taiwan and United Arab
Emirates. (See Appendix A) Restaurants range in size from approximately 6,000 to
approximately 13,000 square feet with approximately 180 to 375 seats across the board in all the
concepts of the Company. Future expectations for new opened restaurants range from 8,000 to
10,000 square feet with approximately 230 to 250 seats (Ruth’s Hospitality Group, Inc., 2012b).
Total revenue for the fiscal year 2011 was $369,573 thousand that included $353,606
(95.7%) thousand from restaurant sales, $12,464 (3.4%) thousand from franchise income and
other operating income brought $3,503 (0.9%) thousand. There is a slight difference between
Steak house restaurants and Seafood restaurants of the company in terms of the sales mix:
average check of the Ruth’s Chris is $70 and Mitchell’s Fish Market - $35; wine sales account
for 64 percent of liquor sales in Ruth’s Chris, at Mitchell’s Fish Market it is only 49 percent
(Ruth’s Hospitality Group, Inc., 2012b).
Company is using point-of-sale system that provides efficiency to the company by
generating financial and marketing reports and reducing corporate and administrative costs and
time. Company’s corporate system provides management with performance reports and
restaurants comparison data from previous data (Ruth’s Hospitality Group, Inc., 2012a).

INDUSTRY ANALYSIS 25
Financials
Balance Sheet Analysis
Table 3 Balance Sheet Dec 24, 2011 Dec 25, 2010 Dec 26, 2009
Assets Current Assets Cash And Cash Equivalents 3,925 5,018 1,681 Short Term Investments - - - Net Receivables 14,338 13,649 11,640 Inventory 7,358 7,521 7,368 Other Current Assets 1,448 1,314 1,346
Total Current Assets 27,069 27,502 22,035 Long Term Investments - - - Property Plant and Equipment 99,154 105,151 114,204 Goodwill 22,097 22,097 22,097 Intangible Assets 49,346 53,056 53,880 Accumulated Amortization - - - Other Assets 3,626 4,468 3,953 Deferred Long Term Asset Charges 38,928 36,795 38,246
Total Assets 240,220 249,069 254,415
Liabilities Current Liabilities Accounts Payable 30,055 29,240 23,152 Short/Current Long Term Debt - - - Other Current Liabilities 36,264 36,623 36,936
Total Current Liabilities 66,319 65,863 60,088 Long Term Debt 22,000 51,000 125,500 Other Liabilities 5,333 6,023 6,419 Deferred Long Term Liability Charges 23,037 22,284 20,643 Minority Interest - - - Negative Goodwill - - -
Total Liabilities 116,689 145,170 212,650
Stockholders' Equity Misc Stocks Options Warrants - - - Redeemable Preferred Stock 23,891 23,538 - Preferred Stock - - - Common Stock 341 339 236 Retained Earnings (101,225) (118,282) (132,061) Treasury Stock - - - Capital Surplus 200,524 198,304 173,590 Other Stockholder Equity - - -
Total Stockholder Equity 99,640 80,361 41,765
Note. (Yahoo Finance, 2012a)
INDUSTRY ANALYSIS 26
Overall the financial situation of the Ruth’s Hospitality Group, Inc. demonstrates positive
trend from the previous years: decreased Total Liabilities, increased Total Stockholder Equity
and relatively stable Total Current Assets.
Decrease in total assets by 3.6% depends for the most part on the change in plant and
equipment assets (-$5,997) and intangible assets (-$3,710). Decrease in plant and equipment
assets is the result of closure of one of the Company-owned Ruth’s Chris Steak House in the
fiscal year as well as accumulated depreciation. There are no others restaurant opened due to
new position of the CEO in terms of focusing on existent property and its marketing and filling
the pipeline for new developments for the coming 2012 (Seeking Alpha, 2011). Depreciation is
computed on a straight-line basis over the estimated useful lives of assets (Ruth’s Hospitality
Group, Inc., 2012). Intangible assets change is the result of the annual impairment test that
reduced the value of the Mitchell’s Fish Market trademark to $9,2 million (30 %) (Ruth’s
Hospitality Group, Inc., 2012b). Despite the recorded deficit of $101,225 in retained earnings
company managed to increase the total stockholder equity to $99,640 what makes a 20%
increase compared to 2010 and 68% increase compared to 2009. Positive trend from the
previous 2010 and 2009 in retained earnings was possible due to increased Net Income over the
past two years which also allowed the Company to pay out some of the preferred stock dividend
in the amount of $2,178 in 2010 and $2,493 in 2011.
Even though Balance Sheet of the Ruth’s Hospitality Group shows ability to pay their
liabilities and have resources for growth, current liabilities in 2011 increased due to potentially
longer collection period or change in the collection methods (accounts payable), because
negative trend is clear if compared to the previous 2010 and 2009 fiscal years (-$815, -$6,903).
INDUSTRY ANALYSIS 27
Analysis of Total Liabilities demonstrates that Ruth’s did better in 2011 compared to the
previous two years which is reflected in the decrease of liabilities by $28,481 (20%) in 2010 and
$95,961 (80%) in 2009. The change was the effect of the decreased long-term debt. The amount
of $29,0 million was paid out to senior credit facility in the fiscal 2011 with an aggregate of
$22,0 million outstanding at the interest rate of 3.56% and approximately $103.4 million
available for borrowings.
In addition to the Balance Sheet analysis it is important to mention that the Company
entered new Credit Facility Agreement with Wells Fargo Bank that allowed reducing the overall
facility by $29.6 million, reduce commitment charges and fees and extend the maturity of
borrowings to February 14, 2017 (Ruth’s Hospitality Group, Inc., 2012).

INDUSTRY ANALYSIS 28
Key ratio analysis. Table 4 Key Ratios
Fiscal Year Fiscal Year Ends: Dec 25 Most Recent Quarter (mrq): Dec 25, 2011 Profitability
Profit Margin (ttm): 5.29%
Operating Margin (ttm): 7.32%
Profitability or the bottom line of the Company is pretty strong, which means that Ruth’s
has a potential for investments and future growth. Operating margin matches the industry.
Basically, Ruth’s Hospitality Group, Inc. has healthy profit margins which attracts the investor.
Very important to keep in mind that the profit margin is fluctuating with changes in sales, since
restaurant business has its seasonal ups and downs, investor has to pay attention to overall
stability of the profit margins.
Cash Flow Statement Operating Cash Flow (ttm): 39.34M Levered Free Cash Flow (ttm): 23.53M
(Yahoo Finance, 2012b)
Management Effectiveness Return on Assets (ttm): 6.91% Return on Equity (ttm): 16.79%
Income Statement Revenue (ttm): 369.57M Revenue Per Share (ttm): 10.84 Qtrly Revenue Growth (yoy): 7.10% Gross Profit (ttm): 76.70M EBITDA (ttm)6: 42.13M Net Income Avl to Common (ttm): 12.87M Diluted EPS (ttm): 0.39 Qtrly Earnings Growth (yoy): -43.60%
Balance Sheet Total Cash (mrq): 3.92M Total Cash Per Share (mrq): 0.12 Total Debt (mrq): 22.00M Total Debt/Equity (mrq): 17.81 Current Ratio (mrq): 0.41 Book Value Per Share (mrq): 2.92
INDUSTRY ANALYSIS 29
Management effectiveness that shows that company is operated in order to earn the most
profit is reflected through Return on Equity and Return on Assets ratios. Return on Equity is not
great but it is positive and gives the Company room for improvement and indicates for the
investors that Company is not very risky to invest.
Solvency ratios are not at a glance but Ruth’s does not have a lot of debt as of December
25, 2011. This fact will allow the Company to lend more money if needed for the expansion and
development.
Liquidity of the Ruth’s is very week since it is 0.41, which indicates that Company is not
capable of paying its current liabilities with cash and assets that can be easy converted to cash.
But Ruth’s defines its liquidity as adequate since the Company is using cash straight from
operating activities to pay out liabilities. In restaurant business the purchase and payment
happen at the same time without any credits, that gives the Company the ability to use the cash
from the operations immediately.
Free cash flow amount allows the Company to fund any activities: invest in new
development, expand or repay the debt. That is a positive trend that defines company’s strength
and potential.
INDUSTRY ANALYSIS 30
Intangible Resources
Human Resources. Workforce diversity became a business strategy for Ruth Fertel
when she opened her first restaurant in 1965; just one year after the Civil Rights Act of 1964 was
passed. She was always protecting women and minorities in the workplace because she
understood the value of each employee that was contributing to her success despite the race,
gender and age. Ruth Fertel was challenged as a female pioneer in the restaurant industry
herself, but managed to be successful and value the differences of each member of the team.
Ruth’s always took care of the employees as much as of the guest that as the tradition
evolved in great amount of benefits that Company offers: “…excellent compensation package,
management incentive performance plan, 401(k), profit sharing, medical, dental and vision
benefits, life insurance, short-term and long-term disability benefits for management, excellent
training and leadership development program, vacation…” (Ruth’s Chris, 2012).
Great management team of the Company with President and Chief Executive Officer
Michael P. O’Donnell have valued experience in finance, leadership, investor relations,
operations, franchise and supply chain management. Each of the members has 20 and more
years of experience on executive level positions within the industry that provides Company with
powerful engine of intellectual capital (Ruth’s Chris, 2012).
Trademarks, Franchise Rights and Goodwill. Service marks of the Company
“Ruth’s Chris” and its “Ruth’s Chris Steak House, U.S. Prime & Design” logo, “Mitchell’s Fish
Market” and “Mitchell’s Steakhouse,” “Columbus Fish Market” and “Cameron’s Steakhouse,”
were registered with the United States Patent and Trademark Office and in the foreign countries
in which its restaurants operate. The Company has also registered in other foreign countries in
anticipation of new store openings within those countries. The Company believes that its

INDUSTRY ANALYSIS 31
trademarks are valuable to the operation of its restaurants and are important to its marketing
strategy (Ruth’s Hospitality Group, Inc., 2012).
Having franchise rights Ruth’s collects all the fees from development and operations as
well as monitors and provides all the technical support in training, assistance and guidance.
Trademarks, franchise rights and goodwill of the Company appeared after the big
acquisitions in 1996, 1999, 2006, 2007 and 2008; they are not subject to amortization. Annual
test for impairment is conducted and recorded in financial statements. For the fiscal year 2011
there is no impairment recorded for the Goodwill and Franchise Rights after the completed test
except the Trademark of the Mitchell’s Fish Market that was reflected on the Balance Sheet (-
$3.0 million) (Ruth’s Hospitality Group, Inc., 2012b).
Relationships. Company has a distribution arrangement with national food and
restaurant supply distributor, Distribution Market Advantage, Inc. that purchases products for
Ruth’s from various suppliers. More than 60% of beef used in the Ruth’s restaurants is bought
from one vendor - New City Packing Company. These relationships allow Company to maintain
consistent quality and obtain better price for the product when it is possible, which reduces costs
(Ruth’s Hospitality Group, Inc., 2012b).
Capabilities. Capabilities are built from resources and utilize resources as they are
exercised (Thompson et al., 2011). Capabilities of Ruth’s Hospitality Group, Inc. draw on the
consistent quality of the food, following traditions, company’s brand name as well as knowledge
of the management of the Company. Ruth’s is known for its high quality USDA Prime and
Choice grade steaks that are served in Ruth’s Chris signature fashion – “sizzling” and topped
with seasoned butter (Ruth’s Hospitality Group, Inc., 2012). Proficiency in delivering quality
INDUSTRY ANALYSIS 32
food with professional service in great atmosphere under the well-known brand name is the
capability of the Company.
Resource and Capability Analysis
In order to determine if the company’s resources and capabilities are actually potent
enough to produce a sustainable competitive advantage it is important to identify first the
competitive valuable resources and capabilities and measure their competitive power (Thompson
et al., 2011).
Ruth’s capability of “delivering quality food with professional service in great
atmosphere under the well-known brand name” is absolutely competitively valuable since it is
directly relevant to the Company’s strategy of improving profitability by focusing on the food
quality, manager’s education and brand awareness. Ruth’s has something that rivals do not and
it is its strong brand name and close relationship with vendor that provides consistent quality of
food (60% of beef comes from one Chicago based vendor, 80% of seafood comes from only two
trusted vendors) as well as long years of tradition and style. Service mark and logos of the
restaurants are registered as trademarks, which eliminate the option of coping it and using it.
Advantage in geographical coverage and reasonable pricing of the overall experience and food
are good substitutes for certain resources that contribute to the success of the Company.

INDUSTRY ANALYSIS 33
SWOT Analysis
Table 5 SWOT Analysis
Strengths Weaknesses
• Leading restaurant company in upscale segment
• Well established business with strong brand name
• International units
• Professional customer service
• High quality Food
• High price point
• High operations costs
• Limited amount of vendors might be risky
• Increasing price of beef
Opportunities Threats
• Expand internationally and nationwide
• Development of the alternatives on the menu to lower the price point
• Look for alternative vendors and make price arrangements
• Slow economic recovery
• Government regulations
• Impossible compliance with company’s policies internationally
• Increasing competition

INDUSTRY ANALYSIS 34
Strategy Analysis
Ruth’s Hospitality Group, Inc. has differentiation strategy that is oriented on the
customers with unique value proposition. By offering high quality USDA prime and Choice
grade steaks as well as high quality seafood with providing professional service Company
differentiates itself from other restaurants in the industry. Company provides many product
variations in terms of food and wine selection by focusing specifically on the quality. Ruth’s
managed to command and keep its product price, increase sales and gain the loyalty to the brand
name. Despite the downturn in the economy in the last four years, Company demonstrates a
strong positive trend in Revenue in the past five years (Ruth’s Hospitality Group, Inc., 2012b).
There are many ways to enhance the differentiation by using unique drivers. Management of the
Company strongly believes that differentiating advantage of the Company can be created
through:
• Continuous quality improvement through streamlined preparation and presentation
• Creating and adding new services like private dining, HD satellite programs
• Increasing the intensity of marketing and sales activities through
websites and social media
• As well as education and improvement of employee skills.
Unfortunately the market circumstances are not the best for the differentiating strategy
due to a few rival Restaurant Companies that pursue a similar differentiating approach
(Morton’s, Del Frisco’s, Smith & Wollensky).
There are several negative trends in the industry that affected the Company’s
profitability: economic downturn and change in customer’s preferences. As mentioned above
economic downturn provoked the decline in customer traffic and consequently decrease in sales.

INDUSTRY ANALYSIS 35
Despite the positive trend on the financial statements of the Ruth’s economy is still recovering
slowly and upscale segment of the restaurant industry is still suffering. In addition to that the
new movement of healthy eating triggered change in customer preferences.
In order to stay competitive Company chose the offensive strategy of offering new
products with the same quality but at lower price. Company came up with pre fixe menu that
allows to experience Ruth’s atmosphere while spending less money: summer celebration for two
for only $89 and three course dinner for $79. Restaurants started the promotions as soon as they
experienced decline in traffic. Participation in the nationwide program “Restaurant Week” that
offers pre fixe menu as well brought guests in the restaurants and boosted the sales. And as CEO
Michael O’Donnell mentioned it on the Earnings call for the Q4 2010 pre fixe seasonal mix
made up 30% of the restaurant sales what is huge add to total Revenue (Seeking Alpha, 2011).
Strategic move for the fiscal year 2011 was its utilization and positioning of the company
for the future pipeline development in 2012 and ’13. From the marketing standpoint CEO M.
O’Donnell emphasized the focus on targeting younger demographics through social media and
adventure-focused campaign (Seeking Alpha, 2011). And that makes absolute sense since the
population of age 20-35 is the most frequent visitor according to the report by Packaged Facts in
June 2011.

INDUSTRY ANALYSIS 36
Final Analysis
Key Areas of Concerns
In order to keep the successful and strong position in the still reviving market Ruth’s
Hospitality Group, Inc. has to address the following concerns.
• High price point. Being weakness for the Company it also a starting point to analyze
and offer an alternative in order to stay competitive. Ruth’s did a great job so far by developing
distinctive pre fix menu that attracted the customer and strengthened the brand loyalty.
Company has to be careful with the costs of food and service while offering the lower price for
the same quality.
• High operations costs. Upscale segment of the restaurant industry requires more
money and dedications in terms of running the operations and keeping the service and food
quality consistent (more qualified management team, valet service, more qualified kitchen staff).
• Risk of having only three major vendors for the whole company. Ruth’s obtains 60%
of its beef from one vendor and 80% of seafood is delivered from two major vendors and did not
have any arrangements in terms of favorable price in 2011.
• Increasing price of beef. Prices on beef increased by 12% in 2010 and drove up the
overall cost of food. Company is actively pursuing to set price arrangements for certain amount
of beef used in restaurant operations. There were none made in 2011 (Seeking Alpha, 2011).
• Impossible or troubled compliance with Company’s policies and regulations
internationally. For international expansion it is one of the major points to pay attention to
because of the strive of keeping the brand name, staying true to the traditions and maintaining
the same quality of the product as in U.S.

INDUSTRY ANALYSIS 37
• Government policies and regulations. Regulations in safe food handlings as well as
requirements of ingredients disclosure can affect the costs of operating and consequently bottom
line.
Objectives
Ruth’s Hospitality Group, Inc. maintained the momentum of increasing the brand name
awareness and attracting new demographics through its new advertising campaign, new offering
on the menu and design updates throughout the 2011.
Franchise system. Company obtained 19 franchise development commitments to open
restaurants nationwide and internationally by 2016; that will bring up to $12,0 million of income
to the company annually and increase the geographical coverage nationwide (Seeking Alpha,
2011). One of the Company’s strategies is to expand and develop the relationship with new and
existing franchisees in order to grow business (Ruth’s Hospitality Group, Inc., 2012a).
Profitability improvement. Ruth’s defined several ways of driving the sales up and
keeping the expenses under the control: creating and promoting of sustainable awareness,
leveraging the seasonality of the seafood and pre fixe menu allows balancing the price point,
focus on the social media and new marketing strategies are designed to attract more people
(Seeking Alpha, 2012)

INDUSTRY ANALYSIS 38
Conclusion
Ruth’s Hospitality Group, Inc. is a company with a very strong brand name and rich
traditions, dedicated management team and competitive capabilities. Company pursues its
strategy of differentiation since the moment the first steak house was open by Ruth Ferel in
Chicago, while growing through franchises in expansions and facing increased competition
nationwide and internationally.
Ruth’s was named throughout many listings as one of the best restaurants in U.S. and due
to operational and financial performance is one of the leading companies in the upscale segment
of the restaurant industry. But even being strong financially Ruth’s was affected by the economy
downturn heavily. Competence and knowledge of the management team demonstrated adequate
reaction and action by developing pre fixe menu, focusing on the sustainability of the business
and attracting new demographics.
Positive shift in the economy renewed interest in the upscale segment by younger crowd
and business people that increased their travel significantly. Ruth’s has been client-friendly
dining choice for long time before the flow of the expense account dollars decreased due to
economical situation. Today Company demonstrates strong earning power and strong cash flow
according to financials reported as well as ability to pay bills and invest in future expansion
(Ruth’s Hospitality Group, Inc., 2012b). Operating efficiency is weak though due to slower
assets and equity turnover.
Despite all the economical factors and strong competition Ruth’s is in a leading position
in the industry because of the capabilities and resources that company has.
INDUSTRY ANALYSIS 39
Recommendations
It takes a lot of effort, work and knowledge to maintain a leading position in the upscale
segment of the industry; Ruth’s is great example of consistency and success. Despite all power
and position on the market there is still big room for improvement.
When faced with economic downturn the company did a good job by adjusting the menu
and offering alternatives, but now when situation is turning around and it is time to pay close
attention to the demographics and their needs. For the younger people that are the most frequent
visitor at the restaurants would be good idea of developing bar/lounge concept with special
offerings of the restaurant. With increase of business travel and consequently business people
traffic Ruth’s should consider to move the restaurants closer to the guest, by that I mean to open
restaurants in new trendy hotels that attract generation Y (millenniums).
For the expansion of the business Ruth’s has to focus on the international market and
consider opening more locations in developed countries. Franchise option or joint venture could
be appropriate move in order to balance the knowledge of market and regulations of that
particular country with the experience and assets of the company as well as facilitate the resource
and risk sharing.
Since Mitchell Fish Market concept still demonstrates a negative trend in revenue the
Company needs to focus on the following concepts: focus on seasonal seafood and pre fixe
offerings, possible remodel of the restaurants and aggressive marketing, study the locations and
demographics as well as competitors for the given concept.
As noted in the conclusion Ruth’s has weak operating efficiency that could be influenced
by improving the assets and equity turnovers (boosting income strategy or decreasing the assets).
INDUSTRY ANALYSIS 40
References
Akers H. (NA). Major Segments in Restaurant Industry. Small Business. Retrieved from
http://smallbusiness.chron.com/major-segments-restaurant-industry-25986.html
American Business (March 9, 2011). Restaurant History. Retrieved from http://american-
business.org/2686-restaurant-industry.html
Bloomberg BusinessWeek. (April 25, 2012). Company Overview of Del Frisco's Restaurant
Group,LLC. Retrieved April 25, 2012 from
http://investing.businessweek.com/research/stocks/private/snapshot.asp?privcapId=38439
844
Ching-Chan Cheng, Cheng-Ta Chen, Fu-Sung Hsu, Hsiu-Yuan Hu (2012). Enhancing service
quality improvement strategies of fine-dining restaurants: New insights from integrating a
two-phase decision-making model of IPGA and DEMATEL analysis. International
Journal of Hospitality Management.
Del Frisco’s Restaurant Group, LLC (2012a). Company overview. Retrieved April 25, 2012
from http://delfriscos.com/about_us.php
Del Frisco’s Restaurant Group, LLC (2012b). Form S -1. Del Frisco’s Restaurant Group, LLC.
Retrieved April 25, 2012 from
http://www.nasdaq.com/markets/ipos/filing.ashx?filingid=7977000
Duff & Phelps (2011). Restaurant Industry. Industry Insights. Retrieved from
http://www.duffandphelps.com/sitecollectiondocuments/reports/2011_ib_restaurant_indu
stry_insights.pdf
Fundinguniverse (2012a). Company Histories and Profiles. Ruth Chris Steak House. Retrieved
April 14, 2012 from
INDUSTRY ANALYSIS 41
http://www.fundinguniverse.com/company-histories/Ruths-Chris-Steak-House-company-
History.html
Fundinguniverse, (2012b). Company Histories and Profiles. Morton’s Rstaurant Group, Inc.
Retrieved April 14, 2012 from http://www.fundinguniverse.com/company-
histories/Mortons-Restaurant-Group-Inc-Company-History.html
Fundinguniverse, (2012c). Company Histories and Profiles. Il Fornaio (America) Corporation.
Retrieved April 14, 2012 from http://www.fundinguniverse.com/company-histories/Il-
Fornaio-America-Corporation-Company-History.html
Hoovers (2012a). Upscale restaurants. Overview. Retrieved from
http://www.hoovers.com/industry/upscale-restaurants/1446-1.html
Hoovers (2012b). Il Fornaio (America) Corporation. Overview. Retrieved from
http://www.hoovers.com/company/Il_Fornaio_(America)_Corporation/htthri-1.html
Hoovers (2012c). Del Frisco’s Restaurant Group LLC. Overview. Retrieved from
http://www.hoovers.com/company/Del_Friscos_Restaurant_Group_LLC/rhscfxi-1.html
IBISWorld, (2011a). Per Capita Disposable Income -IBISWorld Business Environment Report.
Retrieved from IBISWorld database.
IBISWorld, (2011b). Healthy Eating Index.-IBISWorld Business Environment Report. Retrieved
from IBISWorld database.
IBISWorld, (2011c). Consumer Spending. -IBISWorld Business Environment Report. Retrieved
from IBISWorld database.
IBISWorld, (2011d). Households earning over $100,000 in the US -IBISWorld Business
Environment Report. Retrieved from IBISWorld database.

INDUSTRY ANALYSIS 42
IBISWorl (2011e). Restaurants will offer healthy foods to survive in a competitive market. -
IBISWorld Business Environment Report Retrieved from IBISWorld database.
IBISWorld, (2011f). Chain Restaurants in U.S. Industry.- IBISWorld Business Environment
Report Retrieved from IBISWorld database.
Il Fornario. (2012a). Company overview. Our Story. Retrieved April 25, 2012 from
http://www.ilfornaio.com/page20.htm
Inc.com (2012). 5 Best Places for Business Dinner. Retrieved April 30, 2012 from
http://www.inc.com/ss/5-best-restaurants-business-dinner#4
Martell N. (September, 2011). Raising the Steaks. Restaurant Management Magazine. Retrieved
form http://www.rmgtmagazine.com/food-beverage/raising-steaks
Morton’s, (2012). Privacy Policy. Retrieved from http://www.mortons.com/privacy.php
National Restaurant Association. (2012a). Facts at a Glance. Retrieved April 4 2012 from
http://www.restaurant.org/research/facts/
National Restaurant Association (2012b). Press Room. Retrieved April 9, 2012 from
http://www.restaurant.org/pressroom/pressrelease/?id=2039
National Restaurant Association (2012c). Public Policy Issue Briefs. Retrieved April 28, 2012
from http://www.restaurant.org/advocacy/issues/issue/?Issue=depreciation
Packaged Facts (February, 2012). Market Research. The Foodservice Landscape in the U.S.:
Restaurant Industry and Consumer Trends, 2nd Edition
PR Newswire, ( December 16,2011). Fertitta acquires Morton’s. Retrieved from
http://www.prnewswire.com/news-releases/fertitta-signs-agreement-to-acquire-mortons-
restaurant-group-at-690-per-share-135723373.html

INDUSTRY ANALYSIS 43
Restaurant Industry Trends (2012). Snapshot. Retrieved from
http://www.restaurantindustrytrends.com/snapshots.html
Restaurant Owner (2012). Industry Survey: How Much Does it Cost to Open a Restaurant?
Retrieved April 28, 2012 from http://www.restaurantowner.com/public/811.cfm
Rmgt (2012). The Fine-Dining Power List. Restaurant Management Magazine. Retrieved form
http://www.rmgtmagazine.com/content/fine-dining-power-list
Robin L. A. (02 May, 2012). "Upscale steak chains primed for growth". Nation's Restaurant
News. FindArticles.com.
Ruth’s Chris (2012). Company Overview. Careers. Retrieved April 29,2012 form
http://www.ruthschris.com/Careers
Ruth’s Hospitality Group, Inc. (2010a). About Ruth’s Hospitality Group, Inc. Retrieved April 20,
2012 from http://www.rhgi.com/about-overview.html
Ruth’s Hospitality Group, Inc. (2012a). Annual financials of the Ruth’s Hospitality Group, Inc.
Retrieved from http://www.marketwatch.com/investing/Stock/RUTH/financials
Ruth’s Hospitality Group, Inc. (2012b). 2011 Summary Annual Report.
Seeking Alpha (February 18, 2011). Ruth's Hospitality Group's CEO Discusses Q4 2010 Results
- Earnings Call Transcript. Retrieved from http://seekingalpha.com/article/253757-ruth-s-
hospitality-group-s-ceo-discusses-q4-2010-results-earnings-call-transcript
Thompson A.A., Peteraf M.A., Gamble J.E., and Strickland (2011).Crafting and Executing
Strategy: The Quest for Competitive Advantage, Concepts and Cases, 18th edition.
McGraw-Hill. New York, NY, 2012.

INDUSTRY ANALYSIS 44
Woellert L. (April 27, 2012). Consumer Sentiment in U.S. Climbs to Highest Level in Year.
Bloomberg. Retrieved from lhttp://www.bloomberg.com/news/2012-04-27/u-s-michigan-
consumer-sentiment-increased-to-76-4-in-april.html
20: TRENDS IN FINE DINING. (2011). Restaurant, Food & Beverage Market Research
Handbook, 102-104.
26: TRENDS IN FINE DINING. (2011). Restaurant, Food & Beverage Market Research
Handbook, 132-138.

INDUSTRY ANALYSIS 45
Appendix A
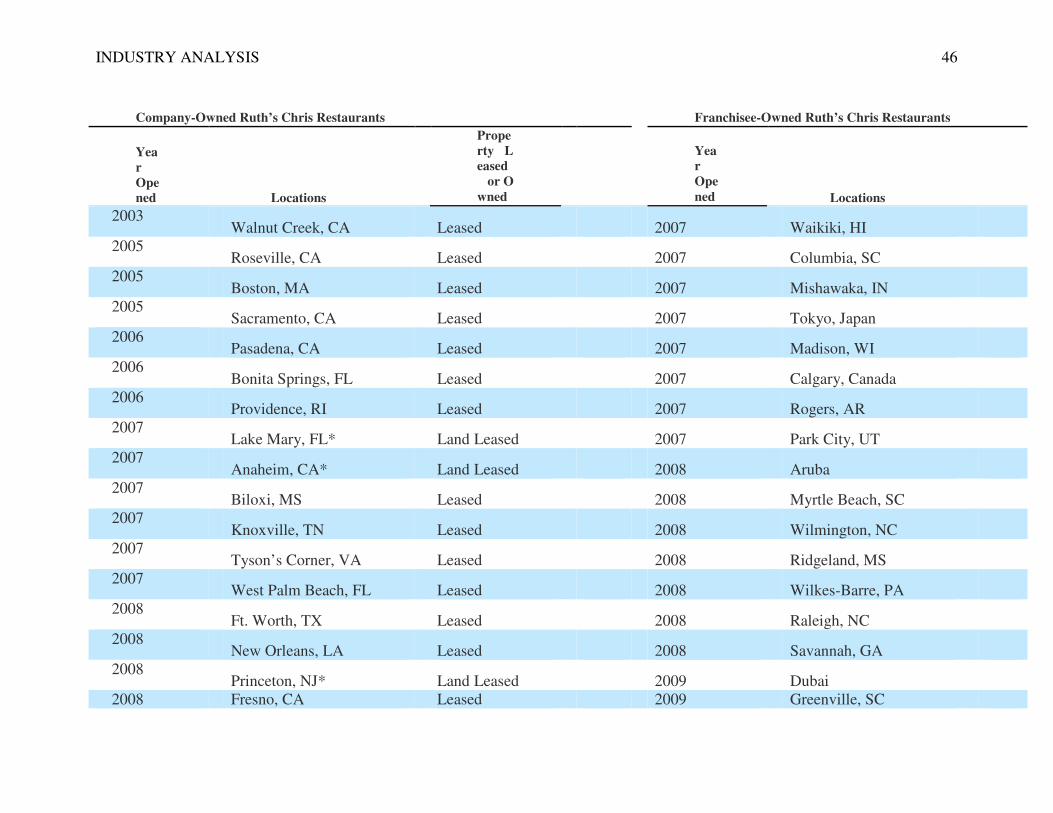
INDUSTRY ANALYSIS 46
Company-Owned Ruth’s Chris Restaurants
Franchisee-Owned Ruth’s Chris Restaurants
Year�Opened
Locations
Property�Leased�or Owned
Year�Opened
Locations
2003
Walnut Creek, CA
Leased
2007
Waikiki, HI
2005
Roseville, CA
Leased
2007
Columbia, SC
2005
Boston, MA
Leased
2007
Mishawaka, IN
2005
Sacramento, CA
Leased
2007
Tokyo, Japan
2006
Pasadena, CA
Leased
2007
Madison, WI
2006
Bonita Springs, FL
Leased
2007
Calgary, Canada
2006
Providence, RI
Leased
2007
Rogers, AR
2007
Lake Mary, FL*
Land Leased
2007
Park City, UT
2007
Anaheim, CA*
Land Leased
2008
Aruba
2007
Biloxi, MS
Leased
2008
Myrtle Beach, SC
2007
Knoxville, TN
Leased
2008
Wilmington, NC
2007
Tyson’s Corner, VA
Leased
2008
Ridgeland, MS
2007
West Palm Beach, FL
Leased
2008
Wilkes-Barre, PA
2008
Ft. Worth, TX
Leased
2008
Raleigh, NC
2008
New Orleans, LA
Leased
2008
Savannah, GA
2008
Princeton, NJ*
Land Leased
2009
Dubai
2008 Fresno, CA Leased 2009 Greenville, SC

INDUSTRY ANALYSIS 47
2008
South Barrington, IL*
Land Leased
2009
St. Louis, MO
2011
Portland, OR
Leased
2009
Durham, NC
2009
Kennesaw, GA
2009
Carolina, Puerto Rico
2010
Salt Lake City, UT
2011
Grand Rapids, MI
2011
Asheville, NC
Company-Owned Mitchell’s Fish Market Restaurants
Company-Owned Cameron’s Steakhouse Restaurants
Year�Opened
Locations
Property�Leased�or Owned
Year�Opened
Locations
Property�Leased�or Owned
2008
Grandview, OH
Leased
2008
Columbus, OH
Leased 2008
Crosswoods, OH
Leased
2008
Birmingham, MI
Leased 2008
Pittsburgh, PA
Leased
2008
Polaris, OH
Leased 2008
Newport, KY
Leased
2008
Louisville, KY
Leased
2008
Lansing, MI
Leased
2008
Birmingham, MI
Leased
2008
Cleveland, OH
Leased

INDUSTRY ANALYSIS 48
2008
West Chester, OH
Leased
2008
Carmel, IN
Leased
2008
Livonia, MI
Leased
2008
Pittsburgh, PA
Leased
2008
Tampa, FL
Leased
2008
Rochester Hills, MI
Leased
2008
Brookfield, WI
Leased
2008
Sandestin, FL
Leased
2008
Jacksonville, FL
Leased
2008
Stamford, CT
Leased
2010
Winter Park, FL
Leased
* The Company owns the building and leases the land pursuant to a long-term ground lease.
17