Embed Size (px)
Citation preview

HAL Id: hal-02401417https://hal.univ-lorraine.fr/hal-02401417
Submitted on 10 Dec 2019
HAL is a multi-disciplinary open accessarchive for the deposit and dissemination of sci-entific research documents, whether they are pub-lished or not. The documents may come fromteaching and research institutions in France orabroad, or from public or private research centers.
L’archive ouverte pluridisciplinaire HAL, estdestinée au dépôt et à la diffusion de documentsscientifiques de niveau recherche, publiés ou non,émanant des établissements d’enseignement et derecherche français ou étrangers, des laboratoirespublics ou privés.
Analysis of the tensile behavior of a TWIP steel basedon the texture and microstructure evolutions
David Barbier, Nathalie Gey, Sébastien Allain, Nathalie Bozzolo, MichelHumbert
To cite this version:David Barbier, Nathalie Gey, Sébastien Allain, Nathalie Bozzolo, Michel Humbert. Analysis of thetensile behavior of a TWIP steel based on the texture and microstructure evolutions. MaterialsScience and Engineering: A, Elsevier, 2009, 500 (1-2), pp.196 - 206. �10.1016/j.msea.2008.09.031�.�hal-02401417�

Analysis of the tensile behavior of a TWIP steel based on the textureand microstructure evolutions
D. Barbiera,b, N. Geya,∗, S. Allainc, N. Bozzoloa, M. Humberta
a Laboratoire d’Etude des Textures et Application aux Matériaux (LETAM), UMR CNRS 7078, Université Paul Verlaine-Metz, 57000 Metz, Franceb Laboratoire de Physique et Mécanique des Matériaux (LPMM), UMR CNRS 7554, Université Paul Verlaine-Metz, 57000 Metz, Francec ArcelorMittal Research SA, Voie Romaine, BP 30320, 57283 Maizières-les-Metz, France
a r t i c l e i n f oKeywords: Austenitic steel TWIP effect Tension testEBSDDeformation texture
a b s t r a c t
The texture and microstructure evolutions of a fine-grained TWIP steel subjected to tensile tests at roomtemperature were investigated in relation to the mechanical behavior. This steel combines both high duc-tility and strength owing to the TWIP effect. Also the steel exhibits a high strain hardening rate that evolvesaccording to five stages, which are related to the microstructure and texture evolutions and characteristics.The formation of nano-twins in the initial stage of deformation leads to an increase in strain hardening
rate. The development of the pronounced <1 1 1> fiber in the tensile direction sustains mechanical twin-ning and maintains the strain hardening rate on a high level. The resulting microstructure exhibits severaltypes of twin configurations and sub-boundaries with high misorientations due to intense activities ofdislocation glide. The twin volume fraction was estimated to be 9% at the final stage of tensile defor-mation. The new orientations generated by mechanical twinning do not change considerably the final1
mTtamcdimeorrdat
ha
aCppitnttc[TBFt
ih
texture.
. Introduction
Since few years, the ongoing research of the steel industryainly focuses on high strength steels with excellent formability.
his optimal combination is particularly attractive for automo-ive applications such as structural reinforcements and energybsorption parts. The increase in strength enables to reduce theass of the car bodies whereas the increase in ductility admits
omplex component design. Among the wide variety of recentlyeveloped steels, high manganese austenitic steels with low stack-
ng fault energy (SFE) are particularly promising, especially whenechanical twinning occurs [1,2]. Outstanding mechanical prop-
rties combining a high ductility and high strength are thenbtained. This compromise often observed in low SFE fcc mate-ials results from a high strain hardening rate. Asgari et al. [3]eported the evolutions of the strain hardening rate according toifferent stages independent of the grain size in low SFE materialsnd analyzed each stage in relation to the microstructure evolu-
ion.In Fe–Mn–C austenitic steels, mechanisms responsible for theigh strain hardening rate are still under discussion [4–6]. Someuthors attribute the high strain hardening rate to dynamic strain
∗ Corresponding author. Tel.: +33 387315385; fax: +33 387315377.E-mail address: [email protected] (N. Gey).
rgdg[r[s
ging (DSA) mechanisms, interpreted as the interaction between–Mn bonds and mobile dislocations [4,7,8]. Bracke et al. [9] sup-ressed the DSA in a Fe–22Mn–0.6C (composition given in massercent) steels by substituting carbon by nitrogen, while keep-
ng the SFE constant. The resultant mechanical properties werehe same. Mechanical twinning can also be a dominant mecha-ism to increase the strain hardening rate. As the strain increases,he occurrence of twins reduces the mean free path of disloca-ions. This is called TWinning Induced Plasticity (TWIP) effect thatan be interpreted as a dynamical Hall-Petch effect [10–14]. Allain13,14] suggested that the high strain hardening rate of Fe–Mn–CWIP steels is mainly due to mechanical twinning. More recently,ouaziz et al. [15] have shown that the strain hardening rate in thee–22Mn–0.6C steel is mainly of kinematical origin which is linkedo the TWIP effect.
Only few studies are related to the microstructure evolution dur-ng the deformation of Fe–Mn–C TWIP steels. The microstructureas been characterized either by optical microscopy (low spatialesolution) or by transmission electron microscopy investigationsiving accurate local data but which are insufficient for statisticaleductions [13,16]. These studies have shown that the austenite
rains contain bundles of nano-twins with different configurations10–13]. Up to now, few attention has been addressed to the cor-esponding texture evolution and its interaction with twinning16,17]. These parameters are the key to better understand the hightrain hardening rate of TWIP steels.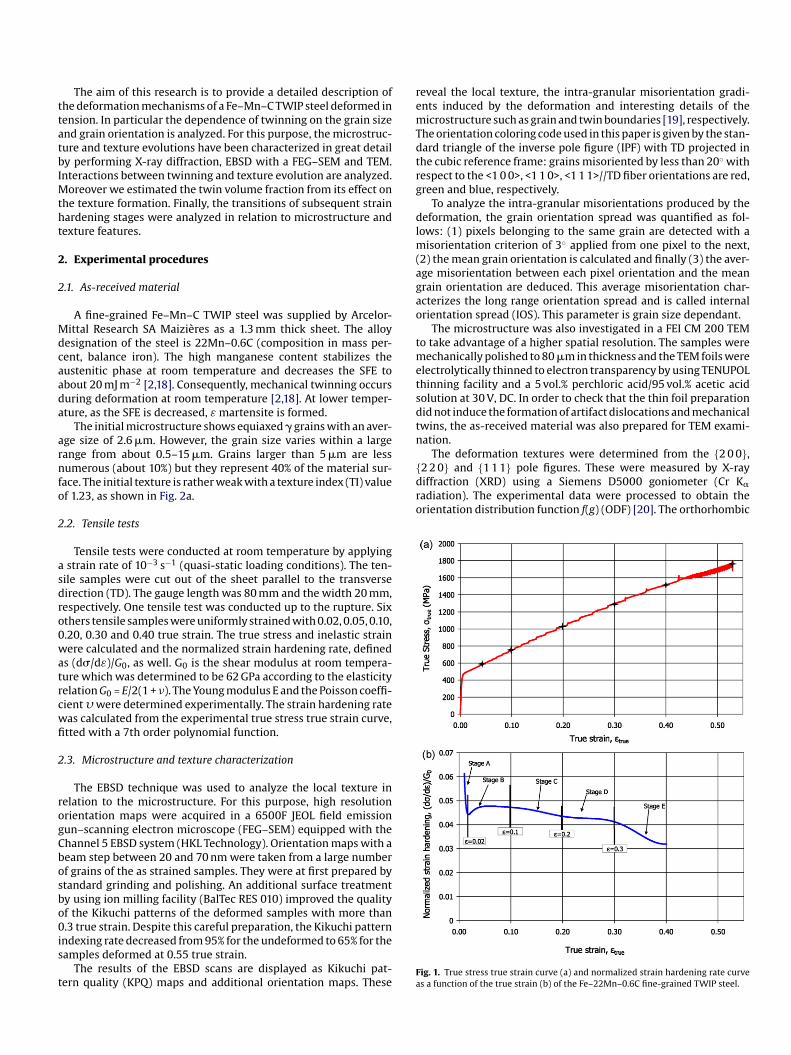
ttatbIMtht
2
2
Mdcaada
arnfo
2
asdro0watrcwfi
2
rogCbosbo0is
t
remTdtrg
dlm(agao
tmetsdtn
The deformation textures were determined from the {2 0 0},{2 2 0} and {1 1 1} pole figures. These were measured by X-raydiffraction (XRD) using a Siemens D5000 goniometer (Cr K�
radiation). The experimental data were processed to obtain theorientation distribution function f(g) (ODF) [20]. The orthorhombic
The aim of this research is to provide a detailed description ofhe deformation mechanisms of a Fe–Mn–C TWIP steel deformed inension. In particular the dependence of twinning on the grain sizend grain orientation is analyzed. For this purpose, the microstruc-ure and texture evolutions have been characterized in great detaily performing X-ray diffraction, EBSD with a FEG–SEM and TEM.nteractions between twinning and texture evolution are analyzed.
oreover we estimated the twin volume fraction from its effect onhe texture formation. Finally, the transitions of subsequent strainardening stages were analyzed in relation to microstructure andexture features.
. Experimental procedures
.1. As-received material
A fine-grained Fe–Mn–C TWIP steel was supplied by Arcelor-ittal Research SA Maizières as a 1.3 mm thick sheet. The alloy
esignation of the steel is 22Mn–0.6C (composition in mass per-ent, balance iron). The high manganese content stabilizes theustenitic phase at room temperature and decreases the SFE tobout 20 mJ m−2 [2,18]. Consequently, mechanical twinning occursuring deformation at room temperature [2,18]. At lower temper-ture, as the SFE is decreased, ε martensite is formed.
The initial microstructure shows equiaxed � grains with an aver-ge size of 2.6 �m. However, the grain size varies within a largeange from about 0.5–15 �m. Grains larger than 5 �m are lessumerous (about 10%) but they represent 40% of the material sur-
ace. The initial texture is rather weak with a texture index (TI) valuef 1.23, as shown in Fig. 2a.
.2. Tensile tests
Tensile tests were conducted at room temperature by applyingstrain rate of 10−3 s−1 (quasi-static loading conditions). The ten-
ile samples were cut out of the sheet parallel to the transverseirection (TD). The gauge length was 80 mm and the width 20 mm,espectively. One tensile test was conducted up to the rupture. Sixthers tensile samples were uniformly strained with 0.02, 0.05, 0.10,.20, 0.30 and 0.40 true strain. The true stress and inelastic strainere calculated and the normalized strain hardening rate, defined
s (d�/dε)/G0, as well. G0 is the shear modulus at room tempera-ure which was determined to be 62 GPa according to the elasticityelation G0 = E/2(1 + �). The Young modulus E and the Poisson coeffi-ient � were determined experimentally. The strain hardening rateas calculated from the experimental true stress true strain curve,tted with a 7th order polynomial function.
.3. Microstructure and texture characterization
The EBSD technique was used to analyze the local texture inelation to the microstructure. For this purpose, high resolutionrientation maps were acquired in a 6500F JEOL field emissionun–scanning electron microscope (FEG–SEM) equipped with thehannel 5 EBSD system (HKL Technology). Orientation maps with aeam step between 20 and 70 nm were taken from a large numberf grains of the as strained samples. They were at first prepared bytandard grinding and polishing. An additional surface treatmenty using ion milling facility (BalTec RES 010) improved the qualityf the Kikuchi patterns of the deformed samples with more than
.3 true strain. Despite this careful preparation, the Kikuchi patternndexing rate decreased from 95% for the undeformed to 65% for theamples deformed at 0.55 true strain.
The results of the EBSD scans are displayed as Kikuchi pat-ern quality (KPQ) maps and additional orientation maps. These
Fa
eveal the local texture, the intra-granular misorientation gradi-nts induced by the deformation and interesting details of theicrostructure such as grain and twin boundaries [19], respectively.
he orientation coloring code used in this paper is given by the stan-ard triangle of the inverse pole figure (IPF) with TD projected inhe cubic reference frame: grains misoriented by less than 20◦ withespect to the <1 0 0>, <1 1 0>, <1 1 1>//TD fiber orientations are red,reen and blue, respectively.
To analyze the intra-granular misorientations produced by theeformation, the grain orientation spread was quantified as fol-
ows: (1) pixels belonging to the same grain are detected with aisorientation criterion of 3◦ applied from one pixel to the next,
2) the mean grain orientation is calculated and finally (3) the aver-ge misorientation between each pixel orientation and the meanrain orientation are deduced. This average misorientation char-cterizes the long range orientation spread and is called internalrientation spread (IOS). This parameter is grain size dependant.
The microstructure was also investigated in a FEI CM 200 TEMo take advantage of a higher spatial resolution. The samples were
echanically polished to 80 �m in thickness and the TEM foils werelectrolytically thinned to electron transparency by using TENUPOLhinning facility and a 5 vol.% perchloric acid/95 vol.% acetic acidolution at 30 V, DC. In order to check that the thin foil preparationid not induce the formation of artifact dislocations and mechanicalwins, the as-received material was also prepared for TEM exami-ation.
ig. 1. True stress true strain curve (a) and normalized strain hardening rate curves a function of the true strain (b) of the Fe–22Mn–0.6C fine-grained TWIP steel.

differ
sfdtt
{pte1ftse
3
3
c
ttsatcafiowmeml
du
Fig. 2. {1 0 0} and {1 1 1} pole figures and ϕ2 = 45◦ ODF section at
ymmetry, clearly displayed by the pole figures, was imposedor the calculation of the ODF. The TI defined as TI =
∮f (g)2dg
escribes quantitatively the texture sharpness. In this paper, theexture is represented by the {1 0 0} and {1 1 1} pole figures andhe ϕ2 = 45◦ ODF section in the Euler space.
The main texture components are described according to thekhl}<uvw> notation ({khl} being the plane parallel to the rollinglane and <uvw> being the direction parallel to the rolling direc-ion at 90◦ from the tensile direction. The volume fraction ofach texture component was calculated by taking a tolerance of0◦ around the strict orientation into account. The largest Schmidactors (SF) for slip and for twinning were calculated for each tex-ure component as presented in Table 1. The {1 1 1}<1 1 0> slipystems and the {1 1 1}<1 1 2> twinning systems were consid-red.
. Results
.1. Mechanical behavior
The Fe–Mn–C steel exhibits outstanding mechanical propertiesombining high ductility and extraordinary strength. The ultimate
idAld
ent true strain levels: as-received (a), 0.2 (b), 0.3 (c) and 0.55 (d).
ensile strength amounts to 1000 MPa and more and the elonga-ion to rupture is over 70%. The true stress and the normalizedtrain hardening rate are plotted versus the true strain in Fig. 1and b, respectively. Markers indicating each interrupted tensileests are attached on both curves. Serrations on the stress-strainurve were observed. These are increasing at large deformationnd consequently the calculation of the strain hardening rate coef-cient is limited at 0.40 true strain. The occurrence of serrationsn true stress-strain curves of high manganese austenitic steels isell known. They have been interpreted as dynamic strain agingechanism or as ‘Portevin-Le Chatelier’ effect [4,5]. However, the
xact nature of the DSA in austenitic steels, i.e. interaction betweenobile dislocations and carbon atoms, is not well defined in the
iterature and is still under discussion [4–6].A remarkably high strain hardening rate was observed and is
isplayed in Fig. 1b. The amount of (d�/dε)/G0 is greater than 0.04p to 0.3 true strain. During the deformation, the strain harden-
ng rate evolves according to different stages. After a pronouncedecrease up to (d�/dε)/G0 = 0.045, from 0 to 0.02 true strain (stage), the strain hardening rate increases to reach the first constant
evel ((d�/dε)/G0 = 0.048) at 0.1 true strain (stage B). Then, it slightlyecreases (stage C) and reaches the second constant stage at 0.2 true

Table 1Main texture components: {hkl}<uvw> notation, Euler angles in the ϕ2 = 45◦ section (Bunge convention [20]), corresponding fiber to which they belong, color in the transversedirection inverse pole figure TD-IPF triangle, corresponding material state, maximal value of the Schmid factor calculated for the {1 1 0}<1 1 1> slip systems and {1 1 1}<1 1 2>twinning systems.
Symbol Texture components {hkl}<uvw> Euler angles Fiber Color in the TD-IPF triangle Material state Schmid’s factor
Slip Twinning
Goss {110}<001> 90/90/45 <110>//DT Green As-received 0.41 0.47
Copper {112}<111> 90/35.26/45 <110>//DT Green As-received 0.41 0.47
Brass {110}<112> 55/90/45 <111>//DT Blue Deformed 0.27 0.31
Rotated copper {112}<110> 0/35.26/45 <111>//DT Blue Deformed 0.27 0.31
>//DT
>//DT
soEha
3
tb{tpmpdt
fctvoItGtT
F
tc
adGdtTr
Ttmitfipvolume fraction in green in Fig. 4).
At 0.3 true strain, the deformation texture is almost fullydeveloped. Beyond this deformation, the TI increases slowly.However, the brass and rotated copper components continue tostrengthen, as it can be seen on Fig. 2d. Moreover, new orientations
Rotated Goss {110}<110> 0/90/45 <100
Cube {001}<100> 45/0/45 <100
train ((d�/dε)/G0 = 0.043) up to 0.3 true strain (stage D). Finally,ver 0.3 true strain, the strain hardening rate decreases again (stage) up to the specimen rupture. This sustained high level of strainardening rate, observed up to large strains, confers high strengthnd ductility to this fine-grained Fe–Mn–C TWIP steel.
.2. Texture evolution
Tensile deformation along the prior sheet transverse direc-ion TD leads to the formation of a sharp texture characterizedy four distinct texture components: the {1 1 0}<1 1 2> brass, the1 1 2}<1 1 0> rotated copper, the {1 1 0}<1 1 0> rotated Goss andhe {0 0 1}<1 0 0> cube. Fig. 2a–d shows the {1 0 0} and {1 1 1}ole figures and the ϕ2 = 45◦ ODF sections for the as-receivedaterial – as cold rolled and recrystallized – and for the sam-
les deformed at 0.2, 0.3 and 0.55 true strain. The horizontalirection of the pole figures corresponds to the tensile direc-ion.
At 0.55 true strain, the highest orientation densities are reachedor the brass component (maximal value of 15) and for the rotatedopper component (maximal value of 7.6). The rotated Goss andhe cube components are weaker with respectively maximum ODFalues of 1.8 and 2.3. On the pole figures, a pronounced densityf <1 1 1> poles and a lower density of <1 0 0> poles are observed.
n fact, the major brass and rotated copper components belong tohe pronounced <1 1 1>//TD fiber orientation and the minor rotatedoss and cube components to the weak <1 0 0>//TD fiber orienta-ion. The main texture components presented in Fig. 2 are listed inable 1.
ig. 3. Evolution of the texture index TI = �f(g)2dg as a function of the true strain.
FiO
Red Deformed 0.41 0.23
Red Deformed 0.41 0.23
This texture sharpens stepwise as underlined by the evolution ofhe texture index TI (Fig. 3) and the volume fraction of each textureomponent (Fig. 4).
Up to 0.2 true strain, the texture remains very weak. The TI isbout 1.5. However, the texture components change significantlyuring this deformation step. The ODF maximum shifts from theoss position (90◦, 90◦, 45◦) to the brass position (55◦, 90◦, 45◦). Theeformation components progressively increase at the expense ofhe initial Goss and copper components of the as-received material.he volume fraction of grains with brass orientation (8% in the as-eceived material) enlarges with increasing the deformation.
From 0.2 to 0.3 true strain, the texture significantly sharpens.he TI increases from 1.5 to about 3. In this range of deformation,he development of the texture components induced by the defor-
ation is very strong. The increase of the <1 1 1>//TD fiber is verymportant in comparison to the one of the <1 0 0>//TD fiber. At 0.3rue strain, 45 vol.% of the grains are oriented close to <1 1 1>//TDber and only 10 vol.% are close to <1 0 0>//TD fiber (Fig. 4). Cop-er and Goss components progressively disappear (corresponding
ig. 4. Evolution of the volume fraction of the main texture components (consider-ng 10◦ of tolerance) as a function of the true strain. The data are calculated from theDF.
F b, e, fs e grair of theo
at
3
3
am
tortta
tzhetFrcdts
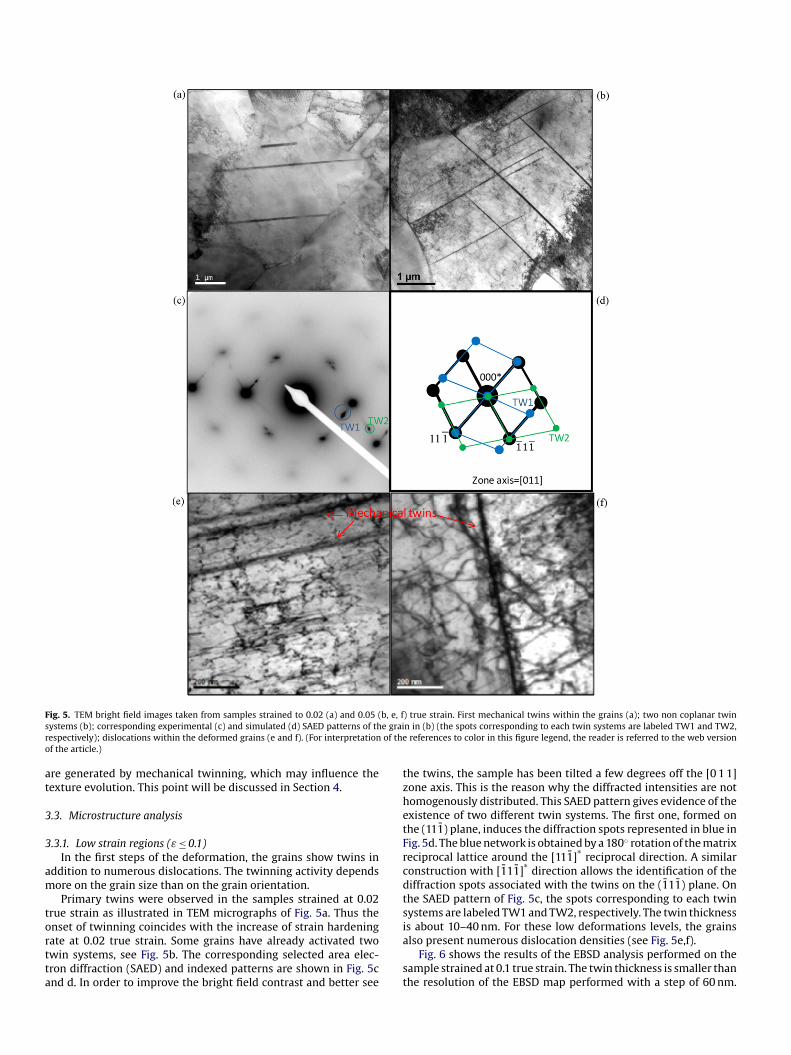
ig. 5. TEM bright field images taken from samples strained to 0.02 (a) and 0.05 (ystems (b); corresponding experimental (c) and simulated (d) SAED patterns of thespectively); dislocations within the deformed grains (e and f). (For interpretationf the article.)
re generated by mechanical twinning, which may influence theexture evolution. This point will be discussed in Section 4.
.3. Microstructure analysis
.3.1. Low strain regions (ε ≤ 0.1)In the first steps of the deformation, the grains show twins in
ddition to numerous dislocations. The twinning activity dependsore on the grain size than on the grain orientation.Primary twins were observed in the samples strained at 0.02
rue strain as illustrated in TEM micrographs of Fig. 5a. Thus the
nset of twinning coincides with the increase of strain hardeningate at 0.02 true strain. Some grains have already activated twowin systems, see Fig. 5b. The corresponding selected area elec-ron diffraction (SAED) and indexed patterns are shown in Fig. 5cnd d. In order to improve the bright field contrast and better seeia
st
) true strain. First mechanical twins within the grains (a); two non coplanar twinn in (b) (the spots corresponding to each twin systems are labeled TW1 and TW2,
references to color in this figure legend, the reader is referred to the web version
he twins, the sample has been tilted a few degrees off the [0 1 1]one axis. This is the reason why the diffracted intensities are notomogenously distributed. This SAED pattern gives evidence of thexistence of two different twin systems. The first one, formed onhe (111̄) plane, induces the diffraction spots represented in blue inig. 5d. The blue network is obtained by a 180◦ rotation of the matrixeciprocal lattice around the [111̄]
∗reciprocal direction. A similar
onstruction with [1̄11̄]∗
direction allows the identification of theiffraction spots associated with the twins on the (1̄11̄) plane. Onhe SAED pattern of Fig. 5c, the spots corresponding to each twinystems are labeled TW1 and TW2, respectively. The twin thickness
s about 10–40 nm. For these low deformations levels, the grainslso present numerous dislocation densities (see Fig. 5e,f).Fig. 6 shows the results of the EBSD analysis performed on theample strained at 0.1 true strain. The twin thickness is smaller thanhe resolution of the EBSD map performed with a step of 60 nm.

TD-IPF map (b). Misorientation profile along the black line of figure (a) (c).
Typclt
taattiaias<Fg
taogFrbmwg
3
nmcm
Fig. 6. EBSD maps of sample strained to 0.1 true strain. KPQ map (a).
heir orientations cannot be measured by automated EBSD anal-sis. However, the Kikuchi pattern quality (KPQ) map reveals theresence of straight dark lines within some grains in Fig. 6a. Wehecked that these low KPQ values are due to two patterns over-apping (twin and matrix). Thus, these lines reveal the deformationwins. Half of the grains present one visible twinning system.
The TD inverse pole figure map of Fig. 6b confirms the weakexture previously observed in Fig. 2. The activated strain mech-nisms and the related grain rotations depend on the grain sizend its initial orientation. For example, the larger grains close tohe Goss and copper orientations, in green in Fig. 6b, preferen-ially activate twins. These grains, which were already observedn the as-received material, are indeed well oriented for twinningccording to the Schmid factor as depicted in Table 1. With increas-ng strain, these grains rotate towards the deformation componentsnd finally the Goss and copper components disappear at 0.3 truetrain as displayed in Fig. 4. The orientations corresponding to the1 1 1>//TD and <1 0 0>//TD fibers (blue and red colored grains onig. 6b, respectively), appear during deformation by dislocationlides. In addition, twins are also observed in these larger grains.
The intra-granular misorientations resulting from the deforma-ion were analyzed. At 0.1 true strain, about 10% of the grains haven internal orientation spread larger than 5◦. The cumulative mis-rientation profile along a line has also been drawn for differentrains. Fig. 6c presents the profile along the thick black line inig. 6b. Over a distance of 4 �m, the cumulated misorientationeaches 12◦ (up to 20◦ in some grains). However, the misorientationetween adjacent pixels does not exceed 1◦. Such intra-granularisorientations are associated to the formation of dislocationshich assure the plastic strain compatibility between neighboring
rains and accommodate the deformation gradients [21,22].
.3.2. Medium strain regions (0.1 ≤ ε ≤ 0.3)
Between 0.2 and 0.3 true strain significant changes in the twin-ing activity are observed along with the texture evolution. Theain microstructural features are the formation of different twin
onfigurations with the occurrence of secondary twin systems inost of the grains, the strong interaction between grain orientation
Fig. 7. EBSD maps of a strained sample to 0.3 true strain. KPQ map (a). TD-IPF map(b).

ent tw
ab
iaEsotdtt
oEotstf
tttiaGm
v(
bgwotdttgiaitahl
3
s
Fig. 8. KPQ maps of specific grains highlighting differ
nd twinning activity and the development of high misorientationoundaries within the grains.
TEM analysis shows that twins are organized in bundles. Withncreasing deformation, the number of twins in bundles increasesnd the twin thickness remains constant. Fig. 7 presents a typicalBSD map of a sample strained at 0.3 true strain. As the twin den-ity in each bundle has increased, it is possible to measure the twinrientations by automated EBSD analysis. In fact, the twin orienta-ion becomes major in the probed volume. But the twin thicknesseduced by EBSD is overestimated. The austenitic matrix betweenhe twins cannot be differentiated. The maximum thickness of thewin bundles is about 250 nm.
In this range of deformation, the number of grains with a sec-ndary twinning system significantly increases, as shown in theBSD KPQ maps. Fig. 8 illustrates the three main configurationsbserved in a sample deformed at 0.2 true strain. In grain A, thewinning systems were simultaneously activated. In grain B, twoystems were activated in different regions of the grain. In grain C,hey were sequentially activated. Similar twin configurations wereound in a sheet having an average grain size of 20 �m [13].
The texture evolution and its strengthening around the mainexture components, described in Section 3.2, is clearly revealed byhe TD-IPF map in Fig. 7b. The majority of grains are blue indicating
hat they are misoriented by less than 20◦ from the <1 1 1>//TD fiberncluding the brass and rotated copper components. A strong inter-ction between grain orientation and twinning activity is observed.rains from the <1 1 1>//TD fiber exhibit a higher fraction of defor-ation twins than grains belonging to the <1 0 0>//TD fiber. A smallltats
in configurations—sample strained to 0.2 true strain.
olume fraction of grains exhibits the copper and Goss components<1 1 0>//TD fiber) and has a well developed twin microstructure.
Another feature is the development of medium to high angleoundaries within some deformed grains. This is illustrated by thereen/blue colored grain in Fig. 9 (after 0.3 true strain, marked by ahite star in Fig. 7). The KPQ map of Fig. 9a reveals the development
f sub-boundaries within the grain. The misorientation acrosshese sub-boundaries is about 10◦. The sub-boundaries seem toelimit different twin bundles as shown in Fig. 9b. This leads tohe grain fragmentation. The sub-grains gradually rotate towardshe deformation components and could be considered as newrains after a certain amount of deformation. The decrease in thendexing rate to 75–80% is caused by the strong lattice distortionsnd the increase of the boundaries density and broadening. Thentra-granular misorientations are also increasing. About 50% ofhe grains have an IOS greater than 5◦ (most of these grains haven IOS between 5◦ and 10◦). This IOS is due to the formation ofighly misoriented sub-boundaries and to the dislocation densities
eading to the elastic lattice distortion.
.3.3. Large strain regions including rupture (0.3 ≤ ε ≤ 0.55)In the final deformation step, the volume fraction of twins
till increases. However, the overall twin volume fraction remains
ow and the twin orientations represent a small contribution tohe macroscopic texture. Large regions with numerous dislocationccumulations develop within the grains. These features are illus-rated in the EBSD maps of Fig. 10 of the strained sample at 0.4 truetrain.
Fig. 9. EBSD representations related to the grain marked by the white star in Fig. 7; KQP map with the misorientation profile along the yellow line (a); KPQ map with specificm d-graT interpw
faslot
todtbof
e<tiesridec
gttddsvaw
asgiwibts
4
isorientation lines and corresponding schematic drawings: twin boundaries in reD-IPF map with the corresponding {1 0 0}, {1 1 0} and {1 1 1} pole figures (c). (Foreb version of the article.)
Beyond a strain of 0.3 true strain, new deformation twins areormed within the grains. The KPQ maps of the Figs. 7a and 10are showing evidence of an increase in the twinning activity fortrains from 0.3 to 0.4. The number of twins in the bundles increaseseading to thicker bundles and therefore to larger volume fractionsf twins. These bundles are about 500 nm large in some cases. Onhe EBSD map, these appear as large twinned domains.
At this deformation level, most of the grains are oriented closeo the texture components as shown in Fig. 10b. The grains withrientations close to the initial Goss and copper components haveisappeared. The ODF shows an orientation density increase aroundhe brass and rotated copper components. The strong relationetween the grain orientation and the twinning activity is stillbserved. Grains of the <1 1 1>//TD fiber exhibit a larger volumeraction of twins than those of the <1 0 0>//TD fiber.
On the sample strained to 0.4, the twin bundles are largenough to measure the twin orientations. Twins formed in the1 1 1>//TD oriented grains reinforce the <1 0 0>//TD fiber whereaswins within the <1 0 0>//TD oriented grains create orientationsn the <1 1 1>//TD fiber. The strict twin orientations generated byach main texture component have been calculated. Fig. 11(a–d)hows in the ODF section at ϕ2 = 45◦ the twin orientations that are
elated to the largest Schmid factor. These twins are correspond-ngly observed on the EBSD map. The twin and grain orientationso not overlap. The same calculation has been performed consid-ring a set of grain orientations dispersed around the ideal textureomponent as presented in Fig. 11e and f. In this case, the deformed4
ii
in boundaries misoriented by less than 3◦ in white and less than 10◦ in green (b);retation of the references to color in this figure legend, the reader is referred to the
rain and twin orientations overlap. It can be deduced that no newexture component appears by twinning. The EBSD map indicateshat the volume fraction of grains oriented close to <1 0 0>//TD fiberecreases slightly from 0.3 to 0.4 true strain, see Figs. 7 and 10. XRData indicate the volume fractions of these orientations increase ashown in Fig. 4. This evolution results from the increase of the twinolume fraction in grains oriented close to <1 1 1>//TD fiber. Thisspect is detailed in Section 4 where the volume fraction of twinsill be evaluated.
The EBSD map Fig. 10b reveals large intra- and inter-granularreas where no diffraction patterns were indexed. These corre-pond to sets of pixels with very low KPQ index appearing in darkrey color in Fig. 10a. The decrease of the indexing rate to 70%s correlated with the development of high deformation regions
hich could not be indexed because of the strong lattice distortionnduced by accumulation of dislocations densities. As interpretedy Allain [14], this indicates a pronounce localization of deforma-ion such as local necking which causes the failure of the tensileample.
. Discussion
.1. Analysis of the texture evolution: interaction with twinning
Tensile testing along the TD generates a sharp austenitic texturen the fine-grained Fe–Mn–C TWIP steel. This deformation textures characterized by four components: the {1 1 0}<1 1 2> brass, the

F(
{tn<StanIicw
watlctsfio
somfitiaifitfwatstca
tsmDtflalfin
tittfTiSegc
ueTtoSf
dt
cHnot
ig. 10. EBSD maps of a strained sample to 0.4 true strain. KPQ map (a). TD-IPF mapb).
1 1 2}<1 1 0> rotated copper, the {1 1 0}<1 1 0> rotated Goss andhe {0 0 1}<1 0 0> cube. These components belong either to the pro-ounced <1 1 1>//TD fiber (brass and rotated copper) or to the weak1 0 0>//TD fiber (rotated Goss and cube) as shown in Figs. 2 and 4.imilar densities of <1 1 1> and <1 0 0> poles in the tensile direc-ion have been observed on TWIP steels [17] or more generally onustenitic steels with low SFE [23,24]. The densities of these compo-ents increase by specific grain rotations related to the slip activity.
n TWIP steels the occurrence of twinning influences the slip activ-ty, which may modify the volume fraction of the different textureomponents. This was shown by simulation of texture evolutionsith or without taking twinning into account [25].
In the present work, the texture of the as-received TWIP steelas rather weak with grain orientations spread around the Goss
nd copper texture components. Reinforcement of these orien-ation densities is not favored by deformation and consequentlyarge grain rotations are required to develop the final textureomponents. At 0.2 true strain, the main characteristics of the ini-
ial texture components disappear without any significant texturetrengthening. At 0.3 true strain, the major <1 1 1>//TD fiber is rein-orced, whereas the other texture components show a moderatencrease. Further deformation up to 0.55 causes an intensificationf the texture components.a
ctu
The analysis of EBSD data shows that this texture evolutiontrongly influences the twinning activity. This influence obviouslyccurs at two steps of deformation. Twins appear in the first defor-ation stage, see Figs. 5 and 6. Initial twinning activity in this
ne-grained steel is related to the large grain size distribution ando the Goss and copper orientations which belong to the weaknitial texture components. These orientations are in fact favor-ble for twinning, see the Schmid factor values in Table 1. Withncreasing deformation the development of the major <1 1 1>//TDber still promotes twinning as illustrated in Fig. 10. In fact,he main <1 1 1>//TD fiber is well suited for twinning (Schmidactortwin = 0.31 and Schmid factorslip = 0.27, see Table 1) while theeak <1 0 0>//TD fiber is adequate to slip (Schmid factorslip = 0.41
nd Schmid factortwin = 0.23). The volume fraction of grains ofhe <1 1 1>//TD fiber steadily increases during the deformation, ashown in Fig. 4. At 0.3 true strain, the majority of grains belongso the <1 1 1>//TD fiber. The intensity increase of the main textureomponents promotes the twinning activity for strains between 0.3nd 0.4 as illustrated in Figs. 7 and 10 in conformity with ref. [17].
However, twinning generates new orientations and may modifyhe texture and its evolution. After a strain of 0.3, the twin den-ity in bundles is large enough so that the twin orientations can beeasured by using EBSD. The results are showed in Figs. 7 and 10.ue to the spread of the experimental orientations around the tex-
ure components, grain and twin orientations often overlap. Twinsormed within the <1 1 0>//TD oriented grains (at low deformationevels) or within the <1 1 1>//TD oriented grains (at intermediatend high deformation levels) reinforced the <1 0 0>//TD fiber. Theimited number of twins formed within the grain of the <1 0 0>//TDber orientation reinforces the <1 1 1>//TD fiber. As a consequence,o new texture components are generated by twinning.
As a matter of fact, the analysis of XRD and EBSD data indicateshat the contribution of twin orientations to the texture evolutions limited. XRD data show that the volume fraction of grains andwins oriented in <1 0 0>//TD fiber slightly increases for strains inhe range from 0.3 to 0.4, as shown in Fig. 4. Besides that the volumeraction estimated from EBSD of the individual grains decreases.he difference between both approaches suggests that the overallncrease of this texture component is mainly related to twinning.everal authors report a small influence of twinning on the texturevolution [26–28]. In these studies the volume fraction of twinsenerated during deformation in tension parallel to TD is not suffi-ient to significantly influence the texture.
The volume fraction of twins is an important parameter tonderstand the mechanical behavior – plasticity and strain hard-ning rate – of TWIP steels. However, it is difficult to estimate.he study of the literature shows that several authors have triedo quantify the twin volume fraction in low SFE fcc materials byptical microscopy [3,11,13] by using morphological criteria [29].uch an evaluation only gives an estimation of the twin volumeraction.
In the present work the twin volume fraction is estimated byiscerning the contributions of the grains and twins in the ODFhanks to the EBSD maps.
The EBSD analysis showed that most of the twins are orientedlose to the <1 0 0>//TD fiber with certain spread, see Figs. 10 and 11.owever, the determination of the overall twin volume fraction isot directly possible. The volume fraction of the deformed grainsf this fiber can be determined from EBSD measurements whereashe total volume fraction of twins and grains belonging to this fiber
re obtained from the ODF via XRD measurements.Thus, the difference (�) between these two volume fractionsorresponds to the volume fraction of twins. � increases from 6%o 9% between 0.4 and 0.55 true strain, respectively. These val-es are in agreement with the twin volume fraction estimated by

Fig. 11. Calculated twin and parent orientations represented in the ODF section at ϕ2 = 45◦ . For each parent orientation only one or two twin orientations associated to theh ientat( ulated( es cort end, t
Ac
4r
BmtoFwattmbuMto[
hdvvtsbosotso
stb
ighest Schmid factor are considered in agreement with EBSD observations. Twin ora), rotated copper (b), cube (c) and rotated Goss (d). Twin orientation densities calce) and around cube and rotated Goss orientations (f). The colored iso-densities linhe twin orientations. (For interpretation of the references to color in this figure leg
llain [13,14] for a coarse-grained TWIP steel of the same chemicalomposition.
.2. Microstructure evolution—influence on the strain hardeningate
TEM investigations show that the transition from stage A to stagecorresponds to the onset of twinning within grains deformed byulti-slip which is considered as necessary to form twins [30]. For
his fine-grained steel, the required macroscopic stress for the onsetf twinning is about 550 MPa and is reached at 0.02 true strain, seeig. 1. Specific texture components of the weak initial texture areell suited for mechanical twinning. The onset of twinning causes
n increase in strain hardening rate that reaches a plateau at 0.05 upo 0.1 true strain. The twins even in low volume fraction may reducehe effective grain size and act as strong obstacles for dislocation
otions. In other low SFE materials, like MP35N (nickel–cobalt-ased alloy) or �-brass [3,31–33], stage B is characterized by a
niform constant strain hardening rate. However, Rémy [11,12] andahajan and Chin [34] consider that twin-slip interactions increasehe strain hardening rate. A similar increase corresponding to thenset of twinning was also observed in high purity alpha-titanium35].
wnoft
ions (red crosses) calculated from the ideal parent orientation (blue squares) brassfrom parent orientations dispersed around brass and rotated copper orientations
respond to the parent orientation densities whereas the black ones correspond tohe reader is referred to the web version of the article.)
From 0.1 to 0.2 true strain, a weak decrease of the strainardening rate occurs corresponding to stage C. In this range ofeformation, twinning is less active as before. The texture remainsery smooth. Grains exhibiting the Goss and copper orientationsanish between 0.1 and 0.2 true strain as illustrated in Fig. 4. Inhose grains the dislocations start to be accumulated and formub-boundaries. In some grains, these sub-boundaries delimit twinundles. This rearrangement of dislocations and the slowing downf twinning activity may be at the origin of the weak decrease oftrain hardening rate. Asgari et al. [3] also suggest that the decreasef the strain hardening rate in low SFE fcc materials is related tohe inhibition of twin formation. The twins generated in the initialtage of deformation will decrease the grain size and are acting asbstacles for twinning [36,37].
A constant strain hardening rate occur between 0.2 and 0.3 truetrain (stage D). This is concomitant with two microstructural fea-ures. At 0.2 true strain the texture strengthens around the mainrass and rotated copper components (<1 1 1>//TD fiber) and the
eak rotated Goss and cube components (<1 0 0>//TD fiber). Theumber of grains with the <1 1 1>//TD fiber orientation is continu-usly increasing as shown in Fig. 4. Those grains are more adequateor twinning than those belonging to the <1 0 0>//TD fiber orien-ation, see Table 1. As the first twins have reduced the grain size a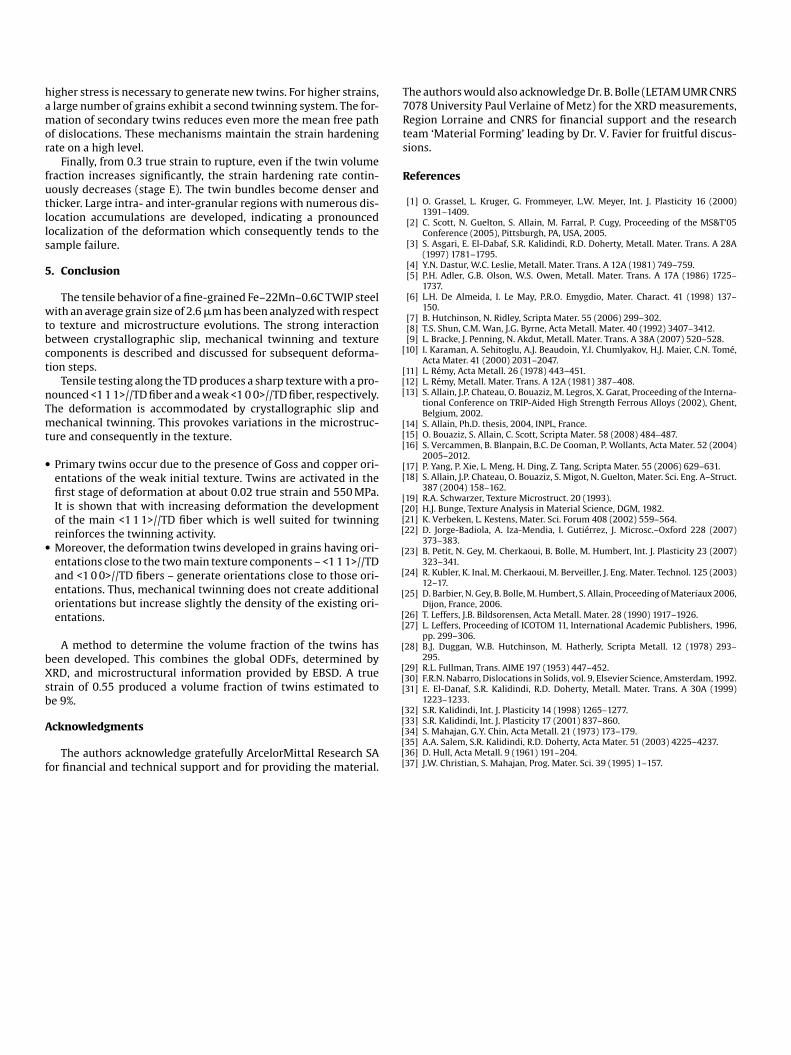
hamor
futlls
5
wtbct
nTmt
•
•
bXsb
A
f
T7Rts
R
[
[[[
[[[
[[
[[[[
[
[
[
[[
[
[[[
igher stress is necessary to generate new twins. For higher strains,large number of grains exhibit a second twinning system. The for-ation of secondary twins reduces even more the mean free path
f dislocations. These mechanisms maintain the strain hardeningate on a high level.
Finally, from 0.3 true strain to rupture, even if the twin volumeraction increases significantly, the strain hardening rate contin-ously decreases (stage E). The twin bundles become denser andhicker. Large intra- and inter-granular regions with numerous dis-ocation accumulations are developed, indicating a pronouncedocalization of the deformation which consequently tends to theample failure.
. Conclusion
The tensile behavior of a fine-grained Fe–22Mn–0.6C TWIP steelith an average grain size of 2.6 �m has been analyzed with respect
o texture and microstructure evolutions. The strong interactionetween crystallographic slip, mechanical twinning and textureomponents is described and discussed for subsequent deforma-ion steps.
Tensile testing along the TD produces a sharp texture with a pro-ounced <1 1 1>//TD fiber and a weak <1 0 0>//TD fiber, respectively.he deformation is accommodated by crystallographic slip andechanical twinning. This provokes variations in the microstruc-
ure and consequently in the texture.
Primary twins occur due to the presence of Goss and copper ori-entations of the weak initial texture. Twins are activated in thefirst stage of deformation at about 0.02 true strain and 550 MPa.It is shown that with increasing deformation the developmentof the main <1 1 1>//TD fiber which is well suited for twinningreinforces the twinning activity.Moreover, the deformation twins developed in grains having ori-entations close to the two main texture components – <1 1 1>//TDand <1 0 0>//TD fibers – generate orientations close to those ori-entations. Thus, mechanical twinning does not create additionalorientations but increase slightly the density of the existing ori-entations.
A method to determine the volume fraction of the twins haseen developed. This combines the global ODFs, determined byRD, and microstructural information provided by EBSD. A truetrain of 0.55 produced a volume fraction of twins estimated toe 9%.
cknowledgments
The authors acknowledge gratefully ArcelorMittal Research SAor financial and technical support and for providing the material.
[[[[[[
he authors would also acknowledge Dr. B. Bolle (LETAM UMR CNRS078 University Paul Verlaine of Metz) for the XRD measurements,egion Lorraine and CNRS for financial support and the researcheam ‘Material Forming’ leading by Dr. V. Favier for fruitful discus-ions.
eferences
[1] O. Grassel, L. Kruger, G. Frommeyer, L.W. Meyer, Int. J. Plasticity 16 (2000)1391–1409.
[2] C. Scott, N. Guelton, S. Allain, M. Farral, P. Cugy, Proceeding of the MS&T’05Conference (2005), Pittsburgh, PA, USA, 2005.
[3] S. Asgari, E. El-Dabaf, S.R. Kalidindi, R.D. Doherty, Metall. Mater. Trans. A 28A(1997) 1781–1795.
[4] Y.N. Dastur, W.C. Leslie, Metall. Mater. Trans. A 12A (1981) 749–759.[5] P.H. Adler, G.B. Olson, W.S. Owen, Metall. Mater. Trans. A 17A (1986) 1725–
1737.[6] L.H. De Almeida, I. Le May, P.R.O. Emygdio, Mater. Charact. 41 (1998) 137–
150.[7] B. Hutchinson, N. Ridley, Scripta Mater. 55 (2006) 299–302.[8] T.S. Shun, C.M. Wan, J.G. Byrne, Acta Metall. Mater. 40 (1992) 3407–3412.[9] L. Bracke, J. Penning, N. Akdut, Metall. Mater. Trans. A 38A (2007) 520–528.10] I. Karaman, A. Sehitoglu, A.J. Beaudoin, Y.I. Chumlyakov, H.J. Maier, C.N. Tomé,
Acta Mater. 41 (2000) 2031–2047.11] L. Rémy, Acta Metall. 26 (1978) 443–451.12] L. Rémy, Metall. Mater. Trans. A 12A (1981) 387–408.13] S. Allain, J.P. Chateau, O. Bouaziz, M. Legros, X. Garat, Proceeding of the Interna-
tional Conference on TRIP-Aided High Strength Ferrous Alloys (2002), Ghent,Belgium, 2002.
14] S. Allain, Ph.D. thesis, 2004, INPL, France.15] O. Bouaziz, S. Allain, C. Scott, Scripta Mater. 58 (2008) 484–487.16] S. Vercammen, B. Blanpain, B.C. De Cooman, P. Wollants, Acta Mater. 52 (2004)
2005–2012.17] P. Yang, P. Xie, L. Meng, H. Ding, Z. Tang, Scripta Mater. 55 (2006) 629–631.18] S. Allain, J.P. Chateau, O. Bouaziz, S. Migot, N. Guelton, Mater. Sci. Eng. A–Struct.
387 (2004) 158–162.19] R.A. Schwarzer, Texture Microstruct. 20 (1993).20] H.J. Bunge, Texture Analysis in Material Science, DGM, 1982.21] K. Verbeken, L. Kestens, Mater. Sci. Forum 408 (2002) 559–564.22] D. Jorge-Badiola, A. Iza-Mendia, I. Gutiérrez, J. Microsc.–Oxford 228 (2007)
373–383.23] B. Petit, N. Gey, M. Cherkaoui, B. Bolle, M. Humbert, Int. J. Plasticity 23 (2007)
323–341.24] R. Kubler, K. Inal, M. Cherkaoui, M. Berveiller, J. Eng. Mater. Technol. 125 (2003)
12–17.25] D. Barbier, N. Gey, B. Bolle, M. Humbert, S. Allain, Proceeding of Materiaux 2006,
Dijon, France, 2006.26] T. Leffers, J.B. Bildsorensen, Acta Metall. Mater. 28 (1990) 1917–1926.27] L. Leffers, Proceeding of ICOTOM 11, International Academic Publishers, 1996,
pp. 299–306.28] B.J. Duggan, W.B. Hutchinson, M. Hatherly, Scripta Metall. 12 (1978) 293–
295.29] R.L. Fullman, Trans. AIME 197 (1953) 447–452.30] F.R.N. Nabarro, Dislocations in Solids, vol. 9, Elsevier Science, Amsterdam, 1992.31] E. El-Danaf, S.R. Kalidindi, R.D. Doherty, Metall. Mater. Trans. A 30A (1999)
1223–1233.
32] S.R. Kalidindi, Int. J. Plasticity 14 (1998) 1265–1277.33] S.R. Kalidindi, Int. J. Plasticity 17 (2001) 837–860.34] S. Mahajan, G.Y. Chin, Acta Metall. 21 (1973) 173–179.35] A.A. Salem, S.R. Kalidindi, R.D. Doherty, Acta Mater. 51 (2003) 4225–4237.36] D. Hull, Acta Metall. 9 (1961) 191–204.37] J.W. Christian, S. Mahajan, Prog. Mater. Sci. 39 (1995) 1–157.