Embed Size (px)
Citation preview

Analysis of Relation between Virologic Responsesand Immunologic Responses, Patient’s Factorsin AIDS Clinical Trials Usinga Semiparametric Mixed-Effects Model
Hua Liang1,* and Guohua Zou1, 2
1 Department of Biostatistics and Computational Biology, University of Rochester Medical Center,601 Elmwood Avenue, Box 630, Rochester, NY 14642, USA
2 Academy of Mathematics and Systems Science, Chinese Academy of Sciences, Beijing 100080, China
Accepted 2 October 2006
Summary
In this article we propose to use a semiparametric mixed-effects model based on an exploratory analy-sis of clinical trial data for a study of the relation between virologic responses and immunologic mar-kers such as CD4þ and CD8 counts, and host-specific factors in AIDS clinical trials. The regressionspline technique, used for inference for parameters in the model, reduces the unknown nonparametriccomponents to parametric functions. It is simple and straightforward to implement the procedures usingreadily available software, and parameter inference can be developed from standard parametric models.We apply the model and the proposed method to an AIDS clinical study. Our findings indicate thatviral load level is positively related to baseline viral load level, negatively related to CD4þ cell counts,but unrelated to CD8 cell counts and patient’s age neither.
Key words: AIDS clinical trial; HIV dynamics; Longitudinal data; Partially linear models;Regression splines.
Introduction
Plasma HIV RNA copies (viral load) play an important role in evaluating antiviral therapies in AIDSclinical trials (Mellors et al., 1995, 1996; Saag et al., 1996). Diverse statistical and mathematical mod-els such as linear mixed-effects and nonlinear mixed-effects models (Perelson and Nelson, 1999; Wuand Ding, 1999) have been proposed to study the dynamics of HIV infection over the past decade.These studies have led to a new understanding of the pathogenesis of the infection (Ho et al., 1995;Notermans et al., 1998). However, a sole use of this marker is sometimes difficult, if it is not impossi-ble, to address some biological concerns. For instance, when patients are treated with the same antivir-al regimen in a study, why may there exist completely different cellular response patterns? What isthe relation between viral and immunologic responses, and other host-specific factors in AIDS clinicaltrials? CD4þ cell count served as a primary biomarker in AIDS clinical trials before HIV RNA assayswere developed in mid-1990s. Later plasma HIV RNA level (viral load) was shown to be more pre-dictive to clinical outcomes (Mellors et al., 1995, 1996; Saag et al., 1996), and thus has replacedCD4þ cell count as a new primary biomarker in most AIDS clinical trials since then. However,recently some investigators have suggested that the combination of these two markers may be betterand more appropriate for evaluating HIV/AIDS treatments (Padierna-Olivos et al., 2000). In general, itis believed that the plasma’s viral load of HIV-1 RNA and CD4þ cell count are negatively correlated
* Corresponding author: e-mail: [email protected], Phone: +1 585241 0704, Fax: +1 585273 1031
406 Biometrical Journal 49 (2007) 3, 406–415 DOI: 10.1002/bimj.200610294
# 2007 WILEY-VCH Verlag GmbH & Co. KGaA, Weinheim
during treatment. Whether other markers such as CD8þ cell count and patient’s unique features suchas the baseline viral load and other demographic factors (age and sex, etc.) affect HIV dynamics, interms of the magnitude of their response? An identification of immunologic markers and host-specificfactors that affect the long-term HIV dynamics in HIV-infected persons may help us to individualizetreatment strategies and provide care for the patients. If we ignore these factors, the estimation resultsmay be misleading.
It is worthy to point out that most models and methods in published literature are applicable only toshort-term evaluation (Ho et al., 1995), which means some weeks after the initiation of potent antiviraltreatments. The much longer survival of patients given HAART for HIV infection now means that AIDSclinical research requires the continued evaluation of HIV status over the long term. In this article, weuse a semiparametric mixed-effects model to study the relation between the viral load and immunologicmarkers and host-specific factors, and propose an estimation method. We apply the model and methodto analyze a dataset from an AIDS clinical study conducted by AIDS clinical trial group (ACTG).
The aims of this paper are (i) to identify a common characteristic of the antiviral activity, takingindividualization into account; and (ii) to examine the relation between viral load level and otherimmunologic markers, and patient’s features. Regression spline and linear mixed-effects model areused to estimate the parameters. The rest of this paper is organized as follows. In Section 2 we intro-duce the model and the estimation method. In Section 3 we give an extensive analysis of the data,report the estimates describing population and individual features. A discussion is given in Section 4.
2 Model and Method
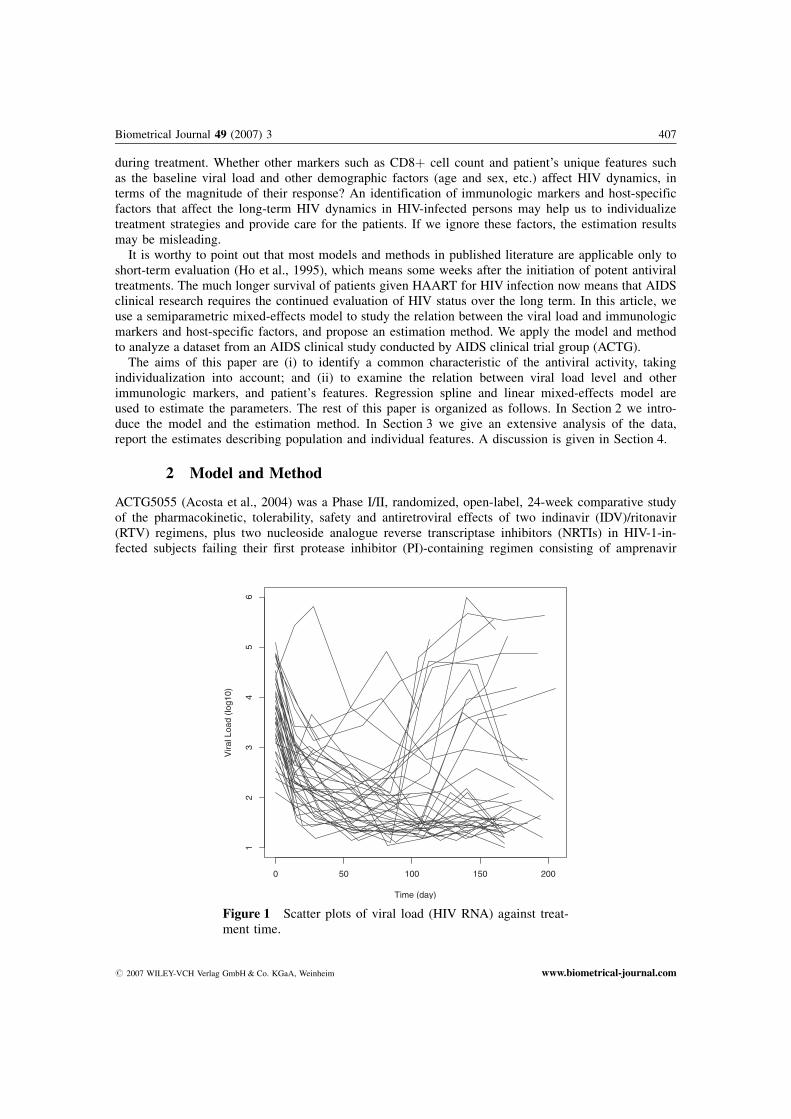
ACTG5055 (Acosta et al., 2004) was a Phase I/II, randomized, open-label, 24-week comparative studyof the pharmacokinetic, tolerability, safety and antiretroviral effects of two indinavir (IDV)/ritonavir(RTV) regimens, plus two nucleoside analogue reverse transcriptase inhibitors (NRTIs) in HIV-1-in-fected subjects failing their first protease inhibitor (PI)-containing regimen consisting of amprenavir
Biometrical Journal 49 (2007) 3 407
0 50 100 150 200
12
34
56
Time (day)
Vira
l Loa
d (lo
g10)
Figure 1 Scatter plots of viral load (HIV RNA) against treat-ment time.
# 2007 WILEY-VCH Verlag GmbH & Co. KGaA, Weinheim www.biometrical-journal.com
(APV), nelfinavir (NFV), saquinavir (SQV), or SQV/NFV combination therapy. Subjects were rando-mized to one of two IDV/RTV regimens: 800/200 mg bid (Arm A) or 400/400 mg bid (Arm B), plustwo NRTIs. To improve tolerability in Arm B, RTV was administered 300 mg q12 h during the initial4 days of study treatment, and then increased to 400 mg q12 h starting on day 5. Eligible subjectsincluded HIV-1 infected individuals �18 years of age, and plasma HIV RNA (Roche Amplicor HIV-1 Monitor) � 500 but � 100,000 copies/mL within 45 days of study entry. Subjects were naive to atleast one nucleoside analog RTI and did not have any active opportunistic infections.
Study visits occurred at pre-entry, entry (within 14 days of pre-entry), weeks 1, 2, 4, and every 4weeks thereafter through week 24. Plasma HIV RNA testing was done at each study visit. Clinicalassessment and laboratory parameters including CD4þ and CD8 cell counts were performed at all butthe week 1 visits. Plasma for intensive PK analysis was obtained at pre-dose, and 0.5, 1, 2, 3, 4, 5, 6,8, 10, and 12 hours following an observed IDV/RTV dose.
Forty-four HIV-1 infected subjects were enrolled in this study. Twenty-two subjects were rando-mized to the IDV/RTV 800/200 mg bid arm (Arm A) and 22 subjects were in the IDV/RTV 400/400 mg bid arm (Arm B). Of the 44 subjects, 2 subjects were excluded from this analysis becausetheir data were not properly obtained. Thirty-six out of 42 subjects (82%) are male. 20% are white,43% are black, 32% are Hispanic and 5% are other races. More detailed discussions about this studylike pharmacokinetics, antiretroviral effects and tolerability/safety were reported in Acosta et al.(2004).
Figure 1 shows the profiles of the viral load (HIV RNA) of the 42 available patients against treat-ment time. A large variation within subjects and a nonlinear relationship between viral load and treat-ment time are observed.
2.1 Model
As pointed out earlier, linear and nonlinear mixed-effects models are appropriate only to study short-term HIV dynamics and become invalid for long-term treatments. On the other hand, nonparametricmixed-effects models have been proposed for long-term HIV dynamics (Wu and Zhang, 2002; Wu andLiang, 2004). However, no covariates were permitted to accommodate useful information in the mod-els. In the present article, we propose a semiparametric mixed-effects model to study the relationbetween viral load and other immunologic markers and patients’ factors. The model is of form:
yij ¼ xTijbi þ hiðtijÞ þ eiðtijÞ ; j ¼ 1; . . . ;mi ; i ¼ 1; . . . ; n ; ð1Þ
where bi ¼ bþ ai, hiðtÞ ¼ hðtÞ þ giðtÞ, ai and giðtÞ are random effects, yij is the viral load measure-ments in our HIV/AIDS clinical study (response variable) and xij is a vector representing linear covari-ates such as CD4þ, CD8 cell counts, and other host-specific factors for the i-th subject at time tij. Theerror term eiðtÞ is a zero mean stochastic process with covariance function qeðs; tÞ ¼ cov feiðsÞ; eiðtÞg.b and hðtÞ describe the population characteristic, while ai and giðtÞ reflect individual variations fromb and hðtÞ. We are concerned with the population parameter b and curve hðtÞ, and individual param-eters bi and curves hiðtÞ. The population parameter/curve is important because it reflects the overalltrend or progress of an underlying population process and can be used as an important index for thepopulation relationship between viral load levels and other exploratory variables. The individual param-eters/curves are also important, because they reflect a particular relationship in a study. A good indivi-dual estimate may help investigators or practitioners to make a better decision for patients with AIDSwhen they group or classify the subjects on the basis of individual estimates.
Semiparametric models of the same form as (1) for cross-sectional data have extensively beenstudied in the last two decades (Engle et al., 1984; Speckman, 1986; H�rdle, Liang, and Gao, 2000),and were extended to longitudinal setting by Lin and Ying (2001) and Fan and Li (2004). To incorpo-rate the correlation feature of longitudinal and between-subject and within-subject variations, we ex-tend the model to include random-effects components. Zeger and Diggle (1994) used model (1) to
408 H. Liang and G. Zou: Modeling Antireviral Activity
# 2007 WILEY-VCH Verlag GmbH & Co. KGaA, Weinheim www.biometrical-journal.com

estimate the average time-course of CD4þ cell loss while adjusting for other covariates and allowingfor time-dependence within each person’s measurements. The authors proposed a backfitting algorithmalong with cross-validation prescription for model fitting, but the computational burden may be quitea challenge in contrast to that of our method.
Model (1) presents a novel and general structure for the conditional mean of Y given ðX; tÞ. Thisstructure indeed covers two important cases: (i) linear mixed-effects models, i.e., hiðtÞ � 0; (ii) nonpara-metric mixed-effects models, i.e., bi � 0. The former has widely and well been studied in literature(Laird and Ware, 1982; Pinheiro and Bates, 2000). The latter was proposed and then studied in Shi,Weiss, and Taylor (1996), Lin and Carroll (2000), Rice and Wu (2001), and Wu and Zhang (2002).
2.2 Method
There are a lot of choices of methods to estimate the nonparametric functions hðtÞ and giðtÞ, includinglocal polynomial kernel methods, smoothing splines and regression splines, and so on. However, acritical concern of the first two techniques in practice is that they require intensive computation andare sometimes unstable to smoothing parameters. In this paper we use regression spline to approxi-mate nonparametric functions hðtÞ and giðtÞ because of its simplicity of calculation and robustness ofimplementation. Shi et al. (1996) and Rice and Wu (2001) have applied regression spline for nonparam-etric mixed-effects curves. The regression spline methods reduce a nonparametric curve to a linearcombination of basis functions so that model-fitting and inferences can be based on standard param-etric methods operationally.
Let ti ¼ ðti1; . . . ; timiÞT , yi ¼ fyiðti1Þ; . . . ; yiðtimiÞg
T , hðtiÞ ¼ fhðti1Þ; . . . ; hðtimiÞgT , giðtiÞ ¼
fgiðti1Þ; . . . ; giðtimiÞgT , xi ¼ ðxi1; . . . ; ximiÞ, and eiðtiÞ ¼ feiðti1Þ; . . . ; eiðtimiÞg
T . Then, model (1) can bewritten in vector notation as
yi ¼ xTi bi þ hiðtiÞ þ eiðtiÞ; i ¼ 1; . . . ; n : ð2Þ
Approximate nonparametric functions hðtÞ and giðtÞ by basis functions; i.e., hðtÞ and giðtÞ areapproximated by
hpðtÞ ¼Ppk¼0
xkqkðtÞ ¼ QpðtÞT xp and gi;rðtÞ ¼Prk¼0
bikwkðtÞ ¼ YrðtÞT bi ;
where QpðtÞ ¼ fq0ðtÞ; . . . ; qpðtÞgT , YrðtÞ ¼ fw0ðtÞ; . . . ; wrðtÞgT , xp ¼ ðx0; . . . ; xpÞT , and bi ¼
ðbi0; . . . ; birÞT . Also note that for fixed p and r, the truncated vector bi is a random vector with mean0 and covariance matrix D, qðs; tÞ ¼ cov fgi;rðsÞ; gi;rðtÞg ¼ YrðsÞT DYrðtÞ. Replacing hiðtÞ byhpðtÞ þ gi;rðtÞ in model (2), we obtain an approximate model
yi ¼Ppk¼0
xkqkðtiÞ þ xTi bi þ
Prk¼0
bikwkðtiÞ þ eiðtiÞ : ð3Þ
For given p and r, this is a linear mixed-effects (LME) model with fixed-effect termPpk¼0
xkqkðtiÞ þ xTi b
and random-effects term xTi ai þ
Prk¼0
bikwkðtiÞ. Let a ¼ ðbT ; xTp Þ
T ¼ ðbT ; x0; . . . ; xpÞT , ui ¼ðaT
i ; bi0; . . . ; birÞT , Xi ¼ fxTi ; q0ðtiÞ; . . . ; qpðtiÞg, Zi ¼ fxT
i ; w0ðtiÞ; . . . ;wrðtiÞg. Model (3) can be ex-pressed as a standard LME model for given p and r,
yi ¼ Xiaþ Ziui þ eiðtiÞ; ui � ð0;D*Þ; ei � ð0;RiÞ :Thus, for given D* and Ri, the closed forms for the estimates of a and ui can be written as follows(Laird and Ware, 1982; Davidian and Giltinan, 1995).
aa ¼Pni¼1
XTi S�1
i Xi
� ��1 Pni¼1
XTi S�1
i yi
� �; uui ¼ D*ZT
i S�1i ðyi � XiaaÞ ;
Biometrical Journal 49 (2007) 3 409
# 2007 WILEY-VCH Verlag GmbH & Co. KGaA, Weinheim www.biometrical-journal.com

where Si ¼ Ri þ ZiD*ZTi . Consequently, the estimates of hpðtÞ and gi;rðtÞ can be expressed as hhpðtÞ ¼
QpðtÞT xxp and ggi;rðtÞ ¼ YrðtÞT bbi. The covariance matrix D* may be specified as unstructured or withsome special structures. The covariance matrix Ri may also have a special structure, but very oftenwe simply set Ri ¼ s2Imi , where s2 needs to be estimated. The unknown parameters in D* and Ri
can be estimated using the maximum likelihood (ML) or restricted maximum likelihood (RML)method (Davidian and Giltinan, 1995; Vonesh and Chinchilli, 1996). Also note that qqðs; tÞ ¼dcovcov fgi;rðsÞ; gi;rðtÞg ¼ YrðsÞT DDYrðtÞ.
The choice of basis functions is usually not as crucial as the selection of p and r. We use natural cubicspline basis due to its optimality property and easy implementation using existing software such asR/SPLUS (Pinheiro and Bates, 2000). Ramsay (1988), Eubank (1999) and others have proposed to locatethe knots at the quantiles of the data. We use the model selection criterion AIC to determine p and r.
3 Results
We first checked whether there is any difference between two arms by comparing viral load, CD4+cell count, and CD8 cell count. Wilcoxon test was used and the p-values are all greater than 0.5,which indicates there is no statistically significant difference between the two arms. We thereforepooled the data together for analysis.
Model (1) was fitted to the data. To stabilize the variance and computational algorithms, we usedlog10 scale in viral load (this is commonly used in AIDS clinical trials), and took a log-transformationfor time t in our model fitting. Our analysis indicated that viral load level is not significantly relatedto CD8 cell count and age, and therefore these two covariates are excluded in our subsequent analysis.The model we used is of form:
yij ¼ b0i þ b1iCD4ij þ b2iBVLi þ hiðtijÞ þ eij ;
where BVLi is the baseline of viral load measured at entry. We assume hið0Þ ¼ 0 to assure identifia-bility. p and r were determined by the model selection criterion AIC, and we obtained that p ¼ r ¼ 5.We fitted the model using the R-LME function.
The population estimates of the linear coefficients are bb0 ¼ 1:144 (s.e. 0:248), bb1 ¼ �0:00096 (s.e.0:00024), and bb2 ¼ 0:767 (s.e. 0:058). These results show that the viral load level and CD4þ cellcount are negatively related, while viral load level and baseline viral load are positively related. Thefirst finding may not be surprised because the CD4þ cell is the major target of HIV infection. Thesecond finding indicates that the higher the baseline viral load level, the higher the viral load levelduring the treatment. This may remind the investigators to pay more attention to patients with higherbaseline viral load levels. A population curve of hðtÞ is presented in Figure 2, which reflects the viralload decreases sharply during the first 17 weeks. However, after 17 weeks the viral load increases fora while and declines again to the end of treatment. From biological perspective, one may link the timeof changing point as the time when the macrophage or other long-lived HIV-infected cells from lym-phoid tissue release free HIV to the blood, and the upward pattern may indicate the development ofdrug resistance or poor adherence. These time points have important clinical implications because thismay suggest clinicians to carefully monitor treatment and drug management. A confidence region ofthe width of two standard errors, centered on the population estimates is also drawn in Figure 2. Thenarrowed region at the beginning indicates the decline uniformly, while the wider region in the latterperiod reflects a big variation.
One of the advantages of mixed-effects models is that the parameter estimates for both populationand individuals can be obtained. However, the parameter estimates for individuals may not follow thepatterns of the population if the between-subject variation is large. Table 1 shows the individual esti-mates of b0i, b1i, and b2i for all 42 patients. One may see that all estimated values of b2i are positivelike the population estimate of b2, while the difference in magnitudes is visible, which indicates thatthe between-subject variation is non-ignorable. In particular, the estimate of b1 of patient 10 is posi-
410 H. Liang and G. Zou: Modeling Antireviral Activity
# 2007 WILEY-VCH Verlag GmbH & Co. KGaA, Weinheim www.biometrical-journal.com

tive (0:00068), comparing to the negative population estimate �0:00096, and the estimate of b0 ofpatient 28 is 0:3307, which is far away from the population estimate 1:144. Due to the large between-subject variation, the individual estimates of parameters become important for individualizing treat-ment management and care for patients with AIDS.
Biometrical Journal 49 (2007) 3 411
Table 1 Estimates of b0, b1 and b2.
Patient b0 b1 b2 Patient b0 b1 b2
1 1.64634 �0.00172 0.57083 22 1.05062 �0.00234 0.742082 2.30908 �0.00372 0.57826 23 3.51997 �0.00379 0.192523 2.95217 �0.00503 0.43028 24 1.50749 �0.00233 0.537944 1.1033 �0.00193 0.65577 25 0.85275 �0.00243 0.764785 0.79247 �0.00089 0.65674 26 1.51225 �0.00208 0.535636 3.17907 �0.00548 0.43677 27 1.40903 �0.00141 0.562387 0.99573 0.00079 0.49395 28 0.33074 0.00063 0.704218 1.73088 �0.00246 0.57919 29 2.0848 �0.00288 0.495629 0.56333 �0.00384 0.96671 30 2.18018 �0.00413 0.52296
10 1.9174 0.00068 0.3126 31 2.02745 �0.00155 0.468311 2.37384 �0.00436 0.48623 32 0.20664 �0.00081 0.8280112 3.27495 �0.0035 0.29961 33 0.91494 �0.0011 0.6748713 0.57253 �0.00072 0.72791 34 1.84514 �0.00144 0.4577414 0.82925 �0.00103 0.71598 35 2.14358 �0.00752 0.7756615 1.55407 �0.00321 0.6386 36 0.52225 �1e-04 0.7150316 2.19298 �0.00354 0.44965 37 1.53916 �0.00028 0.577417 3.7985 �0.00152 0.05568 38 2.62811 �0.00532 0.5429618 0.71725 �0.00174 0.77537 39 4.38377 �0.00452 0.0895219 2.88268 �0.00254 0.27672 40 1.45079 �0.00165 0.5918520 2.46835 �0.00305 0.38239 41 5.41293 �0.01004 0.1948121 0.60827 0.00022 0.60019 42 0.83752 �0.00103 0.61161
0 50 100 150 200
–1.5
–1.0
–0.5
0.0
Time (day)
η(t)
Figure 2 The population estimate of hðtÞ (solid line)and a confidence region with width of two standard errors(shaded region).
# 2007 WILEY-VCH Verlag GmbH & Co. KGaA, Weinheim www.biometrical-journal.com

We show the curves of six selected individual estimates hhiðtÞ in Figure 3. For comparison, popula-tion estimate hhðtÞ is also presented there. Both magnitude and patterns are different between thepopulation and individual estimates. The estimated individual curves of patients 5, 12, 41, and 42show similar patterns to the population pattern in the first 100 days, but deviate from the population
412 H. Liang and G. Zou: Modeling Antireviral Activity
0 50 100 150 200
–3–2
–10
1
Time (day)
η(t)
ID 5
0 50 100 150 200
–3–2
–10
1Time (day)
η(t)
ID 9
0 50 100 150 200
–3–2
–10
1
Time (day)
η(t)
ID 12
0 50 100 150 200
–3–2
–10
1
Time (day)
η(t)
ID 35
0 50 100 150 200
–3–2
–10
1
Time (day)
η(t)
ID 41
0 50 100 150 200
–3–2
–10
1
Time (day)
η(t)
ID 42
Figure 3 The population (solid lines) and individual (dotted lines) estimates hhðtÞ andhhiðtÞ from six selected patients.
# 2007 WILEY-VCH Verlag GmbH & Co. KGaA, Weinheim www.biometrical-journal.com
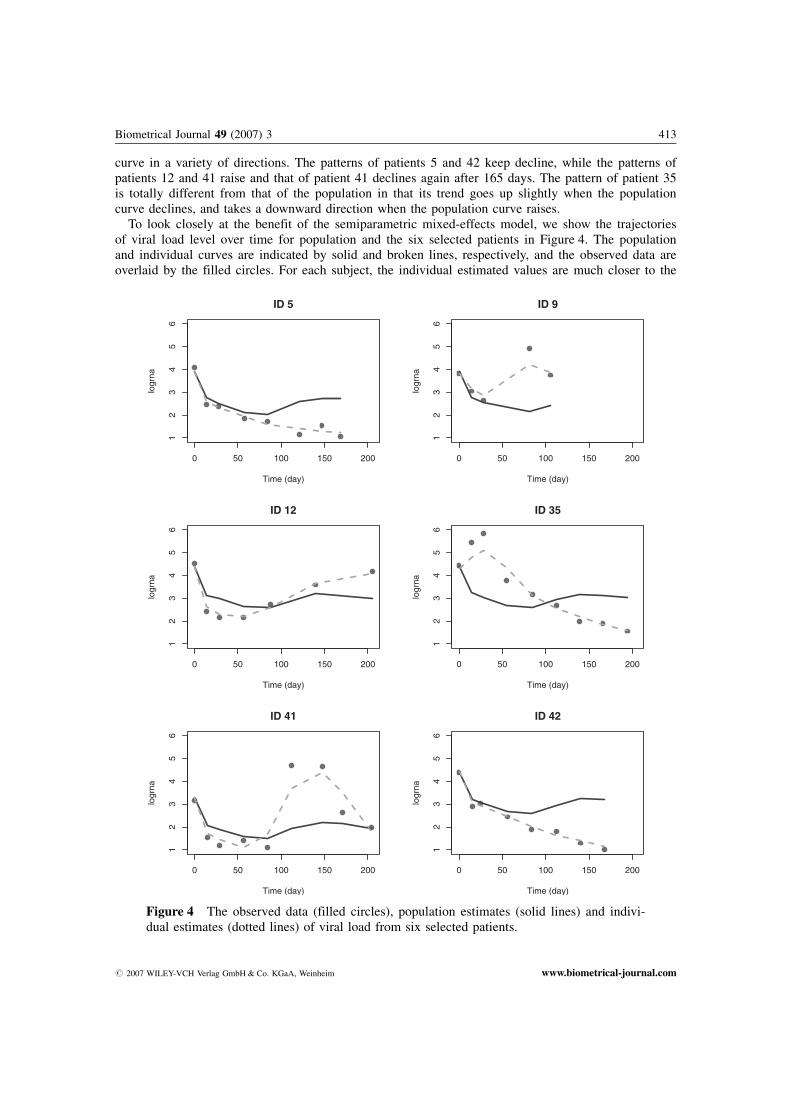
curve in a variety of directions. The patterns of patients 5 and 42 keep decline, while the patterns ofpatients 12 and 41 raise and that of patient 41 declines again after 165 days. The pattern of patient 35is totally different from that of the population in that its trend goes up slightly when the populationcurve declines, and takes a downward direction when the population curve raises.
To look closely at the benefit of the semiparametric mixed-effects model, we show the trajectoriesof viral load level over time for population and the six selected patients in Figure 4. The populationand individual curves are indicated by solid and broken lines, respectively, and the observed data areoverlaid by the filled circles. For each subject, the individual estimated values are much closer to the
Biometrical Journal 49 (2007) 3 413
0 50 100 150 200
12
34
56
Time (day)
logr
na
ID 5
0 50 100 150 200
12
34
56
Time (day)
logr
na
ID 9
0 50 100 150 200
12
34
56
Time (day)
logr
na
ID 12
0 50 100 150 200
12
34
56
Time (day)
logr
na
ID 35
0 50 100 150 200
12
34
56
Time (day)
logr
na
ID 41
0 50 100 150 200
12
34
56
Time (day)
logr
na
ID 42
Figure 4 The observed data (filled circles), population estimates (solid lines) and indivi-dual estimates (dotted lines) of viral load from six selected patients.
# 2007 WILEY-VCH Verlag GmbH & Co. KGaA, Weinheim www.biometrical-journal.com

observed values. The population estimated values, however, deviate the observed data due to largebetween-subject variations. This reflects the benefit of the model owing to a simultaneous considera-tion of between-subject and within-subject variations. The common characteristic reflected by thesolid lines indicates that overall the viral load level decreases and then slightly rebounds and main-tains a flat status to the end of treatment. The individual curve for patient 12 is close to the popula-tion curve, whereas the individual curves for patients 9, 35, and 41 are completely different from thepopulation curve. The individual curves for patients 5 and 42 are slightly different from the popula-tion curve and maintain a decline until the end of treatment. Antiviral activity in these individuals wassuperior to that seen generally. The estimated trajectories for individuals provide more accurate infor-mation than the population trajectory does. This is important for investigators to take care individualpatients with HIV infection.
4 Discussion
To analyze AIDS data from ACTG 5055, we proposed to use a semiparametric mixed-effects model toestimate population and individual parameters. Our analysis of the AIDS data indicates that the viralload RNA level is unrelated to CD8 cell count and subject’s age, positively related to the baselineviral load level, but negatively related to CD4þ cell count. Nonparametric component parsimoniouslyreflects the pattern of viral load against treatment time. The change point of the curve may indicatethe appearance of drug resistance, or the macrophages or other long-lived cells releasing HIV intoblood from lymphoid tissues, and signal time to change treatment agents to avoid the problem of drugresistance.
The semiparametric mixed-effects model is preferable to its counterparts like linear and nonpara-metric mixed-effects models because it accommodates the simplicity of linear regression and flex-ibility of nonparametric regression. The model also incorporates the feature of between-subject andwithin-subject variations, which helped us to identify the particular characteristics of individual sub-jects. Compared with the nonlinear mixed-effects models, the semiparametric mixed-effects model ismuch more appreciated to capture long-term essence of the antiviral activity. Because of nonlinear-ity and the need to estimate many parameters in nonlinear mixed-effects models, AIC and BICcriteria are commonly used to confirm the availability of the estimated values of parameters. How-ever, these estimates are very sensitive to initial values on the basis of our experience, and diver-gence problem often occurred. The method in this article is much easier to conduct and causesunder no circumstance convergence problem. The regression spline based approach also has advan-tages over its counterparts like local polynomial regression and smoothing spline methods. Themain advantages include that selection of smoothing parameters can be avoided, the computation isfast and stable, and the implementation is easy. The estimates of the model parameters provide abasis for displaying important effects in a straightforward way. The proposed approach may beapplicable to data sets from other AIDS studies, and also be used to compare treatment effectsamong different groups by a comparison of the population curves, or population estimates. Thesepoints may make it prosperous in practice.
Acknowledgements The author would like to thank the Editor, an Associate Editor and a referee for theirconstructive comments and suggestions. This research was supported by the NIAID/NIH grants AI62247 andAI59773. Zou’s research was also supported by the NNSFC grant 10471043.
References
Acosta, E. P., Wu, H., Walawander, A., Eron, J., Pettinelli, C., Yu, S., Neath, D., Ferguson, E., Saah, A. J.,Kuritzkes, D. R., and Gerber, J. G. (2004). Comparison of two indinavir/ritonavir regimens in treatment-experienced HIV-infected individuals. Journal of Acquired Immune Deficiency Syndromes 37, 1358–1366.
Davidian, M. and Giltinan, D. (1995). Nonlinear Models for Repeated Measurement Data. New York: Chapmanand Hall.
414 H. Liang and G. Zou: Modeling Antireviral Activity
# 2007 WILEY-VCH Verlag GmbH & Co. KGaA, Weinheim www.biometrical-journal.com

Engle, R. F., Granger, C. W. J., Rice, J., and Weiss, A. (1986). Semiparametric estimates of the relation betweenweather and electricity sales. Journal of the American Statistical Association 81, 310–320.
Eubank, R. L. (1999). Nonparametric Regression and Spline Smoothing. New York: Marcel Dekker.Fan, J. and Li, R. (2004). New estimation and model selection procedures for semiparametric modeling in long-
itudinal data analysis. Journal of the American Statistical Association 99, 710–723.H�rdle, W., Liang, H., and Gao, J. (2000). Partially Linear Models. Heidelberg: Springer Physica-Verlag.Ho, D. D., Neumann, A. U., Perelson, A. S., Chen, W., Leonard, J. M., and Markowitz, M. (1995). Rapid turn-
over of plasma virions and CD4 lymphocytes in HIV-1 infection. Nature 373, 123–126.Laird, N. M. and Ware, J. H. (1982). Random effects models for longitudinal data. Biometrics 38, 963–974.Lin, D. Y. and Ying, Z. (2001). Semiparametric and nonparametric regression analysis of longitudinal data. Jour-
nal of the American Statistical Association 96, 103–126.Lin, X. and Carroll, R. J. (2000). Nonparametric function estimation for clustered data when the predictor is
measured without/with error. Journal of the American Statistical Association 95, 520–534.Mellors, J. W., Kingsley, L. A., Rinaldo, C. R., Todd, J. A., Hoo, B. S., Kokka, R. P., and Gupta, P. (1995).
Quantitation of HIV-1 RNA in plasma predicts outcome after seroconversion. Annals of Internal Medicine122, 573–579.
Mellors, J. W., Rinaldo, C. R., Gupta, P., White, R. M., Todd, J. A., and Kingsley, L. A. (1996). Prognosis inHIV-1 infection predicted by the quantity of virus in plasma. Science 272, 1167–1170.
Notermans, D. W., Goudsmit, J., Danner, S. A., de Wolf, F., Perelson, A. S., and Mittler, J. (1998). Rate of HIV-1decline following antiretroviral therapy is related to viral load at baseline and drug regimen. AIDS 12,1483–1490.
Padierna-Olivos, L., Moreno-Altamirano, M. M. B., Sanchez-Colon, S., Mass�-Rojas, F., and S�nchez-Garca, F. J.(2000). Connectivity and HIV-1 infection: Role of CD4(þ) T-cell counts and HIV-1 RNA copy number.Scandinavian Journal of Immunology 52, 618–627.
Perelson, A. S. and Nelson, P. W. (1999). Mathematical analysis of HIV-1 dynamics in vivo. SIAM Review 41, 3–44.
Pinheiro, J. C. and Bates, D. M. (2000). Mixed-Effects Models in S and S-PLUS. New York: Springer.Ramsay, J. (1988). Monotone regression splines in action (with discussion). Statistical Science 4, 425–461.Rice, J. A. and Wu, C. O. (2001). Nonparametric mixed effects models for unequally sampled noisy curves.
Biometrics 57, 253–259.Saag, M. S., Holodniy, M., Kuritzkes, D. R., O’Brien, W. A., Coombs, R., Poscher, M. E., Jacobsen, D. M.,
Shaw, G. M., Richman, D. D., and Volberding, P. A. (1996). HIV viral load markers in clinical practice.Nature Medicine 2, 625–629.
Shi, M., Weiss, R. E., and Taylor, J. M. G. (1996). An analysis of pediatric CD4þ counts for acquired immunedeficiency syndrome using flexible random curves. Applied Statistics 45, 151–163.
Speckman, P. (1988). Kernel smoothing in partial linear models. Journal of the Royal Statistical Society, Series B50, 413–436.
Vonesh, E. F. and Chinchilli, V. M. (1996). Linear and Nonlinear Models for the Analysis of Repeated Measure-ments. New York: Marcel Dekker, Inc.
Wu, H. and Ding, A. (1999). Population HIV-1 dynamics in vivo: applicable models and inferential tools forvirological data from AIDS clinical trials. Biometrics 55, 410–418.
Wu, H. and Liang, H. (2004). Backfitting random varying-coefficient models with time-dependent smoothingcovariates. Scandinavian Journal of Statistics 31, 3–19.
Wu, H. and Zhang, J. (2002). Local polynomial mixed-effects models for longitudinal data. Journal of the AmericanStatistical Association 97, 883–897.
Zeger, S. L. and Diggle, P. J. (1994). Semiparametric models for longitudinal data with application to CD4 cellnumbers in HIV seroconverters. Biometrics 50, 689–699.
Biometrical Journal 49 (2007) 3 415
# 2007 WILEY-VCH Verlag GmbH & Co. KGaA, Weinheim www.biometrical-journal.com