Embed Size (px)
Citation preview

Analysis of Redart Clay in Filtron Water Filters
Kristina Bogdanov, Assistant Professor, Fine Arts Department, Ohio Wesleyan University,
Delaware, Ohio
Emily Koly, BFA student, Fine Arts Department, Ohio Wesleyan University, Delaware, Ohio
Ohio Wesleyan University, 61 S.Sundusky Street, Delaware, OH 43015
Email address: [email protected], [email protected]
2
Abstract
One of the most commonly promoted, and used, water filters, in developing countries, is the
Filtron ceramic filter. The most commonly used clay, in the production of the Filtron ceramic
filter, is red clay. In the United States, Redart is the most commonly used and distributed red
clay. Redart is mined by Cedar Heights in Ohio. Eight different clay body formulations were
made for testing, each formula had different ratios of ingredients: Redart, sawdust, ball clays,
play sand, and water. A total of 24 filters were produced, fired, and tested. Later, to compare
flow rate performance, water was filtered through each filter for 3 consecutive days. The flow
rates varied from 0.5 to 2 liters per hour.
Introduction
Initially, sawdust from a local wood shop was sifted through screens in order to make the grains
finer. The first three clay body formulas (see Batches 1 through 3 in Diagram 1) were mixed
manually, in order to simulate the most probable conditions for clay mixing in developing
countries. Most workshops in developing countries use this method of manual mixing. First, the
Redart powder was poured, in a straight line, on a plastic sheet of approximately 4 by 12 feet,
next a layer of sifted sawdust was added. The sides of the plastic sheet were lifted and rolled
until the sawdust and Redart were mixed thoroughly and evenly. The mix was compiled in a
shallow dome shape. On top of the dome, a shallow hole was made for water to be added.
Instead of pouring water from a bottle or pan, a watering can was used so as to have more control
and to allow the mixture to be more evenly soaked. After each water addition, the mixture was
manually mixed until the body could be wedged into small balls. The balls of clay were then
combined into bigger masses that weighed approximately 25 lbs (11.3 Kgs). Each 25 lbs ball of
clay was placed in the bottom of a mold. From there, the clay mass was compressed, by fist, and
3
then pressed out in a manual press to create the filter. The remaining five clay body formulas
(see Batches 4 and 5 in Diagram 1, and Batches D through F in Diagram 2) were mixed in a
studio Blackbird clay mixer. The first three formulas, Batches 1 through 3, that were initially
manually mixed, were repeated but instead of manually mixing they were mixed in the clay
mixer. First, the dry ingredients were mixed. Then, a measured amount of water was added
using a watering can.
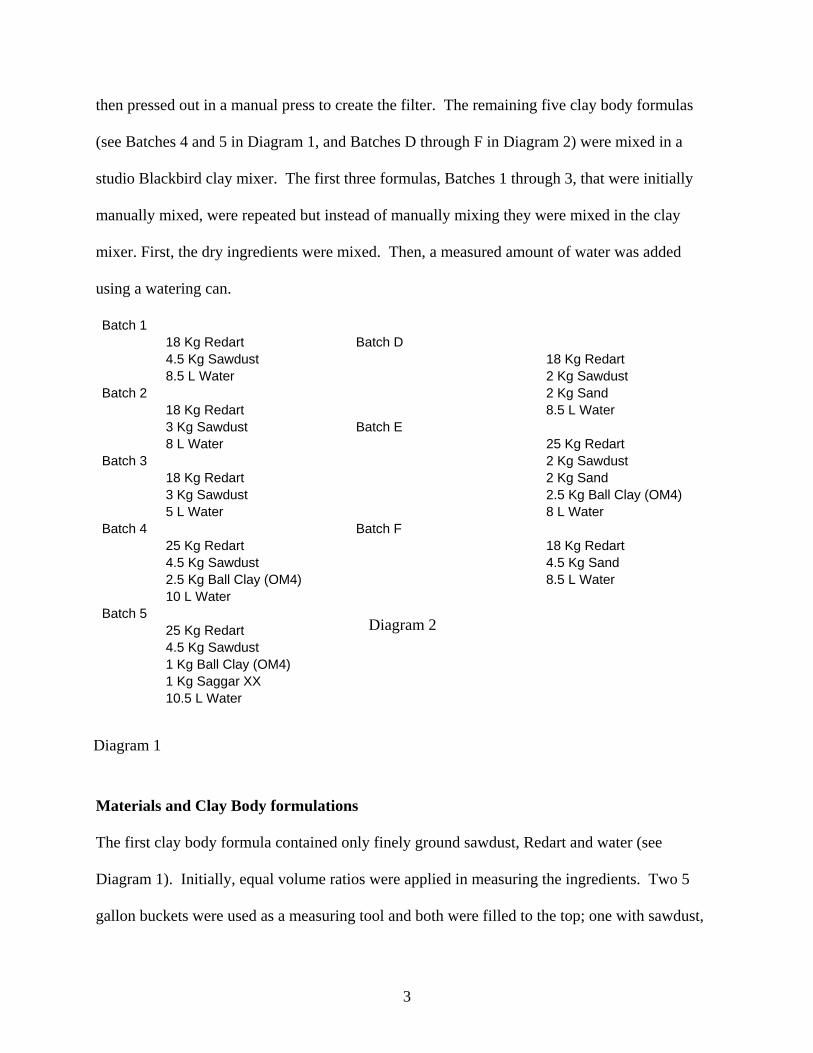
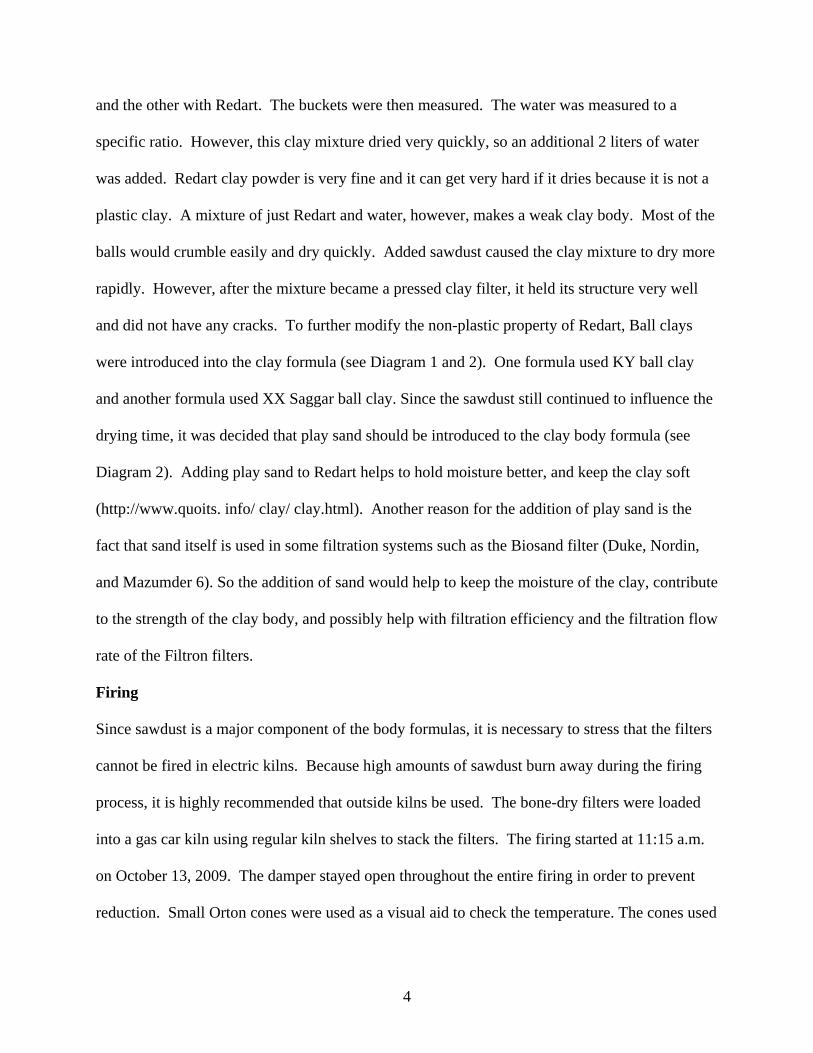
Batch 1 18 Kg Redart Batch D 4.5 Kg Sawdust 18 Kg Redart 8.5 L Water 2 Kg Sawdust Batch 2 2 Kg Sand 18 Kg Redart 8.5 L Water 3 Kg Sawdust Batch E 8 L Water 25 Kg Redart Batch 3 2 Kg Sawdust 18 Kg Redart 2 Kg Sand 3 Kg Sawdust 2.5 Kg Ball Clay (OM4) 5 L Water 8 L Water Batch 4 Batch F 25 Kg Redart 18 Kg Redart 4.5 Kg Sawdust 4.5 Kg Sand 2.5 Kg Ball Clay (OM4) 8.5 L Water 10 L Water Batch 5
25 Kg Redart 4.5 Kg Sawdust 1 Kg Ball Clay (OM4) 1 Kg Saggar XX 10.5 L Water
Materials and Clay Body formulations
The first clay body formula contained only finely ground sawdust, Redart and water (see
Diagram 1). Initially, equal volume ratios were applied in measuring the ingredients. Two 5
gallon buckets were used as a measuring tool and both were filled to the top; one with sawdust,
Diagram 1
Diagram 2
4
and the other with Redart. The buckets were then measured. The water was measured to a
specific ratio. However, this clay mixture dried very quickly, so an additional 2 liters of water
was added. Redart clay powder is very fine and it can get very hard if it dries because it is not a
plastic clay. A mixture of just Redart and water, however, makes a weak clay body. Most of the
balls would crumble easily and dry quickly. Added sawdust caused the clay mixture to dry more
rapidly. However, after the mixture became a pressed clay filter, it held its structure very well
and did not have any cracks. To further modify the non-plastic property of Redart, Ball clays
were introduced into the clay formula (see Diagram 1 and 2). One formula used KY ball clay
and another formula used XX Saggar ball clay. Since the sawdust still continued to influence the
drying time, it was decided that play sand should be introduced to the clay body formula (see
Diagram 2). Adding play sand to Redart helps to hold moisture better, and keep the clay soft
(http://www.quoits. info/ clay/ clay.html). Another reason for the addition of play sand is the
fact that sand itself is used in some filtration systems such as the Biosand filter (Duke, Nordin,
and Mazumder 6). So the addition of sand would help to keep the moisture of the clay, contribute
to the strength of the clay body, and possibly help with filtration efficiency and the filtration flow
rate of the Filtron filters.
Firing
Since sawdust is a major component of the body formulas, it is necessary to stress that the filters
cannot be fired in electric kilns. Because high amounts of sawdust burn away during the firing
process, it is highly recommended that outside kilns be used. The bone-dry filters were loaded
into a gas car kiln using regular kiln shelves to stack the filters. The firing started at 11:15 a.m.
on October 13, 2009. The damper stayed open throughout the entire firing in order to prevent
reduction. Small Orton cones were used as a visual aid to check the temperature. The cones used
5
were: 020, 014, 012, and 011. The target firing temperature was 012. A significant
amount of smoke was detected at the beginning of the firing, and up until 014 dropped. The
top of the kiln was heating one cone ahead of the bottom, so in the last hour of the firing the
damper was pushed in. This was done in order to even out the temperature throughout the kiln.
The firing ended at 4:10 p.m. On the top, 012 dropped and 011 had started to bend, and on
the bottom 012 dropped. When the kiln was unloaded almost all of the filters came out with
black carbon stains on the bottom. The kiln shelves were also marked with circular carbon stains
where the filters had been placed. A couple filters on the top shelves did not have as much
carbon as the ones placed in the middle and on the bottom shelves. The carbon was a result of
the sawdust burning and turning into charcoal. Charcoal is another material used in some
filtration systems. Even though trapped carbon was not what was initially expected from the
firing, it provided the opportunity to test the filters and see whether the carbon could potentially
help the filtration rate of the Filtron. In most cases, carbon weakens clay bodies. But since most
of the filters had the addition of sand in the formula, there was no indication of a weaker physical
structure. The filters did not crumble or crack during or after the filtration flow rates were tested.
Discussion
In order to avoid trapping carbon in the filter’s body, one hypothesized solution was to avoid
using kiln shelves. Instead, the filters were stacked one on top of another; wadding and broken
filter pieces were used to stabilize them. This system was applied during the second round of
firing.1 However, the weight of the filters caused an entirely new problem. Stacking two layers
of filters, one on top of another, held strong enough, but stacking three filters caused the filters to
slightly collapse. Some filters at the bottom of the stack significantly warped and cracked.
Another hypothesized solution to prevent carbon from forming was to prolong the firing time.
6
This was done to ensure that all the carbon could burn away. However, this meant that the
temperature rose to 011 or 010. As a result of the adjustments made to the second firing,
none of the filters had carbon stains, however, a lot of filters were warped and cracked.
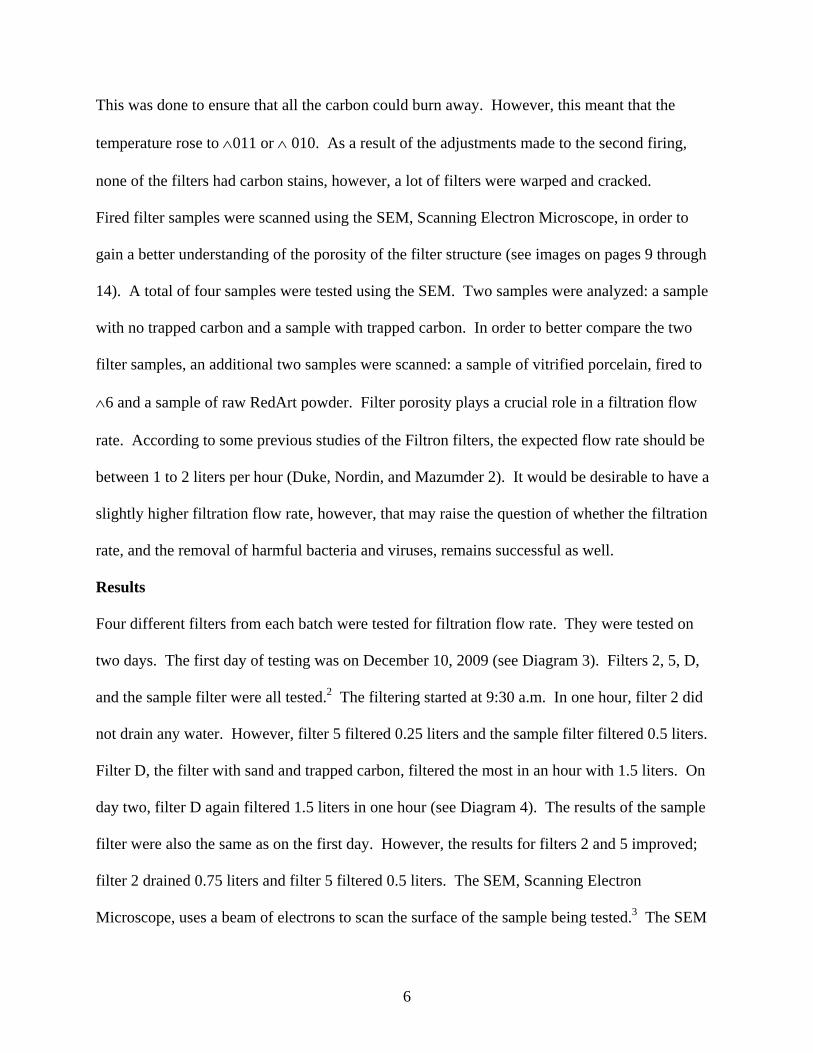
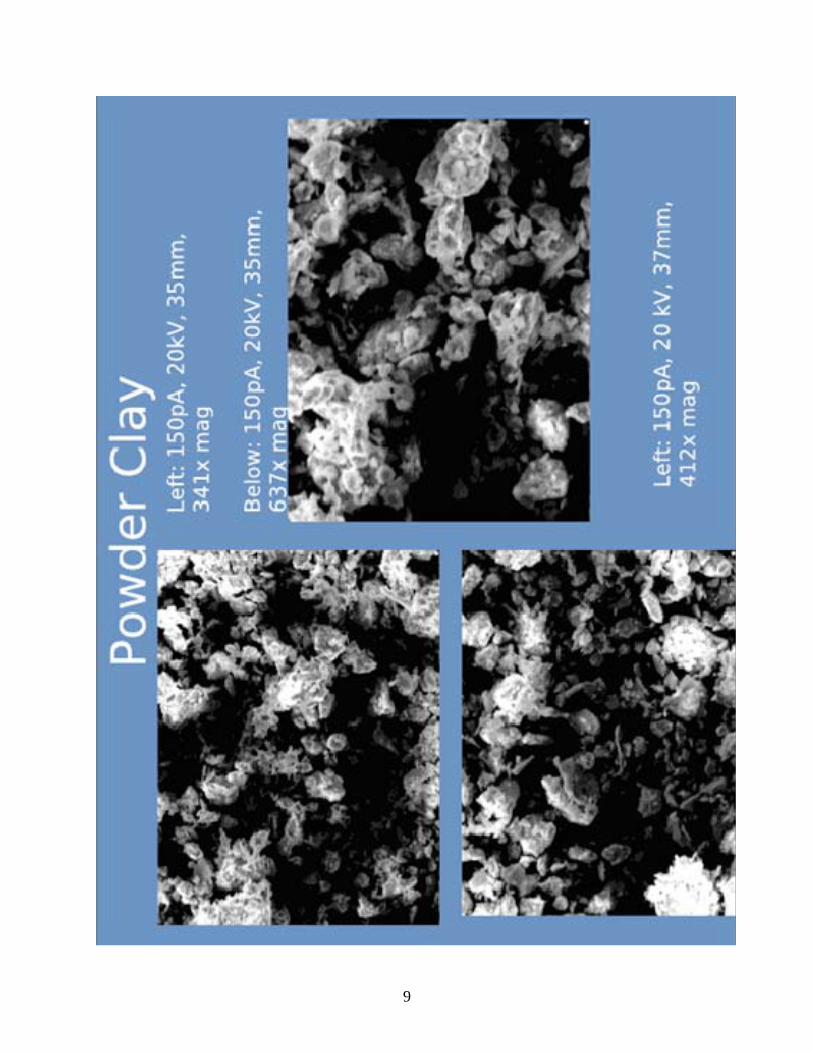
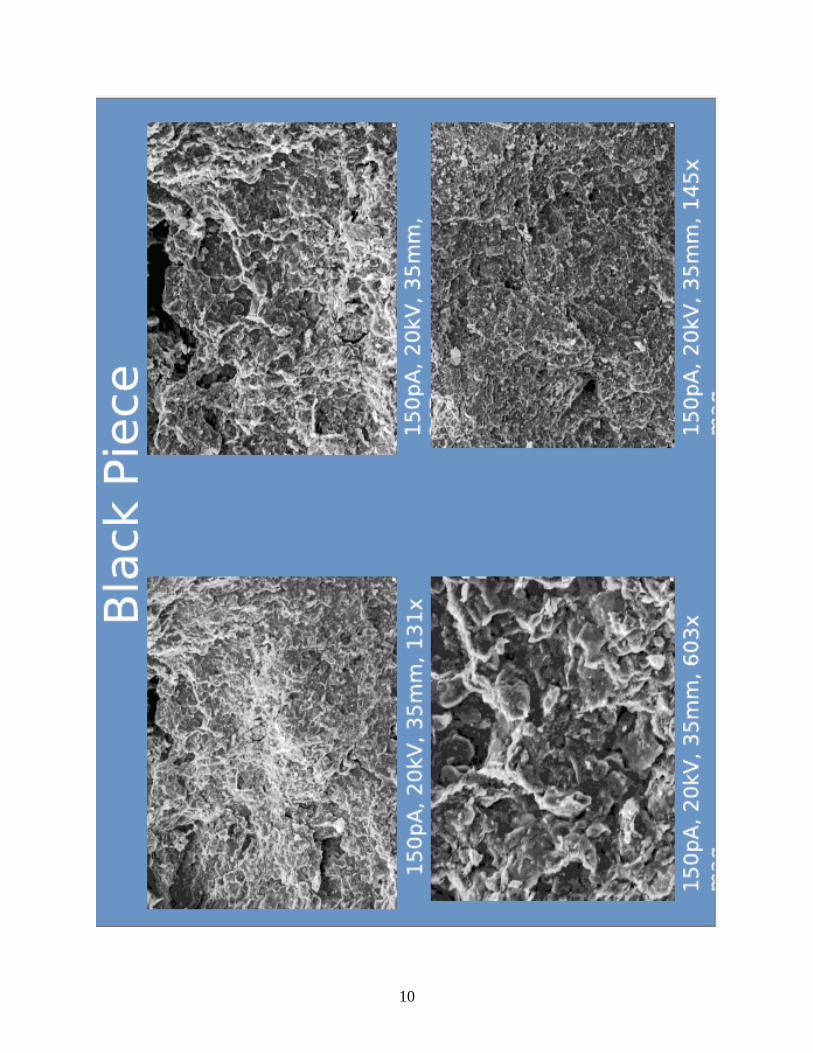
Fired filter samples were scanned using the SEM, Scanning Electron Microscope, in order to
gain a better understanding of the porosity of the filter structure (see images on pages 9 through
14). A total of four samples were tested using the SEM. Two samples were analyzed: a sample
with no trapped carbon and a sample with trapped carbon. In order to better compare the two
filter samples, an additional two samples were scanned: a sample of vitrified porcelain, fired to
6 and a sample of raw RedArt powder. Filter porosity plays a crucial role in a filtration flow
rate. According to some previous studies of the Filtron filters, the expected flow rate should be
between 1 to 2 liters per hour (Duke, Nordin, and Mazumder 2). It would be desirable to have a
slightly higher filtration flow rate, however, that may raise the question of whether the filtration
rate, and the removal of harmful bacteria and viruses, remains successful as well.
Results
Four different filters from each batch were tested for filtration flow rate. They were tested on
two days. The first day of testing was on December 10, 2009 (see Diagram 3). Filters 2, 5, D,
and the sample filter were all tested.2 The filtering started at 9:30 a.m. In one hour, filter 2 did
not drain any water. However, filter 5 filtered 0.25 liters and the sample filter filtered 0.5 liters.
Filter D, the filter with sand and trapped carbon, filtered the most in an hour with 1.5 liters. On
day two, filter D again filtered 1.5 liters in one hour (see Diagram 4). The results of the sample
filter were also the same as on the first day. However, the results for filters 2 and 5 improved;
filter 2 drained 0.75 liters and filter 5 filtered 0.5 liters. The SEM, Scanning Electron
Microscope, uses a beam of electrons to scan the surface of the sample being tested.3 The SEM

7
allows high-resolution images to be taken at high magnification; this ensures that the quality of
the image’s resolution is greater. To test the porosity of the filters a piece of clay, from a filter
without trapped carbon, was cut down so that it would be small enough for the SEM to scan. The
same process was also followed for a piece of filter with trapped carbon. Redart powder was
also tested using a piece of double sided tape. The images below (from pages 9 to 14) depict the
porosity of each tested sample.
0.00
0.50
1.00
1.50
2.00
2.50
3.00
3.50
#5 #2 D S ample
F ilter
December 10, 2009 TrialL iters After 1 Hour
December 10, 2009 TrialL iters After 2 Hours
0.00
0.50
1.00
1.50
2.00
2.50
3.00
3.50
4.00
#5 #2 D S ample
F ilter
December 11, 2009 TrialL iters After 1 Hour
December 11, 2009 TrialL iters After 2 Hours
Diagram 3
Diagram 4

8
Conclusion
Since the filtration flow rate increased for some of the filters on the second day a conclusion was
made that the filters need to be saturated first before they can drain properly and effectively.
And especially because Filtron filters are soaked in colloidal silver diluted with water. So pre-
soaking is an important step before testing the filtration flow rate.
From the SEM high-resolution images, the conclusion has been made that trapped carbon does in
fact aid in the filtration-rate of the water. A filter without carbon (see pages 12 and 13) has a
sparse amount of pores. However, a filter with carbon (see pages 10 and 11) has more obvious
pores. Whether or not a filter with trapped carbon collects more bacteria or some pesticides is
currently in the process of being tested.
In conclusion, Redart clay has good properties for filter production. Mixed with sawdust or sand
it can further enhance the quality of the Filtron filter.
9
10

11
12

13

14
15
Acknowledgement Tim Martin and Sam Brown, Miami University, Oxford, Ohio Peter Chartrand, Board Director of Potter’s for Peace Dr. Laura Tuhela-Reuning and Kelly Haines, Ohio Wesleyan University, Delaware, Ohio Works Cited Duke, William F., Rick Nordin, and Asit Mazumder. Comparative Analysis of the Filtron and Biosand Water Filters. University of Victoria, Restoration of Natural Systems Program and Department of Biology. Feb. 5, 2009. <http://pottersforpeace.org/wp-content/uploads/comparative_analysis_of_the_ fltron_and_biosand_water_filterseditms.pdf> "Finding Clay for Your Pits." THE QUOIT PITS. The Quoit Pits Website, 1999. Web. 15 Feb. 2010. <http://www.quoits.info/clay/clay.html>.
1 The filters that were fired in the second firing were made by two volunteers from Miami University, in Oxford, Ohio, Tim Martin and his colleague Sam Brown. 2 Filters 2, 5, and D were all filters that were made during a Potter’s for Peace workshop that took place at Ohio Wesleyan University, from September 2nd through September 4th, 2009. The sample filter refers to the filter that Peter Chartrand, Board Director of Potter’s for Peace, brought with him for the workshop. 3 The services of the Scanning Electron Microscope were provided by Ohio Wesleyan University’s SEM Technician, Dr. Laura Tuhela-Reuning, and her assistant Kelly Haines.