Embed Size (px)
Citation preview

Graduate Theses, Dissertations, and Problem Reports
2005
Analysis of red spruce (Picea rubens) regeneration in Pocahontas, Analysis of red spruce (Picea rubens) regeneration in Pocahontas,
Randolph, and Tucker counties, West Virginia Randolph, and Tucker counties, West Virginia
Adam W. Rollins West Virginia University
Follow this and additional works at: https://researchrepository.wvu.edu/etd
Recommended Citation Recommended Citation Rollins, Adam W., "Analysis of red spruce (Picea rubens) regeneration in Pocahontas, Randolph, and Tucker counties, West Virginia" (2005). Graduate Theses, Dissertations, and Problem Reports. 1616. https://researchrepository.wvu.edu/etd/1616
This Thesis is protected by copyright and/or related rights. It has been brought to you by the The Research Repository @ WVU with permission from the rights-holder(s). You are free to use this Thesis in any way that is permitted by the copyright and related rights legislation that applies to your use. For other uses you must obtain permission from the rights-holder(s) directly, unless additional rights are indicated by a Creative Commons license in the record and/ or on the work itself. This Thesis has been accepted for inclusion in WVU Graduate Theses, Dissertations, and Problem Reports collection by an authorized administrator of The Research Repository @ WVU. For more information, please contact [email protected].

Analysis of Red Spruce (Picea rubens) Regeneration in Pocahontas, Randolph, and Tucker
Counties, West Virginia.
Adam W. Rollins
Thesis submitted to the Davis College of Agriculture, Forestry, and Consumer Sciences
at West Virginia University in partial fulfillment of the requirements
for the degree of
Master of Science In
Forestry
Ray R. Hicks, Jr., Ph.D., Chair James S. Rentch, Ph.D. David W. McGill, Ph.D.
Division of Forestry Morgantown, West Virginia
2005
Keywords: red spruce, Picea rubens, regeneration, West Virginia

Abstract
Analysis of Red Spruce (Picea rubens) Regeneration in Pocahontas, Randolph, and Tucker
Counties West Virginia.
Adam W. Rollins
The red spruce forest type of eastern North America is a unique, remnant ecosystem from
the last glaciations. The present-day stands represent the result of extended climate change,
regional natural disturbances and intense anthropogenic influences. The red spruce forest type
has considerable ecological and economical importance, despite a limited distribution. Studies
have documented red spruce experiencing declining health, vigor, and radial growth as well as
high mortality rates. As a result, the red spruce forests have been described as experiencing a
forest decline. Pollution, biotic stresses, climate change and natural stand dynamics are some of
the hypotheses advanced to explain this phenomenon, however to date no general consensus has
been reached.
Three red spruce communities in the Central Appalachians of West Virginia were
accessed temporally over a period of 10 to 11 years and by forest zones (i.e. hardwood, ecotone,
red spruce zones). These communities experienced an increasing density of red spruce over time
across all forest zones. Red spruce was successfully establishing and expanding across the
ecotone into the hardwood forest zone. The greatest increase of red spruce was seen in the more
disturbed and earlier successional sites, whereas the less disturbed red spruce community
experienced the least change. The red spruce populations in this study were thriving and
increasing the density of red spruce seedlings, advanced regeneration and trees across the spruce-
hardwood ecotone as well as under the surrounding hardwood canopy. Red spruce seedling
densities were found to be greater with increased cover of bryophytes and coarse woody debris,
while densities are reduced with increasing cover of Dryopteris spp.

iii
Acknowledgments
I thank Dr. Steve Adams of Dabney S. Lancaster Community College, Virginia and Dr.
Steve Stephenson of the University of Arkansas for allowing me the opportunity to use their
historical data in conjunction with the permanent study sites. Their generosity and professional
careers have set the standard, which I strive to follow. I thank my wife, Virginia “Jenni” Rollins
for her countless hours of fieldwork and moral support throughout the duration of this project.
Jenni you kept me going even when I did not want to, thank you. Thanks are also extended to
Dr. George Seidel for assisting me with various aspects of the statistical analysis. I thank my
advisor Dr. Ray R. Hicks Jr., for taking me in, and giving me a chance to study forest ecology.
You have mentored me both professionally and personally and I will continue to work up to your
level of commitment and expertise. I thank my remaining committee members Dr. James Rentch
and Dr. Dave McGill. I have enjoyed studying under you and getting to know you. Your
commitment to research and excellence serves as an inspiration to me. Thank you for all your
help, suggestions, and patience.

iv
Table of Contents
Abstract ........................................................................................................................................... ii Acknowledgments.......................................................................................................................... iii Table of Contents........................................................................................................................... iv List of Tables .................................................................................................................................. v List of Figures ................................................................................................................................ vi List of Figures ................................................................................................................................ vi Chapter 1. Introduction .................................................................................................................. 1 Chapter 2. Objectives..................................................................................................................... 3 Chapter 3. Literature Review......................................................................................................... 4
Characteristics of Red Spruce..................................................................................................... 4 Red Spruce Regeneration............................................................................................................ 4
Seed Production and Dispersal ............................................................................................... 4 Germination ............................................................................................................................ 5 Seedlings ................................................................................................................................. 5
Distribution of the Red Spruce-fir Forest ................................................................................... 6 Quaternary History of the Spruce Forests................................................................................... 8 Early Spruce Forests ................................................................................................................... 9 Destruction of the Spruce Forests ............................................................................................. 12 Present Condition of Red Spruce in the Central Appalachians ................................................ 13 Spruce Decline .......................................................................................................................... 14
Chapter 4. Methods...................................................................................................................... 16 Chapter 5. Results ........................................................................................................................ 27
Current Site Conditions............................................................................................................. 27 Temporal Patterns Across Sites and Transects ......................................................................... 39 Trends by Forest Zone. ............................................................................................................. 52
Present condition of forest zones .......................................................................................... 52 Temporal Patterns: Red Spruce Zone ................................................................................... 57 Temporal Patterns: Ecotone Zone......................................................................................... 61
Chapter 6. Discussion .................................................................................................................. 69
Current Site Conditions............................................................................................................. 69 Temporal Patterns in Red Spruce Across Sites and Transects ................................................. 74 Trends by Forest Zones............................................................................................................. 75 Temporal Patterns by Forest Zone............................................................................................ 75 Conclusions............................................................................................................................... 77
Literature Cited ............................................................................................................................. 79

v
List of Tables
Table 1. Overview of Red Spruce Study Sites originally established by Adams and.................................................16 Stephenson (1994) in West Virginia............................................................................................................................16 Table 2. Daubenmire Cover Class Scheme .................................................................................................................24 Table 3. Summary of tree stratum data for Turkey Run, (2003). ...............................................................................28 Table 4. Summary of Tree Stratum Data for McGowan Mountain, 2004. .................................................................30 Table 5. Summary of Tree Stratum Data for Cranberry, 2004. ..................................................................................33 Table 6. Sapling stratum by species at Turkey Run, 2003..........................................................................................35 Table 7. Sapling stratum by species at McGowan Mountain, 2004. ..........................................................................35 Table 8. Sapling stratum by species at Cranberry, 2004.............................................................................................36 Table 9. Summary of shrub stratum. ..........................................................................................................................36 Table 10. 2003, 2004 Seedling densities, stems per hectare; (importance values) by site..........................................37 Table 11. 2003, 2004 Percent ground cover by site....................................................................................................38 Table 12a. Red spruce tree stratum variable means for the ANOVA by forest zone. Means with different letters
indicate statistical significance...........................................................................................................................53 Table 12b. Hardwood species tree stratum variable means for the ANOVA by forest zone. Means with different
letters indicate statistical significance. ...............................................................................................................54 Table 13. Sapling variables for ANOVA by forest zone (all sites combined) showing mean values. Means with
different letters indicate statistical significance.. ...............................................................................................55 Table 14. Seedling variable means (all size classes combined) for the ANOVA by forest zone. Means with different
letters indicate statistical significance. ...............................................................................................................56 Table 15a. Red spruce tree stratum variable means for the ANOVA for the red spruce zone, first survey to last
survey. Means with different letters indicate statistical significance. ...............................................................57 Table 15b. Hardwood species tree stratum variable means for the ANOVA for the red spruce zone, first survey to
last survey. Means with different letters indicate statistical significance..........................................................58 Table 16. Sapling variable means for the ANOVA for the red spruce zone, first survey to last survey. Means with
different letters indicate statistical significance. ................................................................................................59 Table 17. Seedling variable means (size classes pooled) for the ANOVA for the red spruce zone, first survey to last
survey. Means with different letters indicate statistical significance. ...............................................................60 Table 18a. Red spruce tree stratum variable means for the ANOVA for the ecotone zone, first survey to last survey.
Means with different letters indicate statistical significance..............................................................................61 Table 18b. Hardwood species tree stratum variable means for the ANOVA for the ecotone zone, first survey to last
survey. Means with different letters indicate statistical significance. ...............................................................62 Table 19. Sapling variable means for the ANOVA for the ecotone zone, first survey to last survey. Means with
different letters indicate statistical significance. ................................................................................................63 Table 20. Seedling variable means (size classes pooled) for the ANOVA for the ecotone zone, first survey to last
survey. Means with different letters indicate statistical significance. ...............................................................63 Temporal Patterns: Hardwood Zone............................................................................................................................64 Table 21a. Red spruce tree stratum variable means for the ANOVA for the hardwood zone, first survey to last
survey. Means with different letters indicate statistical significance. ...............................................................65 Table 21b. Hardwood tree stratum variable means for the ANOVA for the hardwood zone, first survey to last
survey. Means with different letters indicate statistical significance. ...............................................................66 Table 22. Sapling variable means for the ANOVA for the hardwood zone, first survey to last survey. Means with
different letters indicate statistical significance. ................................................................................................67 Table 23. Seedling variable means (size classes pooled) for the ANOVA for the hardwood zone, first survey to last
survey. Means with different letters indicate statistical significance. ...............................................................67 Table 24. Site summaries for all species and for red spruce from the 2003 – 2004 samples......................................70 Table 25. Presence (1) – Absence (0) of tree species at the three sites.......................................................................71

vi
List of Figures
Figure 1. The range of red spruce (USGS 1999). .........................................................................................................8 Figure 2. Location of the Turkey Run study area in Tucker County, West Virginia...................................................18 Figure 3. Location of the McGowan Mountain study area in Randolph County, West Virginia. ..............................20 Figure 4. Location of the Cranberry study area in Pocahontas County, West Virginia..............................................22 Figure 5. Basic Plot Design ........................................................................................................................................23 Figure 6. Diameter distribution graph for all species and dbh classes at Turkey Run 2003.......................................29 Figure 7. The percent contribution by species to the small diameter classes (≤ 8 cm class) left, ................................29 and the large diameter classes (> 8 cm class); right, Turkey Run 2003.......................................................................29 Figure 8. Diameter distribution graph for all species and dbh classes at McGowan Mountain 2003.........................31 Figure 9. The percent contribution by species to the small diameter classes (≤ 8 cm class) left, and the large diameter
classes (> 8 cm class); right, McGowan Mountain, 2004. .................................................................................32 Figure 10. Diameter distribution graph for all species and dbh classes at Cranberry 2004........................................34 Figure 11. The percent contribution by species to the small diameter classes (≤ 8 cm class) left, and the large
diameter classes (> 8 cm class); right, Cranberry site 2004. ..............................................................................34 Figure 12. The temporal pattern of red spruce density for all zones pooled (trees ≥ 2.5 cm).....................................40 Figure 13. The temporal pattern of hardwood density for all zones pooled (trees ≥ 2.5 cm). ....................................40 Figure 14. The temporal pattern of red spruce relative density for all zones pooled (trees ≥ 2.5 cm)........................42 Figure 15. The temporal pattern of hardwoods relative density for all zones pooled (trees ≥ 2.5 cm).......................42 Figure 16. The temporal pattern of red spruce relative basal area for all zones pooled (trees ≥ 2.5 cm). ..................43 Figure 17. The temporal pattern of hardwoods relative basal area for all zones pooled (trees ≥ 2.5 cm). .................43 Figure 18. The temporal pattern of red spruce importance values for all zones pooled (trees ≥ 2.5 cm). ..................44 Figure 19. The temporal pattern of hardwood importance values for all zones pooled (trees ≥ 2.5 cm)....................44 Figure 20. The temporal pattern of red spruce sapling densities for all zones pooled................................................46 Figure 21. The temporal pattern of hardwood sapling densities for all zones pooled. ...............................................46 Figure 22. The temporal pattern of importance values for red spruce saplings for all zones pooled.........................48 Figure 23. The temporal pattern of importance values of hardwood saplings for all zones pooled. ..........................48 Figure 24. The temporal pattern of red spruce seedling densities for all size classes and forest zones combined. ....50Figure 25. The temporal pattern of hardwood seedling densities for all size classes and forest zones combined......50 Figure 26. The temporal pattern of importance values for red spruce seedlings for all size classes and forest zones
combined............................................................................................................................................................51 Figure 27. The temporal pattern of importance values for hardwood seedlings for all size classes and forest zones
combined............................................................................................................................................................51 Figure 28. Relationship of percent ground cover to red spruce seedling density. ......................................................68 Figure 29. Diameter Distributions for all Species by Site. Turk = Turkey Run, McG =...........................................72 McGowan Mountain; Cran = Cranberry Site. .............................................................................................................72 Figure 30. The change in the relative density of red spruce over time by forest zone. Bars with different letters
indicate the change was statistically significant.................................................................................................77

Chapter 1. Introduction
Red spruce (Picea rubens) is the most characteristic tree composing the Appalachian red
spruce or spruce-fir forest type. The red spruce-fir forest type is a unique and fragile ecosystem
of eastern North America. In the central Appalachians these spruce forests are remnants from
the last glaciation, which created climatic conditions currently associated with more northerly
latitudes. Present-day stands represent the result of extended climate change, regional natural
disturbances, and intense anthropogenic influences. Despite the limited distribution and extent
of the red spruce-fir forest type it exerts considerable ecological and economical impact. The
spruce forest type, particularly in the central and southern Appalachians, provides habitat to
various rare and endangered flora and fauna. The shallow root systems of red spruce stabilize the
soils in turn protecting watersheds. Red spruce is valued for timber and paper products. The red
spruce-fir forest type is also noted for its aesthetic value, which ultimately supports tourism.
Red spruce is distributed from the maritime provinces of Canada, extending south along
the highest elevations of the Appalachian Mountains. Red spruce is commonly associated with a
fir (Abies spp.) component throughout its natural range, which accounts for the name “spruce-fir
forest type”. Balsam fir (Abies balsamea) is associated with red spruce across its northern range,
while Fraser fir (Abies fraseri) serves as a co-dominant with red spruce in its southern extension.
The fir component is generally absent in central Appalachian red spruce stands with the
exception of a few isolated stands in wetlands.
The spruce-fir forests of northern and southern North America have frequently been a
focal point for recent and past research. The spruce forests of the central Appalachians have
received relatively less attention. Nevertheless, studies across the northeast have raised
considerable concern about the overall health and future of the spruce-fir forest type of eastern
North America. Studies have documented an apparent health decline and a subsequent vigor
reduction in red spruce in high elevation stands. In some areas, high rates of red spruce mortality
have been observed. Dendroecological studies have documented significantly reduced rates of
radial growth in red spruce. The balsam woolly adelgid (Adelges piceae) has practically
eliminated the adult Frasier fir populations of the southern Appalachians. The effects of this
infestation on the dynamics of the southern spruce-fir forest are presently only speculative. The
red spruce-fir forests have been described as experiencing a general “forest decline” in relation to
1

the combination of these factors. Several hypotheses have been proposed to explain this forest
decline phenomenon. Pollution, biotic stresses, climate change, and natural stand dynamics have
all been offered as explanations however, no general consensus has been reached. These
concerns have prompted many questions about the management and future of the spruce-fir
forest type.
The spruce forests of the Central Appalachians are less extensive, often limited to small
mountaintop stands as a result of being replaced by hardwoods after the extensive logging and
subsequent fires of the late 1800’s and early 1900’s. The regeneration present at a site provides
an important indication regarding the future composition of a forest stand. Obviously, if a
species is unable to produce viable seed and seedlings, it is unlikely that it will be present in the
future stand. The majority of past studies have focused on the red spruce of the overstory
stratum. The decline of red spruce has raised concern about its possible replacement by
aggressive hardwood species from the forests surrounding the spruce forest type. This could be
especially true if climatic warming is driving this decline. Studies are necessary to determine
whether red spruce stands are advancing, retreating, or remaining static in the face of these
problems. The assessment of red spruce regeneration is an essential element for determining
whether the red spruce forest type can persist in the face of an apparent decline.
2
Chapter 2. Objectives
The primary goal of this study was to re-examine red spruce regeneration across three
Central Appalachian sites in West Virginia approximately 10 – 11 years after the sites were
originally examined by Adams and Stephenson (1994). The sites were examined on temporal and
spatial scales to draw inference as to whether the spruce forest type is expanding, remaining
static, or retreating. The following objectives were addressed to explore this question.
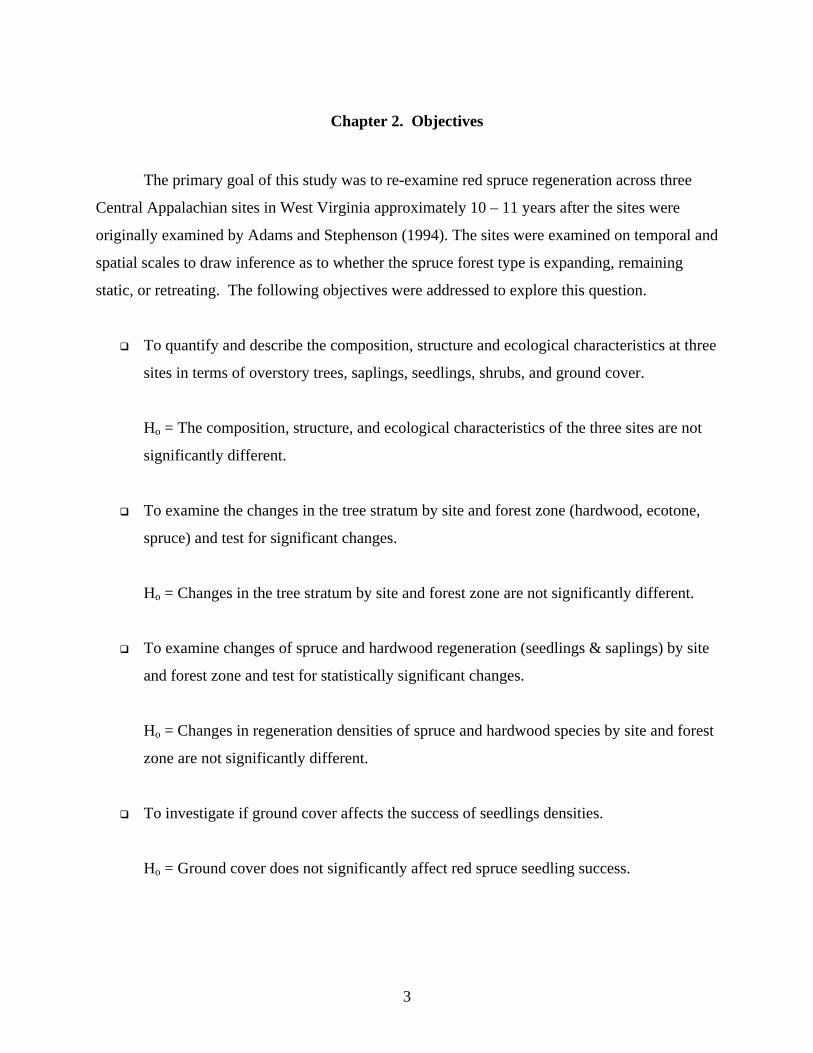
To quantify and describe the composition, structure and ecological characteristics at three
sites in terms of overstory trees, saplings, seedlings, shrubs, and ground cover.
Ho = The composition, structure, and ecological characteristics of the three sites are not
significantly different.
To examine the changes in the tree stratum by site and forest zone (hardwood, ecotone,
spruce) and test for significant changes.
Ho = Changes in the tree stratum by site and forest zone are not significantly different.
To examine changes of spruce and hardwood regeneration (seedlings & saplings) by site
and forest zone and test for statistically significant changes.
Ho = Changes in regeneration densities of spruce and hardwood species by site and forest
zone are not significantly different.
To investigate if ground cover affects the success of seedlings densities.
Ho = Ground cover does not significantly affect red spruce seedling success.
3

Chapter 3. Literature Review
Characteristics of Red Spruce Red spruce (Picea rubens) is a medium-sized shade-tolerant evergreen tree that is best
suited to cool moist conditions. It produces a shallow root system that spreads laterally
protecting soils from erosion. Throughout its range red spruce is commonly associated with
acidic soils such as Spodosols, Inceptisols and, less frequently, Histosols. Red spruce grows in a
pH range between 4 and 5.8 (USDA, NRCS. 2004). The growth rate of red spruce is best
characterized as medium. Mature trees may achieve an average diameter of 30 to 61cm. Red
spruce grows to a height of 18 to 23 m in the north, and can reach a height of 35 m in the
southern Appalachians (Burns and Honkala, 1990). The bark of red spruce is thin therefore trees
are subject to severe damage from fire. The needles and sap produced by red spruce are also
flammable. This species can realize a lifespan of up to 400 years.
Red Spruce Regeneration
Seed Production and Dispersal
Red spruce can begin to produce seed as young as 15 years of age (Frank and Bjorkbom,
1973) however, good seed production does not usually occur until the tree is at least 30 years old
(USDA, NRCS. 2004). The actual age an individual tree produces seed is determined by various
site conditions. Once an individual reaches the canopy, the crown can receive direct sunlight and
thicken, setting the stage for quality seed production. In dense, even-aged stands robust seed
crops may not occur until the trees are up to 50 years old (Korstian, 1937). Vigorous trees
produce good seed crops at a frequency of 3 to 8 years.
The seeds of red spruce are small (139,000 / lb), lightweight, and winged making them
well adapted for wind dispersal. Red spruce seeds fall 1.2 m per second in still air (Burns and
Honkala, 1990). The effective range of seed dispersal is 61 meters (Frank and Bjorkbom, 1973).
Hughes and Bechtel (1997) investigated spruce seedfall into a clearcut. The greatest
concentration of spruce seeds was found at 25-30 meters from the forest edge. After 30 meters
4

the number of spruce seeds was reduced but remained fairly constant to the forest edge. Red
spruce cones mature in the early fall and seeds drop throughout the late fall and winter.
Germination
Seeds on the forest floor may retain their viability for approximately one year, therefore
no seedbank strategy is employed. Red spruce seeds typically germinate during the spring
following their dispersal, although some seeds may germinate in the fall shortly after they are
released. It is unlikely that fall germinals will survive the winter. During a good seed year, 60 to
80 percent of the seeds are viable, however in poor years seed viability is markedly decreased
(Korstian, 1937). Greenwood and McConville (2002) found red spruce germination rates
ranging from 33% – 83% across two temperature regimes with no water stress. Their study
revealed that red spruce germination rates were best under 20°C days and 10°C nights.
Germination is epigeal and can occur on almost any medium. The single most important factor
in influencing the germination of red spruce seedlings is an adequate moisture supply (Burns and
Honkala, 1990). Mineral soil maintains adequate moisture levels while sustaining moderate
temperatures making it a superb medium for red spruce germination. Litter and humus are less
suitable because they are hotter and more susceptible to desiccation (Frank and Bjorkbom,
1973). The presence of bryophytes on the forest floor indicates adequate moisture is available to
support red spruce regeneration. Baldwin (1933) found red spruce regeneration to be more
abundant on north and east facing exposures. He believed this corresponded to greater protection
from the direct rays of the sun and wind.
Seedlings
Ultimately, the success of red spruce regeneration is dependent more on the survival of
seedlings than on their requirements for germination (Frank and Bjorkbom, 1973). The substrate
upon which red spruce germinates will affect the success of its establishment. Red spruce that
germinates on leaf litter is unlikely to become established. The small fibrous roots of red spruce
are often not capable of penetrating the litter layer. In addition, these individuals are likely to
succumb to water stress once the litter layer dries. Seedlings that germinate on a bed of moss
are more likely to be successful. The moss provides an adequate supply of moisture for the
5

developing seedling. In addition, bryophyte mats may provide red spruce seedlings with a
source of nutrients such as P, N, Fe, K, Ca and Mg (Dibble et al., 1999).
Red spruce seedlings may be considered established once they obtain a height of 15.2 cm
(Frank and Bjorkbom, 1973). Seedling establishment is best under the cover of a canopy in light
intensities as low as 10% of full sunlight. However, after a red spruce seedling becomes
established it obtains optimal growth under light conditions of 50% or of full sunlight. Red
spruce can persist in the understory stratum for an extended period of time and maintain the
ability to respond favorably to release. Red spruce has reportedly responded favorably to release
even after 145 years of suppression (Burns and Honkala, 1990).
Distribution of the Red Spruce-fir Forest
The red spruce-fir forest type occurs from the maritime provinces of Canada and extends
southward along the highest peaks of the Appalachian Mountains. The Appalachian spruce-fir
forest type is primarily composed of two dominant tree species, red spruce (Picea rubens) and a
fir (Abies) component. Balsam fir (Abies balsamea) constitutes the fir component in the northern
expression of this forest type. Fraser fir (Abies fraseri) occupies this role in southern
communities. The Appalachian spruce-fir forest type can be subdivided based on the occurrence
of the fir constituent. This broad grouping results in three geographic areas (Figure 1), the
northern, central, and southern Appalachian spruce-fir forest zones.
The northern Appalachian spruce-fir forest type occurs north of Pennsylvania and
extends into Canada, encompassing approximately 42° - 47° N latitude (Figure 1). The northern
Appalachian spruce-fir forest is composed of two dominant trees, red spruce (Picea rubens) and
Balsam fir (Abies balsamea). The southern Appalachian spruce-fir area covers 35° - 37° N
latitude and is expressed on the highest peaks of extreme southern Virginia, Tennessee and North
Carolina. Fraser fir (Abies fraseri) occurs in the southern spruce-fir communities. The southern
spruce-fir community reaches it northernmost limit in southwestern Virginia on Mt. Rogers
(Stephenson and Adams, 1984; Rheinhardt and Ware, 1984).
The central Appalachian spruce forest type ranges from 37° - 42° N latitude, and is
mainly concentrated on the highest peaks of Virginia and West Virginia. The central
Appalachian spruce type is dominated by red spruce (Picea rubens). In West Virginia red spruce
6
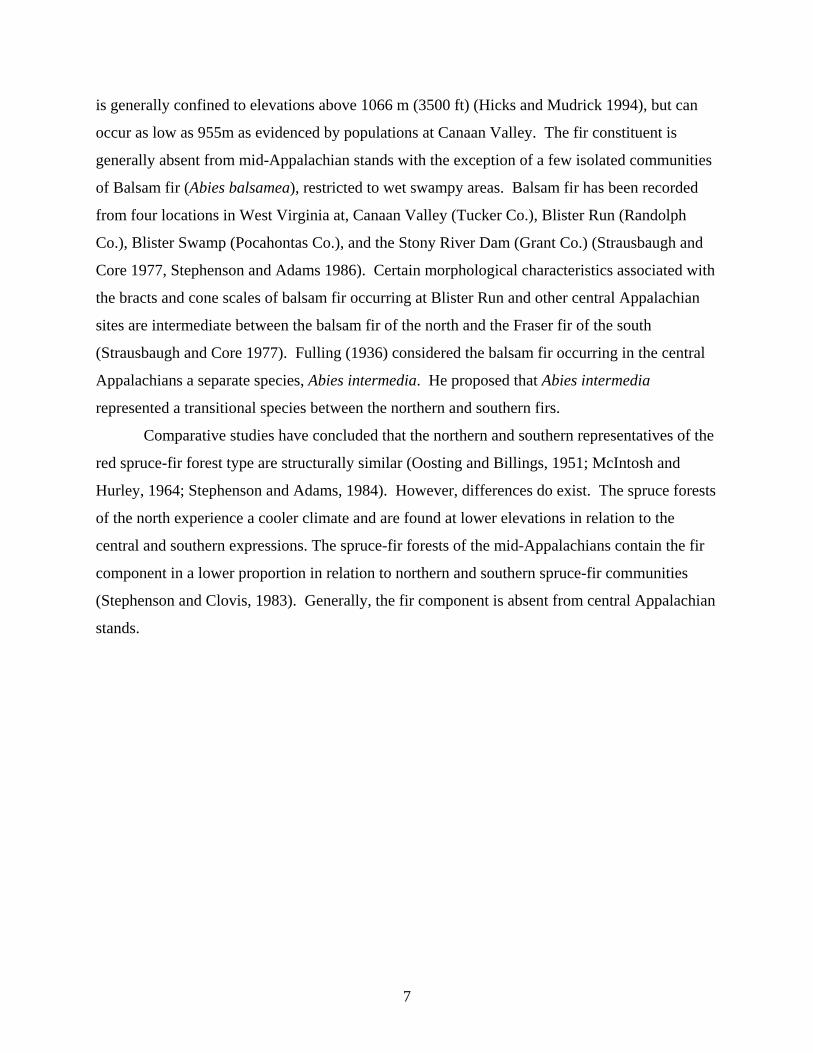
is generally confined to elevations above 1066 m (3500 ft) (Hicks and Mudrick 1994), but can
occur as low as 955m as evidenced by populations at Canaan Valley. The fir constituent is
generally absent from mid-Appalachian stands with the exception of a few isolated communities
of Balsam fir (Abies balsamea), restricted to wet swampy areas. Balsam fir has been recorded
from four locations in West Virginia at, Canaan Valley (Tucker Co.), Blister Run (Randolph
Co.), Blister Swamp (Pocahontas Co.), and the Stony River Dam (Grant Co.) (Strausbaugh and
Core 1977, Stephenson and Adams 1986). Certain morphological characteristics associated with
the bracts and cone scales of balsam fir occurring at Blister Run and other central Appalachian
sites are intermediate between the balsam fir of the north and the Fraser fir of the south
(Strausbaugh and Core 1977). Fulling (1936) considered the balsam fir occurring in the central
Appalachians a separate species, Abies intermedia. He proposed that Abies intermedia
represented a transitional species between the northern and southern firs.
Comparative studies have concluded that the northern and southern representatives of the
red spruce-fir forest type are structurally similar (Oosting and Billings, 1951; McIntosh and
Hurley, 1964; Stephenson and Adams, 1984). However, differences do exist. The spruce forests
of the north experience a cooler climate and are found at lower elevations in relation to the
central and southern expressions. The spruce-fir forests of the mid-Appalachians contain the fir
component in a lower proportion in relation to northern and southern spruce-fir communities
(Stephenson and Clovis, 1983). Generally, the fir component is absent from central Appalachian
stands.
7
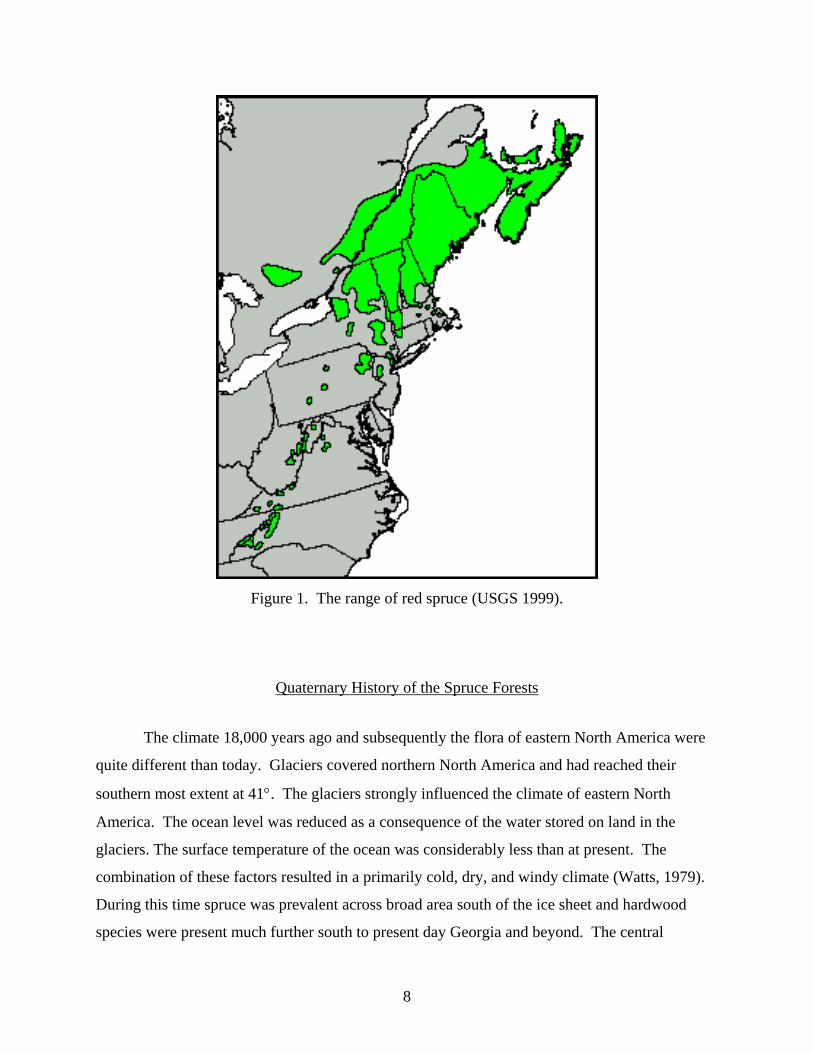
Figure 1. The range of red spruce (USGS 1999).
Quaternary History of the Spruce Forests
The climate 18,000 years ago and subsequently the flora of eastern North America were
quite different than today. Glaciers covered northern North America and had reached their
southern most extent at 41°. The glaciers strongly influenced the climate of eastern North
America. The ocean level was reduced as a consequence of the water stored on land in the
glaciers. The surface temperature of the ocean was considerably less than at present. The
combination of these factors resulted in a primarily cold, dry, and windy climate (Watts, 1979).
During this time spruce was prevalent across broad area south of the ice sheet and hardwood
species were present much further south to present day Georgia and beyond. The central
8
Appalachians were dominated by tundra conditions at this time. When the ice sheet began to
retreat the spruce populations generally flowed the ice sheet. During the period of 12000 to 8000
years ago spruce populations experienced a general decline in extent. The present day
distribution of spruce was in place approximately 6000 years ago when the ice sheet was almost
completely gone (Jacobson et al. 1987).
Watts (1979) examined pollen cores from Cranberry Glades in West Virginia. His data
suggested 18000 years ago the area was a treeless tundra zone dominated by sedges. A forest
dominated by Picea, Pinus, and Abies was evidenced in the pollen record 12000 years ago.
Shortly after this Tsuga appeared and increased dramatically after establishment. Tsuga’s arrival
was accompanied by Ostrya, Tillia, Juglans, Quercus, and Fagus. Tsuga dominated the period
from 10000 to 6000 years before present, which correlates with the warmest period of the
Holocene. During this warm period Picea pollen dropped and almost disappeared from the
pollen record, suggesting that the warm climate drove it away from the immediate vicinity of the
bog and to higher elevations. Following the end of this warm period Tsuga experienced a sharp
decline from 4800 to 4600 years before present. The near loss of Tsuga from the area was
attributed to disease rather than the climate change. The Tsuga decline resulted in an increase of
Picea, as well as Betula, and Acer saccharum. The removal of Tsuga from the canopy must have
allowed Picea to expand its range from the mountains as well as releasing Betula and Acer,
which are all common constituents of present day stands in the general area.
Early Spruce Forests Little is known about the spruce forests that existed when the first Europeans arrived in
North America. Forest inventories or scientific studies documenting the structure and
composition of these forests are lacking. Most of our knowledge comes from the travelogues
and articles of early explorers, which are based largely on personal observations without any
strict sampling regime. Early logging records and personal accounts from lumbermen who
worked in these forests serve to provide additional insight to these early forests. However, care
must be taken when interpreting these early accounts. Allard and Leonard (1952) consulted
loggers who worked in these early spruce forests in their attempt to reconstruct the conditions of
9

these early stands. They pointed out that the information provided by these loggers was mainly
about the “practical aspects of logs and lumber” without much insight concerning the ecology or
specific flora of these forests. Clarkson (1964) noted that various aspects of early articles and
travelogues were “amusingly exaggerated”. In addition, Bailey and Ware (1990) point out that
in early logging operations hemlock (Tsuga spp.) was often recorded as spruce and as a result
early logging records citing spruce do not necessarily indicate Picea.
However, early sources leave little doubt the virgin spruce forests were quite impressive.
Large, towering trees formed a thick dense canopy allowing little light to penetrate producing a
dark forest interior. Cool, moist air often supported a misty fog. Giant trees that had succumbed
to old age or windthrow littered the ground. A plush cover of bryophytes carpeted the rocky
forest floor and fallen trees. Immense Rhododendron thickets rendered some areas virtually
impassable. The characteristics of these forests evoked lore of ill-fated adventures into them.
The red spruce of these virgin forests were large magnificent trees reaching heights up to
120 feet and attaining diameters of four feet. The largest of the spruce boasted diameters six feet
or greater and could yield five 16-foot logs (Clarkson, 1964). Red spruce reportedly formed
extensive, essentially pure, stands at the highest elevations. In the lower elevations of its range,
red spruce dominated the canopy interspersed by various hardwoods. Trees associated with
these early forests included, balsam fir (Abies balsamea), eastern hemlock (Tsuga canadensis),
yellow birch (Betula alleghaniensis), sugar maple (Acer saccharum), white ash (Fraxinus
americana), basswood (Tilia americana), wild cherry (Prunus serotina), and beech (Fagus
grandifolia) (Allard and Leonard, 1952).
Little information exists, concerning the assemblages of trees that composed the
understory stratum of the early spruce forests. Low light conditions associated with mature
undisturbed spruce forests suggest a non-diverse, species depauperate understory stratum. Allard
and Leonard (1952) noted that the following species were common on the logged and burned
over spruce lands and may have been a minor constituent of the pre-disturbance understory. The
list includes, pin cherry (Prunus pensylvanica), choke cherry (Prunus virginiana), quaking aspen
(Populus tremuloides), large-toothed aspen (Populus grandidentata), striped maple (Acer
pensylvanicum) and mountain maple (Acer spicatum). The silvical characteristics, particularly
shade intolerance, and seed characteristics of theses species makes it likely that they were
important in forest gaps following disturbances such as windthrow. Their position in the forest
10

was likely temporary until spruce was able to fill the gaps. Shade tolerant species occurring in
the overstory, such as red spruce, balsam fir (on wet swampy soils), sugar maple, yellow birch,
and American beech (Fagus grandifolia) were probably more prevalent in the sparse understory
of a mature undisturbed spruce stand.
The shrub stratum of the early spruce forest was likely sparse and low in diversity,
although more diverse shrub assemblages were likely associated with disturbed areas. Great
rhododendron (Rhododendron maximum) was undoubtedly a common constituent of the shrub
stratum in the early spruce forests, and apparently formed vast, virtually impenetrable thickets,
which could cover a considerable area. One of these thickets was said to average eight to ten
feet in height or more (Allard and Leonard, 1952). These great rhododendron “hells” inspired
stories of hunters that went in too far, becoming entangled or lost, never to return.
Not surprisingly, little information is available describing the flora in the forest floor of
pre-settlement red spruce forests. The forest floor stratum was likely simple, consisting of
various bryophytes, lycopodia, and a few flowering plants that could withstand the dense shade.
A thick wet mat of various bryophytes, particularly Sphagnum, and liverworts such as Bazzania
was likely a consistent feature of the forest floor. Loggers who worked in these early forests
noted a deep humus layer mixed with forest debris while Sphagnum and other mosses formed a
constant ground cover (Allard and Leonard, 1952). References cited by Clarkson (1964) support
this moss covering as well as the occurrence of Lycopodium. In addition, it was noted that
flowering plants were not common with the exception of mountain wood sorrel (Oxalis
montana) and Trillium spp. Accounts compiled from Allard and Leonard (1952) cite the
occurrence of plants common to more northern latitudes including, small cranberry (Vaccinium
oxycoccos), creeping snowberry (Gaultheria hispidula), hairy New York aster (Symphyotrichum
novi-belgii), nerveless woodland sedge (Carex leptonervia), panicled bulrush (Scirpus
microcarpus) black girdle bulrush, (Scirpus atrocinctus), yellow marsh marigold (Caltha
palustris), and Jack in the pulpit (Arisaema triphyllum). They also noted several species of
perennial woody vines including grape vine (Vitus sp.), Virginia creeper (Parthenocissus
quinquefolia), poison ivy (Rhus radicans), and greenbriers (Smilax sp.).
11

Destruction of the Spruce Forests
Estimates of West Virginia’s spruce forests of the 1700’s range from 200,000 to 600,000
hectares, whereas present day estimates indicate between 17,500 to 44,500 hectares remain
(Mayfield, 1997). The most recent report (Griffith and Widmann 2003) estimates 9,600 hectares
of the red spruce forest type remain in West Virginia in 2000. Clearly the extent of spruce forests
in the mid-Appalachians has been considerably reduced over the past two centuries. Logging
and subsequent fires decimated the bulk of the original spruce forests of the mid-Appalachians.
The practice of hacking was popular in spruce stands prior to the Civil War. Farmers bought
large tracts of spruce lands, girdled the trees, and then set fire to clear the brush and fallen timber
in order to make pasture land. A period of large-scale logging began in 1870 and ended during
the late 1920’s. During this period more than 30 billion board feet of lumber was removed from
the mountains of West Virginia. Red spruce was recognized as the most valuable tree in the
Allegheny Mountain section of West Virginia (Clarkson, 1964). It was prized for both pulpwood
and lumber, which led to its exploitation. As a result red spruce stands were often cut very
heavily or clearcut leaving considerable slash behind. The slash dried and served as a fuel
source. The fires typically killed any residual trees and these dead trees served as fuel for
additional fires that followed (Korstian, 1937). The fires often destroyed any regeneration
present and burned the organic humus layer down to the mineral soil. Frequent rains associated
with these areas quickly eroded any remaining soil leaving nothing but exposed rock. Sites
subjected to this degree of degradation have been observed to remain treeless and unproductive
60 or more years later (Eagar and Adams, 1992). The fires of this logging era were often
unintentional. They were often the result of an escaped campfire or sparks from the wood and
coal burning engines of the trains, skidders and loaders that were used to log the forest
(Clarkson, 1964).
Hardwood species frequently came back in areas that had been cut and burned over.
Initially, a site would become occupied by dense thicket of blackberry and raspberry briers. Pin
cherry and yellow birch would quickly rise up and dominate the site. Korstian (1937) found that
12

pin cherry would typically persist for 15 to 20 years, at which time it would give way to yellow
birch and other hardwood species. The northern hardwood covertype now occupies many areas
that were once occupied by the red spruce forest type. Griffith and Widmann (2003) reported
that the northern hardwoods forest type occupied 968,700 hectares in West Virginia.
Present Condition of Red Spruce in the Central Appalachians
Present-day central Appalachian red spruce populations exist as relatively small
communities restricted to the highest mountain peaks. In some instances red spruce forms
almost pure stands that cap the mountaintops. In general, red spruce exists in conjunction with a
various admixture of hardwood species. It is estimated that as of 2000 the spruce forest type
covered approximately 9,600 hectares in West Virginia. The national forest contains 69 % of the
red spruce forest type and the remaining 31 % is privately owned. Seventy-five percent of this
area is classified as fully stocked, while 21% is poorly stocked and the remaining 4% is
overstocked (Griffith and Widmann 2003). The red spruce forest type contains the greatest
growing stock volume per acre of any forest covertype in West Virginia. The red spruce
growing stock is estimated at 2042.3 ft3/ac, while the next most productive forest type is the
northern hardwoods at 1722.5 ft3/ac (Hicks and Mudrick 1994).
Pauley (1989) surveyed second growth spruce stands in West Virginia. He reported red
spruce basal area (stems > 2.5cm) at 33.4 m2/ha with a density of 1215 stems per hectare.
Yellow birch, red maple, mountain ash (Pyrus americana), black cherry, mountain holly (Ilex
montana), American birch and eastern hemlock were also recorded in the tree stratum. The basal
area for all species pooled was 38.8 m2/ha with a density of 1755 stems per hectare. Pauley’s
results collaborated with a preceeding survey of second growth spruce stands in West Virginia
(Stephenson and Clovis 1983) which also found yellow birch and red maple to be common
associates in the red spruce forest type. Basal area and densities of red spruce were not reported
in that study, however the total density of stems >2.5cm for all species was reported to be 1580
stems per hectare, which is similar to that found by Pauley. Adams and Stephenson (1989)
surveyed old growth spruce forests at four locations in the central Appalachians. They reported
basal areas for all species (stems > 2.5cm) ranging from 35.3 to 46.2 m2/ha and densities of 855
13

to 1410 stems per hectare. They recorded sapling densities ranging from 515 to 4660 stems per
hectare, while seedling densities ranged from 0 to 53000 stems per hectare.
The stand dynamics of red spruce forests of the eastern United States are dominated by a
wind throw disturbance regime. The windthrow of older trees and individual tree mortality are
the main occurrences creating mainly small forest gaps (Eagar and Adams, 1992). These
openings release advanced regeneration persisting on the forest floor. The extreme shade
tolerance and long lifespan of red spruce allows it to persist in the understory for a considerable
period of time as a result it may eventually reach the canopy in response to a disturbance event
(Fajvan and Seymour, 1993). Wu et al. (1999) found that 72% of the canopy red spruce stems
underwent an average of 1.43 (up to a maximum of 7) suppression episodes before reaching the
canopy. These suppressions events lasted 19.05 years on average.
Spruce Decline
The red spruce-fir forests have been described as experiencing a “forest decline”. Studies
have documented declining health and vigor in red spruce, which prompted concern about the
health and future of the spruce-fir forest type. Studies reported relatively high rates of mortality
among red spruce particularly in the north. Siccama et al (1982) reported approximately a 50%
decrease in red spruce density and basal area over 15 years. Scott et al (1984) reported a
reduction of red spruce basal area by 60% to 70% from the early 1960’s to 1982. Mielke et al
(1986) reported that 33% of West Virginia’s red spruce volume was in dead or declining trees.
Silver et al (1991) reported a significant increase in the number of dead red spruce trees from
26.1% to 36.7 % over a five-year period. Tritton and Siccama (1990) surveyed several forest
types occurring in the eastern United States and found the spruce forest type contained the
highest percentage of dead trees ranging from 11% to 43% dead stems. These trends for red
spruce were not evident in southern populations however the balsam woolly adelgid has
devastated adult fir populations of the south (Smith and Nicholas, 1998).
Further research documented unexplainable reduced radial growth trends in red spruce.
Red spruce basal area in New England stands followed an increasing trend until around 1960,
then they experienced declining trend to of 13% to 40% below it peak by 1980 (Hornbeck and
Smith 1985). In addition, Adams et al (1985) found that spruce trees in the central Appalachians
14

were experiencing a growth-trend decline, which initiated in the late 1960’s and had not
recovered by the time of their survey. A more recent survey (Schuler et al. 2002) of West
Virginia red spruce reveled this growth decline phenomenon from 1930 to 1990. However, since
that time period the growth rates have stabilized. This reduced growth-trend phenomenon has
also been observed in southern red spruce stands, however the degree of decrease was less and
began about 5 to 10 years later.
Various hypotheses have been proposed to account for this forest decline phenomenon.
Pollution, biotic stresses, climate change, and natural stand dynamics have all been offered as
explanations however, no general consensus has been reached. McLaughlin et al. (1987)
proposed climate change as a driving factor. Johnson et al. (1988) proposed that climate
variations in particular drought coincided with this and historic red spruce declines. Hamburg
and Cogbill (1988) further proposed that a trend of increasing mean annual and mean annual
summer temperatures were driving this spruce decline event. Other studies suggest that pollution
in the form of acid rain and subsequent heavy metal deposition, aluminum toxicity, and calcium
depletion play important roles (McLaughlin et al. 1990, Geballe et al. 1990). Roth and Fahey
(1998) found that acid precipitation altered the composition of the ectomycorrhizal community.
The effects of this are not certain at this time. Further studies have found that some variable may
be predisposing red spruce to winter injury and serves as an impetus to weaken spruce. Some
evidence suggests that elevated ozone and radiation heating may lead to greater winter damage
(Hadley and Amundson 1992, Waite et al 1994). Additional research suggests that the stress
encountered by red spruce crowns exposed to strong winds reduces radial growth and may play a
role in this spruce decline phenomenon (Harrington 1986, LeBlanc 1990, LeBlanc and Raynal
1990). The exact cause of spruce decline is not understood, however it is likely a complex
interplay between these and various other factors.
15

Chapter 4. Methods
Three locations in West Virginia were included in this study. These are referred to as the
McGowan Mountain site located in Randolph county, the Turkey Run site in Tucker county, and
the Cranberry site in Pocahontas county (Table. 1). The sites are situated in the central
Appalachian mountains of West Virginia. Adams and Stephenson (1994) originally established
these study areas to assess and monitor the ecotone between the hardwood and spruce forest
types.
Table 1. Overview of Red Spruce Study Sites originally established by Adams and Stephenson (1994) in West Virginia.
Site Elev (m) Aspect Slope (%) # Plots Date Established Years Sampled Oldest RS Turkey Run 1,134 10° (N) 5 10 1992 92, 93, 94, 95,03 193 McGowan 1,158 90° (E) <5 7 1993 93, 94, 95, 97,00,04 67 Cranberry 1,341 20° (N) 25 7 1994 94, 95, 96,04 204
The Turkey Run transect was established by Adams and Stephenson (1994) in 1992 in
Tucker County, West Virginia. The site sets atop McGowan Mountain in the Fernow
Experimental Forest. The Fernow Experimental Forest is part of the Monogahela National
Forest system and is bordered by the Otter Creek Wilderness Area (Figure 2). This transect is set
along a northern aspect (10° azimuth) and attains an elevation of 1,134 meters. The transect
exhibits a slight 5% slope and is thus fairly flat.
Turkey Run is part of the Pottsville Geological formation of the Allegheny Mountain
section of the Appalachian Plateau. Exposed geological substrata are mostly Paleozoic rocks
composed of sand stone layers and coal-bearing strata. (Adams and Stephenson 1989). The soils
are generally sandy loams and clay loams (Korsitan 1937). These soils are shallow and highly
acidic as a result of the geology, organic matter degradation, and acidic deposition in the area
(Missel 1999). Climate and weather data does not exist for this specific site. Limited data
collected by Darlington (1943) from Cranberry Glades in Pocahontas County provides an idea of
16
basic conditions. Mean annual precipitation is 130cm, while the average annual temperature is
5.5°C. Hicks and Mudrick (1994) reported that elevations supporting spruce populations receive
178cm per year and realize a mean January temperature of –2.2°C
Information detailing the long-term history of this stand is lacking. The Elk Lick Lumber
Company and the Otter Creek Boom and Lumber company operated in the general area between
1897 and 1916 (Clarkson, 1964). It is likely that a large portion of the general area was subject
to timber operations and possibly subsequent fires that were common during this time. The
oldest tree in the study area was determined to be 193 years of age using annual ring count. This
suggests that if the stand had been logged it may have only been subjected to a partial harvest.
Some of the trees show signs of past fire damage. The remnants of Hurricane Hugo in 1989
resulted in a major windthrow event at Turkey Run. The majority of the large red spruce as well
as other species were toppled creating large canopy gaps. This has provided an excellent
opportunity to study whether the spruce or hardwoods are regenerating in the gap.
17

Figure 2. Location of the Turkey Run study area in Tucker County, West Virginia.
The McGowan Mountain transect was established by Adams and Stephenson (1994) in
1993 in Randolph County, West Virginia (Figure 3). McGowan Mountain is in the Fernow
Experimental Forest, a part of the Monogahela National Forest system, and is bordered by the
Otter Creek Wilderness Area. The site has an eastern aspect of 90°. The McGowan Mountain
18

transect is perched at an elevation of 1,158 meters. The transect is relatively level with a slope
less than 5%. The soils, geologic strata, and climate data are the same as described for Turkey
Run.
Similarly there exists no detailed information concerning the long-term history of this
specific stand, although as noted above, the Elk Lick Lumber Company and the Otter Creek
Boom and Lumber company were also active in this area between 1897 and 1916. The average
age of this stand is the youngest of the three study areas. The oldest tree in this stand is 67 years
old. This fact certainly suggests that this stand was produced by a major disturbance such as
logging and possibly the fires that commonly follow logging operations of this time. Missel
(1999) proposed that the area was logged and hardwoods such as pin cherry and red maple
established in the area for a period of approximately 28 years until the spruce was able to
reestablish and form the present day stand.
19

Figure 3. Location of the McGowan Mountain study area in Randolph County, West Virginia.
20

The Cranberry site was established by Adams and Stephenson (1994) in 1994. The site is
located along the Scenic Highway, US Route 150, in the Cranberry Wilderness (Figure 4). The
Cranberry transect has a north aspect with a 20° azimuth. This transect is located at the highest
elevation of the three study sites at 1,341 meters and the transect runs on a moderate slope of
25%. This is the steepest of the three sites. The soils, geologic strata, and climate data are the
same as described for Turkey Run.
As with the other two, no direct information exists detailing the long-term history of the
stand. The Cranberry Wilderness area was logged extensively during the turn of the century.
The spruce of the area were generally cut heavily or clearcut. Large portions of the general area
burned over quite extensively. This is evidenced by areas near the site that at present have failed
to be reclaimed by forest and are composed of barren rock and sparsely scattered trees. The
stand sampled appears to have escaped the fate of these surrounding areas. The site is composed
of sizable spruce trees, the oldest determined to be 204 years of age.
21

Figure 4. Location of the Cranberry study area in Pocahontas County, West Virginia.
This study utilized transects previously established transects by Adams and Stephenson
(1994). Permanent belt transects were established so that the plots extend through the hardwood-
spruce ecotone represented at each site. A transect consisted of a series of contiguous quadrats.
22

The quadrats are 10 x 10 m squares, thus delimiting an area of 100 m2. The corners of the
individual quadrats were marked with permanently driven steel stakes (Figure 5).
10 m
10 m Plot 3 (quadrat) spruce zone
Plot 2 (quadrat) ecotone zone
Plot 1 (quadrat) hardwood zone
Figure 5. Basic Plot Design
The general aspect of each transect was determined with a compass. The slope of each
transect was attained by a clinometer sighting. When the plots were originally installed trees
with a diameter at breast height (DBH) greater than or equal to 2.54 cm had been marked with
permanent metal tags at their base. The position of these trees were mapped and their diameters
were measured at DBH. Trees were determined to species and measured at DBH. Dead trees
were also recorded. Each quadrat was divided into four 5x5 m subplots and sapling densities
were recorded in each subplot. Saplings were designated as stems with a diameter measuring
less than 2.54 cm, which had attained a height greater than or equal to 1.0m tall. Saplings were
identified to species and recorded in their respective plots. Stem densities of shrubs were
determined fore each species and recorded in one randomly predetermined 5x5 m subplot within
each quadrat. Seedlings were determined to species and classified into four classes, (1.)
23

germinal (recently germinated), (2.) <10 cm, (3.) 10 cm to 0.25 m tall, and (4.) 0.25 m to 1 m
tall. Seedling densities were counted in two 1m x 1m (a total area of 2.0 m2) predetermined
randomly selected subplots from each quadrat. Ground cover was determined in the same two
randomly predetermined 1x1 meter subplots used to count seedling densities. Ground cover of
herbaceous plants, bryophytes, coarse woody debris, rocks and bare ground (exposed soil) were
determined according to the Daubenmire cover class value system (Table. 2).
Table 2. Daubenmire Cover Class Scheme Cover Class Estimated % Cover
1 Trace-5% 2 5-25% 3 25-50% 4 50-75% 5 75-95% 6 95-100%
The tree and seedling data were examined on a plot-by-plot basis and pooled by site.
This provided an overall description of each site, which allowed each location to be compared
and contrasted with the others. This analysis permitted a comparison of the overall trends for red
spruce at each site. The data from each site were also grouped and analyzed by cover type
classification (i.e. hardwoods, ecotone, spruce). This provided the basis to examine the spatial
dynamics occurring at each site. Comparing results of the original inventories with the current
data allowed me to determine whether red spruce was expanding its range, remaining static, or
retreating. Finally, the data from all sites were pooled. The GENMOD procedure in the SAS
software system was used to fit generalized linear models to the pooled data to search for
correlations between red spruce regeneration and various site variables from the overstory, and
understory strata.
Since the study sites had been previously sampled at several intervals by Adams and
Stephenson (1994), the data collected from each year permitted me to examine the temporal
dynamics occurring at each site. The change at each study area was evaluated over an
approximate ten-year span. The Turkey Run site was analyzed from 1992 to 2003, an eleven-
24

year span. The McGowan Mountain transect was be assessed over eleven years from 1993 to
2004 and the Cranberry site was examined from 1994 to 2004, a ten year span.
Basic per plot calculations of basal area (m2 and m2/ha), as well as trees per hectare were
performed. Diameter distributions by species using four-centimeter classes were constructed to
show the structure of the tree stratum. The relative density (RD) by species was calculated as
follows:
100*/#
/.#⎟⎟⎠
⎞⎜⎜⎝
⎛=
hastemstothaAsppstemsRD
The relative basal area (RBA) by species was calculated by the following equation:
100*/
./⎟⎟⎠
⎞⎜⎜⎝
⎛=
HaBAtotAspphaBARBA
Species level importance value indices were constructed by the following equation:
2RBARDIV +
=
The Shannon-Wiener Diversity Index (H’) was calculated by the following equation.
( )ii
s
ippH ln'
1∑=
−=
Pi is the portion of importance of the ith species, in this case 100IVpi = .
In addition, Pielou’s eveness index will be computed as follows.
( )SHE
ln'
=
H’ is the Shannon-Wiener diversity index. S is species richness, simply the number of different
species present.
The data for the saplings were simply multiplied by the appropriate expansion factor and
stems/ha were calculated by species and totaled for each year the site was surveyed. The
seedling data were calculated in terms of stems/ha by species, and size class, then totaled for
each year. Similarly, the shrub strata densities (stems/ha) were tabulated by species and totaled
for each year. Relative density was used as a measure of importance for saplings, seedlings, and
shrubs (see below). ANOVA was used to test for any statistically significant changes over time
or across sites.
25

100*/#
./⎟⎟⎠
⎞⎜⎜⎝
⎛=
haStemstotASpphaStemsIV
The ground cover estimate was determined by the Daubenmire cover class value method.
Each cover category was assigned a ranking from 1 to 6. The cover class values were then
converted to the midpoint value from each class (Table 3). The arithmetic mean is then
calculated across each cover category providing the percent cover estimate for that category.
The variables of interest were calculated for each plot and these means were used for the
analysis. Site, forest zone, and year were used as class variables. The proc GLM function in the
SAS software system was used to perform the analysis of variance (ANOVA). This procedure
uses the least squares to fit general linear models. The Duncan’s new multiple range test (LSD
function) was used when significant differences were present to determine which treatments
were statistically significant. The interactions of site, forest zone, year, site * year, site * forest
zone, and site * forest zone * year were investigated. The proc GENMOD function of the SAS
software system was used to look for correlations between the percent ground cover and the
density of red spruce seedlings (all size classes combined). This procedure fits generalized linear
models that allow the mean of the population to depend on a linear predictor by the use of a
nonlinear link function. The Poisson distribution was used for this prediction procedure. The
mean density of seedlings for each site and each year were analyzed against the percent cover
means for each site and year.
26

Chapter 5. Results
Current Site Conditions
The following site descriptions summarize the most recent inventory (2003 – 2004) of the
complete transect at each site. The plot designations of hardwood, ecotone, and red spruce zones
are ignored. This provides a general snapshot of the complete transitional area from hardwood
dominance to spruce dominance present at each site. Summarizing the data in this manner
provides an opportunity to assess the overall temporal patterns occurring at each site. A more
detailed analysis of the forest cover types at each site will be examined in subsequent sections.
Ten species were present in the tree stratum at Turkey Run (Table 3). Based on the
transect data it was estimated that 2470 trees/ha were present in the stand yielding a basal area of
42.99 m2/ha. Calculated importance values revealed that red spruce (Picea rubens) (32.9),
American beech (Fagus grandifolia) (20.8), yellow birch (Betula lenta) (14.2), and red maple
(Acer rubrum) (11.7) were the most important species composing the tree stratum. These were
all the species with importance values equal to or greater than ten, and they accounted for 75.0%
of the total basal area and 84.2% of the stems tallied for the site. Red spruce was present at the
highest density, accounting for 53.0% of the total stems (1310 stems/ha). Yellow birch
contributed the greatest basal area (9.81 m2/ha) accounting for 22.8% of the total basal area for
the site.
Striped maple (Acer pennsylvanicum) (7.1), red oak (Quercus rubra) (4.8), black cherry
(Prunus serotina) (4.6), and eastern hemlock (Tsuga canadensis) (3.1) were minor “less
important” stand constituents at the Turkey Run site. Striped maple was the most abundant of
this group with 270 stems/ha (10.9% of the total stems). Red oak (8.3% of the total basal area)
and black cherry (8.4 % of the total basal area) yielded the highest basal area of this group with
3.57 m2/ha and 3.63 m2/ha respectively. Serviceberry (Amelanchier arborea) and cucumber
magnolia (Magnolia acuminata) were present, however they did not appear to represent an
important constituent at the site.
27

Table 3. Summary of tree stratum data for Turkey Run, (2003). Basal Area Density Relative Relative
Species m2/ha trees/ha Density Basal Area IV red spruce 5.51 1310 53.0 12.8 32.9 American beech 8.11 560 22.7 18.9 20.8 yellow birch 9.81 140 5.7 22.8 14.2 red maple 8.83 70 2.8 20.5 11.7 striped maple 1.43 270 10.9 3.3 7.1 red oak 3.57 30 1.2 8.3 4.8 black cherry 3.63 20 0.8 8.4 4.6 e. hemlock 1.78 50 2.0 4.1 3.1 serviceberry 0.24 10 0.4 0.6 0.5 cuc. magnolia 0.08 10 0.4 0.2 0.3
SUM 42.99 2470 100 100 100
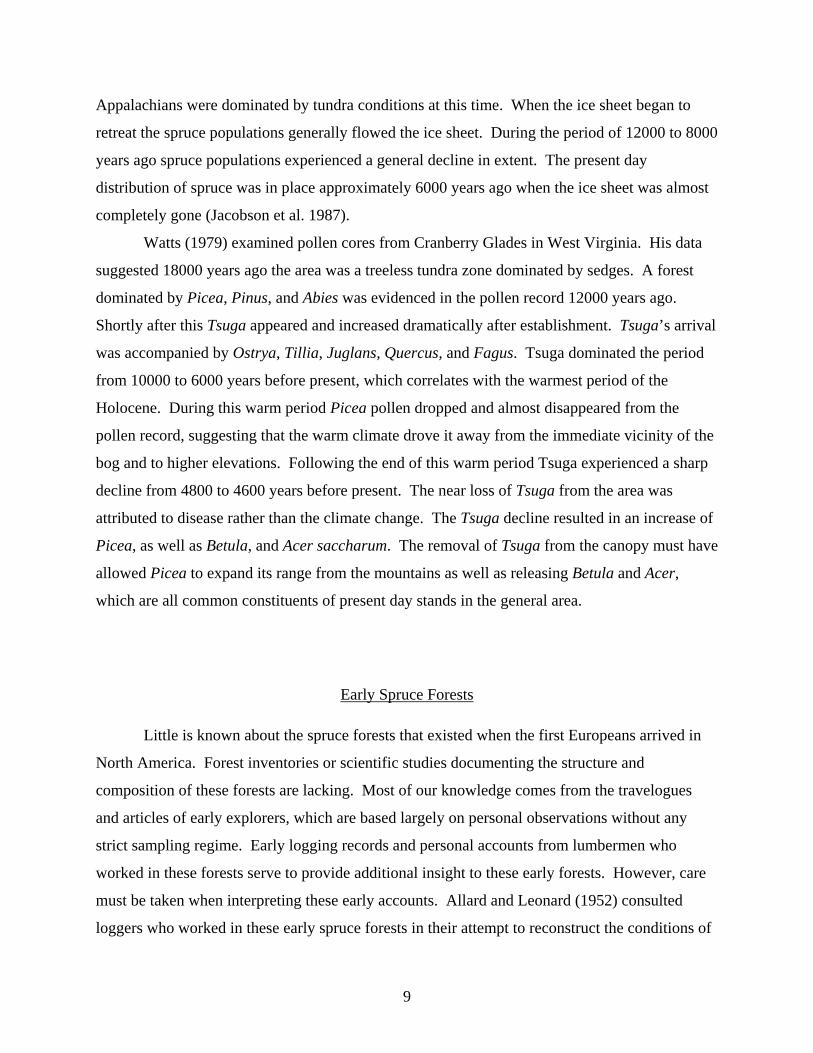
The diameter distribution graph prepared for all species and size classes revealed a
reverse J-shaped distribution (Figure 6). Small trees (≤ 8 cm class) had a density of 1940
stems/ha. The small tree class composed 78.5 % of the total stems at Turkey Run. Red spruce
and American beech were the dominant small tree species. Red spruce (1220 trees/ha) was the
most abundant of the small tree species. Red spruce accounted for 62.9% of the small stems
(Figure 7). American beech (410 stems/ha) was the second most abundant small tree species. It
accounted for an additional 21.1% of the small stems. Striped maple (230 trees/ha) composed a
noteworthy 11.9 % of the small stems present at the site. Yellow birch (40 trees/ha), eastern
hemlock (20 trees/ha), red maple (10 trees/ha), and cucumber magnolia (10 trees/ha) were
present as small stems however collectively they accounted for only 4.1% of the small stems.
Black cherry, red oak, and serviceberry were present in the tree stratum, but absent as small
stems.
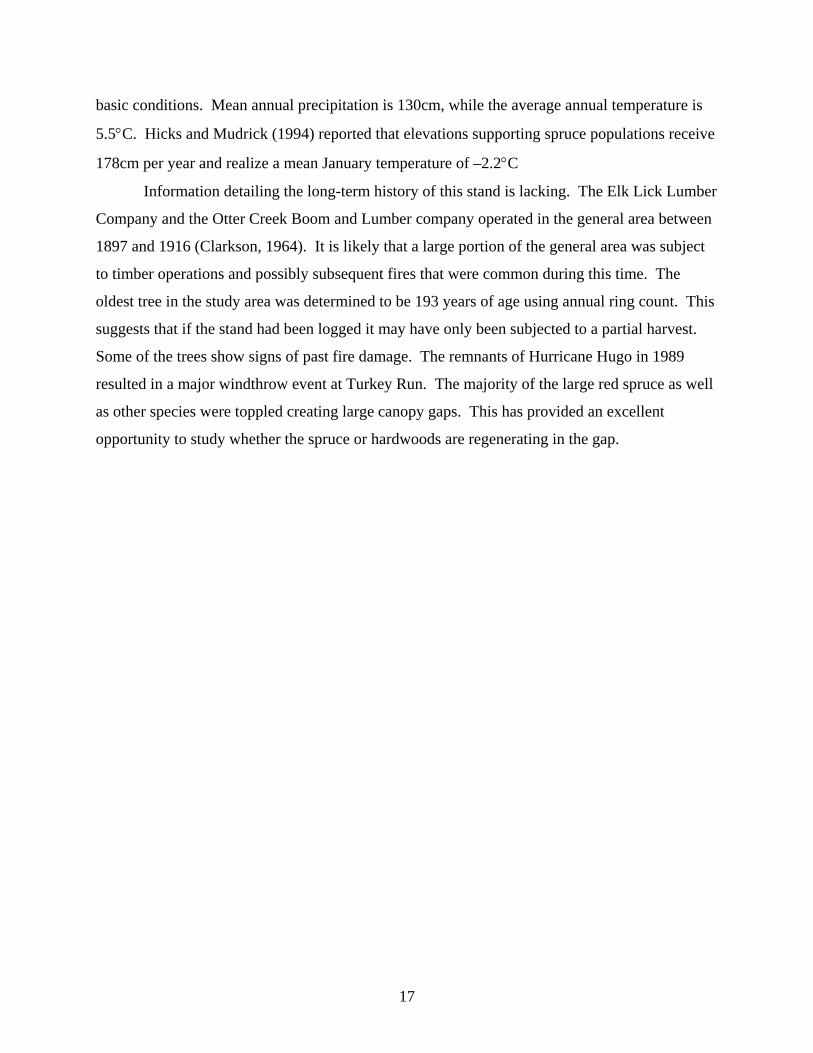
Large trees (> 8 cm class) accounted for 21.5% of the total stems at Turkey Run.
American beech (150 trees/ha) was the most abundant large tree comprising 28.3% of the large
stems (Figure 7). Yellow birch (100 trees/ha) and red spruce (90 trees/ha) made up 18.9% and
17.0% of the large stems respectively. Red maple (60 trees/ha) is responsible for an additional
11.3% of the large stems at this site. These species (American beech, yellow birch, red spruce,
and red maple) had the highest calculated importance values and also constituted 75.5% of the
large stems. The remaining species individually made up less than 10% of the large stems.
Striped maple (40 trees/ha) was the highest of these accounting for 7.5% of the large stems.
28
Eastern hemlock, red oak, black cherry and serviceberry were collectively responsible for the
remaining 17.1% of the large stems. Cucumber magnolia was present as a small tree but it was
not present as a large tree.
0
200
400
600
800
1000
1200
1400
4 8 12 16 20 24 28 32 36 40 44 48 52>54
.5
D-Class (cm)
Tree
s/Ha
Cuc. magnoliaserviceberryE. hemlockblack cherryred oakstriped maplered maple yellow birchAmerican beechred spruce
Figure 6. Diameter distribution graph for all species and dbh classes at Turkey Run 2003.
0
10
20
30
40
50
60
70
redspruce
Americanbeech
stripedmaple
yellowbirch
E.hemlock
Cuc.magnolia
red maple
0
5
10
15
20
25
30
America
n bee
ch
yello
w birch
red spru
ce
red maple
striped
map
le
E. hem
lock
red oak
black
cherr
y
servi
cebe
rry
Figure 7. The percent contribution by species to the small diameter classes (≤ 8 cm class) left,
and the large diameter classes (> 8 cm class); right, Turkey Run 2003.
29

The tree stratum at McGowan Mountain contained six species (Table 4). The stand
density was estimated to be 2257 trees/ha with a basal area of 44.85 m2/ha. Red spruce (50.9)
and red maple (40.7) were clearly the dominant species based on calculated importance values.
They were the only species that obtained importance values greater than or equal to ten.
Combined, red spruce and red maple accounted for 94.6% of the basal area and 88.6% of the
total stems tallied. Red spruce was the most abundant species accounting for 62.7% of the total
stems (1414 stems/ha) at McGowan Mountain. Red maple accounted for 55.5% of the total
basal area (24.88 m2/ha) at the site. Importance values for American beech (3.1), eastern
hemlock (2.6), yellow birch (1.7) and mountain holly (i.e. mountain winterberry; Ilex montana)
(1.1) indicated them to be minor constituents of the stand. Collectively these species only
represented 5.4% of the basal area and 11.4% of the stem density.
Table 4. Summary of Tree Stratum Data for McGowan Mountain, 2004. Basal Area Density Relative Relative
Species m2/ha trees/ha Density Basal Area IV red spruce 17.54 1414 62.7 39.1 50.9 red maple 24.88 586 25.9 55.5 40.7 American beech 1.06 86 3.8 2.4 3.1 e. hemlock 0.59 86 3.8 1.3 2.6 yellow birch 0.66 43 1.9 1.5 1.7 mt. holly 0.12 43 1.9 0.3 1.1
SUM 44.85 2257 100 100 100
The diameter distribution for all species and size classes at the McGowan Mountain site
revealed a reverse J-shaped curve (Figure 8). Small stems (≤ 8 cm class) accounted for 53.8 %
of the total stems. Red spruce (1000 trees/ha) overwhelmingly dominated the small tree class
accounting for 82.4% of small stems (Figure 9). Eastern hemlock (71 trees/ha) was the next
most abundant small stem, however it only accounted for 5.9% of the small stems. The
remaining species (red maple, American beech, mountain holly, and yellow birch) accounted for
only 11.7% of the small stems. Each of these species contributed less than 3.5% individually.
All of the species that occurred in the tree stratum were represented in the small stem classes.
30
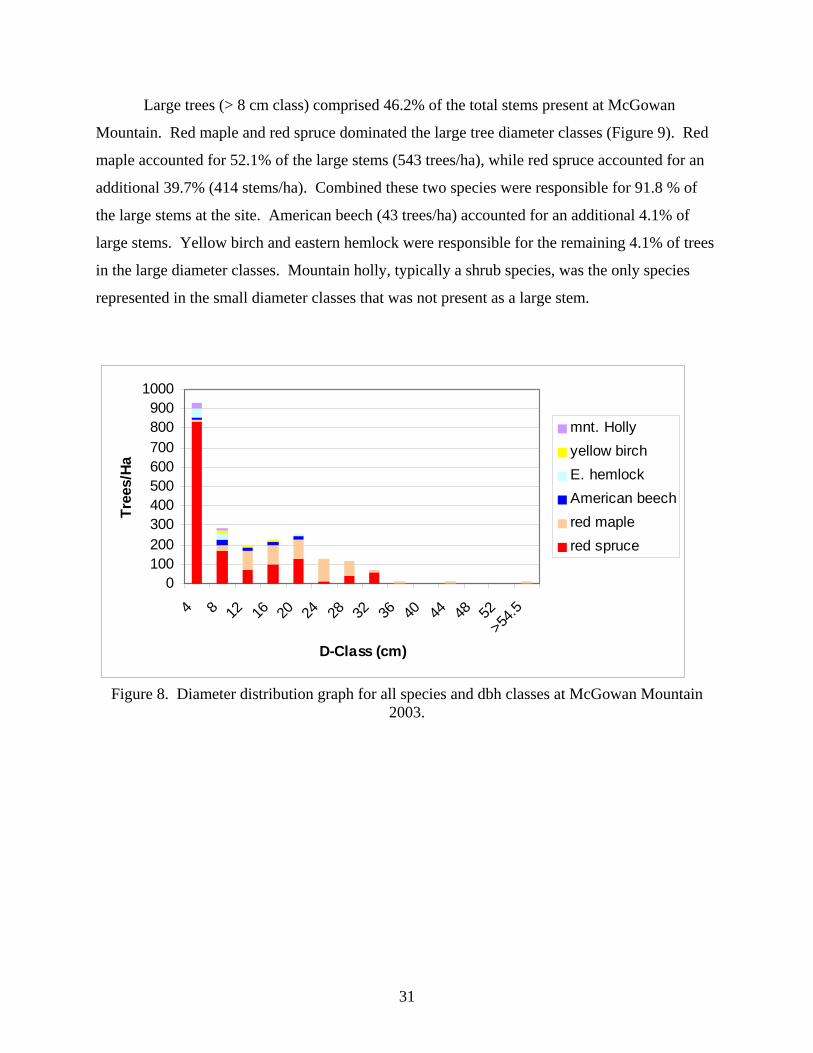
Large trees (> 8 cm class) comprised 46.2% of the total stems present at McGowan
Mountain. Red maple and red spruce dominated the large tree diameter classes (Figure 9). Red
maple accounted for 52.1% of the large stems (543 trees/ha), while red spruce accounted for an
additional 39.7% (414 stems/ha). Combined these two species were responsible for 91.8 % of
the large stems at the site. American beech (43 trees/ha) accounted for an additional 4.1% of
large stems. Yellow birch and eastern hemlock were responsible for the remaining 4.1% of trees
in the large diameter classes. Mountain holly, typically a shrub species, was the only species
represented in the small diameter classes that was not present as a large stem.
0100200300400500600700800900
1000
4 8 12 16 20 24 28 32 36 40 44 48 52>54
.5
D-Class (cm)
Tree
s/Ha
mnt. Hollyyellow birchE. hemlockAmerican beechred maplered spruce
Figure 8. Diameter distribution graph for all species and dbh classes at McGowan Mountain 2003.
31

0
10
20
30
40
50
60
70
80
90
red spruce E. hemlock Americanbeech
mnt. Holly red maple0
10
20
30
40
50
60
red maple red spruce Americanbeech
yellow birch E. hemlock
Figure 9. The percent contribution by species to the small diameter classes (≤ 8 cm class) left, and the large diameter classes (> 8 cm class); right, McGowan Mountain, 2004.
Nine species were represented in the tree stratum at the Cranberry study area (Table 5).
The stand density was 1800 trees/ha that with a basal area of 43.36 m2/ha. On the basis of
calculated importance values yellow birch (44.1) and red spruce (36.7) were the most important
species at the Cranberry site and they were the only species that had importance values greater
than or equal to ten. Together they accounted for 91.9% of the total basal area and 69.9% of the
tallied stems at the site. Red spruce had the greatest density, accounting for 43.7% of the total
stems (789 stems/ha) at the Cranberry site. Yellow birch accounted for 62.1% of the basal area
(26.91 m2/ha). American beech and striped maple were present as minor constituents of the
stand. Collectively they comprised 6.7% of the total basal area with 300 stems/ha. The remaining
species (mountain maple, red maple, mountain holly, sugar maple, and eastern hemlock)
accounted for only 1.4% of the basal area with 243 trees/ha.
32

Table 5. Summary of Tree Stratum Data for Cranberry, 2004. Basal Area Density Relative Relative
Species m2/ha trees/ha Density Basal Area IV yellow birch 26.91 471 26.2 62.1 44.1 red spruce 12.91 786 43.7 29.8 36.7 American beech 2.50 129 7.1 5.8 6.5 striped maple 0.37 171 9.5 0.9 5.2 mt. maple 0.22 86 4.8 0.5 2.6 red maple 0.22 71 4.0 0.5 2.2 mt. holly 0.11 43 2.4 0.2 1.3 sugar maple 0.02 29 1.6 0.0 0.8 e. hemlock 0.10 14 0.8 0.2 0.5
SUM 43.36 1800 100 100 100
The diameter distribution for all species and diameter classes at the Cranberry site
revealed a reverse J-shaped curve (Figure 10). Trees in the small diameter classes (≤ 8 cm class)
had a density of 1414 stems/ha. These stems comprised 78.6% of the trees tallied at the
Cranberry study site. Red spruce (714 trees/ha) dominated the small diameter class and
accounted for 50.5% of the total small stems (Figure 11). Yellow birch (200 trees/ha) accounted
for 14.1% of small stems while striped maple (171 trees/ha) accounted for 12.1% of small stems.
These were the only other species that individually accounted for greater than 10% of the small
diameter class stems. American beech and mountain maple were noteworthy contributing 7.1%
and 6.1% of the small diameter stems respectively. The remaining species (red maple, mountain
holly, sugar maple, and eastern hemlock) were collectively responsible for 10.0% of the stems
with a density of 143 stems/ha.
Trees representing the larger diameter classes (> 8 cm) account for 21.4% of the total
stems tallied at the Cranberry study area. Yellow birch (271 trees/ha) dominated the large
diameter stems accounting for 70.4% of the large stems at the Cranberry site (Figure 11). Red
spruce (71 trees/ha) is the second most abundant species. It is responsible for 18.5% of the large
tree stems tallied. Yellow birch and red spruce collectively account for 88.9% of the large stems.
American beech (29 trees/ha) and red maple (14 trees/ha) contribute the remaining 11.1% of the
large stems with 7.4% and 3.7% respectively. Yellow birch, red spruce, American beech, and
red maple are the only species represented as large trees. Eastern hemlock, mountain holly,
33

mountain maple, striped maple, and sugar maple occurred as small stems but were not present as
large stems.
0
200
400
600
800
1000
1200
4 8 12 16 20 24 28 32 36 40 44 48 52>54
.5
D-Class (cm)
Tree
s/H
a
E. hemlocksugar maplemt. hollyred maplemt. maplest. mapleAmerican beech red spruce yellow birch
Figure 10. Diameter distribution graph for all species and dbh classes at Cranberry 2004.
Figure 11. The percent contribution by species to the small diameter classes (≤ 8 cm class) left,
05
101520253035404550
red spru
ce
yello
w birch
st. m
aple
America
n bee
ch
mt. map
le
red maple
mt. holl
y
suga
r map
le
E. hem
lock
0
10
20
30
40
50
60
70
yellow birch red spruce American beech red maple
and the large diameter classes (> 8 cm class); right, Cranberry site 2004.
34
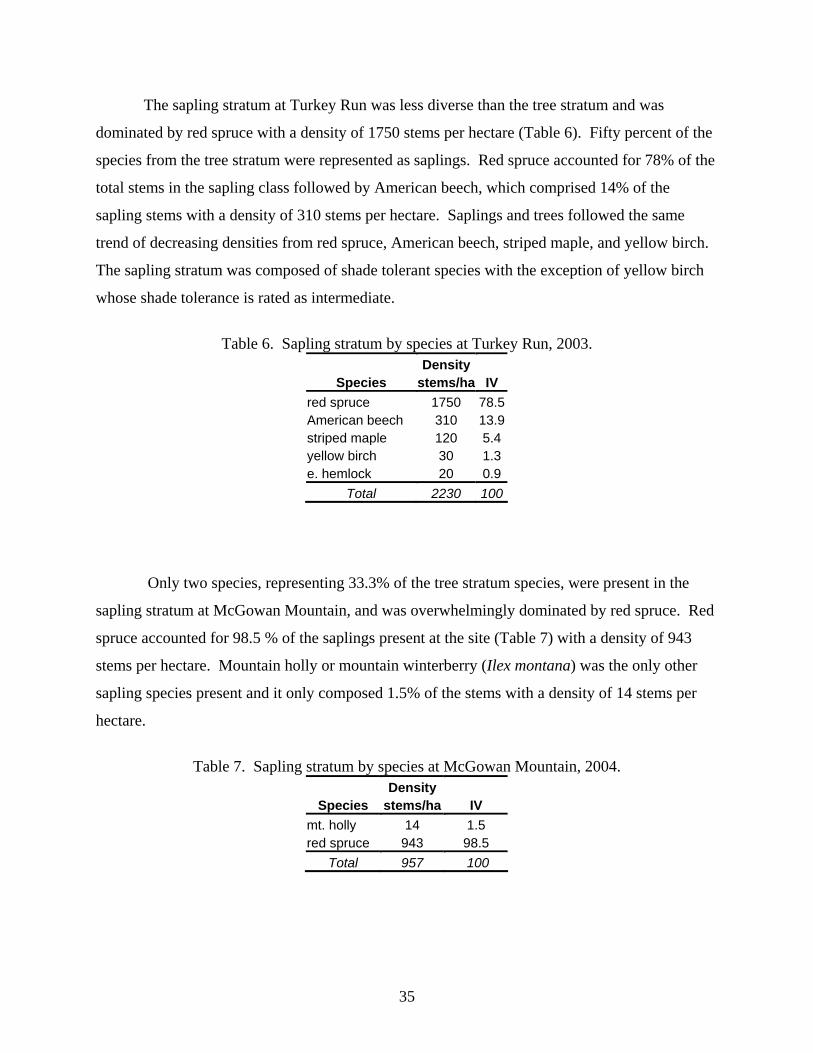
The sapling stratum at Turkey Run was less diverse than the tree stratum and was
dominated by red spruce with a density of 1750 stems per hectare (Table 6). Fifty percent of the
species from the tree stratum were represented as saplings. Red spruce accounted for 78% of the
total stems in the sapling class followed by American beech, which comprised 14% of the
sapling stems with a density of 310 stems per hectare. Saplings and trees followed the same
trend of decreasing densities from red spruce, American beech, striped maple, and yellow birch.
The sapling stratum was composed of shade tolerant species with the exception of yellow birch
whose shade tolerance is rated as intermediate.
Table 6. Sapling stratum by species at Turkey Run, 2003.
Density Species stems/ha IV
red spruce 1750 78.5American beech 310 13.9striped maple 120 5.4yellow birch 30 1.3e. hemlock 20 0.9
Total 2230 100
Only two species, representing 33.3% of the tree stratum species, were present in the
sapling stratum at McGowan Mountain, and was overwhelmingly dominated by red spruce. Red
spruce accounted for 98.5 % of the saplings present at the site (Table 7) with a density of 943
stems per hectare. Mountain holly or mountain winterberry (Ilex montana) was the only other
sapling species present and it only composed 1.5% of the stems with a density of 14 stems per
hectare.
Table 7. Sapling stratum by species at McGowan Mountain, 2004.
Density Species stems/ha IV
mt. holly 14 1.5 red spruce 943 98.5
Total 957 100
35
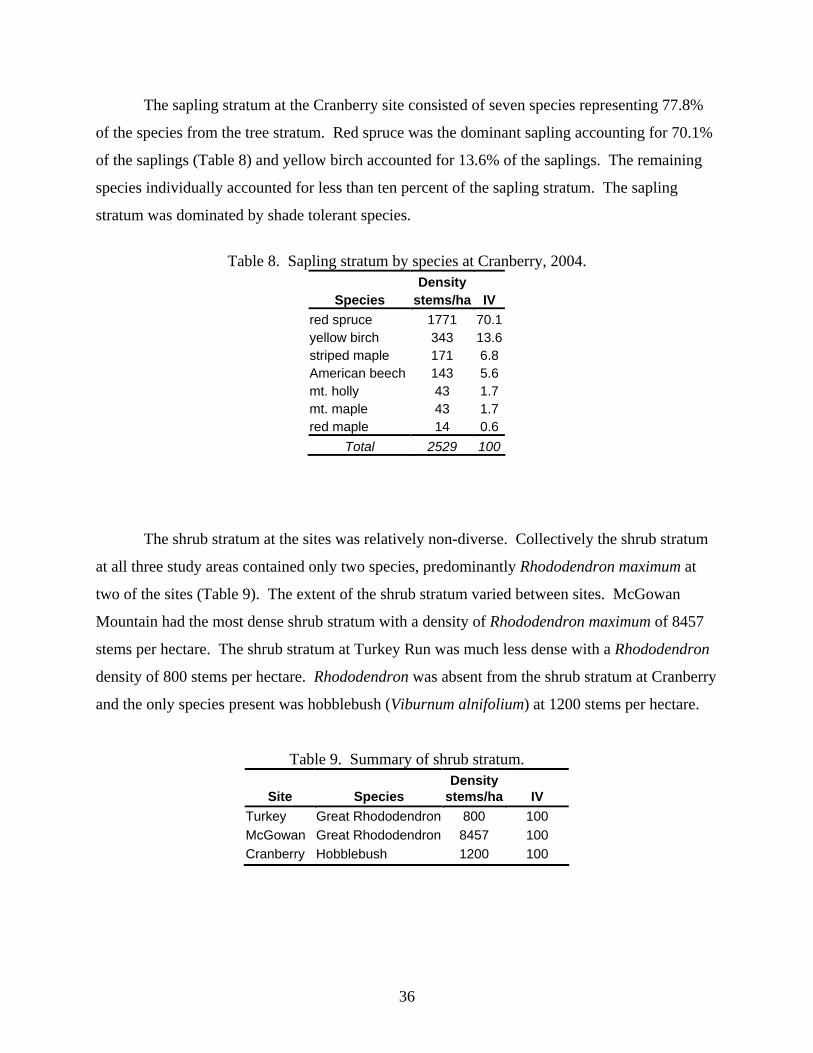
The sapling stratum at the Cranberry site consisted of seven species representing 77.8%
of the species from the tree stratum. Red spruce was the dominant sapling accounting for 70.1%
of the saplings (Table 8) and yellow birch accounted for 13.6% of the saplings. The remaining
species individually accounted for less than ten percent of the sapling stratum. The sapling
stratum was dominated by shade tolerant species.
Table 8. Sapling stratum by species at Cranberry, 2004.
Density Species stems/ha IV
red spruce 1771 70.1yellow birch 343 13.6striped maple 171 6.8American beech 143 5.6mt. holly 43 1.7mt. maple 43 1.7red maple 14 0.6
Total 2529 100
The shrub stratum at the sites was relatively non-diverse. Collectively the shrub stratum
at all three study areas contained only two species, predominantly Rhododendron maximum at
two of the sites (Table 9). The extent of the shrub stratum varied between sites. McGowan
Mountain had the most dense shrub stratum with a density of Rhododendron maximum of 8457
stems per hectare. The shrub stratum at Turkey Run was much less dense with a Rhododendron
density of 800 stems per hectare. Rhododendron was absent from the shrub stratum at Cranberry
and the only species present was hobblebush (Viburnum alnifolium) at 1200 stems per hectare.
Table 9. Summary of shrub stratum. Density
Site Species stems/ha IV Turkey Great Rhododendron 800 100 McGowan Great Rhododendron 8457 100 Cranberry Hobblebush 1200 100
36

The seedling stratum differed between sites (Table 10). Red spruce was the only species
represented in the seedling stratum at Turkey Run, where it obtained a density of 6000 stems per
hectare. Red spruce, red maple and black cherry were the only three species represented in the
seedling stratum at McGowan Mountain with red maple seedlings being the most abundant at
15714 stems per hectare. Red spruce followed with 12857 stems per hectare and black cherry
was the only other seedling species present with 1429 stems per hectare. The Cranberry study
area harbored the most diverse seedling stratum. Seven species were present at the Cranberry
study area. Red spruce was the most abundant seedling accounting for 43.8% of the seedlings
with a density of 10000 stems per hectare. Mountain maple was the second most abundant
comprising 18.8% of the total seedlings, followed by American beech contributing an additional
12.5%. The remaining species individually accounted for 6.3 % of the seedlings. The total
density of red spruce seedlings and the importance values of red spruce seedlings were
investigated with the ANOVA procedure. Although the sites differed widely, both quantitatively
and qualitatively, the analysis of variance failed to detect any significant difference between sites
for the variables tested.
Table 10. 2003, 2004 Seedling densities, stems per hectare; (importance values) by site. Site
Species Turkey McGowan Cranberry
red spruce 6000 (100) 12857 (42.9) 10000 (43.8) red maple 15714 (52.4) 1429 (6.3) mt. maple 4286 (18.8) American beech 2857 (12.5) striped maple 1429 (6.3) sugar maple 1429 (6.3) yellow birch 1429 (6.3) black cherry 1429 (4.8)
sum 6000 (100) 30000 (100) 22857 (100)
The ground cover was highly variable between sites. Coarse woody debris, bryophytes,
and Dryopteris spp. were the only types of cover that were common among all three study areas
(Table 11). Coarse woody debris was the most prevalent type of cover at both Turkey Run and
37

McGowan Mountain. Bryophytes were the second most prevalent type of cover followed by
Dryopteris spp. at both Turkey Run and McGowan Mountain. These three types of cover were
also dominant at the Cranberry site however with slightly different rankings when compared to
Turkey Run and McGowan Mountain. Bryophytes asserted the most dominance as a cover type
at the Cranberry site. Dryopteris spp. and coarse woody debris followed in decreasing
percentage of cover.
Table 11. 2003, 2004 Percent ground cover by site. Type Site
Turkey McGowan CranberryCourse woody debris 17.7 14.5 20.4 Bryophytes 8.9 7.0 29.8 Dryopteris spp. 7.5 1.4 25.2 Oxalis montana 0.6 2.0 Mitchella repens 0.1 0.2 Rocks 2.1 Dennstaedtia spp. 5.8 Aster accuminatus 0.2 Canada Lilly 0.4
38

Temporal Patterns Across Sites and Transects
The Turkey Run, McGowan Mountain, and Cranberry sites represent three distinct
ecological situations differing by the frequency and extent of disturbance experienced. The
following results illustrate the general patterns occurring for red spruce forest zones at each
transect. These results incorporate unpublished data collected by Adams and Stephenson (1994)
supplemented by data collected in 2003 and 2004. The temporal patterns illustrated for Turkey
Run and McGowan Mountain cover a period of time spanning eleven years, while the patterns
for the Cranberry site span a period of ten years.
When data from all forest zones were combined the density of red spruce trees showed an
increasing trend at all sites over time (Figure 12). McGowan Mountain realized the greatest
increase in red spruce density followed by Turkey Run with the addition of 729 and 660 trees per
hectare, respectively. The increase of red spruce density at Turkey Run from 650 to 1310
(Figure. 12) trees per hectare was the only increase found to be statistically significant (P =
0.0479). The Cranberry site experienced the lowest magnitude of red spruce increase with an
increase of 200 trees per hectare. By contrast, the density of hardwood stems showed an overall
decrease for the McGowan Mountain and Turkey Run sites (Figure 13). McGowan Mountain
lost 157 hardwood trees per hectare and hardwoods decreased at Turkey Run by 140 trees per
hectare. Hardwood densities at the Cranberry site remained fairly constant showing a slight
increase in density of 29 trees per hectare. But in this case the increase of red spruce trees was
much greater than the addition of hardwood species.
39

550
650
750
850
950
1050
1150
1250
1350
1450
1992 1994 1996 1998 2000 2002 2004
Year
tree
s pe
r hec
tare
TurkeyMcGowanCranberry
Figure 12. The temporal pattern of red spruce tree density for all zones pooled (trees ≥ 2.5 cm).
800
900
1000
1100
1200
1300
1992 1994 1996 1998 2000 2002 2004
Year
tree
s/ha Turkey
McGowanCranberry
Figure 13. The temporal pattern of hardwood tree density for all zones pooled (trees ≥ 2.5 cm).
40

The temporal trends for the relative density, relative basal area and importance values for
spruce and hardwood trees are presented for each site in Figures 19 - 24. Although, apparent
trends were present these variables were not found to be statistically significant. The relative
density of red spruce trees revealed an increasing trend at each site (Figure 14). The McGowan
Mountain and Turkey Run sites experienced the most pronounced change. The relative density
of red spruce at McGowan Mountain showed a 22% increase followed by Turkey Run with a
20% increase and Cranberry with an increase of 6%. In turn, the relative density of hardwood
stems experienced a decreasing pattern at all three sites (Figure 15).
The relative basal area of red spruce has experienced an increasing trend of 7% at Turkey
Run and 3% at McGowan Mountain while Cranberry showed a 9% decrease (Figure 16). As
shown in Figure 17, the relative basal area of hardwoods decreased at Turkey Run and
McGowan Mountain, while experiencing a small increase at the Cranberry site.
The importance values for red spruce increased at two sites (Turkey Run and McGowan
Mountain) and remained almost constant at the Cranberry site (Figure 18). The importance
values for red spruce increased by 13 for Turkey Run and 12 for McGowan Mountain and had a
1% decrease at Cranberry. In turn, hardwoods experienced a decrease at Turkey Run and
McGowan Mountain, while displaying a 1% increase at the Cranberry site (Figure 19).
41

30
35
40
45
50
55
60
65
1992 1994 1996 1998 2000 2002 2004
Year
Rel
ativ
e D
ensi
ty
TurkeyMcGowanCranberry
Figure 14. The temporal pattern of red spruce tree relative density for all zones pooled (trees ≥
2.5 cm).
35
40
45
50
55
60
65
70
1992 1994 1996 1998 2000 2002 2004
Year
Rel
ativ
e D
ensi
ty
TurkeyMcGowanCranberry
Figure 15. The temporal pattern of hardwood tree relative density for all zones pooled (trees ≥
2.5 cm).
42

5
10
15
20
25
30
35
40
1992 1994 1996 1998 2000 2002 2004
Year
Rel
ativ
e B
asal
Are
a
TurkeyMcGowanCranberry
Figure 16. The temporal pattern of red spruce tree relative basal area for all zones pooled (trees
≥ 2.5 cm).
60
65
70
75
80
85
90
95
1992 1994 1996 1998 2000 2002 2004
Year
Rel
ativ
e B
asal
Are
a
TurkeyMcGowanCranberry
Figure 17. The temporal pattern of hardwood tree relative basal area for all zones pooled (trees ≥
2.5 cm).
43

15
20
25
30
35
40
45
50
55
1992 1994 1996 1998 2000 2002 2004
Year
Impo
rtan
ce V
alue
TurkeyMcGowanCranberry
Figure 18. The temporal pattern of red spruce tree importance values for all zones pooled (trees
≥ 2.5 cm).
45
50
55
60
65
70
75
80
85
1992 1994 1996 1998 2000 2002 2004
Year
Impo
rtan
ce V
alue
TurkeyMcGowanCranberry
Figure 19. The temporal pattern of hardwood tree importance values for all zones pooled (trees
≥ 2.5 cm).
44

The variables for saplings of red spruce stems per hectare, red spruce importance values,
hardwood stems per hectare, and hardwood importance values were tested using the ANOVA
procedure and were not found to be statistically significant. However, there are trends are
apparent at the sites. The McGowan Mountain and Turkey Run sites both experienced a net
decline of red spruce saplings over the ten-year period, while the Cranberry stand revealed a net
increase of red spruce sapling densities over nine years (Figure 20). Red spruce densities
decreased by 300 stems per hectare at McGowan Mountain and by 60 stems per hectare at
Turkey Run. Red spruce sapling densities increased by 143 stems per hectare at the Cranberry
study site. The temporal trends of red spruce trees during the same time periods for these sites
revealed substantial increasing densities (Figure 12).
The densities for all saplings of hardwood species revealed a decreasing pattern over time
(Figure 21) at all three sites. The Cranberry study site experienced the largest decrease of 386
stems per hectare. Turkey Run followed with a decline of 210 stems per hectare and McGowan
Mountain with a decrease of 43 stems per hectare. Figure 13 also revealed a declining density of
hardwood tree stems over time at Turkey Run and McGowan Mountain. The net increase of
red spruce was 200 trees per hectare while the net increase of hardwoods was 29 trees per
hectare (Figures 12 and 13).
45

900
1100
1300
1500
1700
1900
2100
2300
1992 1994 1996 1998 2000 2002 2004
Year
stem
s pe
r hec
tare
TurkeyMcGowanCranberry
Figure 20. The temporal pattern of red spruce sapling densities for all zones pooled.
0
200
400
600
800
1000
1200
1400
1992 1994 1996 1998 2000 2002 2004
Year
stem
s pe
r hec
tare
TurkeyMcGowanCranberry
Figure 21. The temporal pattern of hardwood sapling densities for all zones pooled.
46

The calculated importance values for red spruce saplings had an increasing trend at all
three sites (Figure 22). The Cranberry study site experienced the greatest increase in importance
for red spruce saplings. The importance value for red spruce saplings at Cranberry increased by
11, followed by an increase of 6 at Turkey Run, while McGowan experienced an increase of 3.
47

55
60
65
70
75
80
85
90
95
100
1992 1994 1996 1998 2000 2002 2004
Year
Impo
rtan
ce V
alue
TurkeyMcGowanCranberry
Figure 22. The temporal pattern of importance values for red spruce saplings for all zones
pooled.
0
5
10
15
20
25
30
35
40
45
1992 1994 1996 1998 2000 2002 2004
Year
Impo
rtan
ce V
alue
TurkeyMcGowanCranberry
Figure 23. The temporal pattern of importance values of hardwood saplings for all zones pooled.
48

The overall density of red spruce seedlings for all size classes combined among the three
study sites generally displayed an increasing trend in density (Figure 24). The McGowan
Mountain site experienced a net increase of 5714 stems per hectare, followed by the Cranberry
and Turkey Run sites, with increasing densities of 2143 and 2000 stems per hectare respectively.
The total stems per hectare and the importance value for red spruce seedlings (all size classes
combined) were tested using ANOVA, however the changes were not found to be significant.
By contrast, the densities of hardwood seedlings showed a general decrease at each site
over time (Figure 25). Turkey Run realized the greatest reduction of 16500 stems per hectare,
which was found to be statistically significant at the 0.05 level (P = 0.0083), followed by the
McGowan Mountain site decreasing by 6429 stems per hectare and the Cranberry site decreasing
by 2857 stems per hectare.
The decreasing hardwood seedling densities and increasing red spruce seedling density
resulted in an increasing importance of red spruce seedlings. The calculated importance value
for red spruce seedlings increased at all sites with time (Figure 26). The importance value for
red spruce seedlings increased by 94 at the Turkey Run site representing the most dramatic
increase of any site sampled. The red spruce seedling importance value experienced an increase
of 38 at McGowan Mountain and an increase of 20 at the Cranberry site. Conversely, the
importance of hardwood seedlings experienced decreasing trends at all sites (Figure 27). The
decrease of importance values for hardwood stems dropped by 94, which tested significant with
the ANOVA procedure (P < 0.0001).
49

0
1000
2000
3000
4000
5000
6000
1992 1994 1996 1998 2000 2002 2004
Year
stem
s pe
r hec
tare
TurkeyMcGowanCranberry
Figure 24. The temporal pattern of red spruce seedling densities for all size classes and forest
zones combined.
0
20000
40000
60000
80000
100000
1992 1994 1996 1998 2000 2002 2004
Year
stem
s pe
r hec
tare
TurkeyMcGowanCranberry
Figure 25. The temporal pattern of hardwood seedling densities for all size classes and forest
zones combined.
50

0102030405060708090
100
1992 1994 1996 1998 2000 2002 2004
Year
Impo
rtan
ce V
alue
TurkeyMcGowanCranberry
Figure 26. The temporal pattern of importance values for red spruce seedlings for all size classes
and forest zones combined.
0102030405060708090
100
1992 1994 1996 1998 2000 2002 2004
Year
Impo
rtan
ce V
alue
TurkeyMcGowanCranberry
Figure 27. The temporal pattern of importance values for hardwood seedlings for all size classes
and forest zones combined.
51

Trends by Forest Zone. Present condition of forest zones
All variables for the red spruce component of the tree stratum revealed significant
differences between the zones (Table 12a). Red spruce values were lowest for each variable in
the hardwood zone, and were highest in the red spruce zone. Red spruce trees per hectare were
significantly greater for the red spruce zone compared to the hardwood zone (P = 0.0131). The
ecotone was not significantly separated from the red spruce zone with respect to red spruce trees
per hectare.
Red spruce basal area per hectare showed significant differences between the ecotone and
red spruce zones (P = 0.0002), and the hardwood and red spruce zones (P < 0.0001). The
relative density of red spruce trees revealed significant differences between the ecotone and red
spruce zones (P = 0.0031), and the hardwood and red spruce covertypes (P = 0.0002). The
relative basal area of red spruce showed significant differences between the ecotone and red
spruce zones (P = 0.0013), and the hardwood and red spruce zones (P = 0.0001). The
importance value of red spruce was significantly different between all three zones, the ecotone
and hardwood zones (P = 0.0065), the ecotone and red spruce zones (P = 0.0011), and the
hardwood and ecotone zones (P < 0.0001). The variables for hardwood tree species were lowest
in the red spruce zone and the highest in the hardwood zone (Table. 12b).
52

Table 12a. Red spruce tree stratum variable means for the ANOVA by forest zone. Means with different letters indicate statistical significance.
SITE Zone Cranberry McGowan Turkey All Sites
Basal area m2/ha
RS 34.5 a 36.8 a 11.3 25.2 a Eco 6.8 b 15.2 b 4.3 8.3 b HW 0.5 b 1.8 b 1.3 1.2 b
Trees / hectare
RS 1000 1250 2567 a 1743 a Eco 1067 1833 1000 b 1270 a HW 150 950 467 b 514 b
Relative Density
RS 58 a 50 80 a 65 a Eco 45 a 66 40 b 49 b HW 9 b 53 19 b 25 c
Relative Basal Area
RS 75 a 61 a 37 a 55 a Eco 14 b 32 ab 12 ab 18 b HW 1 b 7 b 1 b 3 b
Importance Value
RS 66 a 55 59 a 60 a Eco 29 b 49 26 b 34 b HW 5 c 30 10 b 14 c
53

Table 12b. Hardwood species tree stratum variable means for the ANOVA by forest zone. Means with different letters indicate statistical significance.
SITE Zone Cranberry McGowan Turkey All Sites
Basal area m2/ha
RS 12.3 23.5 25.1 21.0 Eco 37.9 31.8 33.7 34.4 HW 37.4 24.4 54.8 41.2
Trees / hectare
RS 750 1150 667 a 829 Eco 1167 667 1325 b 1080 HW 1050 800 1433 b 1143
Relative Density
RS 42 a 50 20 a 7 a Eco 55 a 34 60 b 51 b HW 91 b 47 81 b 75 c
Relative Basal Area
RS 25 a 39 a 63 a 45 a Eco 86 b 68 ab 88 ab 82 b HW 99 b 93 b 99 b 97 b
Importance Value
RS 34 a 45 41 a 40 a Eco 71 b 51 74 b 66 b HW 95 c 70 90 b 86 c
54

The sapling stratum variables of density (stems/ha) and importance value for both red
spruce and hardwood stems varied by forest zone (Table. 13). The density of red spruce saplings
ranged from 1830 stems per hectare in the ecotone to 957 stems per hectare in the hardwood
zone, however this difference was not significant. The calculated importance value for red
spruce was highest in the ecotone and lowest in the red spruce covertype. The ecotone had a
significantly higher red spruce importance value than the red spruce zone (P = 0.0338). The
density of hardwood saplings was generally highest in the hardwood covertype (714 stems per
hectare), and lowest in the ecotone (430 stems per hectare), however no statistical significance
was detected.
Table 13. Sapling variables for ANOVA by forest zone (all sites combined) showing mean values. Means with different letters indicate statistical significance..
SITE Zone Cranberry McGowan Turkey All Sites
Red spruce stems / hectare
RS 1900 0 1600 1229 Eco 2033 1400 2000 1830 HW 1250 1200 600 957
Red spruce Importance Value
RS 96 0 a 59 53 a Eco 72 83 b 84 80 b HW 49 100 b 46 62 ab
Hardwoods stems / hectare
RS 50 0 1233 543 Eco 900 33 375 430 HW 1250 0 833 714
Hardwoods Importance Value RS 4 100 a 41 47 a Eco 28 17 b 16 20 b HW 51 0 b 54 38 ab
55

Red spruce seedlings had the highest density in the ecotone (Table. 14) although this
difference was not statistically significant. Red spruce seedling importance value was
significantly greater in the ecotone compared to the red spruce forest zone (P = 0.0235).
Table 14. Seedling variable means (all size classes combined) for the ANOVA by forest zone. Means with different letters indicate statistical significance.
SITE Zone Cranberry McGowan Turkey All Sites
Red spruce stems / hectare
RS 10000 7500 0 500 Eco 5000 8333 7500 7000 HW 0 2500 0 714
Red spruce Importance Value
RS 100 a 50 0 43 a Eco 83 a 21 50 51 a HW 0 b 17 0 5 b
Hardwoods stems / hectare
RS 0 a 5000 0 1429 Eco 1667 a 10000 0 3500 HW 20000 b 10000 0 8571
Hardwoods Importance Value RS 0 0 0 14 Eco 17 79 0 29 HW 50 50 0 38
56

Temporal Patterns: Red Spruce Zone
Tables 15a and 15b report the change in the mean value between the first and last surveys
for the variables of basal area, trees per hectare, relative density, relative basal area, and
importance value for red spruce and hardwood species in the tree stratum. The change for these
variables with respect to time was not found to be significant in the red spruce zone except for
red spruce trees per hectare at Turkey Run (P = 0.0022). Although not significant, red spruce
density, relative density, relative basal area and importance values all exhibited an increasing
trend with time for all sites combined. Conversely, the density, relative density, relative basal
area, and importance value for hardwood species all experienced a decreasing trend (not
significant) over time.
Table 15a. Red spruce tree stratum variable means for the ANOVA for the red spruce zone, first survey to last survey. Means with different letters indicate statistical significance.
SITE Time Cranberry McGowan Turkey All Sites
Basal area m2/ha
First 46.5 33.7 5.3 25.2 Last 34.5 36.8 11.3 25.3
Trees / hectare
First 700 1550 1167 a 1143 Last 1000 1250 2567 b 1743
Relative Density
First 53 55 60 56 Last 58 50 80 65
Relative Basal Area
First 82 64 13 47 Last 75 60 37 55
Importance Value
First 67 60 36 52 Last 66 55 59 60
57

Table 15b. Hardwood species tree stratum variable means for the ANOVA for the red spruce zone, first survey to last survey. Means with different letters indicate statistical significance.
SITE Time Cranberry McGowan Turkey All Sites
Basal area m2/ha
First 8.9 18.5 26.3 19.1 Last 12.3 23.5 25.1 21.0
Trees / hectare
First 650 1300 767 886 Last 750 1150 667 828
Relative Density
First 48 45 40 44 Last 42 50 20 35
Relative Basal Area
First 18 36 87 53 Last 25 39 63 45
Importance Value
First 33 40 64 48 Last 34 44 41 40
The density of red spruce saplings (all sites combined) experienced a non-significant
decrease of 643 stems per hectare, while the importance value dropped from 65 to 53 between
the first and last measurement period (Table. 16). By contrast, hardwood species experienced an
overall increase of 314 stems per hectare, while the importance value rose from 21 to 48. These
increases were not statistically significant. The rise in hardwood sapling importance value at the
McGowan Mountain site was found to be statistically significant (P = 0.0375). In addition, the
density of hardwood saplings at the Turkey Run site increased significantly (P = 0.0386) by 1066
stems per hectare.
Red spruce seedlings showed a general trend of increasing density with respect to time
(Table. 17). Likewise, the importance value of red spruce seedlings increased, although the
increases were not statistically significant. Conversely, the density and importance value for
hardwood seedlings showed a non-significant decrease over time. The decrease of hardwood
58

seedling importance value at the Turkey Run site was statistically significant (P = 0.0045).
When seedling data were further broken down by the four size classes, for both red spruce and
hardwood species, no significant differences with respect to time were detected.
Table 16. Sapling variable means for the ANOVA for the red spruce zone, first survey to last survey. Means with different letters indicate statistical significance.
SITE Time Cranberry McGowan Turkey All Sites
Red Spruce Stems / hectare
First 2300 0 2833 1871 Last 1900 0 1600 1228
Red Spruce Importance Value
First 86 0 95 65 Last 96 0 59 53
Hardwoods Stems / hectare
First 500 50 167 a 229 Last 50 0 1233 b 543
Hardwoods Importance Value
First 14 50 a 5 21 Last 4 100 b 41 48
59

Table 17. Seedling variable means (size classes pooled) for the ANOVA for the red spruce zone, first survey to last survey. Means with different letters indicate statistical significance.
SITE Time Cranberry McGowan Turkey All Sites
Red Spruce Stems / hectare
First 7500 0 0 2143 Last 10000 7500 0 5000
Red Spruce Importance Value
First 50 0 0 14 Last 100 50 0 43
Hardwoods Stems / hectare
First 0 0 20000 8571 Last 0 5000 0 1429
Hardwoods Importance Value
First 0 0 100 a 43 Last 0 50 0 b 14
60

Temporal Patterns: Ecotone Zone
All variables tested for red spruce experienced an increase with respect to time in the
ecotone zone (Table. 18a). The density of red spruce trees experienced a statistically significant
increase of 590 trees per hectare (P = 0.0294). The relative density of red spruce increased from
32 to 49 which also proved to be significant at the α=0.05 level (P = 0.0186). The increase in
red spruce density (P = 0.0041) and relative density (P = 0.0126) at the McGowan Mountain site
were found to be statistically significant. The hardwood species in the ecotone showed
decreasing values for all variables tested with respect to time (Table. 18b). The relative density
of hardwoods decreased from 68 to 51, which proved to be statistically significant (P = 0.0186),
and the relative density of hardwoods at the McGowan Mountain site decreased significantly (P
= 0.0126) from 65 to 34.
Table 18a. Red spruce tree stratum variable means for the ANOVA for the ecotone zone, first survey to last survey. Means with different letters indicate statistical significance.
SITE Time Cranberry McGowan Turkey All Sites
Basal area m2/ha
First 5.0 13.1 1.8 6.1 Last 6.8 15.2 4.3 8.3
Trees / hectare
First 833 533 a 675 680 a Last 1067 1833 b 1000 1270 b
Relative Density
First 36 35 a 25 32 a Last 45 66 b 40 49 b
Relative Basal Area
First 11 29 5 14 Last 14 32 12 18
Importance Value
First 24 32 15 23 Last 29 49 26 34
61
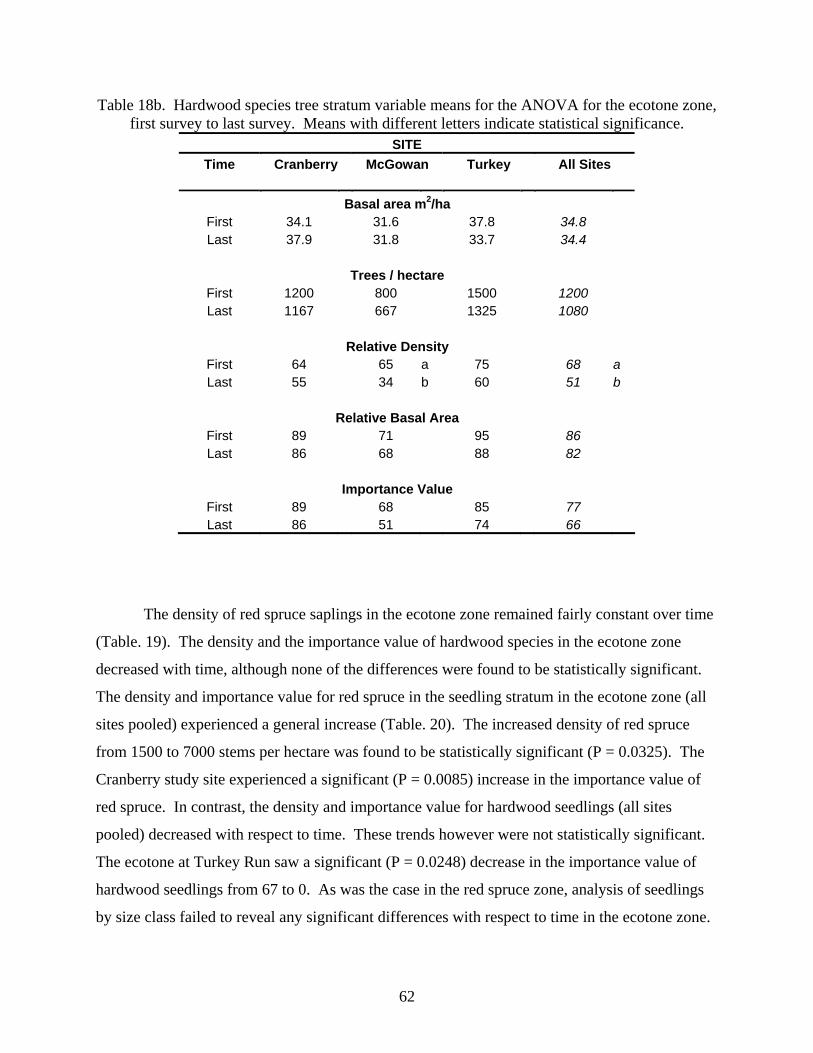
Table 18b. Hardwood species tree stratum variable means for the ANOVA for the ecotone zone, first survey to last survey. Means with different letters indicate statistical significance.
SITE Time Cranberry McGowan Turkey All Sites
Basal area m2/ha
First 34.1 31.6 37.8 34.8 Last 37.9 31.8 33.7 34.4
Trees / hectare
First 1200 800 1500 1200 Last 1167 667 1325 1080
Relative Density
First 64 65 a 75 68 a Last 55 34 b 60 51 b
Relative Basal Area
First 89 71 95 86 Last 86 68 88 82
Importance Value
First 89 68 85 77 Last 86 51 74 66
The density of red spruce saplings in the ecotone zone remained fairly constant over time
(Table. 19). The density and the importance value of hardwood species in the ecotone zone
decreased with time, although none of the differences were found to be statistically significant.
The density and importance value for red spruce in the seedling stratum in the ecotone zone (all
sites pooled) experienced a general increase (Table. 20). The increased density of red spruce
from 1500 to 7000 stems per hectare was found to be statistically significant (P = 0.0325). The
Cranberry study site experienced a significant (P = 0.0085) increase in the importance value of
red spruce. In contrast, the density and importance value for hardwood seedlings (all sites
pooled) decreased with respect to time. These trends however were not statistically significant.
The ecotone at Turkey Run saw a significant (P = 0.0248) decrease in the importance value of
hardwood seedlings from 67 to 0. As was the case in the red spruce zone, analysis of seedlings
by size class failed to reveal any significant differences with respect to time in the ecotone zone.
62

Table 19. Sapling variable means for the ANOVA for the ecotone zone, first survey to last survey. Means with different letters indicate statistical significance.
SITE Time Cranberry McGowan Turkey All Sites
Red Spruce Stems / hectare
First 1900 1700 1900 1840 Last 2033 1400 2000 1830
Red Spruce Importance Value
First 67 64 69 67 Last 72 83 84 80
Hardwoods Stems / hectare
First 1133 67 975 750 Last 900 33 375 430
Hardwoods Importance Value
First 33 3 15 18 Last 28 17 4 16
Table 20. Seedling variable means (size classes pooled) for the ANOVA for the ecotone zone, first survey to last survey. Means with different letters indicate statistical significance.
SITE Time Cranberry McGowan Turkey All Sites
Red Spruce Stems / hectare
First 0 1667 2500 1500 a Last 5000 8333 7500 7000 b
Red Spruce Importance Value
First 0 a 33 33 23 Last 83 b 21 50 51
Hardwoods Stems / hectare
First 11667 15000 7500 11000 Last 1667 10000 0 3500
Hardwoods Importance Value
First 67 67 67 a 67 Last 17 79 0 b 29
63

Temporal Patterns: Hardwood Zone
Red spruce in the tree stratum of the hardwoods zone (all sites pooled) experienced an
increase over time for all the variables considered (Table. 21a). The density of red spruce trees
increased by 428 stems per hectare, however this change was not statistically significant.
However, the increase in the relative density of red spruce from 5 to 25 was found significant (P
= 0.0225) at the α = 0.05 level. The relative density of red spruce at the McGowan Mountain
site increased from 5 to 53, which was also found to be significant (P = 0.0022).
Basal area was the only variable that increased for hardwood species in the hardwood
zone (all sites pooled) (Table. 21b). The density, relative basal area, and importance value of
hardwood species all decreased with respect to time within the hardwood zone, although these
decreases were not statistically significant. However, the relative basal area of hardwood species
decreased significantly (P = 0.0225) from 95 to 74. The decrease in the relative density of
hardwood species at the McGowan Mountain site also proved to be statistically significant (P =
0.0022).
64

Table 21a. Red spruce tree stratum variable means for the ANOVA for the hardwood zone, first survey to last survey. Means with different letters indicate statistical significance.
SITE Time Cranberry McGowan Turkey All Sites
Basal area m2/ha
First 0.2 0.3 0.3 0.3 Last 0.5 1.8 1.3 1.2
Trees / hectare
First 100 50 100 86 Last 150 950 467 514
Relative Density
First 6 5 a 4 5 a Last 9 53 b 19 25 b
Relative Basal Area
First 1 1 0 1 Last 1 7 1 3
Importance Value
First 3 3 2 3 Last 5 30 10 14
65

Table 21b. Hardwood tree stratum variable means for the ANOVA for the hardwood zone, first survey to last survey. Means with different letters indicate statistical significance.
SITE Time Cranberry McGowan Turkey All Sites
Basal area m2/ha
First 26.9 27.7 55.7 39.5 Last 37.4 24.4 54.8 41.2
Trees / hectare
First 1000 1000 1567 1243 Last 1050 800 1433 1143
Relative Density
First 94 95 a 96 95 a Last 91 47 b 81 74 b
Relative Basal Area
First 99 99 100 99 Last 99 93 99 97
Importance Value
First 97 97 98 97 Last 95 70 90 86
The density of red spruce saplings in the hardwood zone (all sites pooled) remained static
(Table. 22). However the importance value for red spruce in the sapling stratum increased,
although not significantly. The density of hardwood species showed a general decreasing trend
with respect to time and the importance value for hardwoods also declined. Neither of these
were found to be statistically significant. The changes over time for red spruce and hardwood
saplings did not show any significant changes within individual study sites.
The total density of red spruce seedlings (all sites pooled) remained static in the hardwood zone
with respect to time (Table. 23). The density of hardwood seedlings decreased significantly (P =
0.0340) by 15000 stems per hectare. The density (P = 0.0264) and importance value (P =
0.0495) of hardwood seedlings at the Turkey Run site experienced significant reductions with
respect to time.
66

Table 22. Sapling variable means for the ANOVA for the hardwood zone, first survey to last
survey. Means with different letters indicate statistical significance. SITE
Time Cranberry McGowan Turkey All Sites
Red Spruce Stems / hectare First 550 1800 667 957 Last 1250 1200 600 957
Red Spruce Importance Value
First 23 98 43 53 Last 49 100 46 62
Hardwoods Stems / hectare
First 1800 50 833 886 Last 1250 0 833 714
Hardwoods Importance Value
First 77 2 57 47 Last 51 0 54 38
Table 23. Seedling variable means (size classes pooled) for the ANOVA for the hardwood zone,
first survey to last survey. Means with different letters indicate statistical significance. SITE
Time Cranberry McGowan Turkey All Sites
Red Spruce Stems / hectare First 2500 0 0 714 Last 0 2500 0 714
Red Spruce Importance Value
First 25 0 0 7 Last 0 17 0 5
Hardwoods Stems / hectare
First 15000 30000 25000 a 23571 a Last 20000 10000 0 b 8571 b
Hardwoods Importance Value
First 75 50 67 a 64 Last 50 83 0 b 38
67

Eighteen types of ground cover were encountered between the three sites. The percent
cover for bryophytes, Dryopteris spp., and coarse woody debris were the only ground covertypes
found to be significantly correlated with the density of red spruce seedlings. The trend of
increasing densities of red spruce seedlings with increasing percent of ground cover for
bryophytes and coarse woody debris was found. Decreasing densities of red spruce seedlings
were found with respect to an increase of percent cover for Dryopteris spp.
02000400060008000
100001200014000
5 10 15 20 25 30
Percent cover of bryophytes
Stem
s/ha
red
spru
ce
seed
lings
02000400060008000
100001200014000
0 10 20 30 40 50
Percent cover for Dryopteris spp.
Stem
s/ha
red
spru
ce
seed
lings
02000400060008000
100001200014000
0 10 20 3
Percent cover of CWD
Stem
s/ha
red
spru
ce
seed
lings
0
Figure 28. Relationship of percent ground cover to red spruce seedling density.
68

Chapter 6. Discussion
Current Site Conditions
Turkey Run, McGowan Mountain, and the Cranberry site represent three distinct
ecological situations: 1. a disturbed spruce stand thirteen years following the disturbance event;
2. a second-growth stand approximately 70 years after a major disturbance event; and 3. a mature
stand which appears to have experienced an insignificant amount of disturbance. The Turkey
Run stand was subjected to a major windthrow event (the remnants of Hurricane Hugo in 1989
resulted in a major disturbance). The majority of the large red spruce were either uprooted or
snapped, leaving a very sparse canopy. The oldest remaining red spruce at the site was
determined to be 193 years of age using annual ring count. By contrast, the red spruce at
McGowan Mountain appeared to be a second-growth stand that had regenerated following a
severe disturbance. The oldest red spruce in this stand was determined to 67 years of age. The
Cranberry study site is a mature stand, which appears to have experienced a minimal amount of
disturbance. The oldest red spruce at this site was determined to be 204 years of age. The
differences between these sites provide an interesting opportunity to compare the dynamics of
red spruce within the context of three distinctive ecological situations.
Despite these different ecological circumstances, certain characteristics were comparable
between sites. The total basal area per hectare for all species was fairly similar between sites and
ranged from 42.99 m2/ha at Turkey Run to 44.85 m2/ha at McGowan Mountain (Table 24). The
density of all tree species among sites ranged from 1800 trees per hectare at the Cranberry site to
2470 trees per hectare at Turkey Run (Table 24). These basal areas and densities agree with
other surveys of central Appalachian stands (Pauley 1989, Stephenson and Clovis 1983). The
higher tree densities at Turkey Run and McGowan Mountain were consistent with expectations
given the extent and frequency of disturbances at these sites when compared to the Cranberry
site (even though these differences were not statistically significant).
69

Table 24. Site summaries for all species and for red spruce from the 2003 – 2004 samples. Basal Area Density Relative Relative
Site m2/ha trees/ha Density Basal Area IV H’ E
All Tree Species Turkey 42.99 ±2.5 2470 ±873 - - - 1.9 0.8 McGowan 44.85 ±2.2 2257 ±629.4 - - - 1 0.6 Cranberry 43.36 ±1.4 1800 ±804 - - - 1.4 0.6 Red Spruce Trees Turkey 5.51 ±5.9 1310 ±1013 53 12.8 33 - - McGowan 17.54 ±18.0 1414 ±636 62.7 39.1 51 - - Cranberry 12.91 ±15.6 786 ±620 43.7 29.8 37 - -
Current red spruce basal area ranged from 5.51 m2/ha at Turkey Run to 17.54 m2/ha at the
McGowan Mountain stand. The density of red spruce trees ranged from 786 trees per hectare at
the Cranberry stand to 1414 trees per hectare at McGowan Mountain. Although this was a two-
fold difference ANOVA failed to detect a significant difference between stands for density at the
0.05 level. The relative density of red spruce ranged from 43.7 % at the Cranberry site to 62.7%
at McGowan Mountain. The relative basal area of red spruce ranged from 12.8% to 39.1%,
again there was no detectable difference at the α = 0.05 level. Importance values for red spruce
were not significantly different between sites at the α = 0.05 level. The importance values
ranged from 32.9 to 50.9.
Thirteen tree species were encountered in the survey of the three sites. Five species,
representing 38.5% of the total species, were present at all three sites (Table 25). Seven species,
accounting for 53.8% of the total species, occurred in at least two sites. The Cranberry and
McGowan Mountain stands were the most similar based on the presence/absence of tree species.
Together they contained nine species and 66.7% of these species were present at both sites. All
of the species present at the Cranberry and McGowan stands were shade tolerant, with the
exception of yellow birch whose shade tolerance is rated as intermediate. The Turkey Run site
was set apart from the other by the occurrence four species that were unique to that site. These
species included black cherry (shade intolerant), cucumber magnolia, and red oak (both
intermediate shade tolerance), and serviceberry (shade tolerant). The occurrence of these unique
species at Turkey Run were attributed to the severity and relatively short time since disturbance
70

which created growing space that could be captured by a variety of species possessing a wide
range of ecological attributes. Despite the greater diversity of tree species at Turkey Run, all the
trees encountered in this survey are common associates in red spruce forest communities of the
central Appalachians (Schuler et al 2002, Mayfield 1997, Bailey and Ware 1990, Adams and
Stephenson 1989, Pauley 1989, Stephenson and Clovis 1983, Clovis 1979).
Table 25. Presence (1) – Absence (0) of tree species at the three sites. Species Cranberry McGowan Turkey # of Sites
American beech 1 1 1 3 e. hemlock 1 1 1 3 red maple 1 1 1 3 red spruce 1 1 1 3 yellow birch 1 1 1 3 mt. holly 1 1 0 2 striped maple 1 0 1 2 mt. maple 1 0 0 1 sugar maple 1 0 0 1 black cherry 0 0 1 1 cuc. magnolia 0 0 1 1 red oak 0 0 1 1 serviceberry 0 0 1 1
Sum 9 6 10
The diameter distributions for each site when prepared for all species and all size classes
(≥ 2.5 cm) exhibited reverse J-shaped distributions (Figure 29). Pauley (1989) and Mayfield
(1997) also found this pattern in their surveys of central Appalachian spruce stands. This pattern
is indicative of multicohort stands or single-cohort, multispecies, stratified stands. Mixed stands
subjected to severe erratic disturbances may develop into complex species mixtures, fragments
of stratified mixtures, age classes or cohorts (Fajvan and Seymour, 1993). These situations could
result in several, if not all, of the stages of stand development occurring concurrently within an
individual stand (Smith et al., 1997). This seems to be the case at the Turkey Run study site.
71

0
200
400
600
800
1000
1200
1400
4 8 12 16 20 24 28 32 36 40 44 48 52
>54.
5
dbh class (cm)
tree
s/ha Turk
McGCran
Figure 29. Diameter Distributions for all Species by Site. Turk = Turkey Run, McG = McGowan Mountain; Cran = Cranberry Site.
Turkey Run was the most diverse site. The calculated Shannon-Wiener Diversity Index
(H’) was 1.85 (Table 7). This was not surprising as a result of the early stages of stand
development represented within the site. Large canopy gaps created by hurricane Hugo made
growing space available. Several species of hardwoods and red spruce have established within
these gaps. The McGowan mountain site had the lowest diversity (H’ = 1.03). This stand is at a
stage of development intermediate between the other stands. The lower diversity may be
explained by red spruce successfully out-competing hardwood species as stem exclusion occurs.
The Cranberry stand maintains a diversity intermediate between Turkey Run and McGowan
Mountain. This may be attributed to a history of small canopy gaps created by damaged crowns
or individual tree mortality. These openings would have allowed a few individuals to become
established within these gaps.
The diversity of the sapling stratum varied among sites. The Cranberry site was the most
diverse containing seven species, followed by Turkey Run with five species while McGowan
Mountain had only two sapling species. The sapling strata at all the sites were composed almost
72

exclusively of shade tolerant species. The proportions of sapling species at Turkey Run and
Cranberry were similar to the proportions of their tree stratum counterparts. Red spruce was
clearly the dominant species represented in the sapling strata. ANOVA was performed for red
spruce sapling density, red spruce importance values, and hardwood sapling densities between
sites, however no significance between sites was detected for these variables.
The shrub stratum was varied by site. Great rhododendron was common at McGowan
Mountain and Turkey Run, which were both sites in early stages of stand development.
Rhododendron was absent from the more mature stand at Cranberry.
The ground cover consisted of three unifying types, bryophytes, ferns, and coarse woody
debris. White wood sorrel (Oxalis montana) and partridge berry (Mitchella repens) were present
at both the Turkey Run and Cranberry sites both with a greater degree of cover at the Cranberry
site. Although they represent a small fraction of cover they are noteworthy due to the fact that
they were common to the two sites. These two sites represent more mature red spruce stands in
two distinctly different ecological situations with respect to the frequency and extent of
disturbance events. These herbaceous species may rely on microenvironmental conditions
created in mature spruce stands. Thus the less disturbed Cranberry site may be more suitable to
these species. The recent disturbance at the Turkey Run site may have altered the site so that it is
no longer optimal for these species. Their exclusion from the McGowan Mountain site may be
related to the relatively young condition of that stand.
73

Temporal Patterns in Red Spruce Across Sites and Transects
In spite of the fact that the successional stages of the sites varied widely, the general trend
for the tree stratum at all sites over time was that of increasing importance of red spruce, while
hardwood species experienced a decline. The degree of decline in relative density for hardwoods
seemed to mirror the increase of red spruce relative density. This increasing pattern of red
spruce relative density suggests that recruitment of red spruce has been successful and spruce in-
growth is competing with hardwoods when growing space was made available. The lower
degree of increase at the Cranberry site is explained by the absence of appreciable disturbance to
create new growing space.
The relative basal area of red spruce has increased at all sites. This further supports the
notion that red spruce is gaining dominance at all the sites. The Turkey Run site is much more
disturbed, notably with mortality of hardwoods, allowing significantly more light and growing
area to support a greater rate of basal area increase of the residual red spruce. By contrast, the
overall decrease in basal area at Cranberry is due to single tree mortality of dominant canopy red
spruces.
The changes in the sapling stratum did not show a consistent pattern although, the density
of red spruce saplings showed a slight decrease over time. The decreasing densities experienced
at Turkey Run and McGowan Mountain do not necessarily indicate mortality. The temporal
gains in red spruce trees during the same time periods for these sites suggests that decreasing red
spruce sapling densities at these sites can be attributed to ascension from the sapling class into
the tree class.
The densities for hardwood saplings experienced a decline at all sites over time. But
these data suggest that mortality of hardwood saplings is occurring since additional hardwoods
do not appear to be growing into the tree size class at two of the sites. By contrast, the Cranberry
site, which saw the largest net decrease in sapling stems over time, realized a slight increase in
hardwood tree stems (Figure 13). This suggests that some hardwood stems are surviving into
tree size at this site, however at a much lower rate compared to spruce.
Data from this study show a general increase in red spruce seedlings at all sites in the
largest size class. The transitional sapling class does not show a clear pattern over time,
probably reflecting movements of individuals in and out of this class. The general increases in
74

density, basal area, and importance of spruce in the tree class imply that spruce seedlings are
progressing through the sapling class to become trees. In turn, the gains in spruce are mirrored
by losses in hardwoods.
Trends by Forest Zones
The greatest contrasts were found between the comparison of the red spruce and
hardwood zones (Table 17) at all sites. This is not surprising since the ecotone represents an area
where the two forest zones blend together. The Cranberry site showed significant differences
more frequently between all zones. On the basis of red spruce and hardwood importance values
in the tree stratum, all three forest zones were found to be statistically different at the Cranberry
site. The forest zones were not as well differentiated at the McGowan mountain site compared to
the other sites. When the data for the forest zones were pooled across sites the variables of red
spruce and hardwood relative density and importance value resulted in statistically significant
differences between the three forest zones.
The density of red spruce saplings was greater (not significantly) in the ecotone zone,
however red spruce sapling importance values were significantly higher in the ecotone compared
to the other zones. In contrast, Mayfield (1997) found that red spruce sapling densities were
lowest in the hardwood zone (957 stems/ha) and greatest in the red spruce zone (19432
stems/ha). Hardwood importance values showed a significant decrease in the ecotone zone.
Similarly red spruce seedlings obtained the greatest densities and importance values in the
ecotone. The seedling densities recorded by Mayfield (1997) were similar in magnitude to this
study with respect to the hardwood zone (Mayfield = 667/ha; this study = 714/ha) and the
ecotone zone (Mayfield = 6351/ha; this study = 7000/ha). However, Mayfield found the red
spruce zone to harbor 19000 more red spruce seedlings per hectare than this present study.
Temporal Patterns by Forest Zone
Mielke et al. (1986) determined that 33% of the red spruce volume in West Virginia was
dead or declining. However, the red spruce forest zone was the most stable in this survey. The
75

basal area for red spruce did not change dramatically. Some mortality of individual trees, has
occurred in the spruce zones however the density and in-growth of red spruce trees has offset
these losses. All variables for red spruce in the tree stratum of the red spruce zone showed
increasing values over time. This trend is mirrored by the loss of density from the hardwood
stratum. Red spruce in the sapling stratum experienced a slight decline in density. This appears
to be due ascension from the sapling class into the tree class. Red spruce seedlings have also
shown increasing densities and importance in the red spruce zone.
The ecotone in this study is the transitional zone between the hardwood and red spruce
forest types. Ecotones commonly exhibit a higher biodiversity than the two adjacent
communities (Risser, 1993) due to the gradual transition and blending of species from one forest
type to the other. Ecotones have been proposed to be a good area to study the dynamics of
contrasting forest types (Noble, 1993). The density and relative density of red spruce trees
increased significantly in the ecotone zone, while the relative density of hardwood trees
decreased significantly. This pattern of decreasing hardwoods and increasing red spruce
suggests that red spruce is expanding its range by moving into the ecotone. Red spruce saplings
are remaining fairly static over time, while red spruce seedlings are increasing. This suggests
that red spruce seedlings are consistently surviving into the sapling strata and furthermore
growing into the tree stratum at a rate that is facilitating the spread of the red spruce zone into the
ecotone.
The hardwood zone in this study has experienced an increase in the density of red spruce
trees. The relative density of red spruce trees in the hardwood zone has increased significantly,
while the relative density of hardwood species has decreased significantly. The hardwood zone
has seen little change in the density of red spruce saplings and seedlings. The data suggest that
red spruce seedlings are progressing into saplings and that some of these individuals are
surviving into the tree class.
Temporal studies of the spruce forest type divided by forest zone were not found.
However, temporal studies of the spruce forest type in generally sparse. As elucidated above the
overall temporal trends in the present study has revealed increasing red spruce density and to a
smaller extent red spruce dominance. This study did not reveal the mortality documented in
other studies. Siccama et al (1982) found 50% decrease in red spruce density and basal area over
15 years, while Scott et al (1984) found red spruce basal area reductions of 60% to 70% from the
76

early 1960’s to 1982. Silver et al (1991) reported a significant increase in the number of dead
red spruce trees from 26.1% to 36.7 % over a five-year period. This phenomenon of high
mortality rates was not apparent in this study.
The relative density of red spruce has increased across all of the forest zones (Figure. 30).
My data suggest that the red spruce community is advancing throughout the forest zones. This
trend of increasing density of red spruce should eventually lead to an increase in red spruce
dominance (basal area) over time, within each of the forest zones.
0
10
20
30
40
50
60
70
RS Ecotone HW
Forest Zone
Rel
ativ
e D
ensi
ty
Initial End
baba
Figure 30. The change in the relative density of red spruce over time by forest zone. Bars with different letters indicate the change was statistically significant.
Conclusions
The red spruce communities in this study are experiencing an increasing density of red
spruce over time. This increase is occurring across all forest zones. Red spruce is becoming
successfully established and expanding into the ecotone and the hardwood canopy of the
hardwood forest zone. The sites in this study represented three distinct ecological situations.
The greatest increase of red spruce was seen in the more disturbed and earlier successional sites
(Turkey Run and McGowan Mountain). The less disturbed red spruce community at Cranberry
experienced the least change. Instead of declining, red spruce populations in this study are
77

actually thriving and increasing in density of seedlings, advanced regeneration and trees across
the spruce-hardwood ecotone as well as under the surrounding hardwood canopy. Red spruce
seedling densities are greater with increased cover of bryophytes and coarse woody debris, while
densities are reduced with increasing cover of Dryopteris spp.
78

Literature Cited
Adams, H.S., and S.L. Stephenson 1994. An ecological analysis of the red spruce/northern hardwood ecotone in the Allegheny mountains of West Virgina. Proceedings of the West Virginia Academy of Sciences 65: 4-5.
Adams, H.S., and S.L. Stephenson, 1989. Old-growth red spruce communities in the
mid-Appalachians. Vegetatio 85; 45-56. Adams, H.S., S.L. Stephenson, T.J. Blasing, and D.N. Duvick, 1985. Growth-trend declines of
spruce and fir in mid-Appalachian subalpine forests. Environmental and Experimental Botany 25(4): 315-325.
Allard, H.A., and E. C. Leonard, 1952. The Canaan and the Stony river valleys of West
Virginia, Their former magnificent spruce forests, their vegetation and floristics today. Castanea 17(1); 1.
Baldwin, H.I., 1933. The density of spruce and fir reproduction related to the direction of exposure. Ecology 14(2); 152-156.
Bailey, C.M., and S. Ware. 1990. Red spruce forests of Highland County, Virginia:
biogeographical considerations. Castanea 55(4); 245-258.
Burns, R.M., and B.H. Honkala, 1990. Silvics of North American: 1. Conifers. Agriculture Handbook 654. US Dept. of Agriculture, Forest Service, Washington D.C., Vol. 2, 899 p.
Clarkson, R.B. 1964. Tumult on the mountains: lumbering in West Virginia: 1770-1920.
McClain Printing, Parsons, WV. 410 p.
Clovis, J.F. 1979. Tree importance values in West Virginia red spruce forests inhabitated by the Cheat Mountain Salamander. Proc W Va Acad. Sci. 51; 58-64.
Darlington, H.C., 1943. Vegetation and Substrate of Cranberry Glades, West Virginia.
Botanical Gazette 104:371-393. Dibble, A.C., J.C. Brissette, and M.L. Hunter Jr. 1999. Putting community data to work: some
understory plants indicate red spruce regeneration habitat. Forest Ecology and Management 114: 257-291.
Eagar, C., and M.B. Adams, editors 1992. Ecology and decline of red spruce in the
Eastern United States. Springer-Verlag. New York, N.Y.
79

Fajvan, M.A., and R.S. Seymour 1993. Canopy stratification, age structure, and development of multicohort stands of eastern white pine, eastern hemlock, and red spruce. Canadian Journal of Forest Research 23: 1799-1809.
Frank, R.M., and J.C. Bjorkbom, 1973. A silvicultural guide for spruce-fir in the northeast. FS
GTE NE-6, 15pp. Fulling, E. H. 1936. Abies intermedia, the Blue Ridge fir, a new species. Journal of the
Southern Appalachian Botanical Club 1:91-94. Geballe, G.T., W.H. Smith, and P.M. Wargo 1990. Red spruce seedling health: an assessment
of acid fog deposition and heavy metal soil contamination as interactive stress factors. Can. J. For. Res. 20: 1680-1683.
Greenwood, M., and D. McConville 2002. Factors affecting the regeneration of red spruce and
balsam fir. Cooperative Forestry Research Unit Annual Report 2001-2002 37-40. Griffith, D.M., and R.H. Widmann, 2003. Forest Statistics for West Virginia: 1989 and 2000.
USDA Forest Service Resource Bulletin NE-157, Newtown Square, PA. Hadley, J.L., and R.G. Amundson 1992. Effects of radiational heating at low air temperature on
water balance, cold tolerance, and visible injury of red spruce foliage. Tree Physiology 11(1): 1-17.
Hamburg, S.P., and C.V. Cogbill 1988. Historical decline of red spruce populations and
climatic warming. Nature 331: 428-431. Harrington, T.C. 1986. Growth decline of wind-exposed red spruce and balsam fir in the White
Mountains. Can. J. For. Res. 16: 232-238. Hicks, R.R. Jr. and D.A. Mudrick, 1994. 1993 forest health: a status report for West Virginia.
West Virginia Department of Agriculture, Charleston, WV. 68 p. Hornbeck, J.W., and R.B. Smith, 1985. Documentation of red spruce growth decline. Canadian
Journal of Forest Research 15; 1199-1201. Hughes, J.W., and D.A. Bechtel, 1997. Effect of distance from forest edge on regeneration of
red spruce and balsam fir in clearcuts. Canadian Journal of Forest Research 27: 2088- 2096.
Jacobson, G. L., Jr., T. Webb, III, and E. C. Grimm, 1987. Patterns and rates of vegetation
change during the deglaciation of eastern North America, in Ruddiman, W.F., and H. E. Wright eds, North America and adjacent oceans during the last deglaciation. Boulder, CO, Geological Society of America. The Geology of North America, v. K-3.
80

Johnson, A.H., E.R. Cook, and T.G. Siccama 1988. Climate and red spruce growth and decline in the northern Appalachians. Proceedings of the National Academy of Sciences of the United States of America 85(15): 5369-5373.
Korstian, C.F. 1937. Perpetuation of spruce on cut-over and burned lands in the higher
southern Appalachian mountains. Ecological Monographs 7(1): 126-167. LeBlanc, D.C. 1990. Red spruce decline on Whiteface Mountain, New York. I. Relationships
with elevation, tree age, and competition. Can. J. For. Res. 20: 1408-1414. LeBlanc, D.C., and D.J. Raynal 1990. Red spruce decline on Whiteface Mountain, New York.
II. Relationships between apical and radial growth decline. Can. J. For. Res. 20: 1415- 1421.
Mayfield, A.E. III., 1997. Distribution and abundance of red spruce regeneration across
spruce-hardwood ecotones at Gaudineer Knob, West Virginia. MS Thesis, West Virginia University, Morgantown. 112pp.
McIntosh, R. P. and R. T. Hurley, 1964. The spruce-fir forests of the Catskill mountains. Ecology 45(2): 314-326.
McLaughlin, S.B., C.P. Andersen, N.T. Edwards, W.K. Roy, and P.A. Layton 1990. Seasonal
patterns of photosynthesis and respiration of red spruce saplings from two elevations in declining southern Appalachian stands. Can. J. For. Res. 20: 485-495.
McLaughlin, S.B., D.J. Downing, T.J. Blassing, E.R. Cook, and H.S. Adams 1987. An analysis
of climate and competition as contributors to decline of red spruce in high elevation Appalachian forests of eastern United States. Oecologia 72: 487-501.
Mielke, M.E., D.C. Soctomah, M.A. Marsden, and W.M. Ciesla 1986. Decline and mortality of
red spruce in West Virginia. USDA Forest Service Report 86-4. Missel, N.D., 1999. The characterization of mid-Appalachian spruce-hardwood ecotones and
their spatial and temporal dynamics. MS Thesis, Clemson University. 112pp. Noble, I.R. 1993. A model of the responses of ecotones to climate change. Ecological
Applications 3(3): 396-403. Oliver, C. D., and B. C. Larson, 1996. Forest Stand Dynamics Update Edition. John Wiley &
Sons, Inc. USA, 520pp. Oosting, H.J., and W.D. Billings 1951. A comparison of virgin spruce-fir forest in the
northern and southern Appalachian system. Ecology 32(1): 84-103.
81

Pauley, E.F. 1989. Stand composition and structure of a second-growth red spruce forest in West Virginia. Castanea 54(1): 12-18.
Rheinhardt, R.D., and S.A. Ware 1984. The vegetation of the Balsam Mountains of
southwest Virginia: a phytosociological study. Bulletin of the Torrey Botanical Club 111(3); 287-300.
Risser, P.G. 1993. Ecotones: ecotones at local to regional scales from around the world. Ecological Applications 3(3): 367-368.
Roth, D.R., and T.J. Fahey, 1998. The effects of acid precipitation and ozone on the
ectomycorrhizae of red spruce saplings. Water, Air, and Soil Pollution 103: 263-276. Schuler, T.M., W.M. Ford, and R.J. Collins 2002. Successional dynamics and restoration
implications of a montane coniferous forest in the central Appalachians, USA. Natural Areas Journal 22: 88-98.
Scott, J.T., T.G. Siccama, A.H. Johnson, and A.R. Breisch 1984. Decline of red spruce in the
Adirondacks, New York. Bulletin of the Torrey Botanical Club 111(4): 438-444. Smith, D.M., B.C. Larson, M.J. Kelty, and P.M.S. Ashton, 1997. The practice of silviculture.
Applied Forest Ecology 9th edition. John Wiley & Sons, Inc. USA. 537pp. Siccama, T.G., M. Bliss, and H.W. Vogelmann 1982. Decline of red spruce in the Green
Mountains of Vermont. Bulletin of the Torrey Botanical Club 109(2): 162-168. Silver, W.L., T.G. Siccama, C. Johnson, and A. H. Johnson 1991. Changes in red spruce
populations in montane forests of the Appalachians, 1982-1987. American Midland Naturalist 125: 340-347.
Stephenson, S. L. and H. S. Adams, 1986. An ecological study of balsam fir communities in
West Virginia. Bulletin of the Torrey Botanical Club 113(4): 372-381. Stephenson, S. L. and H. S. Adams, 1984. The spruce-fir forest on the summit of Mount
Rogers in southwestern Virginia. Bulletin of the Torrey Botanical Club 111(1): 69-75.
Stephenson, S.L., and J.F. Clovis, 1983. Spruce forests of the Allegheny Mountains in central West Virginia. Castanea 48(1); 1-12.
Strausbaugh, P.D., and E.L. Core, 1977. Flora of West Virginia, second edition. Seneca Books,
Inc. Morgantown, West Virginia. Tritton, L.M., and T.G. Siccama, 1990. What proportion of standing trees in forests of the
northeast are dead. Bulletin of the Torrey Botanical Club 117(2); 163-166.
82
USDA, NRCS. 2004. The PLANTS Database, Version 3.5 (http://npdc.usda.gov/). National Plant Data Center, Baton Rouge, LA 70874-4490 USA.
U.S. Geological Survey, 1999, Digital representation of "Atlas of United States Trees" by Elbert
L. Little, Jr. http://climchange.cr.usgs.gov/data/atlas/little/ Waite, C.E., D.H. DeHayes, J. Rebbeck, G.A. Schier, and A.H. Johnson 1994. The influence of
elevated ozone on freezing tolerance of red spruce seedlings. New Phytol. 126: 327-335. Watts, W.A. 1979. Late Quaternary vegetation of central Appalachia and the New
Jersey coastal plain. Ecological Monographs 49(4): 427-469. Wu, Xinyuan, J.F. McCormick, and R.T. Busing, 1999. Growth pattern of Picea rubens prior to
canopy recruitment. Plant Ecology 140: 245-253.
83


![Phenotype features in juvenile populations of Picea abies and … · Norway spruce (Picea abies [L.] Karst.) mature trees has been used for a long time. It is based mainly on the](https://img.dokumen.tips/doc/110x75/60a18f23d0ce166df4619aeb/phenotype-features-in-juvenile-populations-of-picea-abies-and-norway-spruce-picea.jpg)


![The onset of hazel wood formation in Norway spruce (Picea abies … · 2019. 2. 27. · RESEARCH PAPER The onset of hazel wood formation in Norway spruce (Picea abies [L.] Karst.)](https://img.dokumen.tips/doc/110x75/60baf5d20cee1a3d3d5af72b/the-onset-of-hazel-wood-formation-in-norway-spruce-picea-abies-2019-2-27-research.jpg)