Embed Size (px)
DESCRIPTION
this paper shows the response of horner plot in fractured wells
Citation preview

SPE~P~ ~~73~
Analysis of Pressure Transient Data ObtainedIn Hydraulically Fractured Wells: A Field Example
by Steven E.Ross,● ChevronU.S.A.,Inc.●Member SPE
Copyright 1984, Society of Petroleum EngineersT :. ----. .... . ,.+-.4 s+ +h - 10Qfl ~.lifa. mis I?aaimpl Maa+irItY in 1 m“1k papcl waa ~if3E?m, .GU -. w,- .av T W-UAW s..- ..b~...s . . . ..--. .s. ~ ..s . . . .g B~x~, ~a Ii fnrnia. Anri I I 1-! 3, !9S4, The !’nateria!-.. -.,. . .. . . . r.-. --
issubject to correction by the author. Permission to copy is restricted to an abstract of not more than 300 words. Write:6200 North CentralExpressway,Dallas,Texas 75206.
ABSTRACT 4. A post-fracture stimulation wel1 test of thenew infill well (Well C).
The hydraulic fracture stimulation of 1ow perme-ability reservoirs has been a successful technique High - precision electronic pressure gaugesfor obtaining economic hydrocarbon production from attached to an electric 1ine enabled on-sitemaIV otherwise marginal fields. analysis to be made during the field testing.
Pressure data was recorded as frequently as five-The analysis of pressure transient data obtained second time increments during crftical periods to
in ~draulically fracturepublished by many authors~-$”s ‘as been ‘revious’y
enable an accurate analysis to be obtained.
GEOLOGY AND RESERVOIR CHARACTERISTICSThis paper utilizes these published theories for
the purpose of illustrating that data from wells in a The subject field that was evaluated is locatedCalifornia Oil Field can be analyzed with the results in the San Joaquin Valley of California. The hydro-used to guide future development. carbon fluids in this field are contained in a Mio-
cene Age Porcellanite Formation that consfsts ofINTRODUCTION relatively high porosity ( x 30%) and relatively
low permeability ( xO.1 red).The results of the analysis of pressure transi-
ent data from wells in a California Oil Field is pre- A reservoir oil of approximately 390 API oilsented in this study. Hydraulic fracture stimulation gravity is produced from the formatfon with signifi-treatments are necessary for the producing wells to cant amounts of hydrocarbon gas. A saturated oflachieve economic oil production rates. vfscosity of 0.5 cp was measured in the laboratory
::lAinitfal reservoir conditions of 1700F and 3000An extensive wall testfng program fn the subject .
field was conducted in an attempt to obtain reservoircharacteristics that would assist in the development The reservoir oil has a formation volume factorof the field on closer well spacing. of approximately 1.5 RVB/STB and contains approxi-
mately 500 SCF/STB of dissolved solution gas.High quality data was obtained for analysis by Although the reservoir ofl was determined to exist
implementing the following testing program: --*-* --*.4*+4..,.*at biibblepulrlbuullulb~ulla,no gas cap #as $n$t$al!ypresent fn the field.
1. Pressure drawdown and build-up tests on a newfnfill well (Uell C) that had not been hydrauli- UELL COMPLETIONtally fracture stimulated.
Ffgure 1 illustrates a cross-section of the2. Interference well tests utilizfng two previously reservoir with an average vertical thfckness of 300
hydraulically fractured offset wells (Wells SW feet exfsting in the field. The upper 200 feet of@ ~~) *S p~~~f~g we?l~ ~nd ~h~ new inffll *11(Hell C) as an observation well.
the formatfon fs usually perforated for oflproduction in an attempt to reduce the risk ofbottom water entry after ~draulic fracture
3. An interference well test fn which the new stimulation treatments.inffll well (Well C) was hydraulically fracturestimulated whfle four offset shut-in observation A total of 31 wells have been drilled and com-wells (Wells NW, SW, NE, and SE) were utilized pleted by Chevron tn the subject field. These wellsto record ~~ewo~r pFe~5u= -ti;pe8ge, !wt be hw~pa’ll+~allv?racture st!!nulatedto ach$eve.“”--------...
economfc production rates.
References and illustrationsat end of DaMr.
ANALYSIS OF PRESSURE TRANSIENT DATA OBTAINED2 IN HYDRAULICALLY FRACTURED WELLS A FIELD EXAMPLE SPE 12736
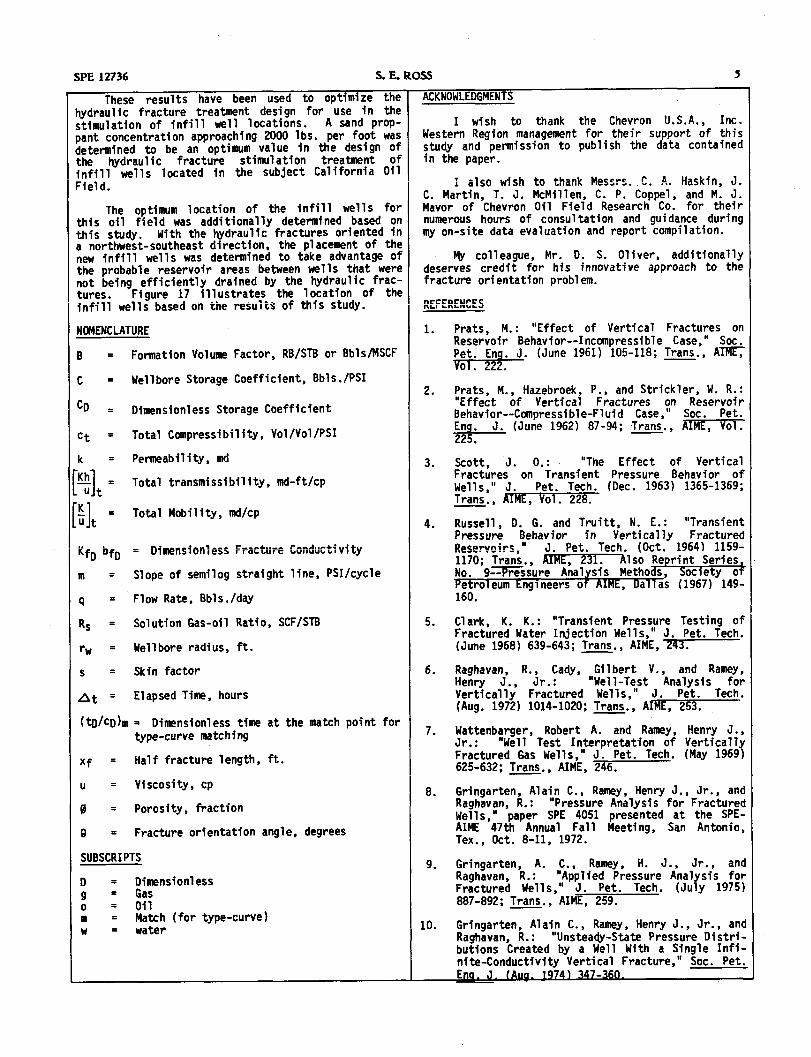
A typical stimulation treatment for wells in thefield consists of pumping approximately 55,000 gal-lons of high viscosity gelled-water fluid which wouldcontain a 20-40 mesh sand at a concentration of 4lbs./gal.
These stimulation treatments have been success-ful in increasing the initial production rate ofwel?s in this field from approximately 50 BOPD pump-ing to approximately300 BOPD flowing.
WELL TESTING PROGRAM
An extensive well testing program was conductedduring February and March of 1982 in an attempt toobtain reservoir characteristics that would assist inthe development of the subject field on closer wellspacing.
Wells in the field have been drilled on 10-acrespacing and have been on production since the fieldwas discovered in 1980.
Several well tests were conducted at the time ofdiscovery for the purpose of obtaining an initialreservoir pressure. The quality of data from thesetests did not allow in the majority of cases adetailed evaluation of the hydraulic fractures cre-ated by the stimulation treatments.
A 5-acre infill well was drilled in early 1982to provide a location for the reservoir propertiesand the hydraulic fracture stimulation treatmentdesign to be thoroughly evaluated. This wel1 is des-ignated as Well C in this study and the location ofthe wel1 is depicted in Figure 2.
The well testing program consisted of four majorevaluation periods:
1. A pre-fracture stimulation evaluation
2. Offset well interferencetests
3. A hydraulic fracture interference test, and
4. A post-fracturestimulation evaluation.
Pressure transient data obtained from wells dur-ing these evaluation periods was of high quality.High precision electronic pressure gauges attached ttan electric Tine were utiiized in every well whfcienabled on-site analysis of the data to be performsxand sufficient data to be obtained.
The results of the pressure transient analysi!of data from each evaluation period are summarized a:fol1Ows:
PRE-FRACTURE STIMULATION EVALUATION
Well C was drilled as a 5-acre infill well antis located in the center of a five-spot well patterr(Figure 2). I The offset wells (Wells”NW, SW, NE, antSE) have been producing since 1980.
A high-precision electronic pressure gauge wa!run into Well C after perforating the formation 01interest in an attempt to obtain a static reservoi!pressure.
Pressure interference was observed from theoffset producing wells during the static pressuresurvey as illustrated in Figure 3. The pressuregauges recorded pressure fluctuations between 2295and 2331 psia during 10 hours of observation timeprior to testing the subject well.
An attempt to flow test Well C prior to a frac-ture stimulation treatment was unsuccessful evenwhen nitrogen was pumped down coiled tubing tounload the wel1bore of fluids.
A bottom hole pressure of approximately 500psia was observed after discontinuing the nitrogenlift. The reservoir pressure increased to 2066 psiaafter 64 hours of shut-in time. The offsetproducing wells were shut-in in an attempt toeliminate possible interference during the build-upperiod for Well C.
An attempt to quantify reservoir propertiesfrom the reservoir pressure data obtained duringthis unsuccessful pre-fracture stjyulation test wasmade using published type-curvesll for wells withstorage and skin.
Figure 4 illustrates a type-curve match of thereservoir pressure data. From this type-curvematch, an effective permeability value of 0.10 mdresults by utilizing the following equation:17
~ = 3389 U C (tD/CD)~
h ( At)m $ (1)
A skin factor of .0.0 also results from the;;~:~yrve match by utilizing the following equa-
S . 1/2 in (CDe2s)m s (2)
This analysis supports the low flow rateobtained from Well C. The low effective reservoirpermeability did not allow significant reservoirfluids to be produced.
OFFSET WELL INTERFERENCETESTS
Due to the pressure inte%erence (Figwe 3)observed in Well C from the offset producing wellsduring the initial static pressure survey, anattempt to determfne reservoir anfsotropy withadditional interferencetests was made.
The offset producing wells (Figure 2) had beenhydraulically fracture stimulated in 1980 when firstplaced on production. It was speculated that aninterference test conducted between Well C and theoffset producing,wells would indicate a preferentialdirection for pressure response to be observed dueto the orientation of the existing hydraulicfractures associated with the stimulated producingwells.
Wells SW and SE were selected to be used in theinterference tests with Well C. A high-precisionele&ronic pressure gauge was run into Well C torecord reservoir pressure interference created byflow testing Wells SW and.SE.

SPE 12736 S. E. ROSS 3
Well SE was utilized in the first interferencetest in an attempt to determine reservoir ccmsnunica-tion with Well C in the northwest-southeast direc-tion. Well SE was flow tested for 3 hours at a rate---- ..-—of 650 BPD and 4200 MS~HJ.
Figure 5 illustrates reservoir pressure datarecorded in Well C during this first interferencetest. Th~ reservoir pressure was decreased fromapproximately 2225 psia to 2105 psia fn Hell C diietothe flow test in Well SE. This pressure response wasobtained in approximately 1740 minutes (29 hours).
The reservoir pressure was continued to beobserved for approximately 120 hours in Well C beforeconducting a second interference test utilizing WellSw. Well SW was flaw tested for 1 1/2 hours at arate of 400 BPO and 3000 MSCFO.
High-precision electronic pressure gauges werepositioned in both wells during the interferencetest. Figure 6 illustrates the pressure drawdownobserved in Well SW during the flow test and theresulting pressure interference observed in Well Capproximately 100 hours IateP. The f?w test i!l!&211SW caused the reservoir pressure to be reduced fromapproximately 2210 psia to 2185 psia.
From the reservoir pressure data obtained fromthe two separate interference well tests, an aniso-tropic permeability system is inferred. The firsttest conducted between Wells SE and C resulted in apressure response that was observed in less time thanthe pressure response observed during testing betweenHells SW and C. Based on these differences inresponse time, it can be qualitatively concluded thatthe permeability in the northwest-southeastdirectionis much higher than the permeability in the north-east-southwestdirection.
This preferential direction of pressure responseand permeability is most likely due to the hydraulicfractures in Wells SE and SW being aligned in anorthwest-southeast direction. Since a hydraulicfracture orientation of northwest-southeast wouldresult in no direct high permeability path existingbetween Wells SW and C, reservoir pressure responseduring the interference test required more time to beobserved than in the interference test conductedbetween Wells SE andC.
HYDRAULIC FRACTURE INTERFERENCETEST
In preparation of observing possible pressureresponse during the hydraulic fracture stimulationtreatment of’Well C, high-precision electronic pres-sure gauges were positioned in offset Wells NW, NE,SW, and SE. This type of test is similar to a previ-ous test published by Komar and Shuck.20
The offset wells had been shut-in for as long as340 hours and had welJ established “base” pressurebuild-up trends. Figure 7 illustrates the reservoirpressure data obtained in the offset weiis prior toconducting the hydraulic fracture treatment of Wellc.
Well C was hydraulically fracture stimulatedwith approximately 53,000 gallons of geiiea fracturefluid which contained approximately 170,000 lbs. of20-40 mesh sand proppant.
Reservoir pressure response in offset Well NEoccurred in approximately 1 hour, whereas the pres-sure gauges in the other three offset wells (NW, SW,and SE) recorded no detectable increase in reservoirpressiire6bove the ‘lba~ettre~ervoir nressure trendfor each well.
~.------Figure 7 illustrates the reservoir
pressure response observed fn each well during andafter the hydraulic fracture treatment.
The ~eser~~i~ pr~~~~r~ in Well NE was observedtO deviate more radically from the “base” reservoirpressure trend after approximately 17 hours from thetfme the hydraulic fracture treatment was started.Figure 8 illustrates thfs pressure response.
The “early tfme” pressure response recorded inWell NE (Ffgure 8) has been explained by 01fver31usfng porous-elastfc theory in whfch the compressivestress on the formatfon during the hydraulicfracture treatment caused a decrease in the porevolume around the observation Well (NE) and aresultant increase in the pore pressure.
Wfth the sensftive pressure gauges used in theQff@ we~~s during the hYdra~lic fracture stimula-tion treatment, a reservofr pressure response ofapproximately 0.5 psia, resultfng from the compres-sive stress on the formatfon,was recorded.
The “late tfme” pressure response recorded inWell NE (Ffgure 9) fs most likely due to the arrivalof the pressure transient created by pumping hydrau-lfc fracturing flufd into the reservoir during thestimulation treatment of Well C.
The “late tfme” pressure interference observedin Well C was analyzed usf
? f;;’;;::f:;r;:”~;generated by Urafet et a12data obtained in fractured wells. Ffgure 10 fllus-tra~es the type-curve match obtained wfth the “latetfme” reservoir pressure data recorded in Well NE.The data matxhes a fracture orientation of approxi-mately 900 relative to the locatfon of Well C. Thfswould orfent the hydraulfc fracture in a northwest-southeast dfrectfon; similar to the northwest-southeast Pe-f;b:lity orientation interpretedqualitatively the previously conductedinterference tests involvfng offset Wells SWand SE.
The use of porous-elastfc theory by 01fver31allows the hydraulic fracture orientation to also beinterpreted. A value for the orientation of 350 (+200) west of north was obtafned by Oliver and i~consistent wfth the northwest-southeast(450 west ofnorth) interpretation for the hydraulic fractureOrientation found fn thfs study.
The nearby San Andreas Fault fs interestinglyoriented in a sfmilar northwest-southeastdfrection(Ffgure 11). This oriqjtatfon is reflective of theregfonal earth stresses~l and wouicitend to expiainwhy the orientation of the hydraulfc fractures fnthis field are sfmilar.
The “late tfme” pressure data was additionallyanalyzed using a computer sfmulator to obtain thetotal effective reservofr transmfssibflfty (Kh/u)t.Ffgure 12 illustrates that a value of 1443 md-ft/$~aiiows the “iate tfme” preSxm~ data ebseewd ,r,
--- ----
Well NE to be approximated.

ANALYSIS OF PRESSURE TRANSIENT DATA OBTAINED~1 IJ-D IIIII w al I v I=u ArII Tnsn WFI.1s. A Fli?Ln EXAMPLE SPE 12736Uw 11 1 Umnus-bu-u . . ..’ .-. -.. — ------ . . . .—-— —..- ----- ——
)ST-FRACNRE STIMULATION EVALUATION Figures 15 and 16 il1ustrate a match of the
Evaluation of the hydraulic fracture stimulationpressure transient data with the finite-conductivityvertical fracture type-curve.13 The total effective
.eat,mentof Well C was attempted by conducting a fracture length for each well was calculated from“awdown and build-up test. The pressure transient the typ -curve
3match by using the following
ita obtained during these tests were analyzed to equationl?termine characteristics of the propped vertical.acture.
[ [10.000264 K2xf=2—– 1(&/tD)~ ,Oct u t
(5)
Well C was flow tested for approximately 87~urs through a 16/64-inch fixed choke at a rate of A total effective fracture length (2xf) of 49
10 BOPD. The well was shut-in for approximately 49 feet for Well C and 184 feet for Well 1 was calcu-
~urs following the flow period. Figure 14 lated using this type-curve. The calculated
illustrates a conventional Horner PIOt Of thefracture lengths are consistent with the sand
ressure build-up data. proppant concentration used in each well. Well Awas hydraulically fracture stimulated with a sand
Anal sis of the semi-log graph using the eqiii3--------
3
~ro~pant concentration of 966 lbs. per foot whereas
tion 9s30 Well 1 was stimulated with a concentration of 1428lbs. per foot.
1[~ 162.6 qoBo + (qg -. 1001 (qoRs)) Bg+c@w , (3) The use of linear and/or bilinear analysis=—
Utmtechniques to determine fracture length was notpossible due to the ‘masking’ of the early-timepressure transient data by wellbore storage.
yields a total effective reservoir ~ransmiss~-ility (Kh/u)t value of 1744 md-ft/cp. This value ‘s CONCLUSIONS
ery similar to the transmissibility (1443 md-ft/cp)btained by computer simulation of the pressure tran- The well testing effort described for the sub-
ient data observed in offset Well NE during the ject California Oil Field resulted in high quality
ydraulic fracture stimulation treatment of Well C. pressure transient data that could be either quanta-tively or qualitativelyanalyzed.
A skin factor value of -1.4 was additionallybtained by analyzing the semi-log graph using the The analysis of the pressure transient data
quationa~30 allowed the following reservoir characteristics tobe approximated:
,= 1.15
{
Pw -
1
1. Reservoir permeability is low and does notm ) + 3.23 , (4) allow economic oil flow rates from wells to be
obtained without a significant hydraulic frac-ture stimulation treatment.
The negative skin factor is indicative of stimu- 2. The orientation of the Mdraulic vertical frac-ation of the reservoir due to the hydraulic fracture ture was determined to be approximately north-:reatment. west-southeast (450 west of north). This
Additional pressure data from the offset wellsorientation results from the application ofseveral methods and/or observations:
Iere analyzed to yield skin factor values ranging‘mm -2.3 to -3.8. (a) Porous-elastictheory applied by 01iver31,
An interesting correlation is obtained for wells(b) Use of the Uraiet et al 24 type-curve for
pressure transient data,in this field if the skin factor is graphed as aFunction of the sand proppant concentration or the
(c) Offset~ll interferencetests, and
unount of sand used in the hydraulic fracture stimu-(d) Orientation of the major San Andreas Fault
lation treatment divided by the perforated intervalzone.
thickness. Figure 14 illustrates this correlation. 3. A negative skin factor, reflecting theformation stimulation of the hydraulic fracture
A skin factor value equal to zere is predictedFrom this correlation when no sand proppant is uti-
treatment, is apparent for the wells tested
Iized. This correlation indicates that optimizationusing conventional semi-log (Horner) analysisof the pressure transient data. The skin
>f well productivity is possible by increasing the factor values correlate as a function{mofe;~sand proppant COiiWiiti%tiCfi.
A -.”.4 .--.= + t-nnrOn-n >allu pl “ppd. “v,,”-.. >ard pi%~~tiflt CO!K~Ht!’~tiCR QSd . ..-...
tration of at least 2000 lbs. per foot of perforated-----
interval thickness would potentially result in a skinrespective hydraulic fracture stimulationtreatment.
Fartnr V~~UQ Of -5 (Figure 14),, ““ ““.
4. The total effective fracture length was deter-The negative skin factor in a hydraulically
fractured well has been denmnstrated by manymined for several wells using the Cinco-Ley etal13 type-curves for finite-conductivityverti-
authors 1,14 to be related to the effective fractureType-curves published by Cinco-Ley et all3
cal fractures. The calculated fracture lengths.ength.fere utilized in an attempt to determine the
are also consistent with the sand proppant con-centration used in the hydraulic fracture
!ffectivefracture length for Well C and for Well 1,:he discovery well.
stimulation treatments.
SPE 12736 S. E. ROSS 5
These results have been used to optimize theIydraulic fracture treatment design for use in thesimulation of infill well locations. A sand prop-lantconcentration approaching 2000 lbs. per foot wasDetermined to be an optimum value in the design of;he hydraulic fracture stimulation treatment of‘nfill wells located in the subject California Oil‘ield.
The optimum location of the infill wells forthis oil field was additionally determined based on:his studY. With the hydraulic fractures oriented inI northwest-southeastdirection, the placement of the}ew infill wells was determined to take advantage ofthe probable reservoir areas between wells that were]ot being efficiently drained by the hydraulic frac-tures. Figure 17 illustrates the location of theinfillweiis based on the resuitS of thiS stdy.
U)MENCLATURE
1 = Formation Volume Factor, RB/STB or BblsflSCF
m .. Wellbore Storage Coefficient, Bbls./PSI
.●D = DimensionlessStorage Coefficient
~t = Total Compressibility,Vol/Vol/pSI
k . Permeability,md
1KJ=Total transmissibility,md-ftlcpUt~
1. Total Mobility, llld/CP
Ut
Kfo bfo = m!-.--*- ‘1--- r--,.&m.A f.,.mA,,.-+4,,4+.,ul~nslunlt?~>rra~~ur= WIUUGL.IV,.J
m= Slope of semilog straight line, PSI/cycle
q . Flow Rate, Bbls./day
Rs = Solution Gas-oil Ratio, SCF/STB
rw = Wellbore radius, ft.
s = Skin factor
At = Elapsed Time, hours
(tD/CD)m= Dimensionless the at the match point fortype-curve matching
Xf = Half fracture length, ft.
u = viscosity, Cp
0= Porosity, fraction
Q= Fracture orientation angle, degrees
SUBSCRIPTS
D= ~)irmsionless9 .o= oilm= Match (for type-curve)w= water
ACKNOWLEDGMENTS
I wish to thank the Chevron U.S.A., Inc.Western Region management for their support of thisstudy and permission to publish the data containedin the paper.
...*-l.t. thefikMe~~r~O C. A,.l.lackin1I also WlallC. Martin, T. J. McMillen, C. P. Coppel,’~~~”M~ ~uMavor of Chevron Oil Field Research Co. for theirnumerous hours of consultation and guidance duringmy on-site data evaluation and report compilation.
My colleague, Mr. D. S. Oliver, additionallydeserves credit for his innovative approach to thefracture orientation problem.
1.
2.
3.
4.
5.
6.
7.
8.
9.
10.
Prats, M.: “Effect of Vertical Fractures onReservoir Behavior--Incompressible Case,” Sot.
_(June 1961) 105-118; ~., A=
Prats, M., Hazebroek, P., and Strickler, W. R.:“Effect of Vertical Fractures on ReservoirBehavior--Compressible-Fluid Case,” Sot. Pet.Eng. J. (June 1962) 87-94; Trans., AIME, Vol.225.
Scott, J. O.: “The Effect of VerticalFractures on Transient Pressure Behavior ofWells,” J. Pet. Tech. (Dee. 1963) 1365-1369;Trans., ~, Vol. 228.
Russell, D. G. and Truitt, N. E.: “TransientPressure Behavior in Vertically FracturedRaenwn+r<.”,----- . - . . - , d. F@: Tech, (Oct. 1964) 1159-1170; Trans., Ink 231. Also Reprint SeriesNo. 9-~ssure A;alysis Methods, Society 0+Petroleum hmineers of AIME, Dan as (1967) 149-160. -
Clark, K. K.: “Transient Pressure Testing ofFractured Water Injection Wells,” J. Pet. Tech.(June 1968) 639-643; Trans., AIME,%13.
Raghavan, R., Cady, Gilbert V., and Ramey,Henry J., Jr.: “Well-Test Analysis forVertically Fractured Wells,” J. Pet. Tech.(Aug. 1972) 1014-1020;Trans., A~L, 253.
Wattenbarger, Robert A. and Ramey, Henry J.,Jr.: “Well Test Interpretation of VerticallyFractured Gas Wells,” J. Pet. Tech. (May 1969)625-632; Trans., AIME, 246.
Gringarten, Alain C., Ramey, Henry J., Jr., andRaghavan, R.: “Pressure Analysis for FracturedWells,” paper SPE 4051 presented at the SPE-AIME 47th Annual Fall Meeting, San Antonio,Tex., Oct. 8-11, 1972.
Gringarten, A. C., Ramey, ii. J., Jr., andRaghavan, R.: “Applied Pressure Analysis forFractured Wells,” J. Pet. Tech. (July 1975)887-892;~., AIME, 259.
Gringarten, Alain C., Ramey, Henry J., Jr., andRaghavan, R.: “Unsteady-StatePressure Distri-butions Created by a Well With a Single Infi-nite-ConductivityVertical Fracture,” Sot. Pet.Ens. J. [~ 1974) 347-360.

ANALYSIS OF PRESSURE lT6 IN HYDRAULICALLY FRACTUR
11.
12.
13.
L4.
15.
16.
!7.
18.
19.
20.
21.
22.
23.
24.
Raahavan. R.: “Some Practical Considerations inth~ Analysis of Pressure Oata,” J. Pet. Tech.(Oct. 1976) 1256-68.
Ramey, H. J., Jr.: “Practical Use of ModernWell Test Analysis,” Paper SPE 5878 Presented atthe SPE-AIME 51st Annual Fall Meeting, NewOrleans, Oct. 3-6, 1976.
Cinco-Ley, H., and Samaniego V., F.: “Effect ofWellbore Storage and Oamage on the TransientPressure Behavior of Vertically FracturedWells,” paper SPE 6752 presented at the SPE-AIME52nd Annual Fall Meeting, Oenver, Oct. 9-12,1977.
Cinco-Ley, H., and Samaniego V., F., andDominguez-A, N.: “Transient Pressure Behaviorfor a WellS~thp:tFi~~ Conductivity VerticalFracture,” . . q. J. (Aug. 1978) 253-264.
Cinco-Ley, H., and Samaniego V., F.: “TransientPressure Analysis for Fractured Wel?s,” J. Pet.Tech. (September 1981).
Cinco-Ley, H., and Samaniego V., F.: “TransientPressure Analysis: Finite Conductivity FractureCase Versus Damaged Fracture Case,” paper SPE10179 presented at the SPE-AIME 56th Annual FallMeeting, San Antonio, (Oct. 5-7, 1981).
Gringarten, A. C., Bourdet, D., Landel, P. A.,and Kniazeff, V.: “A CcnnparisonBetween Oiffer-ent Skin and Wellbore Storage Type-Curves forEarly Tim Transient Analysis,” paper SPE 8205presented at the SPE-AIME 54th Annual Fall Meet-ing, Las Vegas, Sept. 23-26, 1979.
Elkins, L. F. and Skov, A. M.: “Determinationof Fracture Orientation From Pressure Interfer-ence,’’-., AIME (1960) 219, 301-304.
Komar, C. A. et al.: “Delineating a SubsurfaceFracture System in a Petroleum Reservoir--i%Experiment,”J. Pet. Tech. (Mqy 1973) 531-37.
Komar, C. A. and Shuck, L, Z.: “PressureResponses From Induced Hydraulic Fractures inAdjacent Wells Within a Petroleum Reservoir: AnExperiment,”J. Pet. Tech. (Aug. lg75) 951-53.
Raney, H. J. Jr.: “Interference Analysis forAnisotropic Formations--A Case History,” J. Pet.Tech. (Oct. i975) 1290-%3; Trans., AHiE, c25X--
Locke, C. O. and Sawyer, W. K.: “Constant Pres-sure Injection Test in a Fractured Reservoir--History Match Using Numerical Stimulation andType Curve Analysis,” paper SPE 5594 presentedat the SPE-AIME 50th Annual Fall Meeting,Dallas, Sept. 28-Ott. 1, 1975.
Pierce A. E., Vela, S., and Koonce, K. T.:“Determination of the Compass Orientation andLen th of Hydraulic Fractures by Pulse Testing,”J.?et. Tech. (Dec. 1975)1433-38.
Uraiet, A., Raghavan, R., and Thomas, G. W.:“Determination of the Orientation of a VerticalFracture by Interference Tests,” J. Pet. Tech.1
~.. AIME. 263. 1
\NSIENT DATA OBTAINEDDWELL3 AFIELD EXAMPLE SPE 12736
25.
26.
27.
28.
29.
30.
31.
Cinco-Lv, H., and Samaniego V., F.:“Determination of the Orientation of a FiniteConductivity Vertical Fracture by TransientPressure Analysis,” paper SPE 6750 presented atthe SPE-AIME 52nd Annual Fall Meeting, Oenver,Oct. 9-12, 1977.
Ekie, S., Hadinoto, N., and Raghavan, R.:“Pulse-Testing of Vertically Fractured Wells,”aper SPE 6751 presented at the SPE-AIME 52nd
~nnual Fall Meeting, Denver, Oct. 9-12,1977.
Abobise, E. O., and Tiab, D.: “DeterminingFracture Orientation and Formation Permeabilityfrom Pulse Testing,” paper SPE 11027 presentedat the SPE-AIME 57th Annual Fall Meeting, NewOrieans, Sept. 26-29, 1%%?.
Kamal, M. M.: “Interference and PulseTesting--A Review,” J. Pet. Tech. (Dec. 1983)2257-70.
Perrine, R. L.: “Analysis of Pressure BuildupCurves,” Drill. and Prod. Prac., API (1956)482-5C9.
Martin, John C.: “Simplified Equations of Flowin Gas Drive Reservoirs and the TheoreticalFoundation of Multiphase pressure BuildupAnalyses,” Trans., AIME (1959) 216, 309-311.
Oliver, D. S.: “Pressure Transients Caused byFracturing,” paper SPE 12735 presented at the1984 California Regional Meeting, Long Beach,April 11-13.

o
0
0
0
I
+Well C
WellSW
Well hWell SE
Well
o
0
0
300’
Fig. 1 – Cross-Section of Reservoir
SubjectTer$tAree
o
0
0
●c
/’....................................: :j NW. ●NE ~: :: :: :
:: :: :: :: ::~ Sw” ‘SE ~
:.....................................
o 0 0
Fig.2- AreelWell LocationMep
o
0
00
0
●1
o
0
0
sp E1273b

2340
2330 -
Pressure GaugeOn Bottom
~ 2320(nLQ’ :1/
:w
z 2310 -
2300 -
2290 I I &O.Q1 0.1 1 10
Elapsed Time, Hours
fig. 3–Static Pressure survey In Infill well c
10,000 1
I
I
Type-Curve (Gringarten et al ‘ 7,<~
m’F21,000 -ual5mma)& Type-Curve Match
PD* 0.3, AP=l 00 PSIA
lCD=5.5,At=l 000 Mins.
Actual Data
100 I I
10 100 1,000 10,000Elapaed Time, Minutes”
Fig.4-Type-CurveMatchofPressureDataFromWellC

————----
123001- Flow Test
1/ Offset Well SEFor 3 Hours
1(/ Pressure Response
<2250 Observed in Well Czna- . . . . . . . . . . . . . . . . . . . . . . . . . . . . . . . . . . . . . . . .5UYm
z 2200 \120 PSIA
t w
/,!?’’/,,,,/’-=
2150
21000 1000 2000 3000 4000 5000 6000 7000
Elapaed Time, Minutes
Fig. 5–Pressure Response In Well C After Flow Teat of Well SE
I 2215I
PressureResponse,Observedin Well C
2000
% 1900
k
Flow Testn of Offset Well SWa-~
# 1800
................. ...........................................................
I
~:”bw“ 2A.
Wall C Data
Zls:dTime, Hours
Wall SW Data
1600 1 I I 1 I00
----0 20 40 60 80 1(
Time, Minutes
Fig. 6–Pressure Response in Well C After Flow Test of Well SW
SP E12736

> 1 I 1 1
* m * UIo 0 mz m w In
Vlsd %MISSQJ
.
1
1i
-1
I
Vlsd 10JllSSaJd
v

4 en’) nI UUL.=
1602.4
r-”:160109
a t
1600.41 ; I I I I I
339.5 340.0 340.5 341.0 341.5 342.0Elapsed Ttme, Hours
FifJ.8–” Early Time” Pressure Response in Offset Well NE
16191L
1614 -
$1609 -na’5mw
:1604 -
159 9-
“Late ~me” pressure Response
Start FractureStimulation of Well C
Pressure ResponsePrior to Fracture
,7 “Earl; Time” Pressure Response
1 I IQ 350 360 370Jpsed Time, Hours
Fig. 9- “LateTime’’PressureResponse inOffsetWellNE

Type-Curves100
~Fracture
&% (Uraiet et al
Orientation.*.08●
(e) -0:..”:5::””
..””.”””90°# ..●.* ..
O\~NE
:(\
/“ /+- /..””10 ●.*
% /●.●.”” %.,..” /c .“;
< . &..”Z %0. ..”
,\
@p..* G@
a’m :* ‘%
jl
m Actual Data& f)htsknrl in Wall NEz
II
““. ”,,.-” ... . . . .. ---
m After Hydraulic Fracturea Stimulation of Well C&
24)
0.1
II Type-Curve Match&=10 PSIA,P~O.11. . . .. Ai. ——
11
+-t 9-A EnSl=l w nrs., -UIr L-u.==D
o.o,~o10
Eiapsed Time, Hours
Fig. 10-Type-Curve Match of Pressure Data From Well NE
Fig. 11–Orientation of San Andreaa Fault

; (J ..- ●.-.... ....*n “: 1443 ..””;..””a- ....Z5 - .“ ...
.“2 .“u .“
.“04 - .“5 .“w .“m .“??3 - .“n .“
.“
2 ‘Pressure Reeponse :
1
Elapsed Time, Hours
Fig. 12– Computer Simulation of “Late Time” Pressure Response In Well NE
1980- ..“..
P*=2002 PSIA “... m=63 psi/cycle
\
1960I \
PI hr =1 879 pSia
1900 - \ ““...●.*
“.*●.O
●.●...
●..1880
t L
1 10 1
T+-ATIAT
Fig. 13-Peat-Fracture Stimulation Pressure Build-Up Analysis of Well C
SP E1273b

14-CorNISt”m of HydrsulicFraotumStimulationResults
14
0.1 1 10 100 1000 10,000
Elapsed Time, Minutes
Type-Curve (Cinco-Ley et 01‘ 3,
KfDkD= %\
Actual Data
Type-Curve Match
pD+.5,~=30 PSIA
td X 10-3* At= 0.4 reins.
cDf+)-’
F@ 15-Typs-Cume Match of Pressure Data From Well C
sp~@b

1000Type-Gurve (Cinco-Ley et al 13,
kfDbf&2T ~azLa- 1 _~=c
-“---- ----
; 100 r
al5m
[email protected], AP=l 00 psiamal tD+i)(l 0-2, At=l hrIi CDf=l o-2
10t I L
0.01 0.1 1 10 100 1000
Elapsed Time, Hours
Fig. 16–Type-Curve Metch of Pressure Data From Well 1
Fig. 17-Optimum Infill Well Locations
SP E~273b