Embed Size (px)
Citation preview

Analysis of Precipitation Distributions Associated with Two Cool-Season
Cutoff Cyclones
Melissa Payer, Lance F. Bosart, Daniel KeyserDepartment of Atmospheric and Environmental Sciences
University at Albany, SUNY
Neil A. Stuart and Thomas A. WasulaNOAA/NWS, Albany, NY
NROW XI
5 November 2009
NOAA/CSTAR Grant NA07NWS4680001

Motivation
• Forecasting precipitation distributions associated with 500 hPa cool-season cutoff cyclones can be a challenge in the Northeast
• Forecast uncertainties often arise due to variation in cutoff speed and interaction with the complex topography in the Northeast
• Identifying signatures differentiating between precipitation distributions would help forecasters

Objectives
• Determine how synoptic and mesoscale features affect precipitation distributions through several case studies of difficult-to-forecast cutoffs as well as cutoffs associated with varying precipitation distributions
• Identify common signatures differentiating between various precipitation distributions

Data
• 1.0° GFS
• 2.5° NCEP–NCAR reanalysis data– Climatologies created for 1979–2008
• Standardized anomalies fields were created from the 1.0° GFS analyses with respect to climatology
• 6-h National Precipitation Verification Unit (NPVU) QPE

Methodology
• Cool-season: Oct 1–Apr 30
• Analysis period: 2004/05–2008/09
• Cutoff domain: 35–52.5°N, 90–60°W
• Cutoff criteria:– Duration > 12 h– 30-m height rise in all directions
• Precipitation domain: New England, NY, PA, NJ
• Heavy precipitation: > 25 mm of precipitation over the Northeast in a 24-h period from 1200 UTC to 1200 UTC

Case Study 1: 8–9 March 2008
• Fast-moving cutoff
• Widespread flooding event with some icing reported in the Adirondacks
• Numerical models showed considerable variability in forecasting the cutoff 3–8 days prior to the event
• Forecasts confined the heavy precipitation to coastal regions; however widespread heavy precipitation was observed throughout much of the Northeast

8–9 March 2008500 hPa Mean Heights (dam)
and Track of Cutoff
8–9 March 20082-day NPVU QPE (mm)
8–9 March 2008 Cutoff
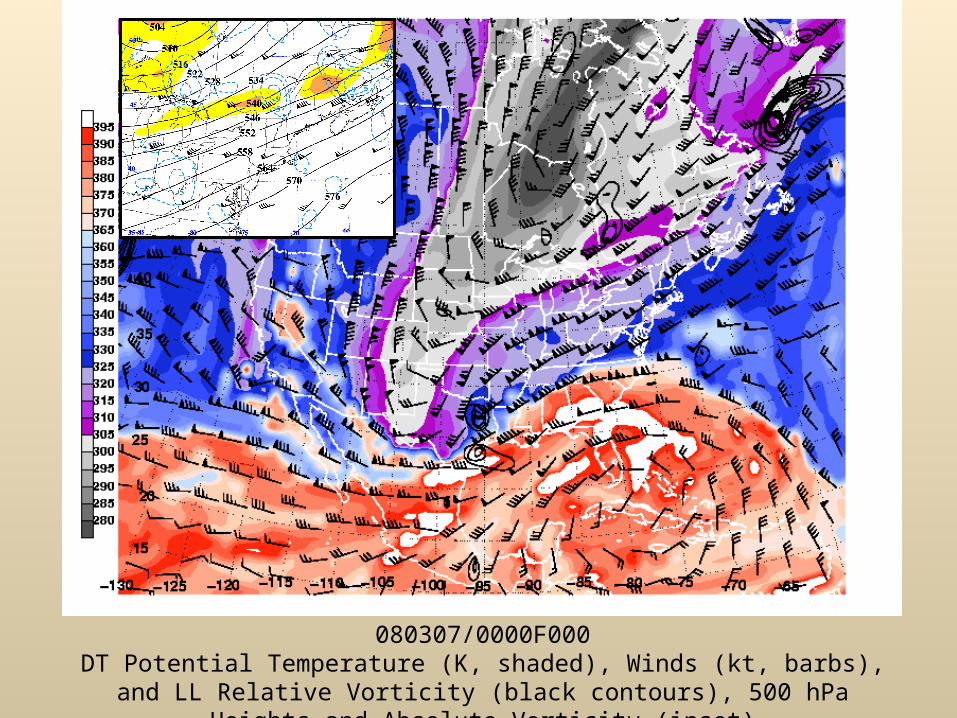
080307/0000F000DT Potential Temperature (K, shaded), Winds (kt, barbs), and LL Relative Vorticity (black contours), 500 hPa Heights and Absolute Vorticity (inset)
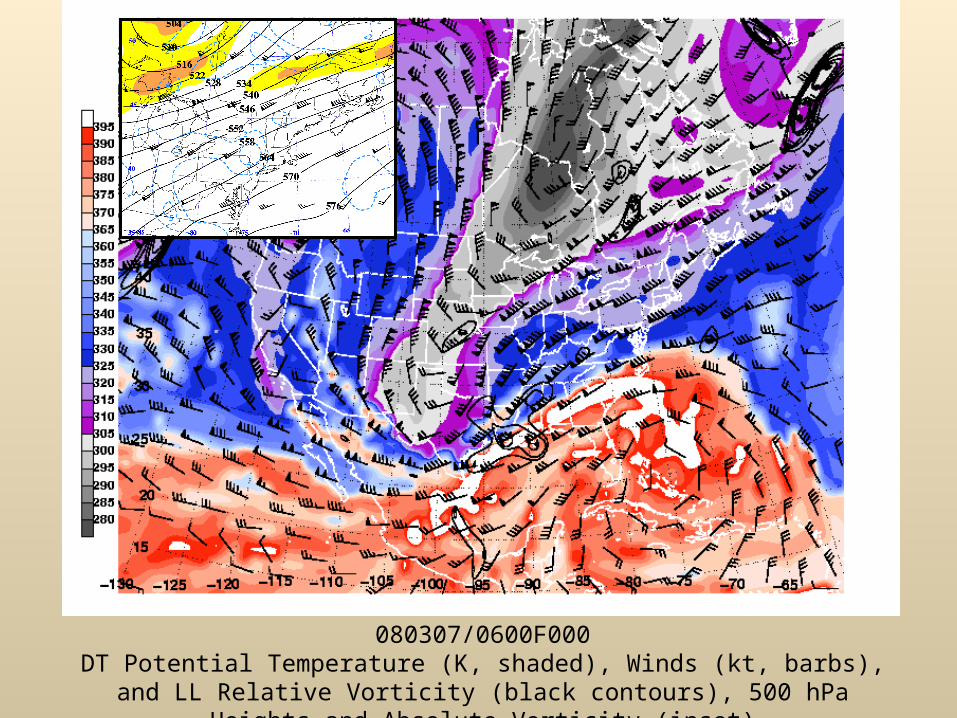
080307/0600F000DT Potential Temperature (K, shaded), Winds (kt, barbs), and LL Relative Vorticity (black contours), 500 hPa Heights and Absolute Vorticity (inset)

080307/1200F000DT Potential Temperature (K, shaded), Winds (kt, barbs), and LL Relative Vorticity (black contours), 500 hPa Heights and Absolute Vorticity (inset)

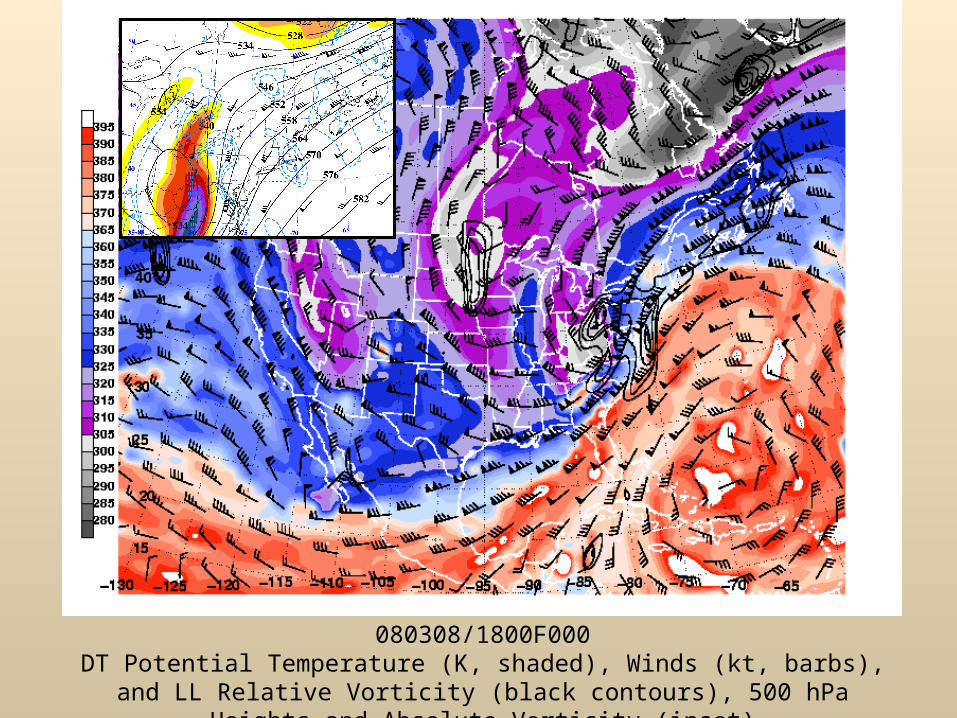
080307/1800F000DT Potential Temperature (K, shaded), Winds (kt, barbs), and LL Relative Vorticity (black contours), 500 hPa Heights and Absolute Vorticity (inset)

080308/0000F000DT Potential Temperature (K, shaded), Winds (kt, barbs), and LL Relative Vorticity (black contours), 500 hPa Heights and Absolute Vorticity (inset)

080308/0600F000DT Potential Temperature (K, shaded), Winds (kt, barbs), and LL Relative Vorticity (black contours), 500 hPa Heights and Absolute Vorticity (inset)

080308/1200F000DT Potential Temperature (K, shaded), Winds (kt, barbs), and LL Relative Vorticity (black contours), 500 hPa Heights and Absolute Vorticity (inset)
080308/1800F000DT Potential Temperature (K, shaded), Winds (kt, barbs), and LL Relative Vorticity (black contours), 500 hPa Heights and Absolute Vorticity (inset)
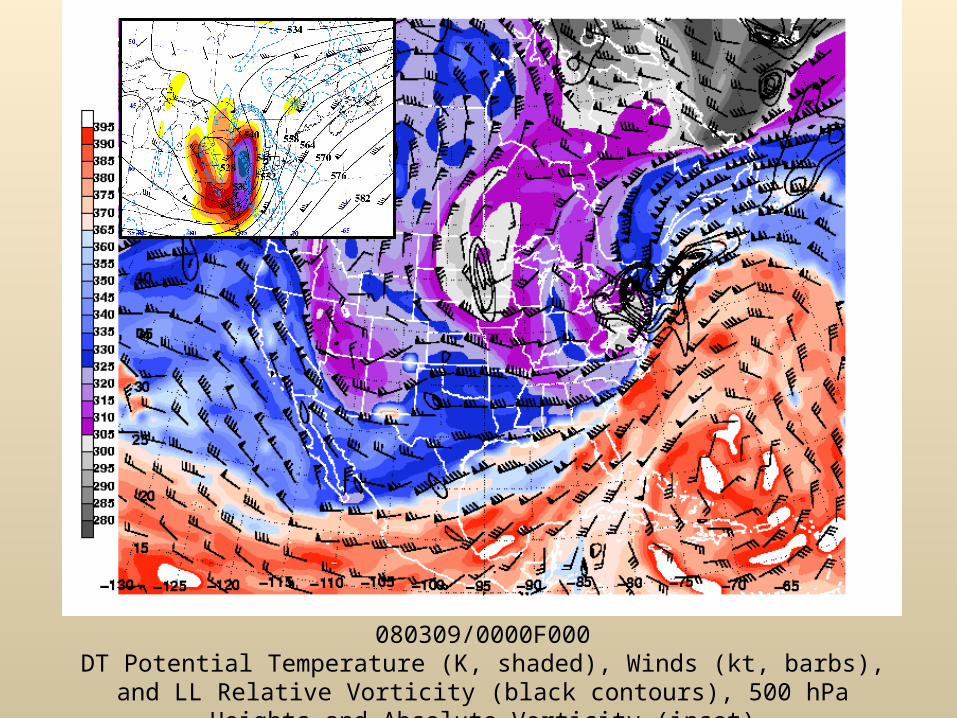
080309/0000F000DT Potential Temperature (K, shaded), Winds (kt, barbs), and LL Relative Vorticity (black contours), 500 hPa Heights and Absolute Vorticity (inset)

080309/0600F000DT Potential Temperature (K, shaded), Winds (kt, barbs), and LL Relative Vorticity (black contours), 500 hPa Heights and Absolute Vorticity (inset)

080309/1200F000DT Potential Temperature (K, shaded), Winds (kt, barbs), and LL Relative Vorticity (black contours), 500 hPa Heights and Absolute Vorticity (inset)

080309/1800F000DT Potential Temperature (K, shaded), Winds (kt, barbs), and LL Relative Vorticity (black contours), 500 hPa Heights and Absolute Vorticity (inset)

080310/0000F000DT Potential Temperature (K, shaded), Winds (kt, barbs), and LL Relative Vorticity (black contours), 500 hPa Heights and Absolute Vorticity (inset)
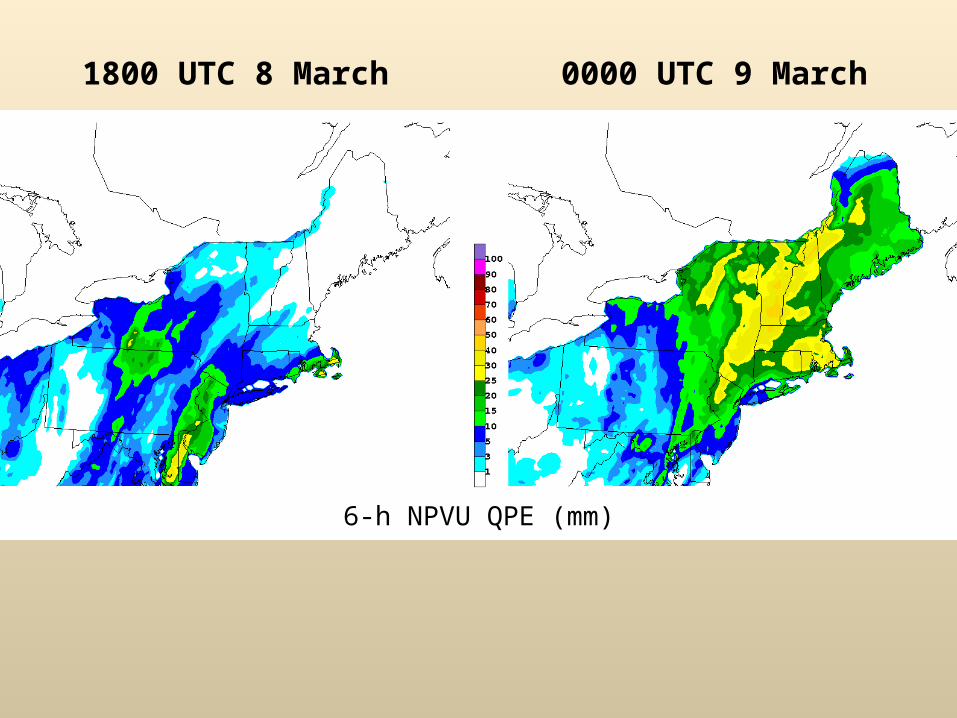
1800 UTC 8 March 0000 UTC 9 March
6-h NPVU QPE (mm)

1800 UTC 8 March 0000 UTC 9 March
250 hPa Geo. Heights (dam, solid contour), Winds (ms-1, shaded), and Divergence (x 10-5 s-1, dashed contour)
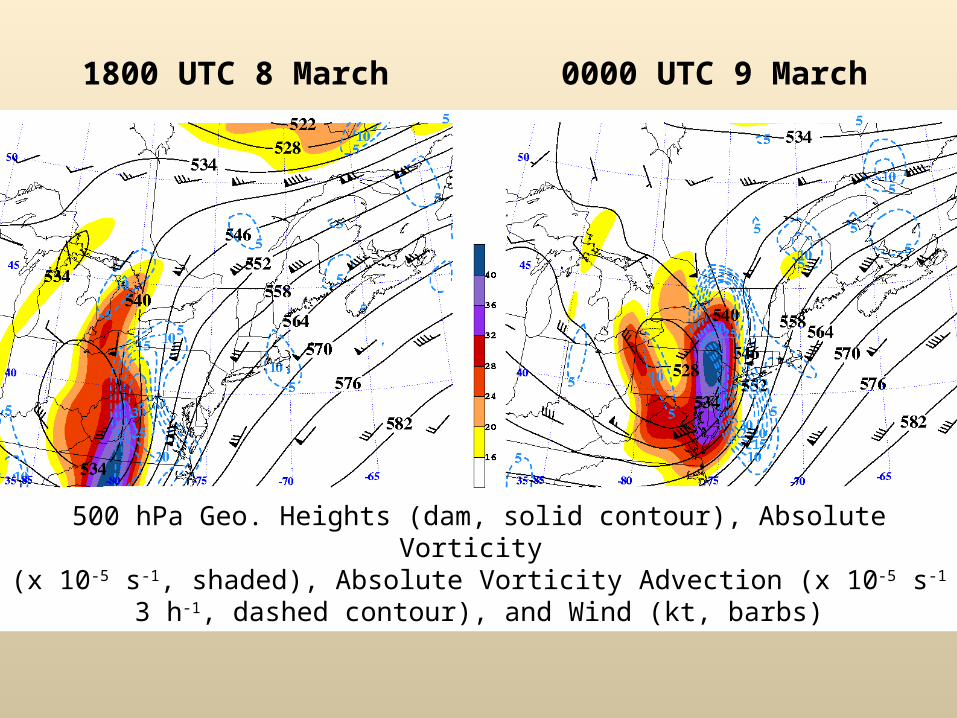
1800 UTC 8 March 0000 UTC 9 March
500 hPa Geo. Heights (dam, solid contour), Absolute Vorticity (x 10-5 s-1, shaded), Absolute Vorticity Advection (x 10-5 s-1 3 h-1, dashed
contour), and Wind (kt, barbs)

1800 UTC 8 March 0000 UTC 9 March
700 hPa Geo. Heights (dam, solid contour), Temperature (°C, dashed contour), Q-vectors (arrow), and Q-vector Convergence/Divergence (K m-2 s-1, shaded)

1800 UTC 8 March 0000 UTC 9 March
Surface MSLP (m, solid contour), 1000–500 Thickness (m, dashed contour), and Precipitable Water (mm, shaded)

1800 UTC 8 March 0000 UTC 9 March
925 hPa Frontogenesis (K/(100 km * 3 h), shaded), Potential Temperature (K, solid contour), and Wind (kt, barbs)

1800 UTC 8 March 0000 UTC 9 March
Standardized Anomaly of Precipitable Water (SD, shaded), 850 hPa Geo. Heights (dam, solid contour), and Precipitable Water (mm,
dashed contour)

8–9 March 2008 Summary
• Three primary regions of heavy precipitation: – Precipitation maximum east of Lake Ontario due to lake effect– North-south band of precipitation in eastern New York and western New
England collocated with strong cyclonic absolute vorticity advection and favorable QG forcing for ascent associated with strong Q-vector convergence
– Heavy precipitation over Cape Cod and Maine associated with strong frontogenesis ahead of warm front
• Exit and entrance regions of upper-level jet streaks provided favorable forcing for ascent
• Anomalous Atlantic moisture advected by low-level jet contributed to heavy precipitation
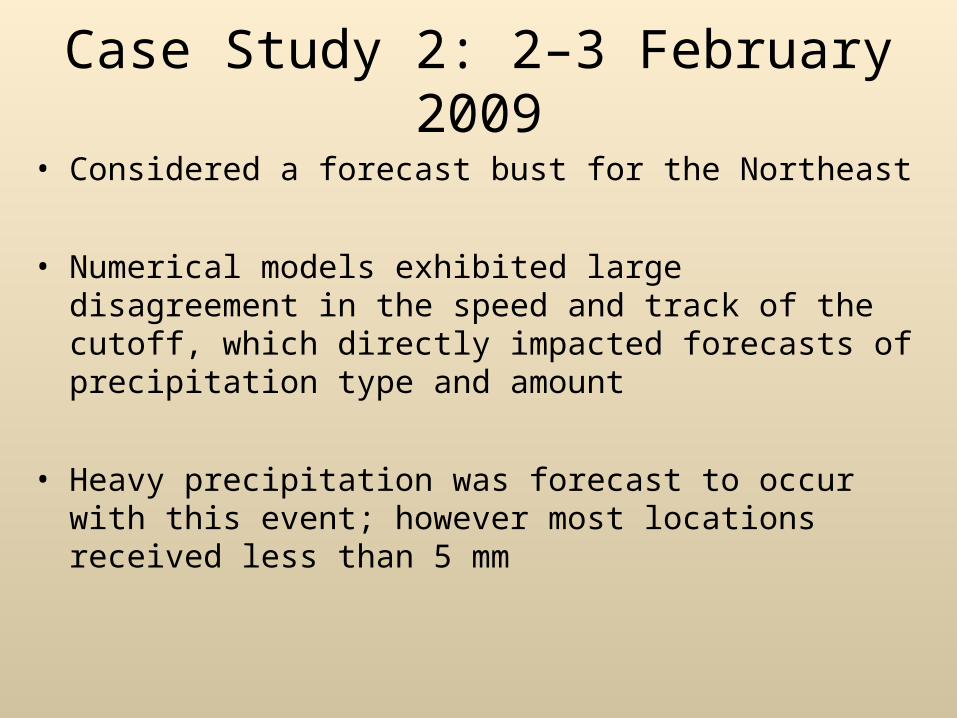
Case Study 2: 2–3 February 2009
• Considered a forecast bust for the Northeast
• Numerical models exhibited large disagreement in the speed and track of the cutoff, which directly impacted forecasts of precipitation type and amount
• Heavy precipitation was forecast to occur with this event; however most locations received less than 5 mm

NCEP Global Ensemble Forecast System Valid 090203/1200
Source: Grumm et al. (2009)
t–90 h t–96 h t–108 h

2–3 February 2009500 hPa Mean Heights (dam)
and Track of Cutoff
2–3 February 20092-day NPVU QPE (mm)
2–3 February 2009 Cutoff

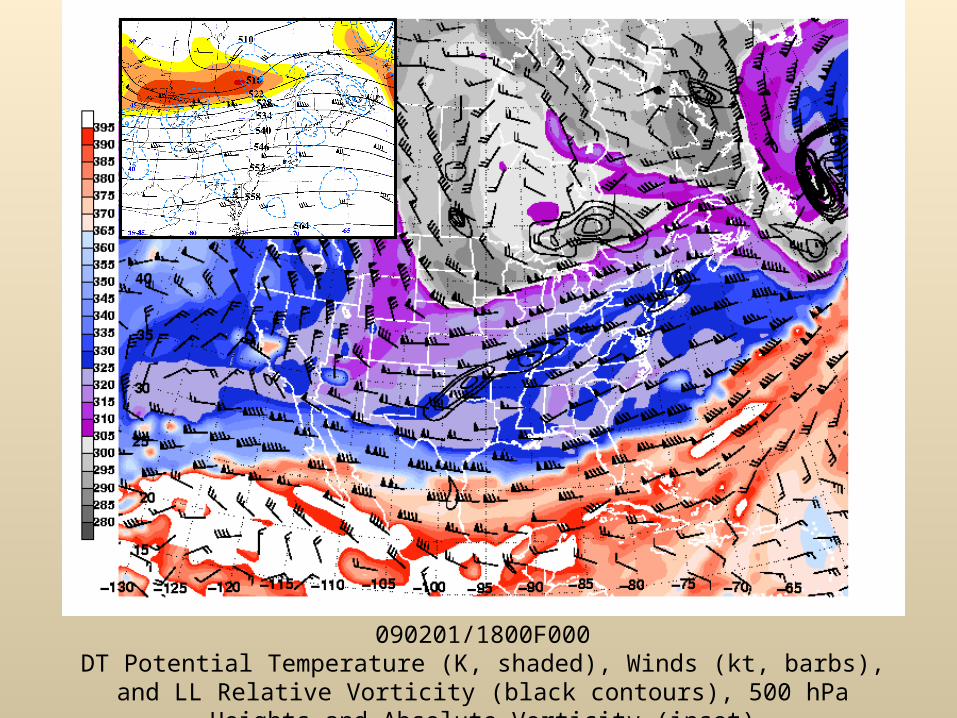
090201/1200F000DT Potential Temperature (K, shaded), Winds (kt, barbs), and LL Relative Vorticity (black contours), 500 hPa Heights and Absolute Vorticity (inset)
090201/1800F000DT Potential Temperature (K, shaded), Winds (kt, barbs), and LL Relative Vorticity (black contours), 500 hPa Heights and Absolute Vorticity (inset)

090202/0000F000DT Potential Temperature (K, shaded), Winds (kt, barbs), and LL Relative Vorticity (black contours), 500 hPa Heights and Absolute Vorticity (inset)

090202/0600F000DT Potential Temperature (K, shaded), Winds (kt, barbs), and LL Relative Vorticity (black contours), 500 hPa Heights and Absolute Vorticity (inset)
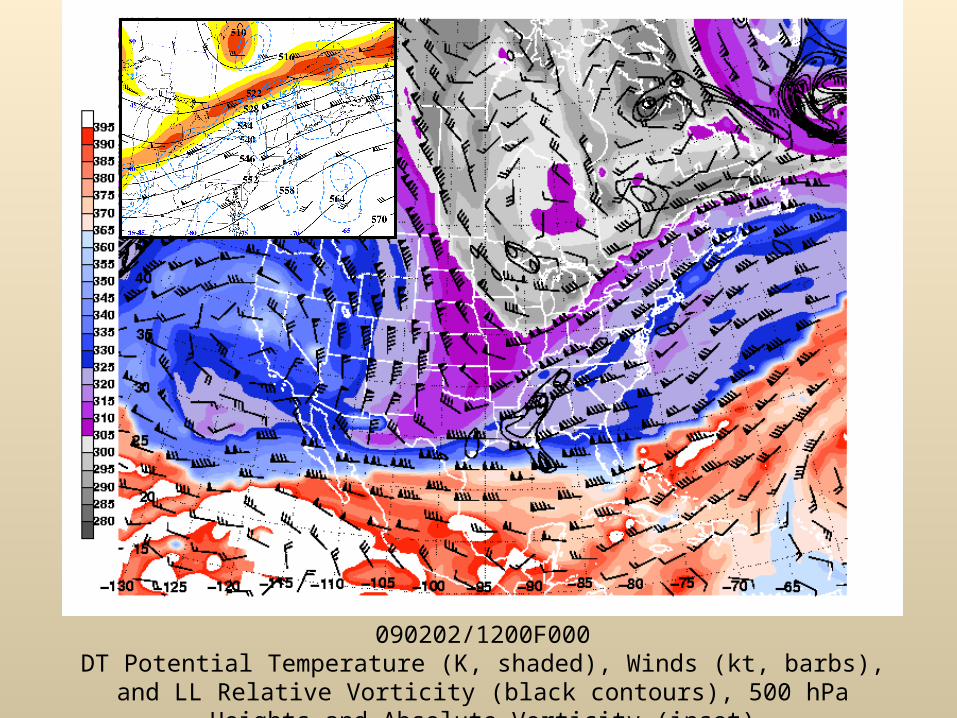
090202/1200F000DT Potential Temperature (K, shaded), Winds (kt, barbs), and LL Relative Vorticity (black contours), 500 hPa Heights and Absolute Vorticity (inset)

090202/1800F000DT Potential Temperature (K, shaded), Winds (kt, barbs), and LL Relative Vorticity (black contours), 500 hPa Heights and Absolute Vorticity (inset)
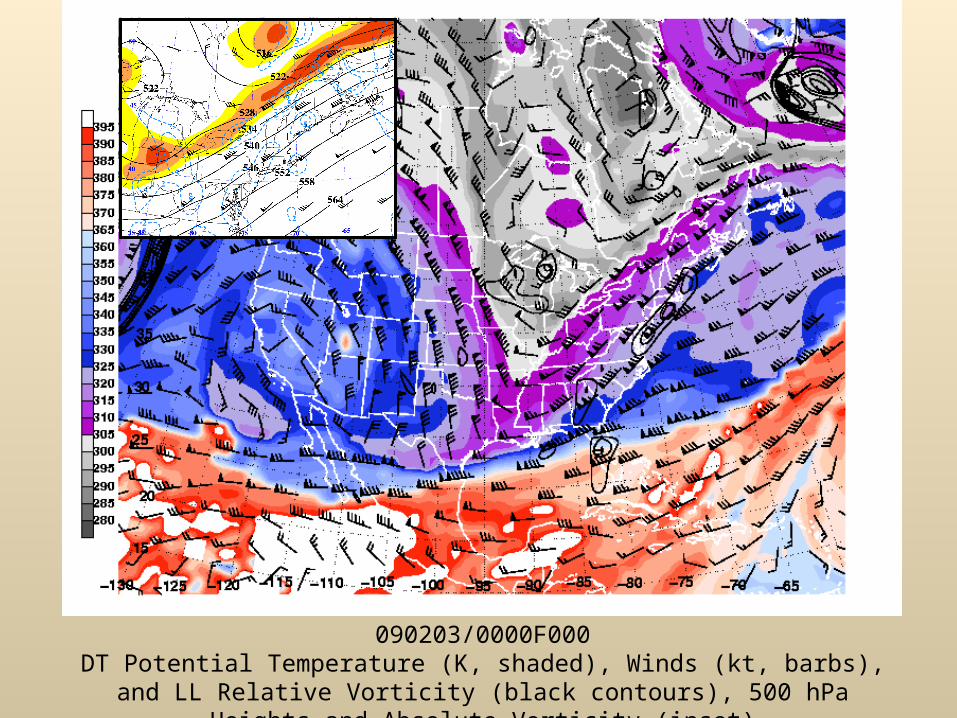
090203/0000F000DT Potential Temperature (K, shaded), Winds (kt, barbs), and LL Relative Vorticity (black contours), 500 hPa Heights and Absolute Vorticity (inset)

090203/0600F000DT Potential Temperature (K, shaded), Winds (kt, barbs), and LL Relative Vorticity (black contours), 500 hPa Heights and Absolute Vorticity (inset)

090202/1200F000DT Potential Temperature (K, shaded), Winds (kt, barbs), and LL Relative Vorticity (black contours), 500 hPa Heights and Absolute Vorticity (inset)

090203/1800F000DT Potential Temperature (K, shaded), Winds (kt, barbs), and LL Relative Vorticity (black contours), 500 hPa Heights and Absolute Vorticity (inset)

090204/0000F000DT Potential Temperature (K, shaded), Winds (kt, barbs), and LL Relative Vorticity (black contours), 500 hPa Heights and Absolute Vorticity (inset)
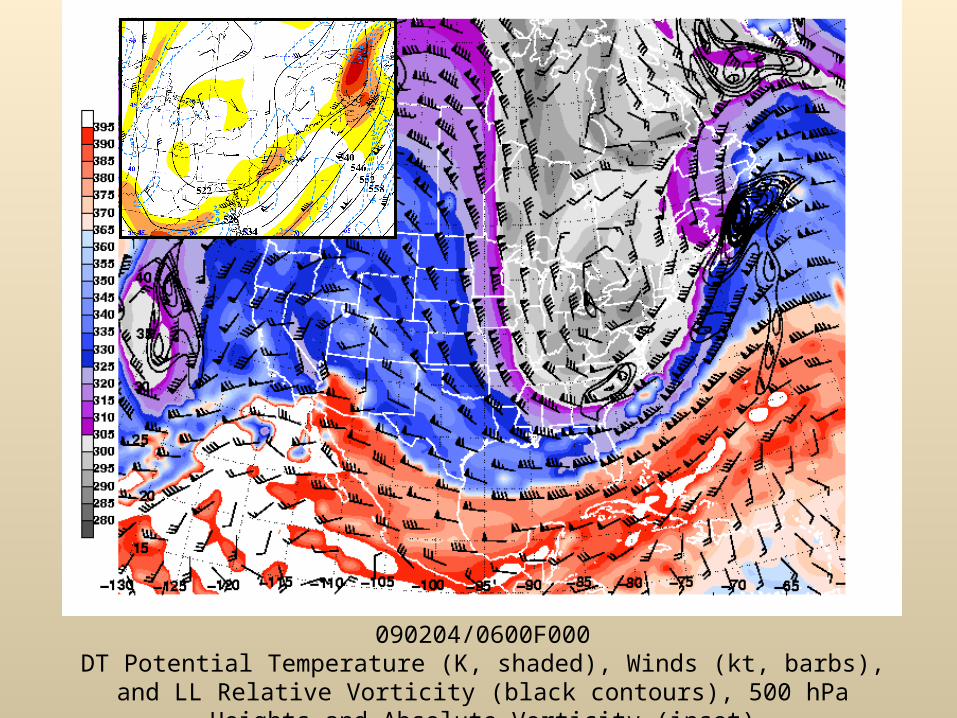
090204/0600F000DT Potential Temperature (K, shaded), Winds (kt, barbs), and LL Relative Vorticity (black contours), 500 hPa Heights and Absolute Vorticity (inset)
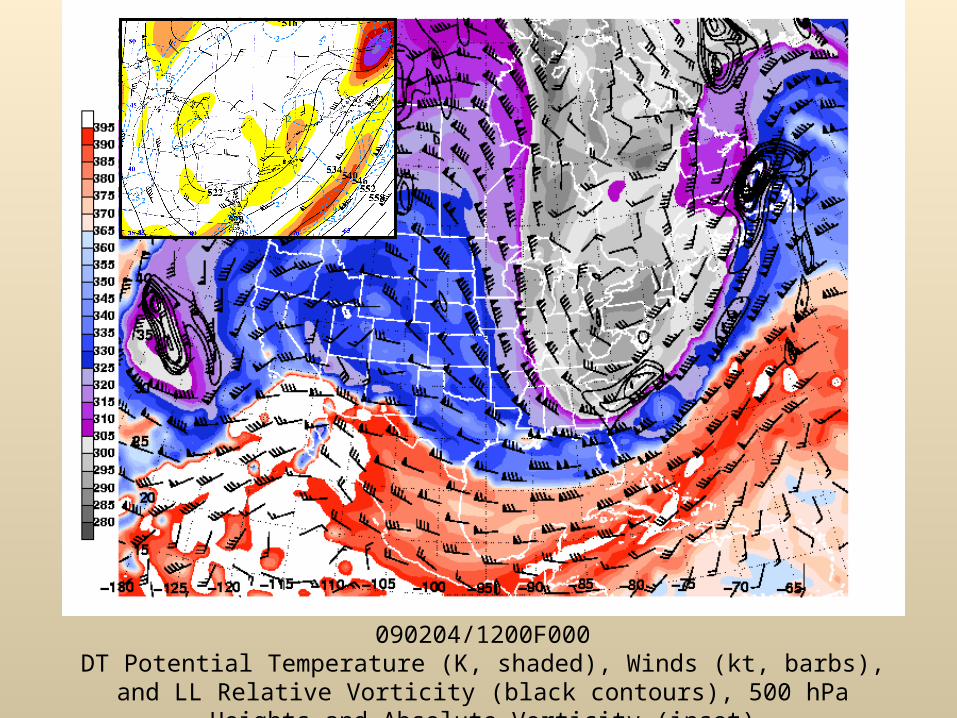
090204/1200F000DT Potential Temperature (K, shaded), Winds (kt, barbs), and LL Relative Vorticity (black contours), 500 hPa Heights and Absolute Vorticity (inset)

1800 UTC 3 February 0000 UTC 4 February
6-h NPVU QPE (mm)
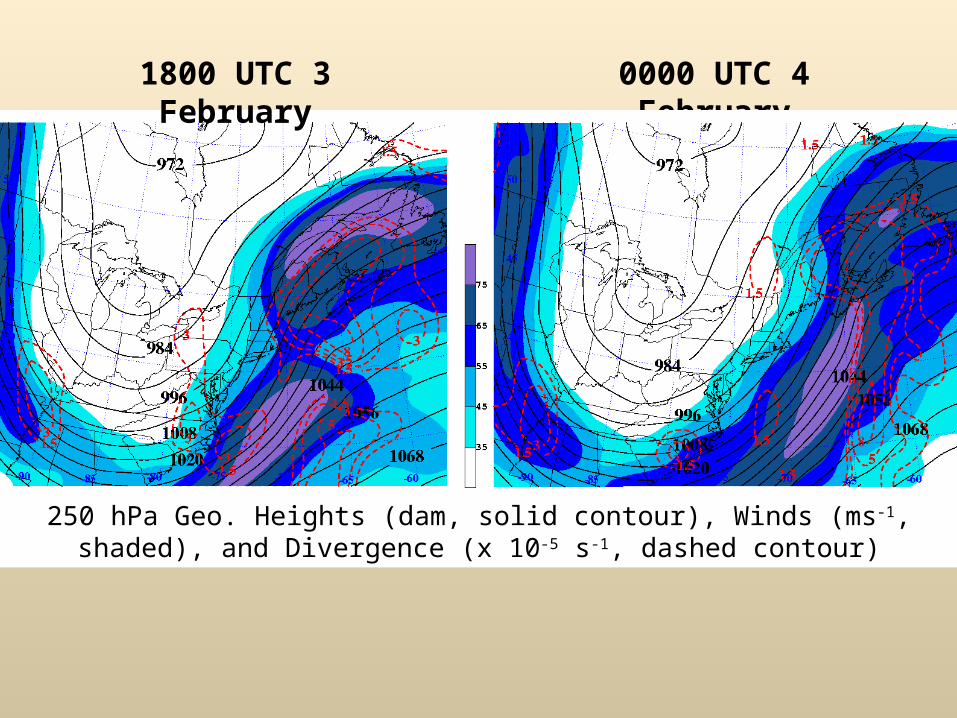
1800 UTC 3 February 0000 UTC 4 February
250 hPa Geo. Heights (dam, solid contour), Winds (ms-1, shaded), and Divergence (x 10-5 s-1, dashed contour)

1800 UTC 3 February 0000 UTC 4 February
500 hPa Geo. Heights (dam, solid contour), Absolute Vorticity (x 10-5 s-1, shaded), Absolute Vorticity Advection (x 10-5 s-1 3 h-1, dashed
contour), and Wind (kt, barbs)
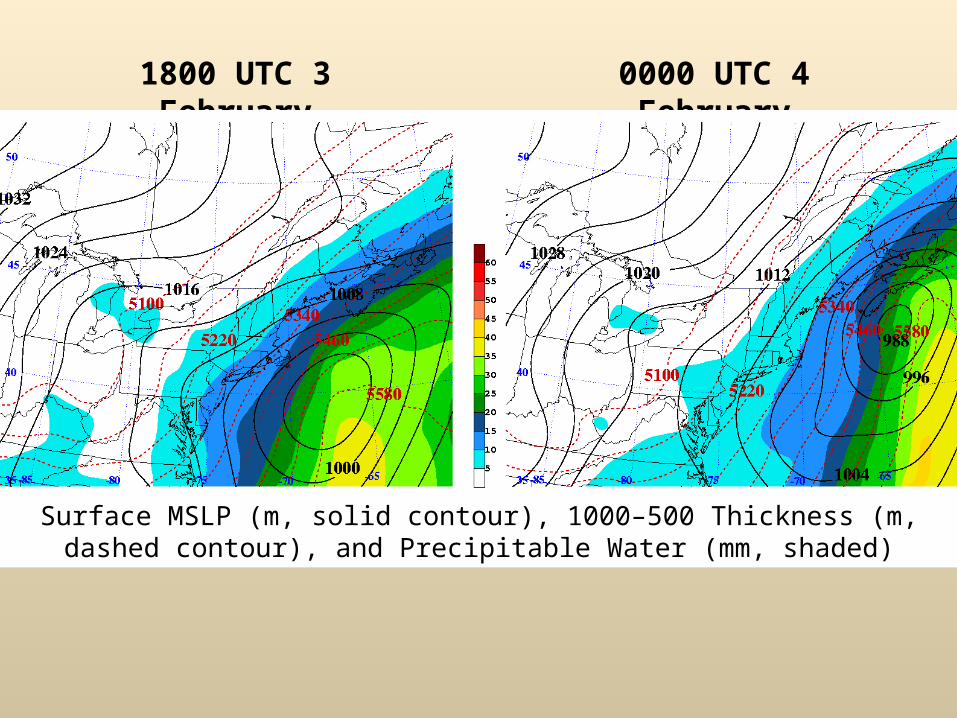
1800 UTC 3 February 0000 UTC 4 February
Surface MSLP (m, solid contour), 1000–500 Thickness (m, dashed contour), and Precipitable Water (mm, shaded)

1800 UTC 3 February 0000 UTC 4 February
850 hPa Equiv. Potential Temperature (K, solid contour), Equiv. Potential Temperature Advection (K 3 h-1, shaded), and Wind (kt, barbs)

1800 UTC 3 February 0000 UTC 4 February
Standardized Anomaly of Precipitable Water (SD, shaded), 850 hPa Geo. Heights (dam, solid contour), and Precipitable Water (mm,
dashed contour)

2–3 February 2009 Summary
• Precipitation forecast bust associated with phase error in the location of the surface cyclone which developed farther east than expected
• Exit and entrance regions of upper-level jet streaks provided favorable forcing for ascent along the coast
• Low precipitable water values (< 10 mm) contributed to the low precipitation amounts observed

Summary
8–9 March 2008:• Fast-moving cutoff
• Widespread heavy precipitation
• Rapid cyclogenesis occurred over NY
• Dual jet streaks over the Northeast
• Anomalous moisture advected by LLJ (PWAT +2 to +5 SD)
Forecast precipitation issues due
to rapid cyclogenesis
2–3 February 2009:• Cutoff stalled over the Great Lakes
• Precipitation confined to coast
• Cyclogenesis occurred off the East Coast
• Dual jet streaks off the East Coast
• Little moisture present in region (PWAT < +1 SD)
Forecast precipitation issues due to phase and intensity errors

Questions/Comments?

Slides Removed

Future Work
• Continue working on additional case studies
• Categorize cutoff days in order to identify common signatures differentiating between various precipitation distributions
• Develop conceptual models to delineate cutoffs which produce certain precipitation distributions to be used in the operational setting

Results
• 170 cutoff events identified – average region duration of 35.7 hours
• 384 cutoff days total– 164 days (42.7%) received precipitation > 25 mm (~1 in.) – 57 days (14.8%) received precipitation > 50 mm (~2 in.)

1722 UTC 8 March 2121 UTC 8 March

1800 UTC 8 March 0000 UTC 9 March
Standardized Anomaly of 850 hPa Meridional Winds (SD, shaded), 850 hPa Geo. Heights (dam, solid contour), and Wind (kt, barbs)

1430 UTC 3 February 2100 UTC 3 February


![Raoul De Keyser · 2 [catalogue] 2006 Raoul De Keyser: Recent Work, David Zwirner, New York [catalogue] 2005 Raoul De Keyser: Oskars, Zeno X Gallery, Antwerp Raoul De Keyser. Oever,](https://img.dokumen.tips/doc/110x75/5edfed5dad6a402d666b34ea/raoul-de-keyser-2-catalogue-2006-raoul-de-keyser-recent-work-david-zwirner.jpg)