Embed Size (px)
Citation preview

Lehigh UniversityLehigh Preserve
Theses and Dissertations
1-1-1977
Analysis of power cycles with centrifugal fluidizedbed coal combustion.Walter Jeffrey Shakespeare
Follow this and additional works at: http://preserve.lehigh.edu/etd
Part of the Mechanical Engineering Commons
This Thesis is brought to you for free and open access by Lehigh Preserve. It has been accepted for inclusion in Theses and Dissertations by anauthorized administrator of Lehigh Preserve. For more information, please contact [email protected].
Recommended CitationShakespeare, Walter Jeffrey, "Analysis of power cycles with centrifugal fluidized bed coal combustion." (1977). Theses and Dissertations.Paper 2166.

ANALYSIS OF POWER CYCLES WITH CENTRIFUGAL
FLUIDIZED BED COAL COMBUSTION
by
Walter Jeffrey Shakespeare
A Thesis
Presented to the Graduate Committee
of Lehigh University
in Candidacy for the Degree of
Master of Science
in
Mechanical Engineering
Lehigh University
1977

ProQuest Number: EP76439
All rights reserved
INFORMATION TO ALL USERS The quality of this reproduction is dependent upon the quality of the copy submitted.
In the unlikely event that the author did not send a complete manuscript and there are missing pages, these will be noted. Also, if material had to be removed,
a note will indicate the deletion.
uest
ProQuest EP76439
Published by ProQuest LLC (2015). Copyright of the Dissertation is held by the Author.
All rights reserved. This work is protected against unauthorized copying under Title 17, United States Code
Microform Edition © ProQuest LLC.
ProQuest LLC. 789 East Eisenhower Parkway
P.O. Box 1346 Ann Arbor, Ml 48106-1346

This thesis is accepted and approved in partial fulfillment of of the requirements for the degree of Master of Science.
^OACU 30 i<n~)
(date)
Professor in Charge
Chairman of Department
-!!•

TABLE OF CONTENTS
ABSTRACT 1
INTRODUCTION 2
THERMAL EFFICIENCIES OF VARIOUS FLUIDIZED BED POWER CYCLES 5
EFFECT OF SORBENT FEED SIZE DISTRIBUTION ON SYSTEM PERFORMANCE 21
CAPITAL EQUIPMENT COST COMPARISON 31
TOTAL ENERGY COSTS FOR CONVENTIONAL AND FLUIDIZED BED COMBUSTION 41
A LABORATORY SCALE CENTRIFUGAL FLUIDIZED BED APPARATUS 53
CONCLUSION 57
TABLES
FIGURES
REFERENCES
VITA
-nv

LIST OF TABLES
Table Description
1 Estimated equipment costs for fluidized bed and conventional power generation - 600 MWe
2 Estimated equipment costs for fluidized bed and conventional power generation - 300 MWe
3 Estimated equipment costs for fluidized bed and conventional power generation - 30 MWe
4 Ground rules for total energy cost comparison
5 Total estimated plant costs and efficiencies use in energy cost comparison
6 Materials list for laboratory scale model
■IV-

LIST OF FIGURES
Figure Description
1 Sketch of centrifugal combustor
2 Nonadiabatic combined system
3 Adiabatic combined system
4 Nonadiabatic steam system
5 Adiabatic steam system
6 Adiabatic combined cycle efficiency
7 Nonadiabatic combined cycle efficiency
8 Adiabatic steam cycle efficiency
9 Flue gas dew point temperatures
10 Cycle efficiency with water addition
11 Flue gas volume flow rate with water addition
12 BCURA limestone and mixed feed size distributions
13 PER and CPC feed size distributions
14 BCURA dolomite and limestone feed size distributions
15 Argonne National Laboratory feed size distributions
16 Air mass flow rate at terminal velocity
17 Elutriation as a function of air mass flow rate and bed angular velocity - CPC feed
18 Elutriation as a function of air mass flow rate and bed angular velocity - PER feed
19 Mean particle diameter variation with percentage feed elutriated
20 Operating conditions for CPC and PER feed

LIST OF FIGURES (continued)
Figure Description
21 Combustor pressure drop - CPC feed
22 Combustor pressure drop - PER feed
23 Exit gas velocity - CPC feed
24 Exit gas velocity - PER feed
25 Radial air velocity - CPC feed
26 Radial air velocity - PER feed
27 Bed thickness effects on bed pressure drop and gas residence time - CPC feed
28 Bed thickness effects on bed pressure drop and gas residence time - PER feed
29 Combustor capacity and rotational power require- ments - CPC feed
30 Combustor capacity and rotational power require- ments - PER feed
31 Influence of combustor size on capacity - CPC feed
32 Influence of combustor size on capacity - PER feed
33 Power plant capital costs as a function of capacity for the period 1967-1972 normalized to 1972
34 Percentage equipment cost difference - adiabatic combined cycle over nonadiabatic combined cycle
35 Time basis for excalation and interest calculation
36 Sensitivity of cost of energy to escalation rate
37 Sensitivity of cost of energy to construction time
38 Sensitivity of cost of energy to fixed charge rate
39 Sensitivity of cost of energy to fuel cost
40 Sensitivity of cost of energy to sorbent cost
-vi-

LIST OF FIGURES (continued)
Figure Description
41 Sensitivity of cost of energy to capacity factor
42 Cost of energy as a function of plant capacity - 65% capacity factor
43 Cost of energy as a function of plant capacity - 25% capacity factor
44 Laboratory scale model air flow rates at minimum fluidization conditions
45 Solids flow for laboratory scale model
46 Schematic of laboratory rotating fluidized bed apparatus
47 Detail of rotating chamber
48 Detail of solids removal pan
49 Mounting table
50 Detail of plenum chamber sides
51 Detail of plenum chamber top
52 Exit duct
53 Solids feeding apparatus
-Vll

NOMENCLATURE
Symbols
a' Specific surface
B Base cost of equipment of capacity xb
C Cost of equipment of capacity x
Cp Constant pressure specific heat
d Particle diameter
HHV Higher heating value of fuel
k Specific heat ratio c /c
m Mass flow rate
P Particle size distribution function
p Pressure
w Work
x Weight fraction or equipment capacity
Y Exponent in equipment size ratio equation
n Efficiency
Subscripts
a Air
amb Ambient
b Base
c Compressor
e Exit
f Fuel
G Gas
GT Gas turbine
-viii-

NOMENCLATURE (continued)
Subscripts
i Individual
in Inlet
op Operating
Superscripts
_ Mean
■IX-

ABSTRACT
The combustion of coal in a fluidized bed of limestone which
rotates about an axis of symmetry is investigated. Thermal effic-
iencies of proposed fluidized bed power systems are compared and ex-
amined for sensitivity to operating parameters. The effects of
particle carryover on the output of a rotating combustor are studied.
The cost of energy production for each of the proposed fluidized bed
systems is compared using computed efficiencies and estimated equip-
ment costs. Results show that the rotating system operated under
pressure in a combined cycle is competitive with other fluidized bed
systems and less expensive than the conventional pulverized coal
power plant. This makes rotating systems very attractive since a
wide range of load control can be achieved and startup of the sys-
tem is expected to be much easier because of the adiabatic nature
of the bed.
The rotating combustor operated at atmospheric pressure is
found to be less attractive than the pressurized system primarily
due to the penalty in efficiency of this device resulting from a
high pressure loss through the rotating bed.
Finally, a conceptual design for a laboratory scale cold model
of the centrifugal fluidized bed is presented. The model is to be
used in future studies concerning the effects of solids feeding and
removal on the bed fluid mechanics.

INTRODUCTION
One of the most abundant energy resources in the United States
is coal. Recently there has been a great deal of interest in this
energy option as a replacement for rapidly dwindling oil supplies.
Conventionally, coal combustion for electric power generation takes
place in a steam generator furnace. The coal is pulverized to a fine
powder and transported pneumatically to a series of burners located
around the perimeter of the furnace. Combustion occurs in the swirl-
ing coal-air suspension and the heat is transferred to steam tubes
radiantly and convectively. To provide sufficient space for complete
combustion and tube surface for heat transfer the pulverized coal
furnace must be quite large. In addition, the high temperature of
the fireball causes formation of oxides of nitrogen which turn gray-
ish brown when cooled to atmospheric temperature.
Most of the coal currently available contains a relatively high
percentage of sulfur. During combustion the sulfur combines with
oxygen to form gaseous S02, a noxious pollutant. To adequately re-
move this gas from the combustion products, a conventional pulverized
fuel boiler must be equipped with some kind of flue gas treatment
apparatus. The technology for this gas treatment is borrowed from
the chemical industry. The most popular S02 removal system is the
limestone scrubbing and this equipment is both expensive and unre-
liable.
-2-

One alternative to the pulverized coal boiler is a method known
as fluidized bed combustion. In this system air is supplied for com-
bustion from the bottom of the furnace through a distribution plate.
The velocity of the air is just sufficient to create on each particle
in the furnace a drag force equal to its weight. It has been found
that if crushed limestone or dolomite is fed into the furnace along
with the coal a highly turbulent fluid like suspension called a fluid-
ized bed results. Relatively even temperatures can be maintained
throughout the furnace. The limestone holds heat very well so that
combustion can be maintained even with low quality fuel. In addition
excellent heat transfer characteristics are exhibited by the bed and
as a result a decrease in heat transfer surface is possible. Most
importantly, the limestone which is primarily calcium carbonate re-
acts with the sulfur dioxide to produce a solid calcium sulfate ac-
cording to:
and
CaC03->-CaO + C02+
cao + so2 + j o2-K;aso4
Thus the SOp pollutant can be removed in the combustion process.
The conventional fluidized bed combustor described above is
plagued with a number of operating difficulties. To maintain fluid-
ization, the air velocity must be high enough to balance the weight
of the bed but not so high as to blow out the bed material. Hence
the range of combustion rates, which is goverened by air flow rate,

is restricted. To overcome this difficulty, the bed may be made to
rotate about an axis of symmetry as shown in Figure 1. In this way
a variable body force, the radial acceleration, is created. Air flow
is radially inward and the drag force balances the centrifugal force
on the bed. Thus another degree of freedom is added to operation and
combustion rate can be varied over a wide range. It can be seen in
Figure 1 that there is no tube surface in the bed. Rather, the heat
of combustion is carried away by air flow which is maintained at a
high enough rate to operate the device adiabatically. Typically,
this requires 200% to 400% excess air to cool the bed to approximately
870°C.
The feasibility of operating this centrifugal combustor depends
on the economics of power generation equipment, the efficiency of the
thermodynamic cycle, and the physical operability of the system, i.e.
fuel and sorbent feeding and removal, expected particulate carryover,
etc. What follows is an attempt to explore the feasibility of the
centrifugal fluidized bed combustor from the standpoint of some of
the concerns listed above.

THERMAL EFFICIENCIES OF VARIOUS FLUIDIZED BED POWER CYCLES
Thermal efficiency calculations were carried out for each of a
number of proposed fluidized bed combustion systems. The purposes
were to evaluate the effect on overall power plant efficiency of each
of the important operating parameters, and to gain an insight into
which of the systems offers the greatest potential from an operating
standpoint. The efficiency of each cycle together with the cost of
fuel and maintenance can be translated into an annual operating cost
for any proposed system and, together with an estimated capital
equipment cost, serves as a guide for overall evaluation of one sys-
tem versus another. As with any analysis of this type, certain basic
assumptions must be made in order to arrive at a starting point. For
this reason the results of this analysis are intended not as a meas-
ure of the absolute value of efficiency nor heat rate but as a com-
parison between systems under a reasonable set of assumptions.
The following are considered:
Nonadiabatic Combined Cycle (Figure 2)
Such a cycle has been studied in great detail by Westinghouse
[1,2,3]. The system consists of a conventional fluidized bed boiler
which is operated at elevated pressure with a compressor-gas turbine
combination. Steam is generated in the bed and used in a Rankine
cycle to produce most of the power. Gases leave the boiler at high
temperature and expand through the gas turbine to essentially atmos-
pheric pressure. The sensible heat energy left in the gas is
-5-

extracted in stack gas coolers which are operated in parallel with
the Rankine cycle feedwater heaters. The purpose is to raise the
temperature of the feedwater before its return to the boiler. The
system has the advantage of utilizing the high heat transfer coef-
ficients present in a fluidized bed for steam generation. This re-
duces greatly the required tube surface. Also, a conventional steam
cycle can be used since the steam conditions are those of a conven-
tional power plant. The disadvantages of this system include the
need to achieve a high degree of cleanliness in the flue gas to in-
sure long turbine life and the problem of startup and control of the
output of the system. The control problem results from the narrow
range of allowable air flows through the bed between the conditions
of incipient fluidization and excessive particulate elutriation.
Adiabatic Combined Cycle (Figure 3)
As the heat transfer surface area in the pressurized boiler is
reduced, more excess air is required to maintain the desired bed
temperature. In the limit, the surface area is reduced to zero and
the combustion process is adiabatic. The cycle consists of a com-
pressor-gas turbine in combination with the combustor. Combustion
Power Company has studied such a cycle with a conventional fluidized
bed combustor [4]. Air is raised to operating pressure in the com-
pressor, driven by the shaft of the gas turbine. High pressure duct-
ing connects the compressor outlet and gas turbine inlet to the com-
bustor. The gases which leave the combustor are cleaned by one or
■6-

two stages of cyclone separators in series with a gravel bed filter
or another similar third stage. This is necessary to reduce the par-
ti cul ate loading to acceptable levels for long turbine life. After
expanding to just above atmospheric pressure in the turbine, there
is still a substantial amount of sensible heat in the combustion gas-
es. This heat is recovered in a low pressure steam generator and the
steam is used in a Rankine cycle for additional power production.
Since the gas turbine exhaust temperature is below the conventional
steam power cycle main steam temperature of 538°C (1000°F) a low pres-
sure and temperature Rankine cycle is required. The configuration
and expected efficiency of this cycle are discussed below. The dif-
ferences between the Combustion Power Company system and the same
cycle with a rotating combustor may be found by choosing appropriate
values of operating conditions.
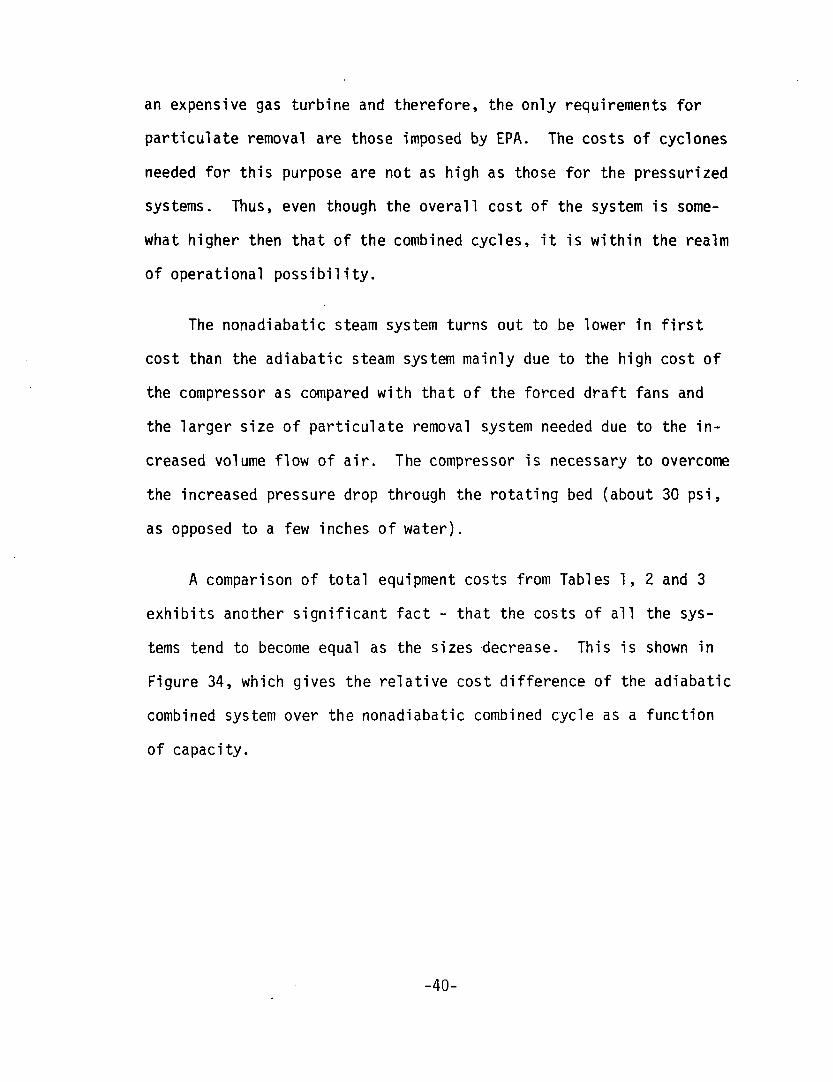
Nonadiabatic Steam Cycle (Figure 4)
This system presently under study by Pope, Evans and Robbins,
Inc. [5] most resembles the conventional power plant. A conventional
fluidized bed steam boiler is operated at essentially atmospheric
pressure. The steam is used to produce power in a conventional
Rankine cycle. The major advantage is that the boiler is the only
new, unproven component in the cycle. Also, low pressure and temp-
erature particulate removal equipment can be used. Similar problems
with load control and startup exist as with the nonadiabatic combined
cycle system.
-7-

Adiabatic Steam Cycle (Figure 5)
The rotating fluid bed combustor can also be used in a conven-
tional steam cycle. The bed is operated at just above atmospheric
pressure and the gas is ducted to a convection steam generator where
it is cooled to transfer the sensible heat to steam tubes. The sys-
tem has the disadvantage of high pressure loss through the combustor
and the sacrifice of the excellent heat transfer properties of the
bed, resulting in a large surface area in the steam generator. The
principal advantages are the expected wide range of operation, ease
of startup, and small size of combustor.
The cycle parameters assumed for each system are given below.
It should be noted that these values are not necessarily the design
values but may be considered a reasonable starting point for analysis,
A compressor efficiency of 85% and a gas turbine efficiency of
87% were used for all calculations. The desirable operating temp-
erature is influenced primarily by two factors. First, sulfur re-
covery is highly dependent on this parameter because of the optimum
observed in the 788°C-871°C (1450°F-1600°F) bed temperature range.
This is the major constraint and may be considered an upper bounding
condition on operating temperature. In addition, the overall cycle
efficiency is affected by the choice of operating temperature so
that a lower bound is represented by this consideration. Other
limits on the operating temperature are combustion stability at
lower temperatures and the ash fusion temperature at high tempera-
-8-

tures. The combustor operating temperatures chosen for analysis
ranged from 729°C-1027°C (1340°F to 1880°F).
The operating pressure of the system affects the simple Brayton
cycle gas turbine efficiency and the fuel to air ratio. Higher pres-
sures result in an increased efficiency. Operating pressures for
proposed combined cycle systems are approximately 10 atmospheres.
This is a result of the "levelling off" of the Brayton cycle effic-
iency with increasing pressure ratio and the availability of gas
turbine equipment in this pressure range. Newer machines are becom-
ing available at 15 to 16 atmospheres. For purposes of analysis a
range from 5 to 20 atmospheres was studied.
Auxiliary power requirements are estimated to be 5% of the gross
cycle electrical output. The rotating combustor accelerates both
combustion air and feed material to the angular velocity of the bed
on a continuous basis. The energy required to do this and to over-
come frictional losses must be taken into account. On the basis of
calculations for the power required to rotate the combustion air
alone, it is estimated that an additional 1% of the net electrical
output would be needed for the rotating bed. This is believed to be
a conservative estimate, and, since the magnitude is small compared
to the estimated balance of plant auxiliary power requirements, it
was not varied parametrically.
The system pressure drops chosen for study may be found in the
analysis of the combustor fluid mechanics [6]. The Ap expected is

y
the result of the "weight" of the bed which changes with bed depth
(and angular velocity), the frictional resistance of the distributor
plate, and the freeboard pressure drop. A range from 0.0 to 345 kPa
is assumed.
In choosing a reasonable value for the cycle exit gas tempera-
ture, it is necessary to consider the chemistry of the flue gas.
Boiler exit gas temperatures are generally specified to be high
enough to prevent formation of corrosive acids on the surfaces of
tubes and ducts. The dew point of product gases is a function of
water vapor content and, more importantly, of sulfur trioxide con-
centration since sulfuric acid formed as a result of the hygroscopic
nature of the S03 has a higher dew point than is found for typical
concentrations of water vapor alone in the product gases. Values of
acid dew points may be found as a function of S03 concentration along
with the % hLSO* in the resulting condensate [7]. Current design
practice is to assume values for metal temperatures which are influ-
enced by the weight % of sulfur in the fuel. These temperatures are
a function of the type of fuel and the type of combustion process.
In a pulverized coal boiler for fuel with less than 1% suflur, the
minimum metal temperature is 71°C (160°F). For a stoker (coal fired)
or distillate oil fired system, the minimum is 105°C (220°F).
Thermodynamic calculations of acid dew point are suspect since
very small variations in the assumed value of vapor pressure of the
acid results in large errors in dew point temperature. Thus experi-
mentally determined acid dew point temperatures are most reliable [8].
-10-

As to the problem of determining concentrations of the SO,
species resulting from a given sulfur content in the fuel, it is
suspected that most of the S03 formed from combustion is a result of
catalytic reaction of SOp and oxygen atoms at elevated temperatures
[7]. Also, while the formation of S03 proceeds to the right at stan-
dard temperature, the rate is so slow that beyond the immediate area
of combustion the concentrations of SCL versus S03 are essentially
"frozen" [7]. Typical ratios are of the order of 1 - 2% (moles S03/
mole SOo).
Since the SCL is removed from the product gases in the combus-
tion zone, transformation to S03 should be reduced in the fluidized
bed. Another possibility is that the S03 species is created by oxi-
dation of SOp with single oxygen atoms. The fact that the rate of
formation of S03 from SCL approaches zero a short distance from the
combustion zone and that the concentration of free oxygen atoms also
approaches zero at about the same place suggests this relationship.
The formation of oxygen atoms from 0? molecules seems to be a func-
tion of temperature. Thus for the low temperatures encountered in
a fluidized bed, the formation of SCL from S02 may be far less than
in conventional combustion processes.
Since the data for dew point determination are based on mole
concentrations it is useful to estimate expected concentrations from
a fluidized bed combustor utilizing a bed of limestone or dolomite
for sulfur removal.
■11

If all the sulfur remaining in the flue gas occurs as 98% by
volume SO2 and 2% by volume SCL; the total for a coal containing
2.96% sulfur is:
Tntal clli*1M« ,-„ „„3l _ .0296 kg sulfur v 1 mole sulfur _ Total sulfur in coal - T.^I gg*coa1 x 32 kg su1fur -
Total sulfur in coal = 8.97 x lCT4 moles sulfur kg coal
10% of this is
8.97 x 10"5 moles kg coal
Typical air fuel ratios for the adiabatic combustor are:
30 - 50 kg air kg coal
The approximate sulfur content of the products is:
/8.97 x 1Q-5 molex /0.2 kg coaK ( 1 kg air ^ K S/kg coal ; x [ kg air ' x M.02 kg Prodi
xl.75 x 10"6 molesx K kgP ' '
Assuming a molecular weight for the product gases of 28.954 kg
product/mole product, the volumetric sulfur content of the products
is:
u«i.»n« *..*,.+4„n - /l -67 x 10" mole sulfur Volume fraction - ( kg products }
(28.954 kg products) = 4>839xl0-5 mole products
Or approximately 50 ppm sulfur in the products counting all the
-12-

remaining sulfur from the coal. Two percent of this occurring as S03
yields approximately 1.0 ppm S03 by volume in the flue gas. This
corresponds to a dew point temperature considerably less than 105°C
(220°F) [8]. Accordingly, values of exit gas temperature were chosen
ranging from 66°C (150°F) to 177°C (350°F). A central value of 120°C
(250°F) was assumed.
The efficiencies of the steam cycles were estimated in the fol-
lowing way. Efficiency is defined here as the net electrical output
of the steam adiabatic combined cycle, the maximum cycle divided by
the heat input to the steam temperature of steam that can be produced
using turbine exhaust gas at about 427°C (800°F) is approximately
316°C (600°F). Based on this temperature a cycle may be designed.
It is assumed that due to the high mass flow rate of the products of
combustion a relatively efficient cycle is required. Assuming the
steam is reheated in the boiler, that the low pressure turbine ef-
ficiency is 89% [9], and that the steam is expanded to just below
the Wilson line with a condenser back pressure of 10.34 kPa (1.5
psia), the pressure in the reheater may be found from thermodynamic
data of steam. The pressure drop through the reheater is generally
quite small and assuming the steam is originally expanded to just
above the saturation line, the expansion line endpoint (ELEP) for
the high pressure turbine can be found. The ELEP, along with an
adiabatic efficiency of 89% [9], and the maximum possible steam
temperature of 427°C permits an estimate of the maximum cycle pres-
sure of 2758 kPa (400 psia). The effect of regenerative feedwater
-13-

heating on the overall cycle efficiency may be estimated [10,11].
It is assumed that six stages of feedwater heating are required, that
there is a 5% pressure loss through the extraction lines, and a 3°C
terminal temperature difference in each heater. This results in a
steam cycle efficiency of 33% for an adiabatic combined cycle plant.
For other Rankine cycles where higher pressure and temperature
ranges can be attained, values of cycle efficiency may be found in
the literature [9,12]. For the conventional steam cycles, assump-
tions include seven feedwater heaters in the cycle, 0% to 3% conden-
sate makeup and from 5.07 kPa (1.5 inches Hg.) to 11.8 kPa (3.5 in-
ches Hg.) condenser back pressure. A cycle with seven feedwater
heaters, 8158 kPa (2400 psig) throttle pressure, and a single re-
heat which is commonly encountered in electric utilities, was chosen
as a representative system. Condenser back pressure of 11.8 kPa
(3.5 inches Hg. absolute) may be expected if wet cooling towers are
used and, along with a 3600 r/min. Tandem Compound Turbine Generator,
cycle efficiencies range from 40% to 43% depending on size, boiler
feed-pump drive type, etc. A representative value of 41.5% was
chosen for use with fluidized bed combustors operating at 1 atmos-
phere.
For example, the efficiency of the adiabatic combined cycle
based on the higher heating value of the fuel may be found as follows:
net work plant mass flow rate of fuel x higher heating value
-14-

n WGT + WST " We " WAUX
plant rbf x HHV
The gross output of the gas turbine is:
W -^1= C T ill LPG'in
Pe G M»V
1 " (pT") ^ Kin m= nGT
where
mr nir- 4 = 1 + J m. m.
W GT = 1130.4 -n^-rr x 1144k m= kg-k
i 1-33-1 1 - (TO) 1-33 x 1.02 x .87
W GT = 500 kW ma kg air/s
The power required to operate the compressor is:
Wc — = C„ T m. Pa amb Hamb
/n.
W -± = 1005 ma
kg air-s x 298 k
1.4-1 (12.04) 1.4 - 1 /0.85
W c = 365.3 kW
r.ia kg air/s
The power obtainable from the turbine exhaust gases by means of a
Rankine cycle is:
■15-
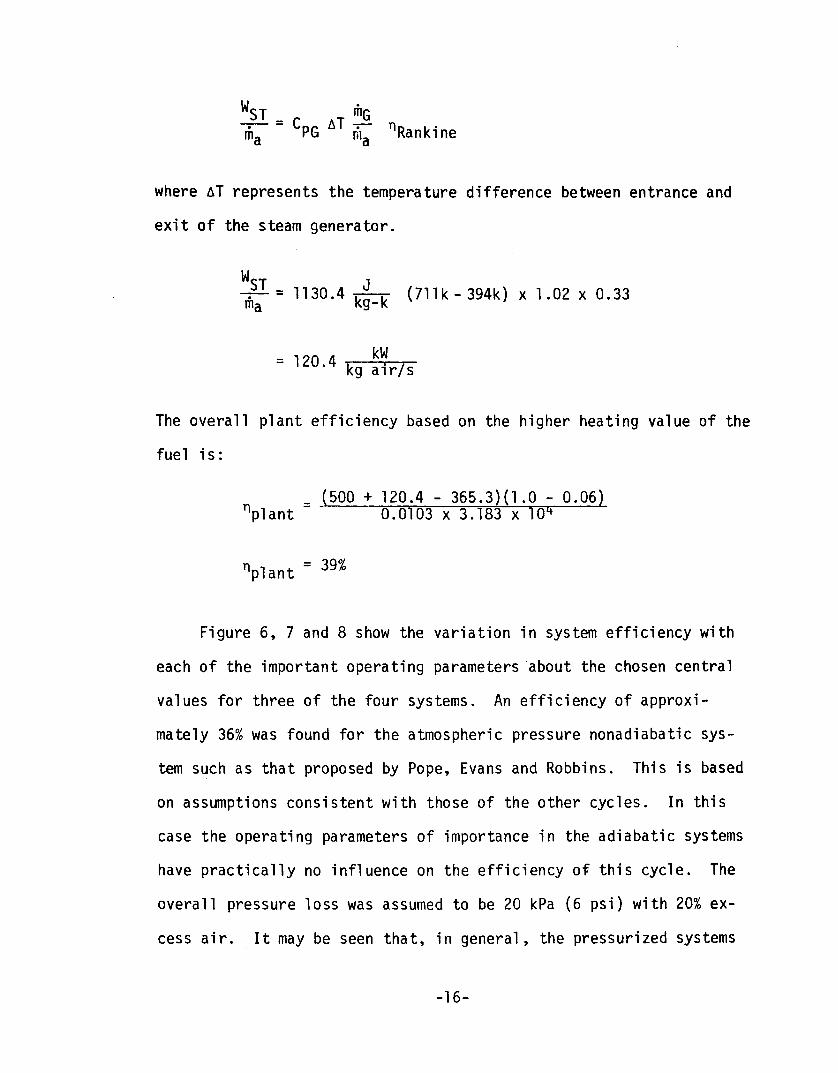
u ST _ mG
"m7 = CPG AT ^ nRankine
where AT represents the temperature difference between entrance and
exit of the steam generator.
"^- = H30.4 T~-rr (711k-394k) x 1.02 x 0.33 ma kg-k
= 120.4 kW
kg air/s
The overall plant efficiency based on the higher heating value of the
fuel is:
= (500 + 120.4 - 365.3)(1.0 - 0.06) nplant 0.0103 x 3.183 x 104
nplant = 39%
Figure 6, 7 and 8 show the variation in system efficiency with
each of the important operating parameters about the chosen central
values for three of the four systems. An efficiency of approxi-
mately 36% was found for the atmospheric pressure nonadiabatic sys-
tem such as that proposed by Pope, Evans and Robbins. This is based
on assumptions consistent with those of the other cycles. In this
case the operating parameters of importance in the adiabatic systems
have practically no influence on the efficiency of this cycle. The
overall pressure loss was assumed to be 20 kPa (6 psi) with 20% ex-
cess air. It may be seen that, in general, the pressurized systems
■16-

have the higher efficiency. Also while the adiabatic systems are
about equally affected by changes in the exit gas temperature, the
pressurized cycle is much more sensitive to changes in operating temp-
erature, resulting from the deterioration of gas turbine cycle ef-
ficiency as temperature is reduced.
The adiabatic steam system is shown to be much more sensitive
to pressure drop. This is the result of the high mass flow rate of
air required to cool the .combustor and the associated compressor
power, even for a small Ap.
Efficiencies of the combined cycles have a maximum in the 10-
15 atmosphere range.
The nonadiabatic combined cycle is shown to be much less sensi-
tive to changes in operating parameters than the adiabatic combined
system. This occurs since most of the power is produced by the
steam turbine. System Ap, operating pressure, and temperature in-
fluence the gas turbine output primarily. Also, very little energy
is recovered downstream of the gas turbine so that exit gas temper-
ature is not as important as for the adiabatic cycles.
Overall thermal efficiency for a combined process heat applica-
tion with the adiabatic combustor is about 76% assuming that all of
the heat recovered downstream of the gas turbine is used to produce
steam for process use.
-17-

Water Injection
One of the major problems with a pressurized power cycle is the
need for participate removal equipment between the combustor and the
gas turbine. This equipment is expensive for a number of reasons,
including the high temperature and pressure service conditions and
the need for extremely efficient particle removal to insure adequate
turbine blade life. Also, the size of this equipment is based on the
volumetric flow rate of the products of combustion. For an adiabatic
power system that depends on large quantities of excess air to cool
the combustor, the particulate removal equipment is much more costly
for the same power output.
One possible way of reducing the volume of flue gas at the same
power output is to introduce liquid water into the combustor. This
type of operation has previously been considered by Combustion Power
Company [4]. The water would evaporate to steam; and the higher spe-
cific heat of the steam would aid in cooling the combustor. This
would permit slurry feed of coal into the combustor, eliminating the
need for expensive lock hopper arangements. The effect of water in-
jection on the volumetric gas flow rate is governed by a number of
opposing effects. Although much less water is needed than excess air
to cool the combustor, the water has a higher specific volume at the
operating conditions. Also a portion of the thermal energy must be
sacrificed as latent heat and therefore more fuel is consumed at the
same net power output. This effect may be partially offset by the
higher specific heat of the steam.
-18-

Water added to the combustor by means of a slurry with fuel and
sorbent may contribute to sorbent decrepitation and hence to elutria-
tion although this effect is difficult to evaluate. The conflicting
costs and benefits could be investigated, however, only those of ma-
jor consequence are analyzed here in detail.
Figure 9 shows the flue gas dew point at an operating pressure
of 10 atmospheres and at 1 atmosphere. The proposed exit gas temp-
erature of 121°C (250°F) is well above the dew point. Insulation of
the high pressure ducts and the high convective heat transfer co-
efficient minimize the possibility of cold spots (below the dew point
temperature) in the ducting.
The water required amounts to no more than about 7.6 m3/nfiin.
(2000 gpm) at a water addition rate of 4 kg H20/kg fuel for a 400 mWe
plant. This is somewhat less than evaporative cooling requirements
and is considered acceptable. The results of thermal efficiency cal-
culations for various amounts of water added with the fuel are shown
in Figure 10. Obviously efficiency suffers. This is mostly due to
the latent heat of vaporization of the steam which cannot be recovered
from the product gases.
Figure 11 shows the benefits in decreasing the volumetric flow
rate of the gases. The actual feasibility of this mode of operation
depends on a balance of the capital cost of particulate removal equip-
ment and the resulting carrying charges versus the increase in oper-
ating costs. However, it may be seen that to achieve one-third
-19-

duction in exit gas volume, the efficiency drops from about 39% to
29%. This is not an attractive prospect.
•20-

EFFECT OF SORBENT FEED SIZE DISTRIBUTION ON SYSTEM PERFORMANCE
Under normal operating conditions, it is expected that limestone
or dolomite sorbent will be crushed to some specified maximum size
before being fed to the combustor. Therefore the bed must operate
with a range of particle sizes. Since each particle size has a spe-
cific terminal velocity, a range of operating conditions exists for
which fine particles are elutriated from the fluidized bed. To study
the effects of elutriation on centrifugal combustor performance it is
necessary to choose a representative stone feed size distribution and
calculate the affected operating parameters.
Samples of the sorbent size distributions reported by various-
investigators are shown in Figures 12 through 15. These plots are
made on the basis of a distribution function defined such that P is
weight fraction of feed material having diameter <d , where d is
the diameter of a sphere having the same width as the average par-
ticle. Although the crushed sorbent particle is certainly not
spherical, it is close enough so that a screen analysis is a good
approximation for particle size ranges [13].
The above referenced figures indicate wide variations in par-
ticle size distributions from one investigator to another. This is
partially due to the effect of the type of crushing process and the
characteristics of the particular sorbent on the size range and the
shape of the distribution function. Also any processing that may be
done such as washing, screening, chemical reaction, etc. affects the
-21-

distribution function. Two particular stone size distributions were
chosen for analysis in the present study - one, reported by Combustion
Power Company [43], corresponds to a wide range of particle sizes from
fine dust to 6360y (1/4 inch). A second distribution, used by Pope,
Evans and Robbins [14], was obtained by double screening to establish
a maximum and minimum size of 2591y to 610y respectively (Figure 13).
In calculating elutriation rates for the centrifugal combustor
it was assumed that all particles with terminal velocity less than
operating velocity would be carried from the bed while none of the
larger particles would be entrained.
A conventional fluidized bed initially contains an amount of
distributed size particles, and if material is neither fed to nor
withdrawn from the bed except as elutriated fines, a specific rate
of elutriation may be found for those fines which have a terminal
velocity less than the operating velocity of the bed. This behavior
is characterized by a "rate constant". In addition, as bubbles burst
near the surface of the bed larger particles are thrown into the gas
stream. Some of these particles may be carried to the exit port be-
fore falling back into the bed. This process is known as entrainment
and its rate depends on the height of the exit port (or "freeboard
height") above the bed free surface for a conventional fluidized bed.
Similar behavior is expected for the rotating bed although insuffic-
ient information exists as yet to predict these effects. In fact the
concept of a freeboard height may not be appropriate for the rotating
combustor at all. If entrainment occurs, the particulate loading
-22-
of the exit gas stream will be higher than predicted. Due to the
effect of a finite elutriation rate constant, some of the fine par-
ticles may be withdrawn as spent sorbent before being carried out in
the exit gas. It should be noted that attrition and decrepitation
of sorbent could effectively change the shape of the size distribu-
tion function with time and that these effects would be highly de-
pendent on stone type and chemical and thermal history.
It is assumed that the sorbent is used only once and is not
regenerated and that the withdrawal point for spent sorbent is lo-
cated so as to remove particles with a size distribution character-
istic of the feed material. Density changes as a result of chemical
reaction are neglected. All particles are assumed to be spherical
in shape.
Figure 16 shows air mass flow rates corresponding to terminal
velocity for the indicated bed geometry as a function of particle
size. Each curve represents operation with an angular velocity re-
sulting in an effective gravity at the bed inner radius. Operating
conditions are assumed to be 1144K (2060°R) and 10 atmospheres
pressure. These parameters correspond to the probable operating
condition for a rotating combustor. Based on Figure 16 and the above
assumptions, the combustor air mass flow rate and angular velocity
for a particular elutriation rate can be found. The results for
both the CPC and PER particle distributions are shown in Figures 17
and 18.
■23-

To determine an operating range for the combustor, it is neces-
sary to evaluate the minimum fluidization velocity. This depends on
the actual particle size distribution present in the bed. To study
the effect of elutriation of a fraction of the incoming sorbent on
the minimum fluidization velocity, the bed size distribution must be
characterized with respect to the fluidization criteria. Kunii and
Levenspiel [13] recommend the use of a mean particle size for calcu-
lating minimum fluidization conditions. This mean is based on the
particle surface area. A specific surface for any given particle
may be defined as:
a' = /Surface area of particle^ _ u p'^ _ 6 ^ volume of particle ' ird^/6 <\> d
where <j> is the "sphericity" of the particle such that for a sphere
of the same volume as the particle:
_ , surface area of a sphere \ ^s vsurface area of a particle'
Then with the distribution function P, stated previously, the mean
specific surface area is:
r - ld • rs i pi *'-U>'i^ = -t £<«C7>
Denoting x. as the mass fraction of particles in the size interval
Ad . so that xi = AP.j:
-' 6 r / x \ . -' 6 a = 7~ ) (H—) or since a = —=- *s \ dpi ♦sdp
■24-

d = _L. - i P s5' I^TdTJ
i p'i
For example the Combustion Power Company sorbent mean particle diam-
eter may be calculated as follows:
Particle Average Particl e Wei ght Fraction Size Range (ym) Size in Interval (ym) (ym)
Adpi d . Pi xi ^(ym-1)
6339.8 - 4693.9 5517 .01 .0000020 4693.9 - 2362.2 2536 .26 .0000735 2362.2 - 838.2 1600 .18 .0001125 838.2 - 426.7 634 .16 .0002524 426.7 - 243.8 335 .15 .0004478 243.8 - 121.9 183 .12 .0006557 121.9 - 0.0 61 .12 .0019672
.003511
V "NiDi • 1 = 285 ym 00351
Because a portion of the feed material may be elutriated, the
mean particle size of material in the bed is dependent on the feed
size distribution and the air flow rate for any angular velocity.
A plot of the mean particle diameter as a function of elutriation
rate is shown in Figure 19 for the CPC sorbent. From this the air
mass flow rate for each mean particle size can be found. Thus a
unique operating curve exists for a given feed material and bed
angular velocity as shown in Figure 20. The minimum fluidizing
velocity is also a function of the mean particle diameter and is
shown below the operating curve in this Figure. The intersection
of the operating flow rate with minimum fluidizing conditions de-
termines the minimum allowable mass flow rate of air through the
-25-

bed for each angular velocity. If, as in the case of the PER sorbent
(also shown), minimum fluidization occurs before any portion of the
feed is elutriated, the combustor may be operated past the U , curve
until elutriation begins. For example, suppose the combustor is ro-
tating so as to produce an acceleration of 50 times that of gravity
at the bed inner radius. When air is allowed to flow through the bed
the finest dust is elutriated and the mean particle size increases
slightly. As air flow is increased, operation follows along Curve C
until it intersects Curve E. At this point the bed becomes fluidized.
Further increases in air flow result in operation on Curve C but the
minimum fluidization condition is shown directly beneath on Curve E.
If the flow of material to bed ceases and air flow is reduced,
operation proceeds downward along a vertical line until Curve E is
intersected. Below this point the bed would not be fluidized. In
the case of a double screened sorbent, the mean particle size may
not be affected until after the bed is fluidized. Thus as air flow
is increased operation is along the verticle line (Curve B) until
the terminal velocity of the smallest feed particle is reached at
the intersection of Curves B and D. Thereafter Curve D is followed
until the terminal velocity of the largest feed particle is exceeded
and the combustor is empty.
The effects of the use of a double screened sorbent (PER) on
the combustor operating parameters has been estimated on the basis
of the procedure outlined above. To allow comparison of operation,
similar plots have been made for the CPC sorbent.
-26-

Figures 21 and 22 illustrate the pressure losses associated with
operation at the indicated elutriation rates as a function of angular
velocity. The combustor size and operating conditions are representa-
tive of the expected full scale plant. One curve is shown for the bed
since the pressure drop is associated with its effective weight only
and not the mass flow rate of air.
The velocity of gases through the bed may be found as a function
of mass flow rate for a given geometry. Figures 23 and 24 show the
effects of elutriation rates on the expected velocity at the exit gas
duct. Similarly the radial air velocity at the outer radius of the
bed is shown in Figures 25 and 26. In each case a wide band of possi-
ble operation exists between the minimum fluidizing condition and the
point of incipient elutriation, for the double screened sorbent. Fig-
ures 27 and 28 show the effect of the variation in bed thickness on
the pressure loss and gas residence time for the minimum fluidization
condition. Adequate residence time is important for efficient sorb-
ent utilization. Residence time with the double screened sorbent
(Figure 28) is small compared to the unscreened size distribution.
This is the result of a higher minimum fluidization velocity for the
larger mean particle diameters of the PER sorbent.
Figures 29 and 30 show the expected net power output for the
combustor in an adiabatic combined cycle with an overall efficiency
of 39%.
-27-
A wide range of possible operation between minimum fluidization
and elutriation is evident for the double screened PER sorbent (Fig-
ure 30). In comparison, Figure 29 shows that elutriation of nearly
ML has begun before the bed is fluidized and that for an increase in
capacity above minimum fluidization at a given angular velocity the
elutriation rate increases significantly.
The rotational power requirement shown in kW for incipient elu-
triation in Figure 30, and U - in Figure 29, represents the energy
required to rotate the gases with the bed and does not include any
effects due to mechanical friction or acceleration of the feed ma-
terial to rotating velocity.
Finally the effects of combustor size on electrical output for
the cycle described above are shown in Figures 31 and 32. The bed is
assumed rotating with an angular velocity sufficient to produce an
acceleration of 490 m/s^ (50 gravities) at the bed inner radius. The
dimensions of the combustor are scaled as follows:
r. = 0.4rQ
re = 0.35rQ
i = 1.5rQ
The amount of particulate in the flue gases is an important design
consideration. Government regulations limit allowable dust emission.
In a pressurized power cycle the flue gases are expanded in a
gas turbine. Thus, very clean gas is required. To achieve this,
■28-

particulate removal equipment is used with stages in series. The
higher the elutriation rate from the bed, the more stages are required.
This equipment must operate at high temperature and pressure and is
therefore very expensive.
The procedure used to estimate elutriation is based on the as-
sumption that if the terminal velocity of a particle is exceeded, it
is swept from the bed. The terminal velocity is defined as a condi-
tion of balance between any body force on a particle such as gravity,
or radial acceleration and the drag exerted by the fluid. In a ro-
tating bed the body force is made up primarily of the centrifugal
acceleration associated with the tangential velocity of a par-ticle.
Thus, there is a variation in the body force with position in the
combustor and a corresponding range of terminal velocities. The
terminal velocity at the inner bed radius is used assuming it is a
lower limit.
For conventional fluidized beds there is finite rate of par-
ticle elutriation due to the mixing effect of the bed. An accurate
prediction of particle carryover includes an estimate of this rate
constant and its effect on the equilibrium conditions in the bed as
material is fed to and withdrawn from the combustor. Thus the assump-
tion that any particle with terminal velocity less than the velocity
of gas through the bed is immediately elutriated is believed to be
conservative. It is estimated that the flexibility of operation with
a rotating combustor at a given angular velocity and elutriation rate
-29-

is strongly dependent on the size distribution of the sorbent feed
material and that the power output capacity of the combustor can be
increased at an acceptable flue gas particulate loading by double
screening the feed.
-30-

CAPITAL COST COMPARISON
To evaluate the overall energy cost for a power production sys-
tem, the capital required to purchase and install the necessary equip-
ment must first be estimated.
The analysis for the various systems is as follows:
If the cost information available from the references [1,2,3]
on the 635 MWe nonadiabatic steam, nonadiabatic, and adiabatic com-
bined systems is studied to ascertain which components are the major
contributors, it is found that a few equipment groupings constituted
over 50% of the total equipment cost. The remainder of the cost is
fairly evenly distributed in amounts of 2 or 3%. Accurate costs for
these items is difficult to obtain and subject to wide variation
among the equipment vendors.
Power plants in the 600 Mw , 300 MW, and 30 MWg size range are
most common, and represent the expected "base loaded" and "peaking"
or heavy demand period plant capacities. Also a comparison of the
equipment required for the two adiabatic combined systems shows a
difference only in the type of combustor. Therefore the cost of a
centrifugal adiabatic combined system may be estimated by replacing
the cost of the simple adiabatic combustor by that of the centrifugal
combustor.
To estimate costs for the most important pieces of equipment,
quotations or price lists must be obtained from the vendors.
-31-

The following cost data has been included.
Gas Turbine/Generator Equipment in the 30 MWe and
100 MW range, including a comprehensive listing
of materials and services as well as options.
(Westinghouse, August 1975 [15]).
Steam Turbine/Generators in all sizes and config-
urations from 20 MW SCI F to 1500 Mhl CC6F machines e e
complete with standard bill of material and accessory
prices. (Westinghouse, September 1975 [16]).
Waste heat boilers and air preheaters complete with
controls and auxiliary equipment, installed costs.
(Babcock & Wilcox, January 8, 1975 [17]).
Particulate Removal Systems for both low and high
pressure, high temperature operation (Fuller Co.,
1972 and Ducon, 1975 [18]).
Where vendor cost data was not obtainable the rest of the equip-
ment costs have been estimated from theliterature [1,2,3]. Capital
equipment costs are quoted on a dollar per kilowatt of installed ca-
pacity basis, for the 635 MW unit size, in 1971 dollars. Thus it
is necessary to adjust the quoted dollar values to take into account
both variation in particular equipment size or capacity and the esca-
lation in cost from 1971.
■32-
Escalation factors may be found in the Handy Whitman Index of
Public Utility Construction Costs published by Whitman, Requardt and
Associates [19]. This cost index is published semi-annually and in-
cludes escalation factors by region of the U.S. for each major equip-
ment category, such as, "Boiler Plant Equipment - Coal Fired", "Turbo-
generator Units", "Misc. Power Plant Equipment", as well as "Total
Plant - All Steam Generation". To account for variation in capacity
at the different unit sizes, an exponential relationship is used [20].
Ci = B.(x/xb)Yi
where
C. = cost of equipment of capacity x
B. = base cost of equipment with capacity xj-,
y- = exponent to be estimated from availabe information
The exponent y- would of course differ most amongst the various equip-
ment categories. However assuming that this variation is small and
can be averaged over the total plant, the value may be estimated
using the Federal Power Commission Report "Steam Electric Power Con-
struction Cost and Annual Production Expenses", published in 1972
[21]. The report lists the total costs of equipment used in steam
power stations, which went into operation from 1917 to 1972. The
costs for station sizes ranging from 74 MW to 1800 MW , installed
between 1967 and 1972, converted to 1971 dollars using the "Handy
■33-

Whitman Index", and plotted against the unit sizes on a log-log graph
are shown in Figure 33. An approximately linear relationship between
the variables is obtained. All the data points lie within about 30%
of the straight line. (Only data for coal fired power stations lo-
cated in the continental United States was considered.) The slope of
this cost versus size line on the plot is found to be 0.94. This is
the required exponent, y. in the above scaling relationship.
In order to account for the differences in respective equipment
capacities among the various cycle configurations, the ratio x/x. in
the size escalation equation corresponds to any significant equipment
capacity parameter ratio, i.e. gas flow rate, steaming rate, feedwater
rate, etc. For example, the stack and foundation for a system with
350% excess air is estimated as:
r. ±. ^ o™ • J. /Gas Flow-350% excess air\ C. = cost for 20% excess air system (Gas F1ow_20% excess air )
If estimates for the specific equipment sizes are available, these
are used rather than scaled values.
Installation is estimated to cost 7% of the basic equipment cost
if precise quotations are not available. Also equipment such as coal
handling and feeding is made up of components from many suppliers
and the costs of these components are dependent on site layout. Con-
versely, costs are not highly variable with actual required coal flow.
Thus some reasonable compromise must be assumed to account for the
difference in costs of motors and belts with changing size. It is
-34-

estimated that 80% of the cost of a 600 MW system is required for
a 300 MW unit and that about 15% above the scale down 300 MW cost e e
represents the price for the 30 MW unit. An estimate of $5,000,000
was made for the 600 MW size rotating combustor.
Tables 1, 2 and 3 show the estimated equipment costs for the
various types of power stations.
Uncertainties arising in the cost estimates may be due to errors
in the estimated scaling relation, the use of the Handy Whitman Index
in escalating costs from the base year to 1975, and uncertainties in
the estimated costs of certain important items like particulate re-
moval equipment and pollution control equipment. These errors and
their effects on the accuracy of overall estimates are discussed
below.
As noted earlier, the data points used to determine the exponent
in the size scaling relation have been obtained from the Federal
Power Commission report [21] on the costs of steam power stations.
The costs listed in the report refer to the "Net cumulative costs to
the reporting date - that is, the initial investment in the plant
plus the costs of all additions, less all retirements. Thus, the
total investment in a plant may include expenditures made over sev-
eral years" [21]. Hence, the use of the starting date of the plant
as indicative of the time at which all the expenditure on equipment
in the plant was incurred is likely to cause errors in the estimated
cost-size relationship. Moreover, the data points on the graph are
-35-

off the straight-line drawn by about 30%. Thus, the cost estimates
of all those item's (i n the: 300 MW and 30 MW systems) which were ob-
tained by using the scaling relation could be in error by correspond-
ing magnitudes.
The Handy Whitman Index [19] does not provide a complete break-
down of inflation factors for every type of equipment listed in Tables
1, 2 and 3. The only inflation factors listed are for equipment
groupings, such Boiler-Plant Equipment, Turbogenerator Units, etc.
Hence, the same inflation factor has been used in figuring the 1975
costs of all the equipment items in a single category. This does not
introduce an error in the overall equipment cost of the specified
category (say for example, the boiler room), even though the indi-
vidual estimates for items like the boiler, coal feeding units, ash
handling units, etc., may not be accurate.
The unit costs of cyclones to be used in particulate removal
equipment seem to increase with size, especially for the handling of
high pressure and high temperature gases, as in the nonadiabatic com-
bined cycle and the adiabatic combined cycle system. Further, the
costs quoted by vendors cover only the main cyclones and do not in-
clude the costs of connecting hiigh pressure piping, installation,
etc. Based on available data, the total cost of particulate removal
equipment including connections and installation, has been estimated
to vary between $16 - $100 per kW of installed capacity, depending
upon the size and type unit and the number of stages of cyclones
-36-

desired. Therefore, the costs of participate removal equipment
listed in the tables have been listed in three categories, corres-
ponding to most probable, high, and low, depending upon the degree
of clean-up necessary. The present indications are that a two-stage
cyclone separator cannot successfully remove all particles down to
the size and concentration levels necessary for a satisfactorily
long turbine life. Three stages of equipment may be required to
clean up the flue gases to ensure a sufficiently dust-free gas for
turbine operation [3].
Even the costs of low pressure particulate removal cyclones are
somewhat uncertain, since these are based on the assumption that two
stages of cyclones, followed by an electrostatic precipitator, are
necessary to comply with EPA regulations. The presence of calcium
sulphate dust in the flue gas may make it impossible to clean the
gas sufficiently with an electrostatic precipitator. A wet-scrubber,
gravel-bed filter or some other type of equipment may have to be
used in place of the cyclones and/or the electrostatic precipitator.
The cost of a wet-scrubber system in 1971 for suphur dioxide and
particulate removal was $40/kW of installed capacity, of which about
a half (i.e., $20/kW), was attributable to particulate removal alone
[1]. The presently estimated costs of wet scrubbers for particulate
removal alone range between $10-$12/scfm of flue gases to be cleaned
[22]. In both the nonadiabatic steam system (PER) and the conven-
tional pulverized-fuel system, the total amount of flue gas flow is
nearly 1.1 xlO scfm, while in the adiabatic steam system, the flue
-37-

gas flow is about 4x10⁶ scfm. Hence, the costs of wet-scrubbers
for particle removal would be approximately $11 xlO6 and $40xl06
for the adiabatic steam system. Both these costs are higher than
those of cyclones and percipitators used in arriving at the costs
listed in the tables.
The total costs of pollution control equipment required in
conventional pulverized fuel boilers ranges between $50 and $100/kW
[1,22]. Both estimates are listed in the tables.
Particulate carryover is dependent on the bed geometry, oper-
ating conditions, and the history and preparation of the bed ma-
terial. In general the particle size distribution and grain loading
in the flue gas is the result of other design considerations, i.e.
the most economical bed cross sectional area, best combustion ef-
ficiency, optimum turndown ratio, etc. Thus it has been necessary
to include a primary cyclone to remove coarse particles (>5ym).
As shown in the results of the study to determine probable
elutriation rates from a rotating combustor, it is expected that
the rotating system can be operated at minimum fluidization condi-
tions over most of the load range, and, that elutriation of large
particles can be kept to a minimum. Hence it is possible that one
less stage of cleanup would be required and the costs of the cen-
trifugal systems reduced. This is shown by the costs in "low"
line, in Tables 1,2 and 3.
By comparing the total equipment costs of all the systems
listed in the tables, it is clear that every type of fluidized
-38-

bed system is more economical then the conventional pulverized-fuel
system (including stack-gas clean-up equipment), on an installed
cost basis. There thus exists a very strong economic incentive to
develop the fluidized bed systems and make the modifications neces-
sary to overcome some of the difficulties presently experienced in
successfully designing and operating them.
Among the fluidized-bed systems, the adiabatic combined cycle
(Westinghouse System) is the least expensive, on a first-cost basis.
However, this system at present may not be successfully operable be-
cause of the inability of cyclones to clean the flue gas sufficiently.
The abrasive ash and other corrosive material in the flue gas erodes
and corrodes the turbine blades so that gas turbines cannot operate
satisfactorily, unless the particles are smaller than about 3 ym in
diameter and the total particle density in the flue gases is less
than about 0.005 gr/scf. None of the existing types of cyclones can
achieve the level of clean-up necessary to ensure a satisfactory
level of turbine performance and life. Hence, both the nonadiabatic
combined cycle and the adiabatic combined cycle units are presently
of questionable feasibility, though future developments like gravel-
bed filters may be expected to ensure a sufficiently clean flue gas,
at a low first cost.
Next to the nonadiabatic combined cycle in cost is the nonadia-
batic steam system of Pope, Evans and Robbins. This system has dis-
tinct advantages over the combined cycles, since it does not utilize
-39-
an expensive gas turbine and therefore, the only requirements for
particulate removal are those imposed by EPA. The costs of cyclones
needed for this purpose are not as high as those for the pressurized
systems. Thus, even though the overall cost of the system is some-
what higher then that of the combined cycles, it is within the realm
of operational possibility.
The nonadiabatic steam system turns out to be lower in first
cost than the adiabatic steam system mainly due to the high cost of
the compressor as compared with that of the forced draft fans and
the larger size of particulate removal system needed due to the in-
creased volume flow of air. The compressor is necessary to overcome
the increased pressure drop through the rotating bed (about 30 psi,
as opposed to a few inches of water).
A comparison of total equipment costs from Tables 1, 2 and 3
exhibits another significant fact - that the costs of all the sys-
tems tend to become equal as the sizes decrease. This is shown in
Figure 34, which gives the relative cost difference of the adiabatic
combined system over the nonadiabatic combined cycle as a function
of capacity.
-40-

TOTAL ENERGY COSTS FOR CONVENTIONAL AND FLUIDIZED
BED COMBUSTION SYSTEMS
One effective way of comparing a group of energy conversion sys-
tems is to evaluate the cost of the electricity produced in mills/kWh.
The factors which contribute to the total energy cost include a fixed
charge on the capital expended to design and construct the plant, the
cost of fuel and any other consumables such as sorbent, and the cost
of operating and maintaining the plant. To study the effect of chang-
ing economic conditions on the viability of each plant type, the com-
ponents of the cost of energy may be varied,i.e. fuel cost, interest
rate, escalation, etc. The best type of system for a given applica-
tion may be found by choosing values typical of that application.
For example, the system most suitable for small capacity and inter-
mittant operation (or peaking operation as it is called) is the one
which has the lowest cost of energy under these conditions.
The purpose here is to compare the proposed fluidized bed com-
bustion systems and a conventional pulverized coal unit (with a stack
gas scrubber). First an algorithm is developed to calculate energy
costs with a range of values for each parameter. The next step is
to identify a reasonable set of ground rules to serve as central
values for the cost parameters. Finally results are compared and
discussed. The cost of energy is computed in the following way:
$(Annual Fixed Cost) + $(Annual Fuel and Sorbent Cost)+ CQr _ $(Annual Operating and Maintenance)
Annual Net Electrical Generation (kWh)
•41

Annual Fixed Charges
The fixed costs are associated with the debt incurred in design-
ing and building the plant. An annual fixed charge rate or percent-
age is applied to the installed capital cost of a unit. This rate
is made up of interest on borrowed funds beginning at the time the
plant goes into service, depreciation, taxes, insurance, etc. The
fixed charge rate varies among utilities, and with economic condi-
tions at the time of construction. Typical values are between 12%
and 24%. The installed capital cost of a plant includes engineering,
plant equipment, land and rights, structures and improvements as well
as the interest on borrowed funds and escalation during the construc-
tion period. The cost of the plant is generally spread out into a
series of payments, throughout the construction. A plot of cumula-
tive unescalated cost versus time is generally "s" shaped reflecting
lower payments at the beginning and end of the construction period
[23]. The highest payments usually occur somewhat later than the
middle of the period. Estimates of the total capital cost are based
on quotations gathered before and during the early months of construc-
tion. Included in many of the subsequent purchase agreements is an
allowance for cost increases due to inflation. Therefore an esti-
mate of the capital cost of a plant must include escalation. It is
assumed here that each payment is subject to escalation at a fixed
rate from the beginning of the construction period until the time of
the payment. The escalation rate is applied to each payment from
the start of construction until the time of payment. This escalated
-42-

payment then accumulates interest until the end of construction. The
sum of all the interest and escalated payments is the installed capi-
tal cost. The times and payments used in computing escalation and
interest are illustrated for the cash flow of reference 23 in Figure
35.
Annual Operating Charges
Annual fuel and sorbent cost is determined on the basis of the
annual net generation and the overall thermal efficiency of a given
system.
The annual net electrical generation is found by assuming an
average annual "capacity factor". This factor is the ratio of the
actual electrical output to the rated or certified maximum output
of the plant for one year. The average capacity factor multiplied
by unit rating and total hours in a year is the net electrical out-
put.
The cost of the sorbent required to remove approximately 90%
of the sulfur in the fuel may be estimated in the following way.
The molar feed ratio, or the required number of moles of calcium
per mole of sulfur is estimated. Experimental data indicate a
range of possible requirements. Then the mole ratio is converted
to a mass ratio of calcium carbonate to sulfur, and, assuming some
fraction of calcium in the limestone or dolomite, and sulfur in the
fuel, the mass of stone per mass of fuel may be estimated. The cost
of the stone (limestone or dolomite) and the higher heating value
-43-

of the fuel allow the computation of cost/kJ of heat input. Then the
sorbent cost for any operating conditions is found in the same way as
fuel cost according to the net electrical generation (see sample cal-
culation below).
Operating and maintenance (0 & M) costs may be treated in vari-
ous ways. In general there is a fixed part associated with staffing
and general upkeep and a variable part which is proportional to the
electrical generation. The 0 & M portion of the total annual cost
is usually small relative to the fixed charges and fuel costs, and
often it is treated as a constant which is proportional to the rated
capacity of the unit. In other cases a purely variable factor is
used. Estimates vary with the type of plant as well as with operat-
ing requirements. It is assumed here that 0 & M cost is proportional
to the net electrical generation.
Ground Rules
Variables in this type of analysis may be divided into two
groups. Those which are dependent upon the economic environment
such as fuel cost in <fc/kJ, interest rates, etc. are assumed not to
vary with the type of plant. Others, such as capital cost and ef-
ficiency form the basis for the differences between the various
systems. Values chosen for the first group of variables are in
comformance with the ground rules specified in the Energy Conver-
sion Alternatives Study [24], and are shown in Table 4. Table 5
is a summary of the variables which differ between systems.
-44-

Three unit sizes have been chosen for study. The smallest may be
considered suitable for "peaking" operation. That is, to supply
energy primarily during times of highest demand, such as on hot
summer days when air conditioning loads are high. The 30 MW capac-
ity is typical of current combustion turbine technology (which is
dependent on distillate oil or natural gas for fuel). The 300 MW
and 600 MW unit sizes are typical of the present coal fired base
loaded systems. These units must change capacity with demand but
are operated continuously with the exception of an annual mainten-
ance shutdown and forced shutdowns. Capital costs are shown for
each unit type and size with up to three categories. The categor-
ies correspond to each of three estimates for pollution control
equipment. For the pulverized coal system, cost estimates corres-
pond to stack gas scrubbing which is assumed to be 50$/kw and 100$/
kw. These values represent the most probable and maximum probable
costs [22,25].
The two systems utilizing a rotating combustor, the adiabatic
steam and adiabatic combined systems, are listed with an additional
value below the most probable cost. This represents the possible
reduction in particle cleanup costs due to the rotating bed, i.e.
a single stage instead of two or three stages. All of the systems
operating at elevated pressure are also assigned a high value for
three stages of particle cleanup.
-45-

An example of the calculation procedure is shown below for the
600 MW adiabatic combined cycle with a rotating combustor, and two
stages of particle cleanup.
Sorbent cost - 2 ro1eS CaC°3 x 10° k9 CaC°3 x l^leS x .039 kg S
aorDem: cost mole S x mole CaC03 x 32.1 kg S x kg coal
v 100 kg Stone 1 kg coal $11 10"3Mg x 53 kg CaC03
x 25.1 MJ x Mg Stone x kg stone
Sorbent cost = $1,8Mj
10"
3 Net Electrical Generation = 600 MW x10^w x 8760 h/yrx.65 (capac-
ity factor)
= 3.416 x 10⁹ kWh/yr
Annual Fixed Cost = .18x (192.6) (1.0+ .214*+ .242*) x106
= $50.48 yr/xlO6
Escalation and Interest during construction I ' are found as follows.
+ T- o * n^ 4.,. Total Construction Duration t = Time Between Payments = # Payments
= 5 yr/12 payments
5 t = Y2 yr/payment
7ol Each payment in the series is: Paymenti = Ax x Total Cost (Unesc)
-46-

The percentage of the total for each payment is taken from the cash
flow of reference [23].
Since payments are spaced equally in time, the time from start
of construction to the time of any Payment.j is:
n = t x i
The Escalated Paymenti = Paymenti (1 + esc^gtion V
Escalation = | Payment. [(1 + esc^gtion V -1]
D„mn , rri escalation %\n ,n 12 Payment.L(l rgo ' ■"
Escalation Factor = £ Total Cost
Paymenti = y^g- x Total Cost
12 rr„1;it. n c^-t-™ - v %i r/i J. escalation °An n Escalation Factor = } y^ ]_(] + <rf\rj ) "'J
Interest is computed based on the escalated payment from the time
that payment is made until completion of the plant.
Interest Factor = J *L [(1 + escalation %ft
m + interest °A(Tota1 Construction Time-n) x LU + 100 )
For example:
5/12 10/12 Escalation Factor = 1.2/100[(l+.065) -1]+1.8/100[(l.065) -1]
-47-

+ 2.5/100[(1.065)15/12-l] + 5.5/100[(1.065)20/12-l]
+ 9.0/100[(1.065)25/12-l] + 12/100[(1.065)30/12-1]
+ 17/100[(1.065)35/12-1] + 20/100[(1.065)40/12-l]
+ 13/100[(1.065)45/12-1] + 9.5/100[(1.065)50/12-1]
+ 5.5/100[(1.065)55/12-l] + 3.0/100[(1.065)60/12-l]
= .214
Interest Factor = 1.2/100[(l.0655/12][(l.10)55/12-1]
+ 1.8/100[(l .065)10/12][(1.10)50/12-1]
+ 2.5/100[(1.065)15/12][(1.10)45/12-l]
+ 5.5/100[(1.065)20/12][(1.10)40/12-l]
+ 9.0/100[(1.065)25/12][(1.10)35/12-l]
+ 12/100[(1.065)30/12][(l.10)30/12-1]
+ 17/100[(1.065)35/12][(1.10)25/12-1]
+ 20/100[(l.065)40/12][(l.10)20/12-1]
+ 13/100[(1.065)45/12][(1.10)15/12-1]
+ 9.5/100[(1.065)50/12][(1.10)10/12-l]
+ 5.5/100[(1.065)55/12][(1.10)5/12-l]
-48-

+ 3.0/100[(1.065)60/12][(1.10)°-13]
= .242
Annual Fuel Cost = ($8.06 x 10"4/MJ) x(kJt/.38kWse) x(10"3MJ/kJ)
x (3.416 x 10⁹ kWh/yr) x 3600 s/h)
= $26.07 x 10⁶/yr
Annual Sorbent Cost = ($1.8 x 10"4/MJ) x(kJt/.38kWse) x(10-3MJ/kJ)
x (3.416 x 10⁹ kWh/yr) x (3600 s/h)
= $5,825 x 106/yr
Annual 0 & M Cost = (1.5 mills/kWh) x ($1.00/103 mills)
x (3.416 x 10⁹ kWh/yr)
= $5,124 x 106/yr
Cost of Energy = $(50.48 + 26.07 + 5.83 + 5.12) x 106/yr x 103minS/$
3.416 x 10⁹ kWh/yr
= 25.62 mills/kWh
Inflation may be dealt with in a variety of ways in a study of
this type. If current year dollars are used, values are not ex-
pressed in familiar terms. In other words, the number of dollars
associated with the cost of an item may seem "high" for a few years
hence, until it is understood that the dollars for any commodity in
-49-

that year are "high" by a similar amount. Another problem which
arises is in comparison of values computed for different years. For
example, if two power plants are begun in the same year and different
construction periods are required, then the installed capital costs
will be expressed in different year dollars, making comparison diffi-
cult. This problem may be eliminated by choosing a common on line
date for the two systems.
Another possible approach is to use constant valued dollars,
that is to express costs in dollars of a single year. This elimin-
ates the problem of value comparison but the costs are not then ex-
pressed in real dollars of any year.
In this analysis a common on line date is assumed and all costs
are expressed in "current year" dollars at the time the plant goes
into operation. It is expected that costs will increase over the
operating life of a plant due to inflation. Expressing the change
overall energy costs in terms of the inflated dollars does not pro-
vide a clear picture of cost differences between the respective sys-
tems. Therefore to understand the effects of cost increases in
the energy cost components (such as fuel, sorbent, etc.), the in-
creases above the general inflation rate may be expressed in "on
line year dollars" and the cost of energy found from the parametric
curves described below.
Figures 36 and 37 show the sensitivity of the cost of energy
to escalation rate during the construction period, and total required
-50-

construction time respectively. It may be seen that the costs follow
essentially parallel trends with changes in these variables. This is
so because each variable affects only the installed capital cost of
the plant. Since the proportion of total energy cost contributed by
fixed charges remains essentially the same for each case, no change in
the respective cost rankings is anticipated. Figure 38 illustrates
the range of expected energy costs as a function of fixed charge rate.
The slopes differ according to the ratios of installed capital cost
for each system.
Figure 39 shows cost variations with fuel charges. Slopes are
different because of differences in expected efficiency among the
various systems. It may be seen that energy costs are quite sensi-
tive to fuel charges.
Figure 40 indicates changes in the economic ranking of various
systems with increasing sorbent cost. The reason is twofold. First,
the differences in efficiency among the various systems result in
differing amounts of fuel required which in turn produce sulfur
dioxide so that sorbent requirements change. Secondly, preliminary
experimental evidence [1,2] indicates that the calcium-sulfur mole
ratios are least for scrubbers and greatest for atmospheric pressure
fluidized beds. This is reflected in the costs shown. Of course,
costs for a one to one ratio for example for a system may be found
by reading the "(1/Assumed Ca-S mole ratio)" x cost from Figure 40
for each system. The values assumed are:
-51

Ca/S mole ratio Unit type
1.27 Conventional Pulverized Coal
3.0 Atmospheric Pressure Fluidized Beds
2.0 Pressurized (10 Atmospheres) Fluidized Beds
The influence of average yearly capacity factor on the cost of
electricity is shown in Figure 41. Significant increases in cost with
decreasing capacity factor are evident. These increases are greater
for the adiabatic combined systems and for the conventional pulver-
ized coal unit, because of their higher installed capital costs.
Figure 42 shows the expected ranges of energy costs at a capac-
ity factor of 65% for each unit size. The broad band of possible
costs for the adiabatic combined systems is the result of uncertainty
in particle cleanup costs. If the rotating combustor can achieve low
elutriation rates and only one stage of particle cleanup is required,
costs are seen to be competitive with the nonadiabatic steam system,
and very close to nonadiabatic combined cycle costs at the lower ca-
pacities. The adiabatic steam system remains most expensive pri-
marily because of lower efficiency, and capital costs which are in
the intermediate range. The nonadiabatic combined system is least
expensive; but it may be difficult to start up and control.
Figure 43 is a plot of energy cost with capacity at 25% capac-
ity factor, representative of peaking operation. Wider cost bands
are shown for each of the systems.
■52-

A LABORATORY SCALE CENTRIFUGAL FLUIDIZED BED APPARATUS
The effects of solids feeding and removal on the rotating fluid-
ized bed is an important design consideration. One way to further
the understanding of the process is to build a laboratory scale model.
The model must have enough flexibility to permit varying the geometry,
particle sizes, air flow rates etc. so that each of the variables can
be studied and data obtained. The mechanical design has to be safe
and of such scale as to permit visual observation of the bed and
solids feeding apparatus, without exceeding laboratory compressor
capacity. The angular velocity range of the bed must be high enough
to produce radial acceleration many times one gravity. The following
geometry is found using the fluid mechanics model [6] to be suitable:
rQ = 0.152 m
r. = 0.122 m
r = 0.076 m e
£ = 0.229 m
d = 634 ym, 495 urn
Figure 44 shows the expected air flow required at minimum fluidiza-
tion for the above listed geometry and particle sizes. Figure 45
indicates the solids flow rate required to support combustion and
remove the SO^. Values are computed using the first law analysis
of reference [6]. The sorbent is limestone with 90% CaCOg and a
2 to 1 molar feed ratio of calcium to sulfur. Using this bed geom-
etry and the above flow rates, the mechanical design is as follows.
-53-

Numbered parts pertained to Figure 46, while small letters refer to
subassembly drawings, Figures 47 to 53. Part 1 is the rotating cham-
ber. Details are shown in Figure 47. The chamber bottom (c) is of
aluminum sheet with pie shaped sections cut out to allow solids re-
moval. The cylindrical portion (b) is of perforated aluminum sheet
and serves as the support for fine mesh screen designed to keep the
bed particles from leaking out. The top is plexiglass sheet to permit
visual observation, drilled and tapped around the circumference to
attach to the cylinder and with the center cut out to accommodate
the air exit duct. The chamber is attached to a shaft by means of
the fitting (d). It is intended that the bed be kept at uniform
depth by positioning a withdrawal slot in the chamber bottom at the
inner bed radius. If the bed depth increases beyond this point sol-
ids drop through the slot into the removal pan. A variety of bed
thicknesses can be obtained by inserting various bottom plates over
the chamber bottom. The plate (not shown) is then held in place by
machine screws.
The solids removal pan (2) (see Figure 48) is fabricated of
aluminum. It consists of two concentric cylindrical sides (e&f)
with an annular bottom piece (h) cut out to accommodate 4 exit
tubes (g). The center portion is covered, (i), and houses one of
the shaft bearings (7). A hole is provided for the shaft (6) and
the shaft is sealed with felt at this hole to keep solids away
from the bearing. The solids which fall from the rotating chamber
in the removal pan and fall through the four exit tubes to a
-54-

collecting bin for recycling. The distance between the exit tubes
and the angle of repose of the intended solids is such that any
pile that would accumulate on the removal pan bottom is lower than
the pan height. The removal pan is sealed from the rotating chamber
with felt. This seal is not critical since the pressure in the plenum
chamber is greater than in the rotating chamber and removal pan.
Hence clean air leaks into the removal pan.
The shaft support bearings (7) are bolted to two plywood base
plates (8) which are in turn secured to four angle steel legs (5).
The base plates (see Figure 49) (4) are cut out to accommodate the
solids exit tubes, the shaft, and the flange mounted shaft bearings.
Although the solids exit tubes are not long enough to penetrate both
base plates, it is intended that the exit tubes connect to the solids
collecting bin with flexible hoses and the bottom base plate may
serve as a support for the hoses.
Power is supplied to the shaft via a variable speed electric
motor (9) and belt drive assembly. The rotational speed range of
the chamber may be altered by changing the respective pulley sizes
(10). The electric motor is mounted on a support bracket (11)
attached to the angle steel legs.
Air is supplied to the bed through a square plenum chamber (3)
(see Figures 50 and 51). The sides of the chamber (a and o) are
fabricated of plexiglass sheet with four entrance ports (n and q)
which are attached to flexible hose and the air supply. The assembly
-55-

is held together with machine screws which thread into square plexi-
glass corner bars (m and p) epoxied to the plexiglass sheets. The
top (Figure 51), is cut out and drilled and tapped to accommodate the
exit duct (4) (see Figure 52). Air flows out through this duct to a
particle collection apparatus (not shown) via a flexible hose. The
duct is fabricated of plexiglass tubing (j) and attaches to the plenum
top by means of a flange (k) which is epoxied in place. The top of
the horizontal section contains a small diameter plexiglass tube (j)
which accommodates the solids feeding apparatus (12) (see Figure 53).
The solids are supplied to the chamber through a telescoping feed
pipe (u & w). A wiper type seal (v) is attached to the lower pipe
(w) which permits the vertical position of the feed nozzle to be
changed. The feed nozzle (not shown) is attached to the lower pipe
by means of the threaded connection shown. The apparatus is con-
nected to the solids upply by means of an elbowed flange.
A complete list of materials as designated alphabetically on
the subassembly drawings is shown in Table 6.
-56-

CONCLUSION
Some aspects of the feasibility of a centrifugal fluidized bed
combustion system have been investigated. It appears that, based on
the operating assumptions made, the centrifugal system operated under
pressure in a combined Brayton-Rankine Cycle has an efficiency equal
to or greater than other fluidized bed designs and the conventional
pulverized fuel power plant. It has been found that if the rotating
combustor is operated at essentially atmospheric pressure, the pres-
sure loss through the bed due to the increased effective weight com-
bined with the high excess air flow required to cool the combustor
results in a greatly reduced overall efficiency.
From the standpoint of operability, it has been found that the
centrifugal system has potential for reduced flue gas particulate
loading. This is so because the device can be operated at minimum
fluidization conditions over most of the load range. Hence the
proportion of bed material with terminal velocity less than operating
velocity can be minimized. If the reduced particulate loading can
be realized as a saving in pollution control equipment, very attrac-
tive overall equipment costs result for the rotating system.
Overall costs of electricity for each of the fluidized bed
combustion systems and a conventional pulverized coal plant with
stack gas scrubbing have been found for a reasonable set of condi-
tions and the sensitivity of the results to changes in these as-
sumed conditions has been investigated. Results show potential
-57-

savings with the fluidized beds. The most attractive arrangement
from a purely economic viewpoint is the nonadiabatic combined sys-
tem. The adiabatic combined system appears competitive at lower
capacities if elutriation can be kept to a minimum. Significant
economy of scale is evident. Costs of sorbent to eliminate sulfur
dioxide pollution are shown to be significant and the cost of en-
ergy production is sensitive to increases in either cost per ton
of stone or greater calcium-sulfur ratio to achieve an acceptable
level of cleanliness.
Results fall within the range of current estimates of energy
cost and overall efficiency [24]. The greatest uncertainty in the
estimates results from incomplete experimental data for calcium re-
quirements in each of the various systems, and from estimated costs
of particulate removal equipment. Significant advances in particle
cleanup could lead to much greater savings in the combined cycle
systems.
To adequately design and build a rotating fluidized bed com-
bustor much further experimental research is required. In predict-
ing elutriation a highly simplified model has been used since there
is insufficient data for a better one. The combined effect of a
radial acceleration which varies with radial position and a distri-
buted feed particle size may result in completely new bed charac-
teristics and particle carryover rates. Segregation of bed ma-
terial could result. The effects of feeding and removal of solids
-58-

on the bed fluid mechanics if not fully understood. Further theo-
retical and experimental work is required to determine velocity pro-
files and required feed system. To confidently design and build a
rotating fluidized bed combustor much further research is required.
As previously indicated, the model used to predict particulate
carryover is greatly simplified. Experimental data on the elutria-
tion rate, freeboard height and the effects of bed geometry is re-
quired to formulate an accurate model. The pure fluid mechanics of
a rotating drum with radial air flow is quite complicated. Boundary
layer effects near the stationary wall and parameters that govern
the size of the viscous core region are only partially understood.
The effects of solids feeding and removal on the bed velocity pro-
files and problems of segregation within the bed must still be in-
vestigated.
The actual combustion process and reaction kinetics of sulfur
dioxide capture is another realm of investigation to be explored
and understood so that sorbent waste and unburned carbon can be min-
imized. The centrifugal fluidized bed combustor represents an
attractive improvement over the conventional power production system,
and further research is most certainly justified.
-59-

-TABLE 1
Installed Equipment Costs for 600 MWe [in millions of dollars]
E O)
-o Ol M
■r— S- 0) > r— r- (O 3 o a. o
o •r—
<o .o nj
-a E ra <a e a> o +J z oo
■U
-O B m ra •r- <u ■o +J
Ol
o 73 55 <a .o -a <o a>
■r- C -O -r- <a -o c E o o Ad
iaba
tic
Combined Cycle
with
Centrifugal
FBC
Adia
bati
c Co
mbin
ed Cycle
with Conventional
FBC
Steam Generator & Combustor 33.776 25.635 26.040 14.677 11.287 11.287
Fans & Compressor 1.049 1.532 18.000
Particulate Removal
and
Piping
3 stage 15.897 61.323 61.323
2 stage 6.801 14.343 12.091 44.823 44.823
1 stage 2.816 9.562 28.313
Stack & Foundation 0.504 0.480 1.309 0.477 1.309 1.309
Air Heater 3.535 4.729
Coal Handling & Feeding 14.548 15.023 13.200 15.133 13.905 13.905
Ash & Dust Handling 2.882 3.769 3.737 1.569 3.549 3.549
Scrubber 0 $100/kw 63.750 P $50/kw 33.750
Steam Turbine Generator 28.675 28.675 28.675 21.560 11.700 11.700 Circulating Water System 5.505 5.144 5.101 3.840 2.906 2.906 Condensing & Feedwater System
20.517 18.979 18.819 14.347 6.071 6.071
Other Turbine Plant Equip. 5.419 4.861 4.743 4.256 3.132 3.132 Gas Turbine Equipment 9.608 50.068 50.068 Electric Plant Equipment 15.403 15.570 14.538 15.439 15.439 15.439 Miscellaneous Equipment 4.069 4.838 4.796 4.203 4.790 4.790 Instruments & Controls 5.270 4.532 4.495 4.299 4.159 4.159
TOTALS
189.638V)
207.71 5^) 139.568 1 57.796(d> 125.305(c ) 173.138^ 189.638(c)
177.715(b) I53.015(e) 121.499(d) 156.628^ 173.138(d)
(a) scrubber @ $100/kw
(b) scrubber @ $50/kw
(c) 3 stages
(d) 2 stages
(e) 1 stage
■60-

TABLE 2
Installed Equipment Costs for 300 MWe [in millions of dollars]
E <u
-o N
s- <D > f—
■— m 3 o a. o
o
IO
n>
-5 E 10 ro c <u O 4->
o +J
JQ e ■o « •r- <u «t CO
<u u o
•■-. >> 4-> CJ ID
X> "O IO <D
•r- C "O •■- IO -O C E O O Z (_> Ad
iaba
tic
Comb
ined Cy
cle
with
Cent
rifu
gal
FBC
Adia
bati
c Co
mbin
ed Cy
cle
With Conventional
FBC
Steam Generator & Combustor 17.597 13.362 13.450 8.173 5.701 5.071 Fans/Compressor 0.547 0.798 10.024
Particulate Removal
and
Piping
3 stage 7.300 29.963 29.963
2 stage 3.546 8.312 5.646 22.063 22.063
1 stage 1.469 5.541 14.113
Stack & Foundation 0.263 0.250 0.682 0.248 0.682 0.682
Air Heater 1.845 2.465
Coal Handling & Feeding 11.368 12.018 10.560 12.106 11.124 11.124
Ash S Dust Handling 1.502 1.965 1.948 0.819 1.850 1.850
Scrubber @ $100/kw 33.276 @ $50/kw 18.276
Steam Turbine Generator 16.542 16.542 16.542 14.490 6.356 6.356
Circulating Wat er Sj
edwa
/stem 2.813 2.681 2.659 2.002 1.515 1.515
Condensing & Fe Svst.pm
ter 10.578 9.893 9.739 7.435 3.165 3.165
Other Turbine Plant Equip. 2.825 2.535 2.473 2.220 1.663 1.663
Gas Turbine Equipment 4.318 25.034 25.034
Electric Plant Equipment 8.024 7.594 7.580 8.049 8.049 8.049
Miscellaneous Equipment 2.777 2.703 2.500 2.192 2.496 2.496
Instruments & Controls 3.410 3.625 3.596 3.439 3.328 3.328
TOTALS
100.896(c)
115.056^^ 79.985 89.970(d) 72.79lW 92.996(d) 100.896*C
100.056(b) 87.199(e> 71.1 37<d) 85.046(e) 92.996^
(a) scrubber @ $100/kw
(b) scrubber @ $50/kw
(c) 3 stages
(d) 2 stages
(e) 1 stage
■61

TABLE 3
Installed Equipment Costs for 30 MWe [in millions of dollars]
e Ol
-o ai N
S-
> I— •— to 3 O
o
+j a xi <o
■a e ro to C Ol O 4-> Z GO
o
+J to xi E to K3
■r- O) -a 4J
Ol
u u
4J <_?
xi x) IO Ol •r- C -o -r- IO XI c E o o Z (_3 Ad
iaba
tic
Combined Cycle
with
Centrifugal
FBC
Adia
bati
c Combined Cycle
With Conventional
FBC
Steam Generator & Combustor 2.021 1.431 1.400 .878 .600 .600
Fans/Compressor 0.062 0.068 1.416
Particulate Removal
and
Piping
3 stage 0.590 2.488 2.488
2 stage 0.349 0.716 0.483 1.894 1.894
1 stage 0.169 0.477 0.664
Stack & Foundation 0.030 0.027 0.078 0.029 0.078 0.078
Air Heater 0.211 0.283
Coal Handling & Feeding 0.960 0.989 0.869 0.996 0.915 0.915
Ash & Dust Hand!ing 0.172 0.430 0.430 0.430 0.366 0.366
Scrubber 100/kw 3.816 ;50/kw 2.316
Steam Turbine Generator 3.257 3.257 3.257 2.720 1 .398 1.398
Circulating Water System 0.322 0.308 0.305 0.230 0.174 0.174
Condensing & Feedwater System 1.215 1.136 1.242 0.945 0.364 0.364
Other Turbine Plant Equip. 0.325 0.291 0.283 0.254 0.188 0.188
Gas Turbine Equipment 0.167 2.662 2.662
Electric Plant Equipment 0.922 0.878 0.870 0.923 0.923 0.923
Miscellaneous Equipment 0.320 0.286 0.287 0.252 0.287 0.287
Instruments & Controls 0.392 0.416 0.413 0.395 0.382 0.382
TOTALS
10.825^
14.184(a) 10.041 11.566(d) 9.259(c) 10.23l(d) 10.825(c)
12.684(b) 11.327(e) 9.152(d) 9.001(e) 10.23l(d)
(a) scrubber @ $100/kw
(b) scrubber G> $50/kw
(c) 3 stages
(d) 2 stages
(e) 1 stage
-62-

\
TABLE 4
GROUND RULES FOR TOTAL ENERGY COST COMPARISON
Fixed Charge Rate 18%
Fuel Cost $8.04 x 10"4/MJ(85<fr/106BTU)
Operation & Maintenance 1.5 mills/kWh *
Construction Period 5 years
Escalation Rate 6.5%
Interest Rate 10.0%
Capacity Factor 65% and 25%
Sorbent Cost $11/Mg ($10/Ton)
Sulfur Content of Fuel 3.9%
Although construction period may vary with plant type, there
is not sufficient information to assume differences between
conventional units and the fluidized bed systems.
-63-

TABLE 5
Efficiency and Total Installed Cost Including Equipment, Land, Structures and Improvements
0) ai
0 0 >> >.«J 0 0 0 ca
ca u_ E TJ u. ■a <o at 0)i—
C r— c <a r— E •r- « •r- c
' """■ to tj a> JD en J3 0 <u r— E 3 E -r- (_> u ■u u o 0 1- O 4-> •r— <•> •r- >> O T- O C *—"** +J <J U <D •O u m U -t-> >» J3 •i— J3 "O ■r- C
'f~ IO ■M ■a ai 4-> 0) ■M O •r— IO •r- C IO O -o -Q -a -r- _a
«0 > «J <o m -Q <a -<= •a -C r— C *»— c E •r- -4-> •™ -p
O -a o o -O -r- "O 1- z <c z o <£ * < X
600
209.l(°)
236.5(a) 159.1 177.3(d) 144.8(c) 192.6(d) 209.1^c)
206.5(b) 172.5<e> 141.o(d) 176.l(e) 192.6(d)
300
lll.l(c)
130.l(a) 90.1 100.i(d) 83.o(c) 103.l(d) lll.l(c)
115.1(b) 97.4(e) 81.3(d) 95.2(e) 103.l(d)
30
12.0(c)
i5.g(a) 11.2 12.7(d) 10.4(c) 11.4(d) 12.0(c)
14.4(b) 12.5(e) 10.3(d) 10.2(e) 11.4(d)
n 36% 36% 25% 39% 39% 39%
(a) scrubber P $100/kw
(b) scrubber @ $50/kw
(c) 3 stages
The numbers above include:
Additions for land and land rights
Additions for structures and improvements
(d) 2 stages
(3) 1 stage
Pulverized Coal
$2.02/kw
$46.00/kw
Fluid Bed
$1.69/kw
$30.80/kw
-64-

TABLE 6
MATERIALS LIST FOR LABORATORY SCALE MODEL
Part Description
a Plexiglass sheet - 12.7 mm thickness (1/2 inch)
b Perforated aluminum sheet American No. 8 Gauge 3.26 mm (.1285 inch)
c Aluminum sheet American No. 2 Gauge 6.54 mm (.2576 inch)
f Aluminum tubing Birmingham No. 11 Gauge 3.05 mm (.120 inch) 101.6 mm (4 inch) I.D.
g Aluminum tubing Birmingham No. 11 Gauge 3.05 mm (.120 inch) 76.2 mm (3 inch) I.D.
h,i Aluminum sheet American No. 2 Gauge 3.26 mm (.1285 inch)
j Plexiglass tubing 12.7 mm wall thickness (1/2 inch) 152.4 mm (6 inch) O.D.
k,Z Plexiglass sheet 12.7 mm thickness (1/2 inch)
m Plexiglass sheet 25.4 mm (1 inch) thickness
n Plexiglass tubing 12.7 mm wall thickness (1/2 inch) 152.4 mm (6 inch) O.D.
o Plexiglass sheet 12.7 mm thickness (1/2 inch)
p Plexiglass sheet 25.4 mm (1 inch) thickness
q Plexiglass tubing 12.7 mm wall thickness (1/2 inch)
r Plexiglass sheet 12.7 mm thickness (1/2 inch)
s Aluminum standard flanged elbow 38.1 mm Oh inch) O.D. schedule 80
t Aluminum threaded flange 38.1 mm (1% inch) O.D. schedule 80
■65-

TABLE 6 (continued)
MATERIALS LIST FOR LABORATORY SCALE MODEL
Part Description
u Aluminum pipe 38.1 mm (1% inch) O.D. schedule 80
v Wiper seal
w Aluminum pipe 50.8 mm (2 inch) O.D. schedule 80
x Angle steel 76.2 mm x 76.2 mm x 6.35 mm (3 inch x 3 inch x h inch)
y Plywood sheet 19.05 mm (3/4 inch) thickness
z Steel bar stock 25.4 mm x 25.4 mm (1 inch x 1 inch)
-66-

Cnnl and limestone
Air
Porous Wall
V- Hot Gases
Plenum Vessel
Fluldized Bed
Bearing Seals
Drive Shaft
Figure 1 Sketch of Centrifugal Combustor
-67-

UJ
E
C
c o
-68-

o w H-a:
UJ h-J <o a. 3to <o 12 Xh UJ <
UJ
— —Jill 3 O ■£
<oo Q.UUJ
E 4->
"O OJ c
i o o
■a <:
3
-69-
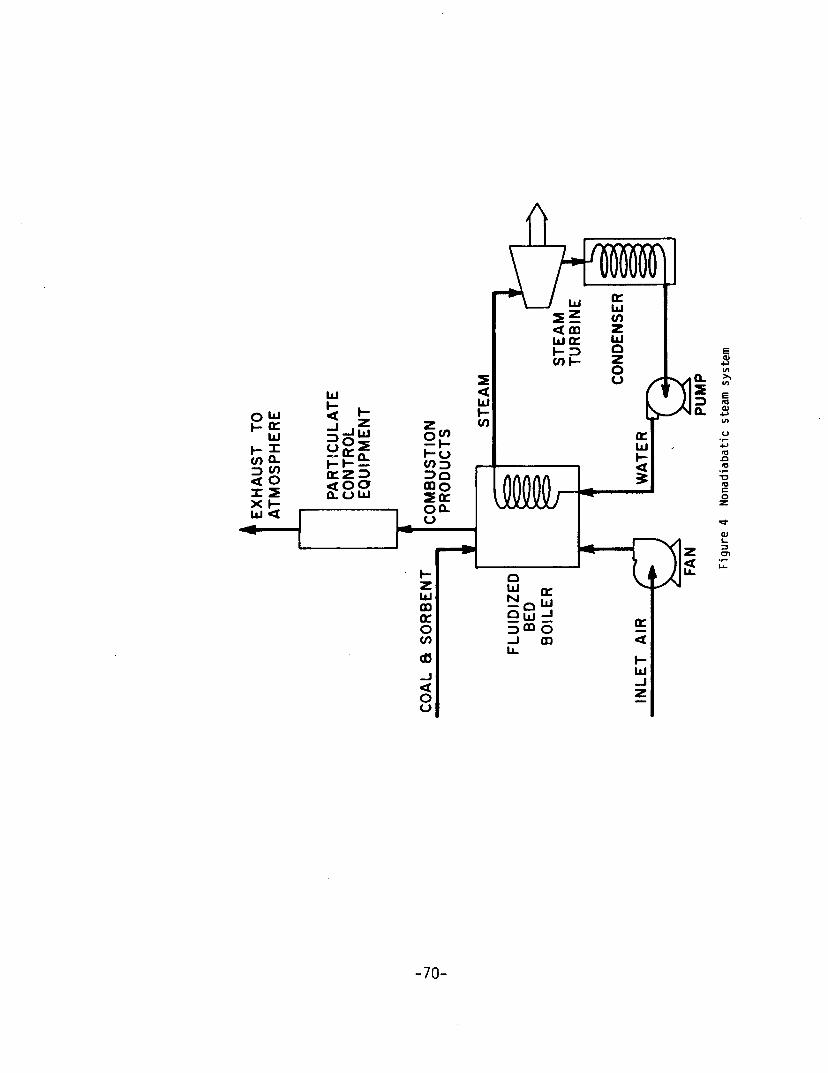
a >> vt
E 10 01
-o c o
i- 3
<* c
■70-

LU
< UJ m IEZ3 < o o
Q.UUJ
E
10
■a
01
-71

r- • •» z *-*- m < «- - ^ r- QL 0. .
z <J<]0- •» •> m
o Q_ 1— 1— o
UJ _J ffi < or ^< < >
UJ > or — CM ro Zi o
o o o
o in
. .«■>
o — o o 0) • E
o - -O *"" . .
- -in CO
< 0T
O O 00
O
O O
o CM
CC
en en ui or o.
- -m
o m
o o ro
o a. o * in *- CM Q.
0_ o o CVJ O
o m
o o
or cn en UJ or o.
UJ h- cn >- cn
O m
J-o
o 00
o co
o 0
2 .-• ul or
Si! 5 or UJ o_
o 2 o w
o CO
cn <
X UJ
c Ol
u •r— <4-
U
c
E o
■a <
ai t-
o co
m o in ro O
ro
{%) A0N3I3UJ3
-72-

Z I-■ I-' „°- < o:a:^<5 c/> <] <1 a." a." z . - - - O 0. I- I- r- O
2 r- 0_ CD <
CC < >
a. <T
UJ > CC
o — c\J rO sj-
<*• ro
O O O
o m en -l-«n
o o CO —
UJ occ lO 3 CO h-
< o: UJ a.
§s CO h
o m
j-o
o o
o CM
E o
CC
(/) co UJ CC a.
in
+ o
o m CVJ
+8 o o f\J o a.
a." o cc a
o1" — cc CO en UJ cc
m _
CO >- CO
+o
O ^. CD O "~ o
?- — CC
3 r-
UJ
o UJ CO
c aj
o >i o
■D <U
E o
(0
■a
o co
o m ro
O ro
(%) A3N3IOUi3
•73-

o o o
o If)
o _ s °
00 £ < or UJ a.
O 2 O UJ 00 H
O in
o o r-
CM
o
o o IO
o o Q- if) ■* CM »—
a.
or
O « - -if) CO
UJ cr a.
2 »- O CO — >-
CO
o If)
J-o
o 00
o CD
UJ or
o => CM I- — <
or UJ a.
o 2 o UJ - i-
co <
oo
U
<o
IO -O
T3
0} s-
X UJ
o co
o
m ro
O ro
if) O CVJ
if)
(%) A0N3I3UJ3
-74-
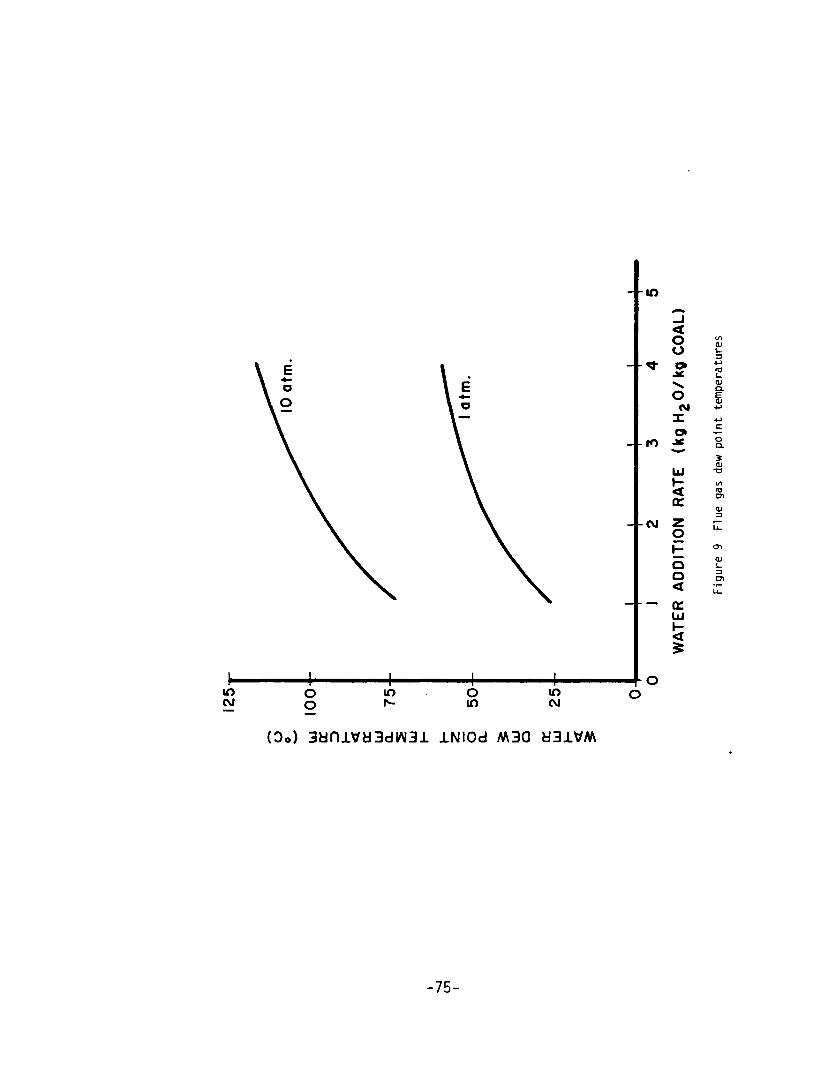
in
+ *
-l-ro
cvi
< -+- a:
< 5
< o flj o 1_
•<* ai
o E CM +J
X +J c o»
JC o a. 5 <D
UJ T3
K l/l
< cc <D 3 z o Lu
h- <Ti
o S-
IO CM
O O
«T> o 10
IT) CVJ
(Do) 3dniVy3dlM3± INIOd M3Q H31VM
■75-

- -in *-■% c _l o
< +J
o T3 o ■a
to
* 2 "v (O o 2
(M -C
X 4->
'5 o>
JC >> to — c
ai
UJ u 1- <+- < a» <r
<D »—
- 1 u >>
i- o o
r—
o 0)
< 3
— a: Ll_
UJ i- < 5
(%) A0N3I0IJJ3
■76-

- •*■
- -IO
- -CJ
^^ -o -I TD
< IO
o o ■!->
IO o» 3 J* x: ^ ■!->
o 5 CM a)
X o» s-
JC S o
>»- Ui
i »- < 3
tc O > z <o O Dl
y- <U 3
o U-
Q < ^ OC UJ
<
o o IO o
m IT)
— o o o
-T-O O
31VU MO"ld 0ldl3lMmOA SV9 3md 3AI±VT3a
-77-
UJ u. Ul z o \- en UJ
<
UJ I- < 2
_| Q UJ UJ u.
o m 2 W < Ui z
-i s e < E £ E <o O v co s UJ
QIJI QIO J UJ ro ^ in x >■ UI ii x. — o. I- o. . 2lT3 COITJ Z)
o 1/1
o C O o +J
t -O
L. 4-> (/> TJ
0) N o «—» ••-
o E in
o 5. 0) 0)
4-
0. Ol •0 X
„ E UJ XI
o N c (TJ
o o
CO 01 c 0
CVI UJ i/> _1
O 1 h- r—
cc 2 < n
o Q. 0 CO
o o CM
01
dP NVH1 SS3H NOIlOVdd 1H9I3M
■78-

o o o <0
o o o m
c «■-* 0
o £ •p-
o o 3. 3
<c a. 1/1 ■0
■O
Ul 0)
N in
</> ■O o <u o Ul 4-
o _J 0 to O a.
0
H T3 OC C
< A3
0. ac
o o o z < UJ 2
=3 en
o o o
dP NVH1 SS31 NOI10VHJ 1H9I3M
■79-
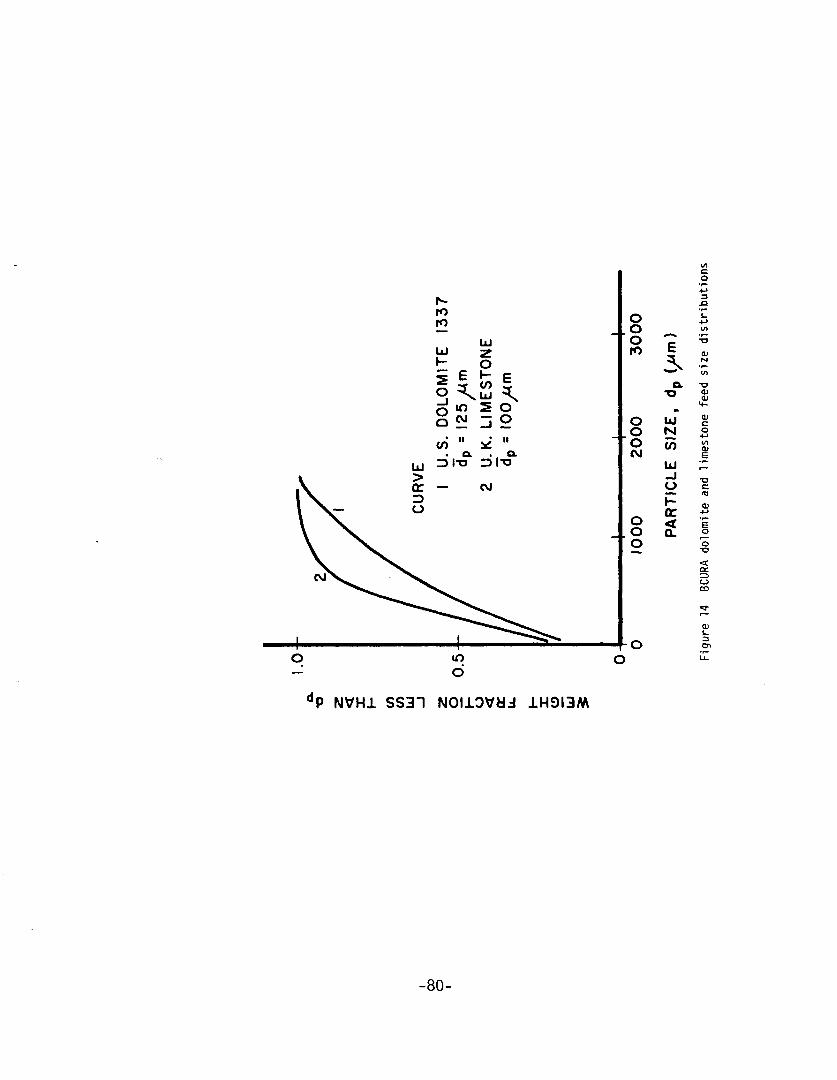
^ to to
UJ w z •- o
QW:2
en " * " . Q. . . Q.
UJ 3 IT3 13 |T3
>
=J .O
o s- o en
o "E ■5
to aj s tM
l/l
o. ■a •o a>
<+- m
o UJ 01 c o N o 4J
o (O GO
CM E UJ ^ _l o •a c
IO
1- 0J QC +J
o < E o Q. o
o ^ ■a
a: o
3 en
dP NVH± SS3T NOIiOVUd 1H9I3M
-80-

UJ c o
o CO _l Z) UJ oo z oo o
i- LJ ' (/> UJ O Q UJ 1- UJ UJ 2
IOCH
D
RI
EEN
-i 0)
2 a: oc in >- -o IO 1- < w
UJ > cc — CJ 3 o
o o o ro
o o ■o
CM
o o o
E
o. •a
UJ N in
< a.
3
0)
>-> S_ O
+-> ra i- o .a
<0 c o
c o 01 i-
o"
dP NVH1 SS3T NOIlOVdi ±H9I3M
■81

RADIAL ACCELERATION AT BED INNER RADIUS
o
CO <
DC
<
10" 10*
PARTICLE SIZE, dp (^m)
Figure 16 Air mass flow rate at terminal velocity
-82-
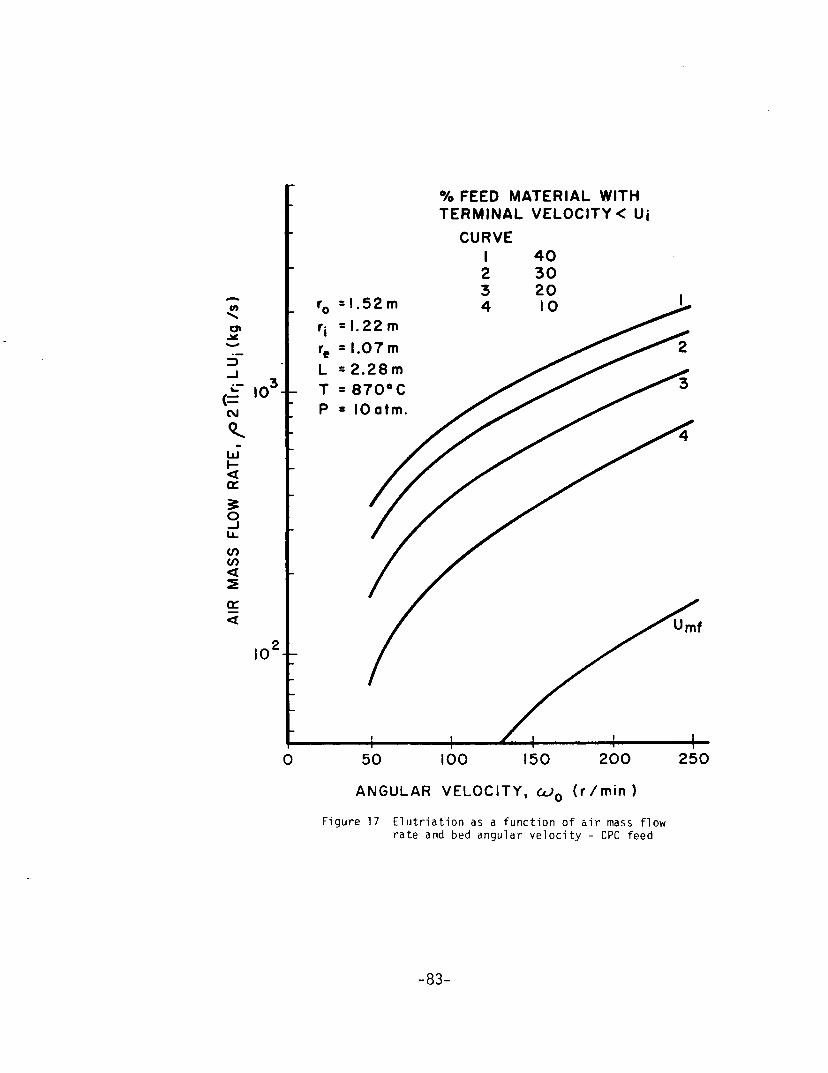
% FEED MATERIAL WITH TERMINAL VELOCITY < Uj
ANGULAR VELOCITY, OJQ (r/min)
Figure 17 Elutriation as a function of air mass flow rate and bed angular velocity - CPC feed
-83-

I04r
CO
<
Q
to
<
a: <
10*
I04
= l.52m
= 1.22 m = 1.07
L T P
mf
% FEED MATERIAL WITH TERMINAL VELOCITY < Ui
CURVE I 2 3 4
100 40 10 0
50 100 150 +
200 250
ANGULAR VELOCITY, CU0 (r/min) Figure 18 Elutriation as a function of air mass flow
rate and bed angular velocity - PER feed
-84-

■a
2 in •r- >. ♦J o 3
N "tti -o Si
14-
o 0) CT> (0 „^ (0
2 c a) o <U a.
o Q x: m Ul
< c ac o
i- 4->
o 3 •O
*r UJ > Q aj UJ 4->
o UJ u li- <o
fO lt.
•a
O 01
L)
h- 4->
o z CM UJ a.
o c ac 10
UJ £ a. o CT>
ai s-
f-o
(UJ^) dp *U3±3WVia 310l±UVd NV3W
-85-

IOV
o> A*
UJ
<
O
en en <
cr <
CURVE A B C D E
CPC MEAN PARTICLE DIAMETER PER MEAN PARTICLE DIAMETER OPERATION WITH CPC SORBENT OPERATION WITH PER SORBENT MINIMUM FLUIDIZATION
10* 10*
MEAN PARTICLE SIZE, dp (/xm)
Figure 20 Operating conditions for CPC and PER feed
-86-

io'4-
o CL
OL O CC Q
Ul a: </) CO UJ C Q.
\0K
FREEBOARD
.-I
Urnf
r0 = l.52m
r; =l.22m re = 1.07 m L =2.28m T =870°C P = 10 atm.
% OF FEED ELUTRIATED
40 0
50 100 150 200
ANGULAR VELOCITY, CJQ (r/min) Figure 21 Combustor pressure drop - CPC feed
250
■87-

10 -
o a.
OL o cr a
a:
tn
a.
10- -
10°-?
r0 = 1.52 m
' 1.22 m re « 1.07m L ■ 2.28 m T «870°C P = 10 atm.
50 100 150 200
ANGULAR VELOCITY, CO0 (r/min)
Figure 22 Combustor pressure drop - PER feed
250
-88-

lO'J-
in v. E
>■
u o
% OF FEED ELUTRIATED
40 0 0
r0 = 1. 5 2 m
rj =l.22m re = 1.07 m
L =2.28m T =870°C P = 10 atm
10" + 4- 50 100 150 200
ANGULAR VELOCITY, CJ0 (r/min)
Figure 23 Exit gas velocity - CPC feed
250
-89-

10 -
t o o 10 -
CURVE
I 2 3
%0F FEED ELUTRIATED
40 10 0
L T P
= 1.52m
= l.22m
= l.07m = 2.28m =870°C = 10 atm
I0V + + 50 100 150 200
ANGULAR VELOCITY, cU0 (r/min)
Figure 24 Exit gas velocity - PER feed
250
■90-

10'--
M
E
I l0°- O _l Ui >
10 -I
m
m
m
m C
m
% OF FEED ELUTRIATED
40 0
ANGULAR VELOCITY, cu0 (r/min) Figure 25 Radial air velocity - CPC feed
■91

I0C -
CO
E
>-
U o _i UJ >
10 -
r0 = 1.52 m r\ *l.22m re =l.07m L = 2.28 m T =870°C P = 10 aim
Umf
I0V
CURVE
I 2 3
%0F FEED ELUTRIATED
40 10 0
50 100 150 200
ANGULAR VELOCITY, cu0 (r/min)
Figure 26 Radial air velocity - PER feed
250
-92-

10 V
10" -
o OL
OL
< a." o at a o
10 UJ oe V) en ui or o. o UJ ao
10' -
I01
BA
CURVE
A B C
BED THICKNESS :
0.457 m 0.305 m 0.152 m
x*Vf
- ^^^"^
" yr ^^"^^^ -
/ 1
/ / /AP -
A// / : B/ / : c'
T=870°C P= 10 atm. "
r0 = 1.52 m L =2.28m ;
I- 1 A 1
-I0V
-10
UJ
UJ u ui Q
<
-10
10 50 100
ANGULAR Figure 27
150 200 250
VELOCITY, UJ0 (r/min) Bed thickness effects of bed pressure drop and gas residence time - CPC feed
-93-

o
a. o or
-rlO'
Q m*.- ui tc z> to tO UJ cc a.
o UJ m
-10^
ut
UJ
-I UJ lO1 u
z UJ Q to UJ CE
to '< o
10
^3
50 100 150 200
ANGULAR VELOCITY, CJ0 (r/min)
Figure 28 Bed thickness effects on bed pressure drop and gas residence time - PER feed
250
-94-

10
0>
UJ !Z
u < _l £ < o o
cc _| UJ
o 10 -
10
-
ROTATIONAL POWER -\
,3. V 1 :r ^2
^X* ̂ ^^^
. 3
2- ~ ' s /
' ^CAPACITY 7
r0 = 1.52 m
1. rj = 1.22 m re = 1.07 m
L =2.28m
/ CURVE % OF FEED ELUTRIATED
T =870°C P = lOatm
1 2 3
40 10 0
0 1 1 A 1 1 1
10' -
50 100 150 200
ANGULAR VELOCITY, co0 (r/min)
Figure 30 Combustor capacity and rotational power requirements - PER feed
250
•95-

It 5
>-
UJ
LU
IOV
to2-
o tr.
10 - -
10 -I
%0F FEED ELUTRIATED
40 0
T =870°C P = lOatm
L/ro=l.5 ar (rj)= 490 m/s"
+ 0.5 1.0 1.5 2.0 2.5
C0MBUST0R RADIUS, r0 (m)
Figure 31 Influence of combustor size on capacity - CPC feed
-96-
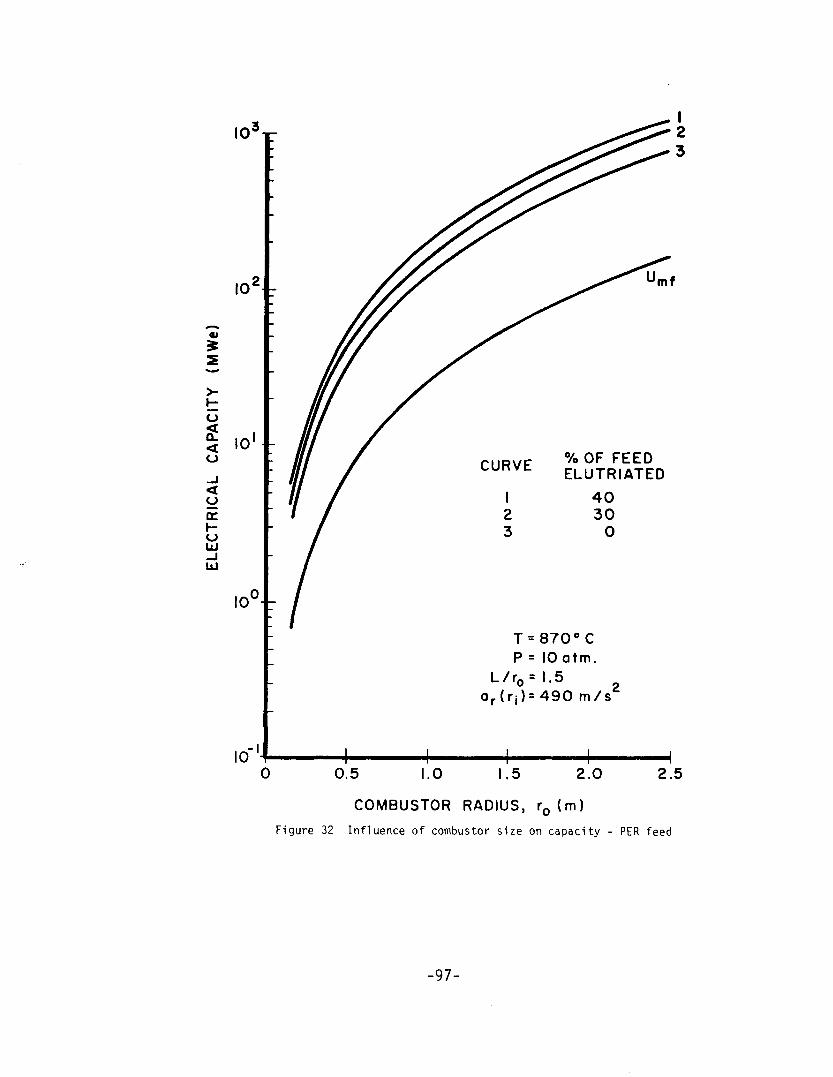
IOV
10'
2
>- t-
% I01
< o
u UJ
I0W-
10 -f
% OF FEED ELUTRIATED
40 30
0
T P
L/r„
870° C 10 atm. 1.5
0.5
ar(rj)= 490 m/s
+ 1.0 .5 2.0 2.5
COMBUSTOR RADIUS, r0 {m)
Figure 32 Influence of combustor size on capacity - PER feed
-97-

Q. O _l V)
IO o
o (O Q.
c <1)
>- to o c
■4-> C\J
o < O r—
0. r— r~-
< •M CM
o n.
1- o o
z 4-> £ C 01
M < ft} o.
O -1 "a. ai a. x:
S- ■!-> ai S s- o o D. 4-
n m ai I-
O oo O
N —
($) 1S0D lNVHd
-98-

+ 50
40-
30- ui o UI tc UJ u. £ 20-
V) O O 10 -
0 -
0 100 200 300 400 500 600
PLANT CAPACITY, M We
Figure 34 Percentage equipment cost difference - adiabatic combined cycle over nonadiabatic combined cycle
-99-

Q oc O o
u a: IE o UJ Q. o
u.
UJ K I-
SE < or ~ l- _J o
< UJ . u. u d z
1- o o
UJ z z
UJ <s> o a. a:
Ul
n.
1-
Ul P
UTE
M
EN
T
3 Z 5 £< o a. OQ. o O
< m
UJ o > cc UJ
ui o <
c o
CVJ O f
O ffi — 3
or
2-S-
OJ s_
T3 C
O)
CO
<0
IO
z o o u. o o
z z o UJ ffi
o or
s- o
CVJ X
- O
O CVJ
to CVJ 00
( 1SO0 "IVIOI JO %) lN3WAVd JO 3anilN9VW
-100-

— CM l^^t lO
O >- o
UJ _l o >- o Q UJ z
Q 2m UJ <5= .2= UJS 5 _l _ i_ O
g<co £0
|_ < "- < Q O
>- ^^^ zz w Q3QOO
< CL< ZZ
U> > cr O
— cvj 10 <<i- in
o o
<
< > UJ
< a: z o
< -I < o (/) UJ
01
m s-
c o
10 o
>i 01 s_ o> e
o
o u
o
0J i-
01
(MMM/S|||UJ) A9U3N3 dO 1S00
-101-

— CJIO ^- IO
c o
o o
s SJ O)
4- O
O u
o
01 oo
(MMH/SIMUJ) A9H3N3 JO 1S00
■102-

CM ro *■ 10
UJ
o in ?: _l o
Q^n UJ<5
•5-1 -J-Q
TEA
I C
OA
O
MB
IC
S
IC
C
to _ 0|_ H p, ,.<<
2 UJ H to > lA
BA
LV
ER
lAB
A
NA
DI
NA
DI
CO Q 3 QO O < Q. < Z Z
UJ > CE — CM fO ^J" in 3 O
o m
o
re s-
CM CM
d)
L. to
u
■o ^•^ ai
£ X
O M-
CM O Ul 4J
H- >, < S_ cc <u
c
UJ <«- 00 o o ■~" a: 4->
< l/l
i U o
o a >, Ul +J
CO X >
rl-
li- ■4->
c ai
CO
co ro
CM
(HAM/smui) A9H3N3 10 1SO0
■103-

— evjro* m
<u 3 >*-
*—* O
«£ ■!->
>> CT I.
Z HI
o <D
1- <♦-
< +-> Q: O
< O
> <+- O
H >> Crt +J
o > o +J
• r-
_i c Ul Ol
3 U- CT>
m 01 S-
(MMH/S||!Ui) A9H3N3 JO 1SO0
•104-

rocj m
X m o
u *->
H- ai CO J3
o o o »/)
X o «■ 1- 4->
z >> u t_ m 01
e
oc ai
X O CO
4- o
IO L_ 4->
o
o u
CO o
UJ >> _l +J
X Q. > CM 1- +->
_l en
3 S
o "3"
■f-o
(MM^I /sinuj) A9H3N3 dO 1SO0
•105-

C\J ^ fO W
n^s \ \ CNJ — ro m
o o
o CO
vc o
>-
<
o CM
u IT3
u
>1
1-
c 0)
o
o >>
o GO
O to
O o CM
o
(MMM /SIMUU) A9U3N3 JO 1S00
-106-

1- o
IT)
2 * Q.
o
Q. 3 < "-
c Ol
o o
(MMM/SII!^) A9U3N3 JO 1SO0
■107-

o o CO
l- o
o a.
o o
> 4- O
y- c o o
< •!-> Q. < 3
o C_> (O
o VI
CM en S- 0) c aj
4- o
(MMM/SIIIUJ) A983N3 JO 1SO0
-108-

10 .0
V)
n
o —i
10
PARTICLE DIAMETER 4.77 XIO^M 6.34XI04M 4.95 X I04 M
0 100 200 ANGULAR
300 VELOCITY
4 00 (R/MIN)
500
Figure 44 Laboratory scale modeT air flow rates at minimum fluidization conditions
■109-

10'
^
o
Q
O (/I
io2^
PARTICLE DIAMETER 4.77 X lO1^ 6.34 X I04M 4.95 X I04M
0 100 200 300 4 00 500
ANGULAR VELOCITY (fc/MIN)
Figure 45 Solids flow for laboratory scale model
■110-

fi
-Ct
^
L
it
Figure 46 Schematic of laboratory rotating fluidized bed apparatus
-111

25.+ ft
50' fry P.)
3I7..T
70 4.8
IS2.+
"W1r
223.6
SECT. /*-*
Figure 47' Detail of rotating chamber
-112-

S4-.6
70 4.3
r \i.i3
101.6
'.
T— 5" O.B
ns
| SECT. &&
Figure 48 Detail of solids removal pan
-113-

r IS.I
L
r :b"
i i
i *-i:
-14.4 'I ! ,!
lotfi.g
I h
! !
! I-
Figure 49 Mounting table
■114-
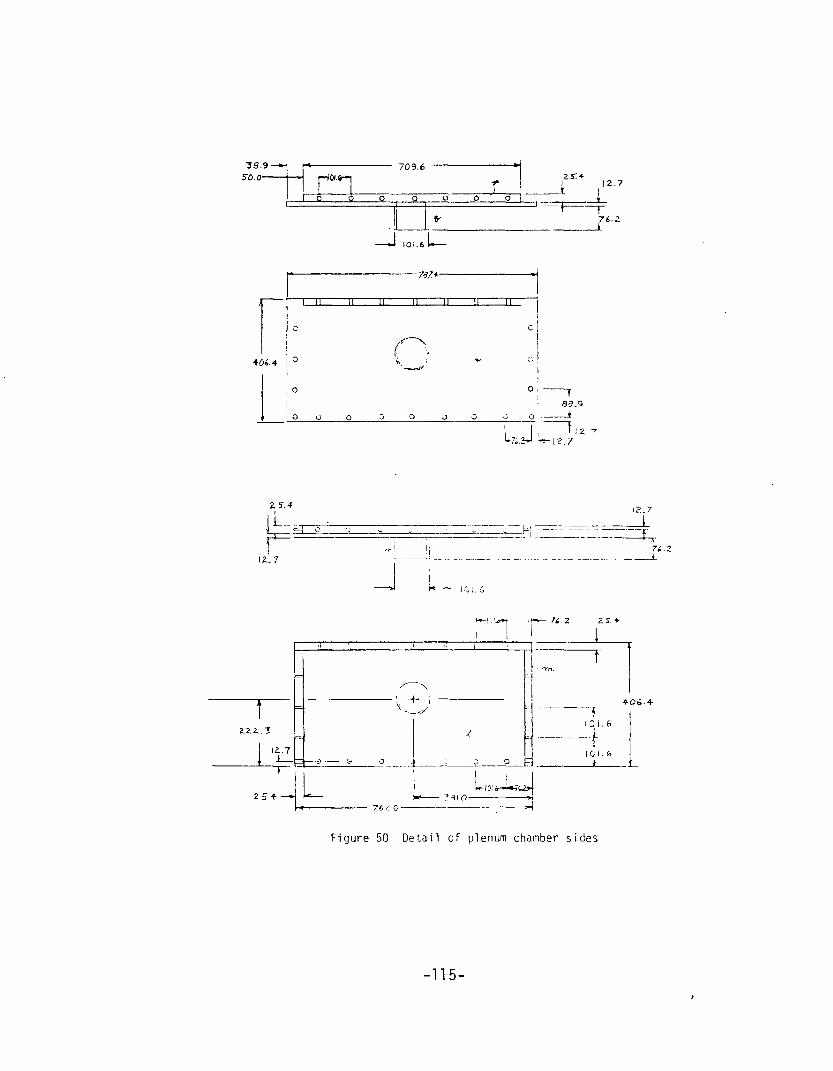
39.9- 50.0—
709.6
rn r_ 10 O O Q O O O
12.7
=F=T 76-2
J 101.6 I"
*0i.4
-767.*-
II II II II " 11-
c
o o g 3 o j o
T S3.9
o' i
Wi-J*1 -=-12.7
2.5.4
s=e; ^
12.7
101.6
Z.Z2..3
12..7
2 5 +•
K-I;I^H ■:*-»— 7<,2 as:*- r i i L_
•■3 h O
-+- ;
7
1 iqi.6
4-06.+
-I 101-6
L ! J
Figure 50 Detail of plenum chamber sides
■115-

»ae>k \O\A*
737+- -393.7-
— 15.+
A *-- JO'TYP)
o- ■■+."7'""-- 177.9 o- o
V.
—T" 83.9
101.6 L
3 93.:
Jl 737*
0 o j
0 -t i
o !
o 0 0 o o o o 1 1
Figure 51 Detail of plenum chamber top
■116-

p
381.0
c*
+1.3
J
15+0
r
Figure 53 Solids feeding apparatus
■117-

REFERENCES
1. Archer, D. H. et al_., Evaluation of the Fluidized Bed Combus- tion Process, Vol. I-III, Pittsburgh: Westinghouse Research Laboratories, November 1971.
2. Keairns, D. C, et aj_., Evaluation of the Fluidized Bed Combus- tion Process, Vol. I-II, Pittsburgh: Westinghouse Research Laboratories, December 1973.
3. Keairns, D. C, Archer, D. H., et al_., "Fluidized Bed Combus- tion Process Evaluation, Phase III - Pressurized Fluidized Bed Coal Combustion Development", Pittsburgh: Westinghouse Research Laboratories, September 1975.
4. Combustion Power Company, "Interim Report No. 1 on Energy Con- version from Coal Utilizing CPU-400 Technology", Menlo Park, California: Combustion Power Company, September 1974.
5. Mesko, J. E., "Atmospheric Fluidized Bed Steam Generators for Electric Power Generation", Paper presented to the Pennsylvania Electric Association, Power Generation Committee, White Haven, Pennsylvania, May 8, 1975.
6. Dodge, C. E., "A Thermo-Fluid Analysis of a Rotating Fluidized Bed Combustor with Sulfur Removal", M.S. Thesis, Lehigh Univer- sity, 1976.
7. Edwards, John B., Combustion: The Formation and Emission of Trace Species, Ann Arbor, Michigan: Ann Arbor Science Pub- lishers, 1974.
8. Levy, A., Merryman, E. L., and Reid, W. T., "Mechanisms of Formation of Sulfur Oxides in Combustion", Environmental and Science Technology, Vol. 4, No. 8, August 1970, p. 653.
9. The General Electric Company, "Heat Rates for General Electric Steam Turbine-Generators...100,000 kW and Larger", Schenectady, New York: The General Electric Company, 1974.
10. Potter, P. J., Power Plant Theory and Design, 2nd ed., New York, New York: The Ronald Press Company, 1959.
11. Selvey, A. M. and Knowlton, P. H., "Theoretical Regenerative- Steam-Cycle Heat Rates", Transactions of the ASME, Vol. 66, August 1944.
12. Spencer, R. C, Cotton, K. C, and Cannon, C. N., "A Method for Predicting the Performance of Steam Turbine Generators...16,500 kW and larger", Schenectady, New York: The General Electric Company, 1974.
-118-

13. Kunii, D. and Levenspiel, 0., Fluidization Engineering, New York, New York: John Wiley & Sons, Inc., 1969.
14. Pope, Evans and Robbins, Inc., "Interim Report No. 1 on Multi- cell Fluidized-Bed Boiler Design, Construction and Test Program", Pope Evans and Robbins Inc., August 1974.
15. Westinghouse Electric Corporation, Gas Turbine Systems Division, "Price List - Domestic Utility Package Power Plants", Phila- delphia: Westinghouse Electric Corporation, April 1975.
16. Westinghouse Electric Corporation, Steam Turbine Division, "Price List - Steam Turbine Generator Units", Philadelphia: Westinghouse Electric Corporation, January 1975.
17. Correspondence: Mr. G. S. White, The Babcock & Wilcox Company, Power Generation Group, New York, New York, January 8, 1976.
18. Telephone Conversations, Fuller Company and Ducon Company, January 1975.
19. Whitman, Requardt and Associates, "The Handy-Whitman Index of Public Utility Construction Costs", Baltimore: Whitman, Requardt and Associates, July 1975.
20. Schweyer, H. E., Process Engineering Economics, New York, New York: McGraw Hill, 1955.
21. "Steam Electric Plant Construction Cost and Annual Production Expenses, Twenty Fifth Annual Supplement", Federal Power Commission Report, 1972.
22. Pennsylvania Power and Light Company, Allentown, Pennsylvania, Personal interview with James D. Hollyday, Project Engineer, April 16, 1976.
23. "Power Plant Capital Costs, Current Trends and Sensitivity to Economic Parameters", Washington, D.C.: United States Atomic Energy Commission, Division of Reactor Research and Development, October 1974.
24. "Comparative Evaluation of Phase I Results from the Energy Conversion Alternatives Study (ECAS)\ TMX-71855 NASA, 1976.
25. Jonakin, J., "Solving the SO2 Problem - Where We Stand with Applications and Costs", Coal Age, May 1975.
26. National Research Development Corporation, "Pressurized Fluid- ized Bed Combustion, R&D Report No. 85, Interim No. 1, London: National Research Development Corporation, Oct. 1974.
-119-

27. Vogel, G. J., et_ a]_., "Reduction of Atmospheric Pollution by the Application of Fluidized-Bed Combustion and Regeneration of Sulfur-Containing Additives", Argonne, 111.: Argonne National Laboratory, September 1974.
28. Anderson, R. T., "Simplify Power Plant Cost Calculations", Power 114, July 1970, p. 39.
29. Proceedings of the 15th Symposium, Engineering Aspects of Magnetohydrodynamics, Philadelphia: The General Electric Space Sciences Laboratory, May 24-26, 1976.
30. Davidson, J. F. and Harrison, D., ed., Fluidization, London: Academic Press, 1971.
31. The Babcock & Wilcox Company, Steam/Its Generation and Use, 38th ed., New York, New York: The Babcock & Wilcox Company, 1972.
-120-
VITA
Walter Jeffrey Shakespeare was born on November 23, 1951
in Harrisburg, Pennsylvania to Walter Samuel and Mildred Louise
Shakespeare. He entered Lehigh University in September, 1969
and received a Bachelor of Science in Mechanical Engineering
in May, 1973 with honors. Mr. Shakespeare was employed at the
Pennsylvania Power and Light Company from June of 1973 until
August 1975 when he returned to Lehigh to study for the Master
of Science.
■121