Embed Size (px)
Citation preview

Analysis of Metabolic NetworksStructure, Properties, Visualization
Alexander Ullrich
Chair for BioinformaticsUniversity of Leipzig
TBI-Winterseminar, Bled, February 14-21

Outline
• Simulation
• Motivation
• Visualization
• General network analysis
• Metabolic network analysis
• Outlook
2 / 31

Simulation
• Bag of ribozymes.
• Algebraic chemistry model.
• Exchange of molecules with the environment.
3 / 31
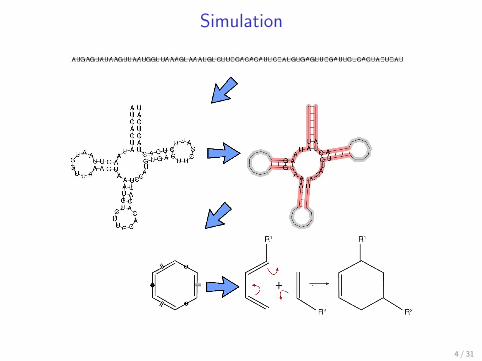
Simulation
4 / 31
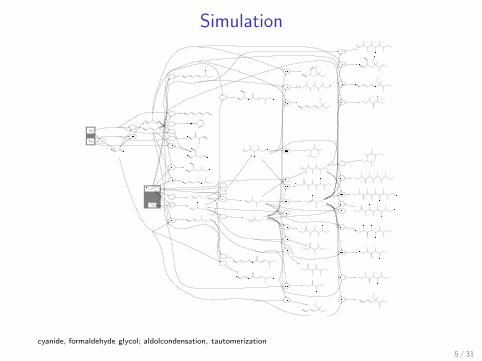
Simulation
cyanide, formaldehyde glycol; aldolcondensation, tautomerization
5 / 31

Simulation
Faulon, J-L, (2001) J Chem Inf Comput Sci 41:894-908
6 / 31
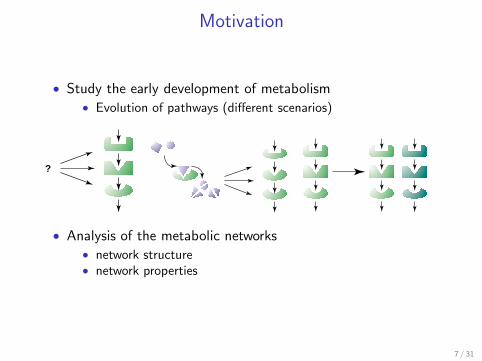
Motivation
• Study the early development of metabolism• Evolution of pathways (different scenarios)
?
• Analysis of the metabolic networks• network structure• network properties
7 / 31

Pathway Evolution
Retrograde Evolution
(b) Retro-evolution
End-product can be derived from more and more distantmetabolites
Example: glycolytic pathway, histidine biosynthesis
8 / 31

Pathway Evolution
Forward Evolution
more efficient extraction through deeper break-down of metabolitesExample: isoprene lipid pathway
9 / 31
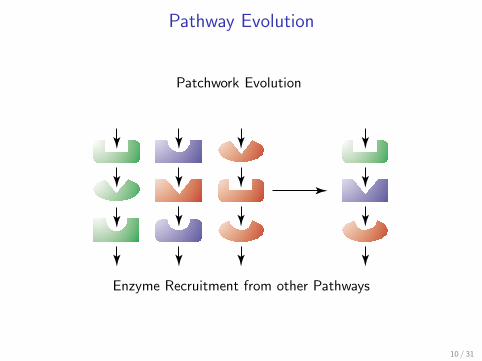
Pathway Evolution
Patchwork Evolution
Enzyme Recruitment from other Pathways
10 / 31

Pathway Evolution
Comparisonred = older, blue = younger
Retrograde Evolution
Forward Evolution
Patchwork Evolution
11 / 31

Visualization
• bidirectional, bipartite graph
• nodes: metabolites, enzymes/reactions
• edges: participation in the same reaction
• dot layout: flow of mass downwards in the graph (if possible)
12 / 31
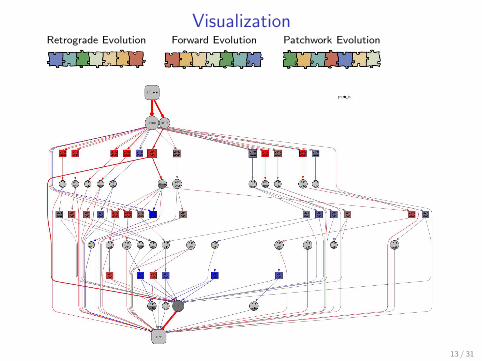
VisualizationRetrograde Evolution Forward Evolution Patchwork Evolution
13 / 31

Visualization
Flow Concentration
14 / 31

Visualization
Flow Concentration
15 / 31

Visualization
Flow Concentration
16 / 31
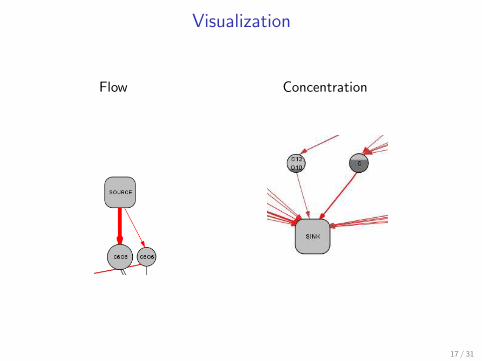
Visualization
Flow Concentration
17 / 31
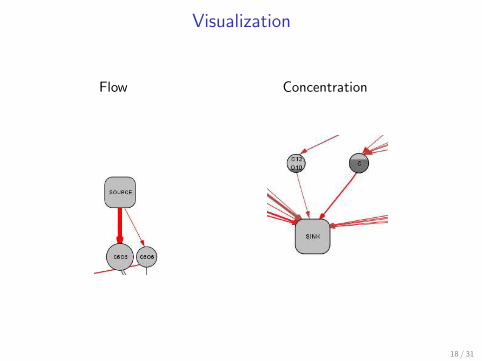
Visualization
Flow Concentration
18 / 31
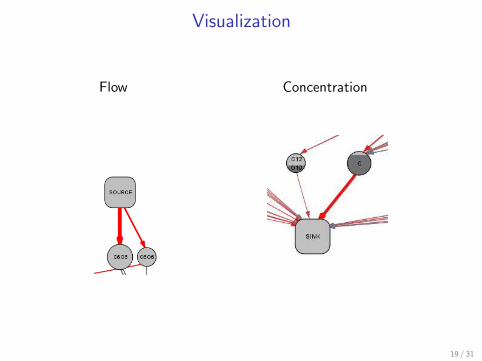
Visualization
Flow Concentration
19 / 31

Animation
20 / 31

General network analysis
• Connectivity Distribution• small vs big• early vs evolved
• Centrality, Entropy, ...• simulated vs real world
21 / 31

Connectivity Distribution
0
20
40
60
80
100
2 4 6 8 10 12
102030405060708090
100
22 / 31

Metabolic network analysis
We have sets of edges forming meaningful complex entities↓
pathways
• number of pathways → flexibilty
• change in case of single/multiple knockouts → robustness
• number of acceptable knockouts → robustness
23 / 31
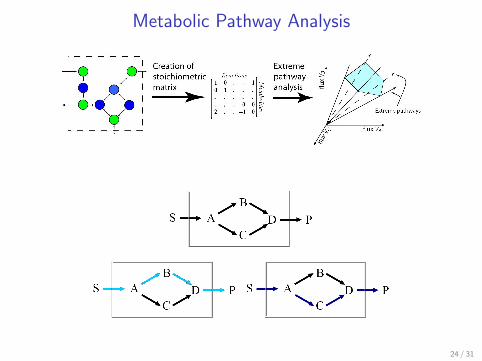
Metabolic Pathway Analysis
24 / 31
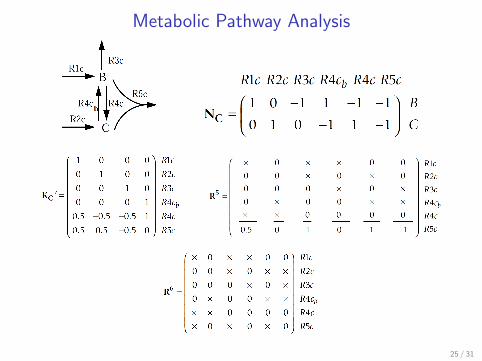
Metabolic Pathway Analysis
25 / 31

Acceptable Knockouts
Minimal Knockout sets
{S → A} {A → B, A → C} {A → C} is not a MKS {B → D, C → D}
26 / 31

Knockout set size distribution
0
0.05
0.1
0.15
0.2
0.25
0.3
0.35
0.4
0.45
2 4 6 8 10 12 14 16 18 20
2030405060708090
100
27 / 31

Knockout effects
single R1 =
∑r
i=1 z i
r ∗ zdepletion R2 =
∑n
i=1 R i1
n
multiple R3(k) =
∑s(k)i=1 z i
s(k) ∗ zoverall R3(≤ K ) =
K∑
k=1
R3(k)pk
28 / 31

RobustnessRobustness = 0.51 Robustness = 0.67
0
0.2
0.4
0.6
0.8
1
2 4 6 8 10 12 0
0.1
0.2
0.3
0.4
0.5
0.6
0.7
0.8
0.9
2 4 6 8 10 12
Robustness = 0.75 Robustness = 0.81
0
0.1
0.2
0.3
0.4
0.5
0.6
0.7
0.8
2 4 6 8 10 12 0
0.1
0.2
0.3
0.4
0.5
0.6
2 4 6 8 10 12
29 / 31
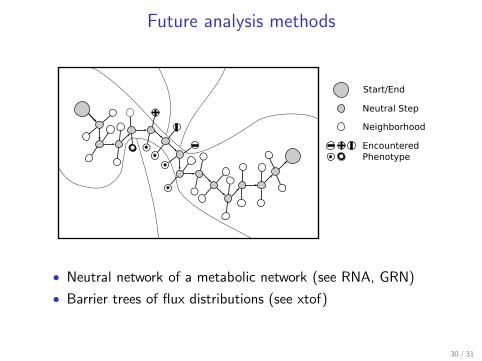
Future analysis methods
• Neutral network of a metabolic network (see RNA, GRN)
• Barrier trees of flux distributions (see xtof)
30 / 31

Acknowledgements
Christoph Flamm
Peter Stadler
Konstantin Klemm
Martin Mann
Markus Rohrschneider
31 / 31


![Metabolic Networks [Flux Balance Analysis]users.isy.liu.se/en/rt/claal20/SysBio2015/Notes_SysBio_2015_partE.… · 5 Metabolic Networks [Flux Balance Analysis] In this Chapter we](https://img.dokumen.tips/doc/110x75/5eba3bff36cf861e3c1ac9a1/metabolic-networks-flux-balance-analysisusersisyliuseenrtclaal20sysbio2015notessysbio2015parte.jpg)