Embed Size (px)
Citation preview

Advanced Review
Genome-scale metabolic networksMarco Terzer1 Nathaniel D. Maynard2 Markus W. Covert2 and JorgStelling1∗
During the last decade, models have been developed to characterize cellularmetabolism at the level of an entire metabolic network. The main conceptthat underlies whole-network metabolic modeling is the identification andmathematical definition of constraints. Here, we review large-scale metabolicnetwork modeling, in particular, stoichiometric- and constraint-based approaches.Although many such models have been reconstructed, few networks have beenextensively validated and tested experimentally, and we focus on these. Wedescribe how metabolic networks can be represented using stoichiometric matricesand well-defined constraints on metabolic fluxes. We then discuss relativelysuccessful approaches, including flux balance analysis (FBA), pathway analysis,and common extensions or modifications to these approaches. Finally, we describetechniques for integrating these approaches with models of other biologicalprocesses. 2009 John Wiley & Sons, Inc. WIREs Syst Biol Med
LARGE-SCALE NETWORK ANALYSIS
Metabolic networks are well-enough character-ized that it is now possible to construct and
analyze mathematical models of their behavior ata whole-genome level.1,2 This is not due to rich,extensive datasets—in fact, the existing data are farfrom comprehensive.3 Even in the best-understoodorganisms, the majority of kinetic parameters remainundetermined. Instead, whole-network modeling ofmetabolism has largely been enabled by the develop-ment of new computational methods that are able tomake compelling and testable predictions even with-out many parameters. As a result, metabolic modelinghas become a bellwether, leading the way toward afundamental goal in biology: a computational modelof an entire cell.
The main concept that underlies whole-networkmetabolic modeling is the identification and math-ematical definition of constraints. These constraintsthen separate feasible and infeasible metabolic behav-iors. Importantly, the constraints are often much easierto identify than kinetic parameters, making large-scalemodel building possible.
∗Correspondence to: [email protected] of Biosystems Science and Engineering, ETH Zurich,Switzerland2Department of Bioengineering, Stanford University, Stanford, CA,USA
DOI: 10.1002/wsbm.037
Most analysis techniques in this area employup to three types of constraints.1 Physico-chemicalconstraints are defined by conservation laws formass and energy, dependency of reaction rates onmetabolite concentrations, and negative free energychange for spontaneous reactions. Environmentalconstraints are imposed as a result of specificconditions, such as the availability of nutrientsor electron acceptors. Finally, the effects of geneexpression may result in regulatory constraints asthe cell adapts to environmental changes.
Here, we review large-scale metabolic net-work modeling, focusing on stoichiometric- andconstraint-based approaches. After discussing howthese approaches work, we will highlight commonand relatively successful approaches as well as exist-ing models. Finally, we will comment on the possibilityof integrating these models with models of other bio-logical processes, such as transcriptional regulationand signal transduction, as another step toward truewhole-cell modeling.
MODEL DEVELOPMENT
The Stoichiometric MatrixAlthough there are a variety of metabolic model-ing approaches, all of them share a fundamentalrequirement: a stoichiometric matrix based on areconstructed metabolic network. Each column of thestoichiometric matrix corresponds to a chemical or
2009 John Wiley & Sons, Inc.

Advanced Review www.wiley.com/wires/sysbio
b1 b2
b3
v1
v2 v3
d A
d t
d B
d t
d C
d t
–1 0 1 0 0–1
0 –1 01
0 –1 0 0 –11
01
v1
v2
v3
b1
b2
b3
maximize b2
Subject to:
Objective:
Steady-stateReaction stoichiometry
pHKinetic
Thermodynamic
0 = S·v
dAdt
dBdt
dC
dt
Material Balances
= –v1 –v2 + b1
= v2 –v3 – b3
= v1 + v3 – b2
(c)
A B
C
(d)(b)
(a)
– ∞ ≤ v1 ≤∞∞ ≤ v2 ≤∞∞ ≤ v3 ≤∞
0 ≤ b1 ≤100 ≤ b2 ≤100 ≤ b3 ≤ ∞
=
FIGURE 1 | (a) A small reaction network consisting of three metabolites (A, B, and C), three transport reactions, and three enzymatic reactions isconstructed. vi indicates the flux through reaction i and bj represents the flux through transport protein j. (b) Material balance equations are shownfor each metabolite. (c) A stoichiometric matrix is populated according to Eq. 1. (d) Assumptions, constraints, and an objective are listed for thesystem.
transport reaction, with non-zero values that identifythe metabolites which participate in the reaction aswell as the stoichiometric coefficients that correspondto each metabolite (Figure 1). The matrix also con-tains directionality: substrate and product metabolitesin the matrix have negative and positive coefficients,respectively. By considering the matrix rows insteadof the columns, the stoichiometric matrix can also bethought of as the list of reactions in which a givenmetabolite participates. This interpretation is usefulwhen defining mass balances for each metabolite inthe network.
These mass balances are expressed by a systemof differential equations written for all the metaboliteconcentrations c as follows:
dc(t)dt
= S · v(t) (1)
where S is the stoichiometric matrix and v(t) the vectorof reaction rates. Note that metabolism operateson a much faster time-scale than regulatory or celldivision events. It is thus often reasonable to assumethat metabolic dynamics have reached a quasi- orpseudo-steady state, where metabolite concentrationsdo not change. This leads to the metabolite balancingequation
S · v(t) = 0 (2)
Equation (2) is a homogeneous system of linearequations. It requires that each metabolite is consumedin the same quantity as it is produced, and is the basisfor further analysis of metabolic fluxes based on thestoichiometric matrix.
The process of building stoichiometric matriceshas been amply described and reviewed elsewhere.4
Briefly, this process involves gathering a variety ofgenomic, biochemical, and physiological data fromthe primary literature as well as databases, suchas Uniprot,5 BRENDA,6 BioCyc,7 KEGG,8 and theEnzyme Commission database.9 This information isused to synthesize a list of chemical and transportreactions together with their metabolite participantsfor a given cell. In addition, the chemical formula andcharge of each metabolite should be inspected to verifythat the chemical reaction is balanced. A reconstructednetwork model is only as good as its correspondingstoichiometric matrix, and the amount and qualityof experimental evidence supporting the inclusionof a reaction in the matrix can vary significantly.Therefore, careful curation and continual updates tothe matrix are critical.
Constraints on Reaction RatesThe stoichiometric matrix can be annotated byincluding further important information about eitherthe reactions or the metabolites. The most commonmatrix annotations include the reversibility of eachreaction and the cellular compartment in which
2009 John Wiley & Sons, Inc.

WIREs Systems Biology and Medicine Genome-scale metabolic networks
each reaction occurs. More generally, reaction ratesare bounded as a consequence of kinetic constants,measured or estimated concentration ratios or toreflect the experimental setup. Upper and lower limitscan apply to fluxes of individual reactions (vmin ≤ v ≤vmax), and reaction directions can be defined by simplysetting vmin = 0 or vmax = 0 for forward or backwardirreversible reactions, respectively. Additional matrixannotation might include more detailed informationabout reaction kinetics. For example, it is possibleto calculate metabolite uptake or secretion rateswithout difficulty in several cases; these can beused as a part of the metabolic model. In addition,13C chase experiments measure concentrations ofinternal metabolites, from which enzymatic fluxes canoften be inferred.10,11 At the present such ‘fluxomic’approaches can only be applied to highly reducedmetabolic networks, although substantial progress hasbeen made in recent years.
Links to Genomic InformationThe stoichiometric matrix can also be linked explic-itly to the genome and gene expression data for usein certain applications. First, one can connect eachchemical or transport reaction to the proteins andgenes which enable it to occur. These relationshipsare often complicated, because proteins are frequentlymade up of multiple subunits, multiple enzymes some-times catalyze the same chemical reaction, and certainenzymes catalyze more than one reaction. Delineat-ing these gene–protein–reaction relationships enablesthe comparison of computational network analy-ses with experimentally determined gene knockoutphenotypes. Gene expression data and transcrip-tion factor–gene relationships can also be critical tounderstanding more complex metabolic behaviors, asdescribed below.
Existing Genome-Scale ModelsTo date, dozens of large-scale metabolic reconstruc-tions have been published.12 Most reconstructions areof human pathogens, model organisms, or organismsused in the biotechnology industry to produce valuablechemical products. For the purposes of this review,we will briefly highlight three of the most extensivelytested reconstructions: Escherichia coli,13 Geobactersulferreducens,14 and Saccharomyces cerevisiae.15
In terms of gene coverage, the most completeof these reconstructions is that of E. coli,13
which has been the product of over a decade ofsustained effort.16 The most recent reconstructionincludes 1260 of E. coli’s 4405 genes, together withregulatory events, compartmentalization, P/O ratio,
reaction thermodynamics, energetic requirements formaintenance, and known kinetic effects. The modelhas been used for a variety of applications, includingthe prediction of growth rates, substrate uptake, andby-product secretion for thousands of combinationsof knockout strains and culture conditions.17
Geobacter species network reconstructions havealso been developed due to their remarkable bioreme-diative potential.18 These organisms have somewhatunique metabolic properties enabling them to oxi-dize organic compounds using a variety of toxicor radioactive metals as electron acceptors. The G.sulferreducens metabolic model of metabolism14 hasbeen used to engineer a potentially useful strain withhigh respiration capacity and low growth rate.19
The S. cerevisiae model is notable, in particular,for the recent efforts by the yeast community todevelop a consensus network. Several reconstructionshad previously been made and varied significantly intheir content.20–22 As a result, leading researchers inthe yeast field along with metabolic modeling expertswere brought together for a weekend ‘jamboree’to agree on the specifics of yeast metabolism. Theresulting consensus metabolic network reconstructionwas represented in a standard format, Systems BiologyMarkup Language (SBML: http://www.sbml.org/)23
and made publicly available. This consensus networkis distinct from an actual in silico model, becauseit must be associated with analytical approachesto produce metabolic simulations. Many of thesignificant modeling approaches are detailed below.
STOICHIOMETRIC NETWORKANALYSISThe analysis of genome-scale metabolic models relieson three basic approaches: (1) characterizing thegeneral network structure, (2) identifying particularflux distributions, or (3) analyzing all possible fluxdistributions in a network. The following sectionsare organized according to the corresponding analysismethods.
Structural Analysis: Characterizing theNullspaceNullspace analysis is the first simple tool to performconsistency validations with a metabolic network.Two or more metabolites are called conserved moietiesif the overall concentration of all remains constant. Insuch cases, consumption of either metabolite involvesproduction of the other. Some examples of conservedmoieties include NAD+ and NADH, or ATP, ADP,and AMP. Detecting conserved moieties requires only
2009 John Wiley & Sons, Inc.

Advanced Review www.wiley.com/wires/sysbio
the stoichiometric matrix S. Several metabolites arepart of a conserved group if the corresponding rowsin the stoichiometric matrix are linearly dependent.Different methods exist to evaluate dependent rows,for instance, Gaussian elimination or singular valuedecomposition (SVD).24 All of these methods computea basis for the left nullspace of S or, equivalently, abasis for the nullspace of the transpose of S. The set ofbasis vectors calculated by these methods—and theconserved moieties—are unfortunately non-unique.However, a convex basis can be constructed to derivea unique minimal definition for conserved groups (foran application example, see Famili and Palsson25).
Analysis of balanced metabolites also usesnullspace basis vectors. The metabolite balancingequation (2) defines a subspace of Rn, where n denotesthe number of reactions, and is also the dimensionalityof the space. The kernel matrix K is a basis for thenullspace, but it is not unique. However, any valid fluxvector v = (v1, v2, . . . , vn)T that defines a flux value vi
for each reaction i is a linear combination of columnvectors of K, that is,
v = a1 · K1 + a2 · K2 + . . . + an · Kn = K · a (3)
Equation (3) enables the identification of key reactionproperties, including those shown in the sidebar; seealso Figure 3.
RESULTS OF NULLSPACE ANALYSIS
1. If the kernel matrix contains a zero-row, thecorresponding reaction cannot carry a (non-zero) flux. We can remove this reaction for allanalysis employing the steady-state assumption.
2. If two matrix rows differ only by a constantfactor, the two reactions are coupled, thatis, the flux through one reaction is always amultiple of the flux through the other reaction;consequently either both reactions are active orboth are passive. Such reactions are presumablyco-regulated.26
3. Given reversibility constraints, inconsistent reac-tion coupling can be detected. For example, twocoupled forward-only reactions with a negativecoupling factor cannot carry a non-zero fluxwithout violating an irreversibility constraint,since one reaction would have to operate inbackward mode.
Model ConsistencyAn important step in model building is determiningthe consistency of the network, meaning technicalconsistency without considering experimental dataor biological interpretation. One method involvesthe steps shown in the sidebar; the method relieson the analysis of variability and coupling inmetabolic fluxes as introduced in Burgard et al.27 andMahadevan and Schilling.28 Another method, which
(a)
(c) (d)
(b)FIGURE 2 | (a) Nullspace (blue hyperplane)and the two-dimensional cone as intersectionof the nullspace with the positive orthant.(b) Additional boundary constraints (dottedlines) shape a bounded convex region. The fluxbalance analysis (FBA) objective function (bluesolid line) touches the region in the optimalpoint (blue circle). (c) The same cone, now in atwo-dimensional view, with feasible regions forwild-type (red area) and mutant (yellow). TheFBA objective function touches the regions atthe optimal points (blue circles). If Minimizationof metabolic adjustment (MoMA) is usedinstead, the distance to the best wild-typevalue is minimized, resulting in a differentoptimal value for the mutant (green triangle).(d) As a third alternative, regulatory on/offminimization (ROOM) minimizes the number ofnecessary changes. The brown lines indicatethat one variable is kept constant, implying aminimal number of changes for this example.Here, two alternative optimal values arepossible (brown squares).
2009 John Wiley & Sons, Inc.

WIREs Systems Biology and Medicine Genome-scale metabolic networks
FIGURE 3 | Network inconsistencies due todead-end metabolites (a) or reaction couplings (b).Nodes correspond to metabolites and arrowsdenote reactions.
(a) (b)
· · ·
focuses on stoichiometric inconsistencies, was recentlydescribed.29
MODEL CONSISTENCY
1. Minimize and maximize the flux value for eachreaction.
(a) If min and max value are zero, the reactionis a zero flux reaction, that is, it cannothave a flux value other than zero. It can beremoved if no model corrections are made,without affecting the outcome of subsequentsimulations.
(b) If min or max value is zero and the reaction isreversible, we have an unsatisfied reversibil-ity. Either the reversibility constraint is toolax or another component is missing, dis-abling the operation in one direction. Tight-ening this constraint might lead to bettersimulation performance.
(c) If the minimal and maximal values arenon-zero and have equal sign, the reactionis essential. Deletion of the reaction, forexample, by gene knockout, is predicted tobe lethal.
2. For reactions not of type (1c), set the boundsto zero. If biomass cannot be produced, thereaction is essential. Again, reaction removal isassociated with lethality.
Identifying Particular Solutions: FBAIf reaction reversibilities and maximum throughputrates are incorporated as constraints on the steady-state model, the solution space reduces from thenullspace to a convex polyhedral cone calledthe flux cone. Because these constraints can berepresented as linear equations and inequalities,linear programming (LP) methods can be used toidentify points with optimal values of a givenobjective function (for an introduction to LP, see,for instance, Cormen et al.30). In the simplest case,a single reaction flux is optimized. Many differentobjective functions have been tested for their utility
in predicting phenotypic behavior, relying on smaller-scale network models.31,32 One common practice isto define an artificial growth reaction that takes thechemical dry-weight components of the cell, in theirproper ratios, and ‘produces’ cellular biomass. Thisreaction can be used as the objective function undercertain conditions, depending on the cell type andenvironmental conditions.33 The term flux balanceanalysis stands for the application of LP methods toanalyze fluxes under balanced metabolite conditions(Figure 2b).
As FBA was introduced, the objective functionwas probably the most discomforting componentof the method. Objections to this approach rangedfrom the biological to the mathematical.31,34 Onemajor biological concern was whether the objectivefunction made biological sense—do cells actuallyhave objectives? Use of an objective function wasalso unsatisfying to those who doubted that FBAcould predict cellular phenotypes in the absenceof kinetic parameters. The FBA approach seemedto undermine traditional metabolic models whichwere composed of equations describing the propertiesof, and interactions between, small molecules andproteins.
To address these concerns, some of the earliestwork in experimentally testing FBA focused onwhether or not optimization of growth was areasonable objective that could be observed in culture.Initial results were promising: model predictions of E.coli optimal growth and by-product secretion ratesmatched experimental measurements.35 However,this did not hold true for certain substrates, likeglycerol, where E. coli growth was suboptimal.This discrepancy between model and experiment waseventually reconciled when E. coli was grown onglycerol for several hundred generations and it wasshown to evolve toward the computationally predictedoptimal growth rate.36 Interestingly, the phenotypicevolutionary endpoint was shown to be reproduciblebetween cultures, whereas the underlying geneexpression states varied.37 The link between optimalgrowth and evolution was further strengthened whenFBA was able to predict a priori the endpoint growthrates for several E. coli deletion strains.38
Note that often the optimal flux distributionsare not unique. Rather, in general, a set of
2009 John Wiley & Sons, Inc.
Advanced Review www.wiley.com/wires/sysbio
alternate optima satisfy the LP problem, and theavailable solvers may therefore return differentresults. Sometimes, it is desirable to enumerate allalternate optima for a given objective, but this iscomputationally challenging.39,40 Another way todeal with this ambiguity is flux variability analysis,which examines how individual fluxes can be changedwithout affecting optimality.28,41 Some LP packagesdirectly report variability by sensitivity ranges. Thesensitivity range can also be computed by determiningthe optimal value for a given objective, fixing theoptimal objective value (or a desired optimality range),and minimizing and maximizing fluxes for reactionsof interest.
Finally, multiple iterations of FBA can be used togenerate dynamic simulations. An initial optimizationcan be run for any given starting conditions, and usingthe resulting flux distribution, external and internalinitial concentrations can be updated over a given timestep. Critically, this time step must be large enoughthat the quasi-steady-state assumption in Eq. (2) stillholds. However, in practice, a time step of ∼ 1 sshould be large enough. The new conditions definethe environment for the next iteration step, leadingto a time-course for the environmental conditions aswell as for optimal flux patterns. With this type ofmodeling, glucose uptake was predicted on minimalmedia under aerobic and anaerobic conditions.42
Some groups have also integrated kinetic informationwith flux balance models.43–46
Deletion Strain PhenotypesA common use of FBA is to compute the essentialityof all the genes in the network, by constraining thecorresponding reactions fluxes to zero and comparingto observed deletion strain phenotypes.47 However,some alternate methods have since been proposed.Using a reference flux vector of the wild-type (deter-mined experimentally or estimated by an FBA sim-ulation of the wild-type strain), these optimizationstrategies minimize the adjustment compared withwild-type fluxes. Minimization of metabolic adjust-ment (MoMA)48 uses quadratic programming to min-imize the sum-of-squares difference between mutantand wild-type reference flux distribution. Note thatthe MoMA solution is not optimal in terms of thewild-type objective. For instance, if the wild-type max-imizes for biomass production, the mutant type mightnot exploit its full growth potential (see Figure 2c).Furthermore, because it depends on an initial non-unique FBA solution, the MoMA solution is also non-unique. Regulatory on/off minimization (ROOM)49
minimizes the number of (significant) flux changesassociated with regulation effort. ROOM defines a
set of Boolean on/off variables for all reactions. Anon state means that the corresponding reaction is up-or down-regulated. For off variables, an additionalconstraint ensures that the mutant flux lies within apredefined interval around the wild-type flux; devi-ations inside the interval are regarded insignificant.Due to the binary variables, mixed integer linear pro-gramming (MILP) is used to minimize the number ofsignificant regulation changes (see Figure 2d). Overall,the main difference between MoMA and ROOM isin the motivation behind the approaches. MoMA hasa mathematical origin in the formulation of a mini-mal response to perturbations. ROOM uses a morequalitative, biological approach to control of geneexpression, assuming that a cell, in the long run, triesto minimize the number of significant flux changes.
Comprehensive ApproachesIt is also possible to analyze flux cones withoutthe need to define an objective function. Next, weintroduce two approaches that treat the flux cone asa whole through minimal sets of elements: pathwayanalysis and the determination of minimal cut sets.
Pathway AnalysisAs described above, all steady-state flux distributionscan be constructed from nullspace basis vectors.Elementary (flux) modes have similar properties, butalso some important differences: elementary modes(EMs) are feasible vectors, whereas nullspace basisvectors might violate reaction reversibility constraints.In addition, all feasible flux vectors—and only feasibleones—can be constructed from non-negative (conic)combinations of EMs. From nullspace vectors, feasibleand infeasible vectors can be constructed, using anylinear combination.
To calculate a unique, smallest possible setof EMs, an additional constraint is introduced:minimality. A feasible flux vector is minimal (orelementary) if no other flux vector has the samereactions with zero flux plus additional ones. As aconsequence, EMs describe basic non-decomposableoperation modes of the network.50,51 Extremepathways (EPs) constitute a very similar concept,associated with the ‘shortest’ possible paths in thenetwork (note that ‘shortest’ is misleading). EMsare actually a superset of EPs, arising from aslightly different treatment of reversible transportreactions (see Klamt and Stelling52 and Wagner andUrbanczik53 for exact definitions). Moreover, in astrong mathematical sense, neither EMs nor EPsare minimal, and hence also not a minimal set ofgenerators. EMs and EPs operate in a reconfigured
2009 John Wiley & Sons, Inc.
WIREs Systems Biology and Medicine Genome-scale metabolic networks
network with enhanced reaction dimensionality, andthey are only minimal in the augmented flux space. Werefer the reader to Klamt and Stelling52 and Wagnerand Urbanczik53 and focus here on EMs. The conceptsalso apply to EPs unless stated otherwise.
Unfortunately, these pathway sets grow expo-nentially with increasing network size. It is not yetpossible to compute EMs for genome-scale networksunder general conditions.51,54 Nevertheless, EMs haveinteresting properties because they are minimal, andhence contain information about the smallest func-tional units of complex networks. Pathway analysisuncovers all alternative pathways in contrast to FBA,where only a single (optimal) pathway is found. Allmodes of the network are superpositions of EMs, andan alpha-spectrum—the contribution of individualpathways to an observed (in vivo) flux pattern—hasbeen analyzed for a simplified core metabolic networkand for human red blood cell metabolism.55 Reactionparticipation in EMs also indicates a reaction’s impor-tance for different substrate/product conversions.
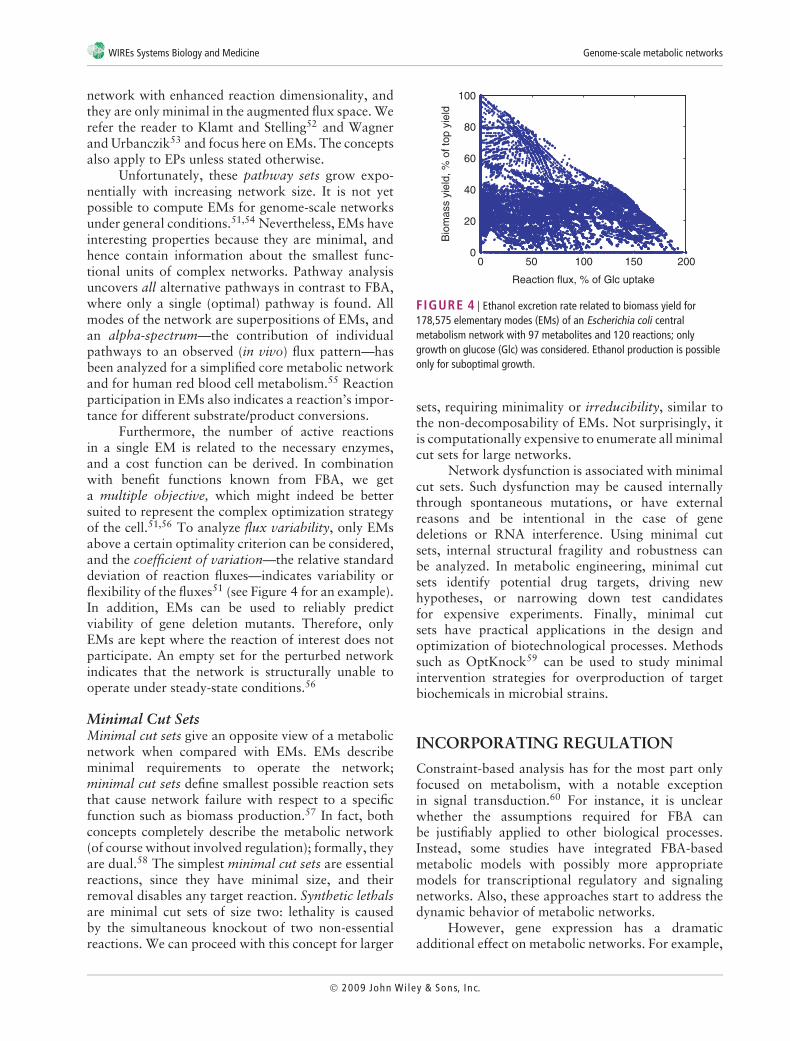
Furthermore, the number of active reactionsin a single EM is related to the necessary enzymes,and a cost function can be derived. In combinationwith benefit functions known from FBA, we geta multiple objective, which might indeed be bettersuited to represent the complex optimization strategyof the cell.51,56 To analyze flux variability, only EMsabove a certain optimality criterion can be considered,and the coefficient of variation—the relative standarddeviation of reaction fluxes—indicates variability orflexibility of the fluxes51 (see Figure 4 for an example).In addition, EMs can be used to reliably predictviability of gene deletion mutants. Therefore, onlyEMs are kept where the reaction of interest does notparticipate. An empty set for the perturbed networkindicates that the network is structurally unable tooperate under steady-state conditions.56
Minimal Cut SetsMinimal cut sets give an opposite view of a metabolicnetwork when compared with EMs. EMs describeminimal requirements to operate the network;minimal cut sets define smallest possible reaction setsthat cause network failure with respect to a specificfunction such as biomass production.57 In fact, bothconcepts completely describe the metabolic network(of course without involved regulation); formally, theyare dual.58 The simplest minimal cut sets are essentialreactions, since they have minimal size, and theirremoval disables any target reaction. Synthetic lethalsare minimal cut sets of size two: lethality is causedby the simultaneous knockout of two non-essentialreactions. We can proceed with this concept for larger
0 50 100 150 2000
20
40
60
80
100
Reaction flux, % of Glc uptake
Bio
mas
s yi
eld,
% o
f top
yie
ld
FIGURE 4 | Ethanol excretion rate related to biomass yield for178,575 elementary modes (EMs) of an Escherichia coli centralmetabolism network with 97 metabolites and 120 reactions; onlygrowth on glucose (Glc) was considered. Ethanol production is possibleonly for suboptimal growth.
sets, requiring minimality or irreducibility, similar tothe non-decomposability of EMs. Not surprisingly, itis computationally expensive to enumerate all minimalcut sets for large networks.
Network dysfunction is associated with minimalcut sets. Such dysfunction may be caused internallythrough spontaneous mutations, or have externalreasons and be intentional in the case of genedeletions or RNA interference. Using minimal cutsets, internal structural fragility and robustness canbe analyzed. In metabolic engineering, minimal cutsets identify potential drug targets, driving newhypotheses, or narrowing down test candidatesfor expensive experiments. Finally, minimal cutsets have practical applications in the design andoptimization of biotechnological processes. Methodssuch as OptKnock59 can be used to study minimalintervention strategies for overproduction of targetbiochemicals in microbial strains.
INCORPORATING REGULATION
Constraint-based analysis has for the most part onlyfocused on metabolism, with a notable exceptionin signal transduction.60 For instance, it is unclearwhether the assumptions required for FBA canbe justifiably applied to other biological processes.Instead, some studies have integrated FBA-basedmetabolic models with possibly more appropriatemodels for transcriptional regulatory and signalingnetworks. Also, these approaches start to address thedynamic behavior of metabolic networks.
However, gene expression has a dramaticadditional effect on metabolic networks. For example,
2009 John Wiley & Sons, Inc.

Advanced Review www.wiley.com/wires/sysbio
only about 50% of the E. coli genome is expressedunder typical culture conditions, and therefore halfof the stoichiometric matrix might be significantlyconstrained at any given time. This has majorramifications for convex-based analyses that ignoregene expression. The calculated pathways will includeseveral false positives which never occur in the livingcell. Furthermore, the optimal solutions determined byFBA will most likely be incorrect in all but relativelysimple growth conditions.
To explicitly account for the effects of geneexpression on metabolic behavior, an integrated pro-cedure was developed whereby transcriptional regu-latory events were described using Boolean logic andused to constrain the solution space further.61 The sta-tus of regulated transcription is found by evaluatingintra- or extra-cellular conditions. Transcription maybe switched on or off by the presence or absence of par-ticular metabolites, proteins, or signaling molecules.Sometimes, concentrations above a certain thresholdare required to trigger regulatory events. If an acti-vating or inhibiting expression changes—caused byupdated concentration values—the rate constraints forthe regulated reaction change, resulting in up-/down-regulations. In the simplest case, inhibition sets theconstraints to zero, and activation causes a resetback to the original boundary values. This methodwas found to significantly reduce the number of EPscalculated in a simple system.62
Combination of the method with FBA in anapproach called regulatory FBA or rFBA (Figure 5)produced dramatically more accurate model predic-tions in organisms such as E. coli63 and yeast.20 Morespecifically, Covert et al.64 have used rFBA to derivetime courses for E. coli with a genome-scale model andto correctly predict viability for 106 of 116 mutantstrain/growth medium conditions. In Covert et al.,63
an extended model with 1010 genes was used in an
iterative process to generate and test hypotheses, andmissing components and interactions in regulatory ormetabolic networks could be identified.
The initial work focused on reconstructingtranscriptional regulatory networks based directly onfindings from the primary literature. Boolean logicbest represented the typically qualitative conclusionsof experimental studies (e.g., ‘transcription factorX was observed to repress expression of targetgene Y’). However, subsequent studies have usedmicroarray data to constrain FBA65 as well as machinelearning techniques to generate more sophisticatedregulatory network models.66 rFBA models stand togain significantly from these developments.
CURRENT CHALLENGES
Automated Network ReconstructionThe earliest metabolic network reconstructions weremanually generated. Since that time, several toolsthat support network reconstruction have been devel-oped, such as Pathway Tools,67 KEGG Pathways,68
PUMA2,69 and SimPheny.70 However, unknownreactions and the necessary validation of databaseentries still result in time-intensive manual networkcuration.71 Therefore, although significant effort isdedicated to developing computational approachesfor fully automatic network reconstruction72 andreconciliation,29 curation-based efforts such as thejamboree currently produce the ‘gold standard’reconstructions.
One automated reconstruction method aimsto identify necessary reactions from an organism-wide database such that these reactions couldallow growth of mutants that are experimentallyviable, but predicted to be inviable by an existingstoichiometric model.73 This approach considers
Start
Start
Initialconditions
Derive System state int & ext.
concentrations
System momentumflux values
Update
Metabolism
FBAoptimization
Constraintsuptake rates
on/off reactions
Data time seriesconcentrations, growth rate, ...
Regulation/signaling
Eval. booleanexpressions
SimulateODE model
FIGURE 5 | Schematicrepresentation of regulated fluxbalance analysis (rFBA) using Booleanexpressions to simulate regulatoryelements. The concept is generalizedto integrated FBA (iFBA), alsoincorporating ordinary differentialequations (ODEs) to simulateregulation. The algorithm is aniterative procedure, generating timeseries output at each iteration.
2009 John Wiley & Sons, Inc.

WIREs Systems Biology and Medicine Genome-scale metabolic networks
only one experimental condition at a time, ityields (potentially large) sets of candidate reactions,and it is computationally expensive because foreach condition and candidate reaction FBA analysishas to be performed. Other methods rely oninformation fusion from pathway databases toreconstruct models de novo but so far they havenot yielded functional models,74 or only prototypesthat lack validation with experimental data.75 Inaddition, powerful methods exist to identify metabolicgenes for a given enzymatic function76,77—butthis function has to be already contained in themodel. Optimization-based methods help identifyinggaps in metabolic network reconstructions, andthey consolidate the models by introducing newreactions, or by modifying existing reactions. Existingalgorithms, however, do not consider global changesin network structures or potential effects on thequality of model predictions.78 Available methods,thus, have limitations in automatically generatingpredictive network models, and novel concepts, suchas Clauset et al.,79 are needed.
Cellular Optimality and DesignThe choice of a biologically meaningful objectivefunction is critical for FBA. Identifying the objec-tive function—or cellular design principles—can beregarded as the inverse problem of FBA. Where FBAfinds an optimal flux vector given some objectivefunction, a more challenging problem is to infer theobjective for an experimentally determined referenceflux vector. Early work on this problem used a bi-leveloptimization approach to test existing hypotheticalobjectives.80 The OptFind method solves two opti-mizations in one step, using the duality theorem of LPto flatten the two optimality layers. In an applicationto E. coli under aerobic and anaerobic conditions,a high coefficient of importance was found for thebiomass function.80 Method refinements allowed toderive objectives de novo.81 Similar techniques—incombination with binary variables, requiring the useof MILP— can find optimal knockout strategies lead-ing to the overproduction of a desired product.59
By automatically querying reaction databases, anoptimal strain is composed, and the method yieldsoptimal substrates for different microbes.82 Similarapproaches have been established using stochasticoptimization83 and sensitivity analysis of metabolicflux distributions.84
Another way to analyze biological networksbegins with the hypothesis that cells have optimizedtheir operation over evolutionary time-scales, asassumed in FBA. However, FBA does not provide
insight into specific control mechanisms. Furtherelaborations of principles of optimal control theory(already present in MoMA) could elucidate large-scale metabolic control circuits. For instance, thecybernetic approach85 treats metabolic control as aset of dynamic, optimal resource allocation problemsthat are solved in parallel with the mass balances.Predictions on gene expression and enzyme activityresult from choices between competing alternatives,each with a relative cost and benefit for theorganism. In addition, postulates for specific pathwayarchitectures have resulted from this approach.86
Toward Large-Scale Network Integrationand DynamicsTo build on these successes toward creation of awhole-cell model, approaches to model integrationmust be developed, in particular, with large-scalekinetic models.87 The integration of metabolismwith transcriptional regulation was already describedabove. More recently, these integration methodswere expanded to include ordinary differentialequations (ODEs).43 The method (called ‘integratedFBA’ or iFBA; see Figure 6) was used to buildan FBA model of E. coli central metabolism,together with a Boolean logic-based regulatorynetwork and a set of ODEs that described cataboliterepression.88 The resulting model had significantadvantages over either the rFBA or ODE-based modelsalone, particularly in predicting the consequencesof gene perturbation. Another approach has beendeveloped which incorporates coarse-grained time-scale information about signaling dynamics withmetabolic models.89 Finally, recent advances towardlarge-scale dynamic models include those that rely onsimplified reaction kinetics90,91 or on ensembles ofmodels.92
In addition to explicitly modeling cellularregulation, one can exploit that stoichiometricconstraints restrict the systems dynamics, for instance,by conserved moieties.25 Early work addressed thistopic for chemical reaction networks. For instance,in the 1970s, Feinberg, Horn, and Jackson startedderiving theorems to determine the possible dynamicregimes, such as multistability and oscillations, basedon network structure alone. The specific challengesposed by biological systems lead to application studiesas well as further theory development.93 For instance,the theory can be used in stability analysis and formodel discrimination by safely rejecting hypotheses onreaction mechanisms; this analysis relies on a modularapproach where subnetworks that correspond toEMs are investigated individually.94 Other algorithmsfor the identification of dependent species in large
2009 John Wiley & Sons, Inc.

Advanced Review www.wiley.com/wires/sysbio
FIGURE 6 | Models have been constructedwhich build on the constraint-based frameworkto integrate metabolic, transcriptionalregulatory, and signal transduction networks(each represented using different mathematics)into a single model.
Carbon/energy metabolism Transcriptional regulation
Flux analysislinear
optimization
Boolean logictime-dependent
constraints
ODEsdetailedkinetics
Signal transduction
biochemical systems—to be employed, for instance, inmodel reduction—have recently become available.95
CONCLUSIONIn sum, large-scale metabolic network modeling hasmatured as a field, with a library of computationaltechniques, published networks for a large andincreasing number of organisms, and an extensivebody of supporting experimental evidence. It is clear
that such modeling can be extremely useful, notwith-standing its limitations. These studies have alsoestablished the essentiality of other biological mod-els—metabolism alone cannot explain most observedphenotypic behaviors. It seems unrealistic to expectthat data which would allow detailed genome-scalemodeling of other biological networks will arrive inthe next few years. However, we re-emphasize thatscientists felt the same way about metabolism justover a decade ago.
REFERENCES
1. Price ND, Reed JL, Palsson BO. Genome-scale mod-els of microbial cells: evaluating the consequences ofconstraints. Nat Rev Microbiol 2004, 2:886–897.
2. Rocha I, Forster J, Nielsen J. Design and application ofgenome-scale reconstructed metabolic models. MethodsMol Biol 2008, 416:409–431.
3. Jaqaman K, Danuser G. Linking data to models: dataregression. Nat Rev Mol Cell Biol 2006, 7:813–819.
4. Covert MW, et al. Metabolic modeling of microbialstrains in silico. Trends Biochem Sci 2001, 26:179–186.
5. Apweiler R, et al. UniProt: the universal protein knowl-edgebase. Nucleic Acids Res 2004, 32:D115–D119.
6. Schomburg I, Chang A, Schomburg D. BRENDA,enzyme data and metabolic information. Nucleic AcidsRes 2002, 30:47–49.
7. Karp PD, et al. Expansion of the BioCyc collection ofpathway/genome databases to 160 genomes. NucleicAcids Res 2005, 33:6083–6089.
8. Ogata H, et al. KEGG: kyoto encyclopedia of genesand genomes. Nucleic Acids Res 1999, 27:29–34.
9. Bairoch A. The ENZYME database in 2000. NucleicAcids Res 2000, 28:304–305.
10. Wiechert W. 13C metabolic flux analysis. Metab Eng2001, 3:195–206.
11. Wittmann C. Metabolic flux analysis using massspectrometry. Adv Biochem Eng Biotechnol 2002,74:39–64.
12. Reed JL, et al. Towards multidimensional genomeannotation. Nat Rev Genet 2006, 7:130–141.
2009 John Wiley & Sons, Inc.
WIREs Systems Biology and Medicine Genome-scale metabolic networks
13. Feist AM, et al. A genome-scale metabolic reconstruc-tion for Escherichia coli K-12 MG1655 that accountsfor 1260 ORFs and thermodynamic information. MolSyst Biol 2007, 3:121.
14. Mahadevan R, et al. Characterization of metabolism inthe Fe(III)-reducing organism Geobacter sulfurreducensby constraint-based modeling. Appl Environ Microbiol2006, 72:1558–1568.
15. Herrgard MJ, et al. A consensus yeast metabolicnetwork reconstruction obtained from a communityapproach to systems biology. Nat Biotechnol 2008,26:1155–1160.
16. Reed JL, Palsson BO. Thirteen years of buildingconstraint-based in silico models of Escherichia coli.J Bacteriol 2003, 185:2692–2699.
17. Feist AM, Palsson BO. The growing scope of applica-tions of genome-scale metabolic reconstructions usingEscherichia coli. Nat Biotechnol 2008, 26:659–667.
18. Lovley DR. Cleaning up with genomics: applyingmolecular biology to bioremediation. Nat Rev Micro-biol 2003, 1:35–44.
19. Izallalen M, et al. Geobacter sulfurreducens strain engi-neered for increased rates of respiration. Metab Eng2008, 10:267–275.
20. Herrgard MJ, et al. Integrated analysis of regulatoryand metabolic networks reveals novel regulatory mech-anisms in Saccharomyces cerevisiae. Genome Res 2006,16:627–635.
21. Kuepfer L, Sauer U, Blank LM. Metabolic functions ofduplicate genes in Saccharomyces cerevisiae. GenomeRes 2005, 15:1421–1430.
22. Caspi R, et al. MetaCyc: a multiorganism database ofmetabolic pathways and enzymes. Nucleic Acids Res2006, 34:D511–D516.
23. Hucka M, et al. The systems biology markup language(SBML): a medium for representation and exchangeof biochemical network models. Bioinformatics 2003,19:524–531.
24. Sauro HM, Ingalls B. Conservation analysis in bio-chemical networks: computational issues for softwarewriters. Biophys Chem 2004, 109:1–15.
25. Famili I, Palsson BO. The convex basis of the left nullspace of the stoichiometric matrix leads to the def-inition of metabolically meaningful pools. Biophys J2003, 85:16–26.
26. Notebaart RA, et al. Co-regulation of metabolic genesis better explained by flux coupling than by networkdistance. PLoS Comput Biol 2008, 4:e26.
27. Burgard AP, et al. Flux coupling analysis of genome-scale metabolic network reconstructions. Genome Res2004, 14:301–312.
28. Mahadevan R, Schilling CH. The effects of alter-nate optimal solutions in constraint-based genome-scalemetabolic models. Metab Eng 2003, 5:264–276.
29. Gevorgyan A, Poolman MG, Fell DA. Detection ofstoichiometric inconsistencies in biomolecular models.Bioinformatics 2008, 24:2245–2251.
30. Cormen TH, et al., Introduction to Algorithms. BurrRidge, IL: McGraw-Hill; 2001.
31. Schuetz R, Kuepfer L, Sauer U. Systematic evaluationof objective functions for predicting intracellular fluxesin Escherichia coli. Mol Syst Biol 2007, 3:119.
32. Savinell JM, Palsson BO. Network analysis of interme-diary metabolism using linear optimization. I. Develop-ment of mathematical formalism. J Theor Biol 1992,154:421–454.
33. Fischer E, Sauer U. Large-scale in vivo flux analysisshows rigidity and suboptimal performance of Bacillussubtilis metabolism. Nat Genet 2005, 37:636–640.
34. Pramanik J, Keasling JD. Effect of Escherichia colibiomass composition on central metabolic fluxes pre-dicted by a stoichiometric model. Biotechnol Bioeng1998, 60:230–238.
35. Edwards JS, Ibarra RU, Palsson BO. In silico pre-dictions of Escherichia coli metabolic capabilities areconsistent with experimental data. Nat Biotechnol2001, 19:125–130.
36. Ibarra RU, Edwards JS, Palsson BO. Escherichia coliK-12 undergoes adaptive evolution to achieve in silicopredicted optimal growth. Nature 2002, 420:186–189.
37. Fong SS, Joyce AR, Palsson BO. Parallel adaptiveevolution cultures of Escherichia coli lead to conver-gent growth phenotypes with different gene expressionstates. Genome Res 2005, 15:1365–1372.
38. Fong SS, Palsson BO. Metabolic gene-deletion strainsof Escherichia coli evolve to computationally predictedgrowth phenotypes. Nat Genet 2004, 36:1056–1058.
39. Lee S, et al. Recursive MILP model for finding all thealternate optima in LP models for metabolic networks.Comput Chem Eng 2000, 24:711–716.
40. Phalakornkule C, et al. A MILP-based flux alternativegeneration and NMR experimental design strategy formetabolic engineering. Metab Eng 2001, 3:124–137.
41. Bilu Y, et al. Conservation of expression and sequenceof metabolic genes is reflected by activity acrossmetabolic states. PLoS Comput Biol 2006, 2:e106.
42. Varma A, Palsson BO. Stoichiometric flux balancemodels quantitatively predict growth and metabolic by-product secretion in wild-type Escherichia coli W3110.Appl Environ Microbiol 1994, 60:3724–3731.
43. Covert MW, et al. Integrating metabolic, transcrip-tional regulatory and signal transduction models inEscherichia coli. Bioinformatics 2008, 24:2044–2050.
44. Mahadevan R, Edwards JS, Doyle FJ 3rd. Dynamic fluxbalance analysis of diauxic growth in Escherichia coli.Biophys J 2002, 83:1331–1340.
45. Smallbone K, et al. Something from nothing: bridgingthe gap between constraint-based and kinetic mod-elling. FEBS J 2007, 274:5576–5585.
2009 John Wiley & Sons, Inc.

Advanced Review www.wiley.com/wires/sysbio
46. Yugi K, et al. Hybrid dynamic/static method for large-scale simulation of metabolism. Theor Biol Med Model2005, 2:42.
47. Edwards JS, Palsson BO. The Escherichia coli MG1655in silico metabolic genotype: its definition, characteris-tics, and capabilities. Proc Natl Acad Sci USA 2000,97:5528–5533.
48. Segre D, Vitkup D, Church GM. Analysis of optimal-ity in natural and perturbed metabolic networks. ProcNatl Acad Sci USA 2002, 99:15112–15117.
49. Shlomi T, Berkman O, Ruppin E. Regulatory on/offminimization of metabolic flux changes after geneticperturbations. Proc Natl Acad Sci USA 2005,102:7695–7700.
50. Gagneur J, Klamt S. Computation of elementary modes:a unifying framework and the new binary approach.BMC Bioinformatics 2004, 5:175.
51. Terzer M, Stelling J. Large-scale computation of ele-mentary flux modes with bit pattern trees. Bioinfor-matics 2008, 24:2229–2235.
52. Klamt S, Stelling J. Two approaches for metabolicpathway analysis? Trends Biotechnol 2003, 21:64–69.
53. Wagner C, Urbanczik R. The geometry of the fluxcone of a metabolic network. Biophys J 2005,89:3837–3845.
54. Klamt S, Stelling J. Combinatorial complexity of path-way analysis in metabolic networks. Mol Biol Rep2002, 29:233–236.
55. Wiback SJ, Mahadevan R, Palsson BO. Reconstructingmetabolic flux vectors from extreme pathways: definingthe alpha-spectrum. J Theor Biol 2003, 224:313–324.
56. Stelling J, et al. Metabolic network structure determineskey aspects of functionality and regulation. Nature2002, 420:190–193.
57. Klamt S, Gilles ED. Minimal cut sets in biochemicalreaction networks. Bioinformatics 2004, 20:226–234.
58. Klamt S. Generalized concept of minimal cut sets inbiochemical networks. Biosystems 2006, 83:233–247.
59. Burgard AP, Pharkya P, Maranas CD. Optknock: abilevel programming framework for identifying geneknockout strategies for microbial strain optimization.Biotechnol Bioeng 2003, 84:647–657.
60. Papin JA, Palsson BO. The JAK-STAT signaling net-work in the human B-cell: an extreme signaling pathwayanalysis. Biophys J 2004, 87:37–46.
61. Covert MW, Schilling CH, Palsson B. Regulation ofgene expression in flux balance models of metabolism.J Theor Biol 2001, 213:73–88.
62. Covert MW, Palsson BO. Constraints-based models:regulation of gene expression reduces the steady-statesolution space. J Theor Biol 2003, 221:309–325.
63. Covert MW, et al. Integrating high-throughput andcomputational data elucidates bacterial networks.Nature 2004, 429:92–96.
64. Covert MW, Palsson BO. Transcriptional regulation inconstraints-based metabolic models of Escherichia coli.J Biol Chem 2002, 277:28058–28064.
65. Akesson M, Forster J, Nielsen J. Integration of geneexpression data into genome-scale metabolic models.Metab Eng 2004, 6:285–293.
66. Bonneau R, et al. A predictive model for transcriptionalcontrol of physiology in a free living cell. Cell 2007,131:1354–1365.
67. Karp PD, Paley S, Romero P. The pathway tools soft-ware. Bioinformatics 2002, 18:S225–S232.
68. Kanehisa M, et al. The KEGG databases atGenomeNet. Nucleic Acids Res 2002, 30:42–46.
69. Maltsev N, et al. PUMA2—grid-based high-throughputanalysis of genomes and metabolic pathways. NucleicAcids Res 2006, 34:D369–D372.
70. Price ND, et al. Genome-scale microbial in silico mod-els: the constraints-based approach. Trends Biotechnol2003, 21:162–169.
71. Ott MA, Vriend G. Correcting ligands, metabolites,and pathways. BMC Bioinformatics 2006, 7:517.
72. Nikoloski Z, et al. Metabolic networks are NP-hard toreconstruct. J Theor Biol 2008, 254:807–816.
73. Reed JL, et al. Systems approach to refininggenome annotation. Proc Natl Acad Sci USA 2006,103:17480–17484.
74. DeJongh M, et al. Toward the automated generation ofgenome-scale metabolic networks in the SEED. BMCBioinformatics 2007, 8:139.
75. Arakawa K, et al. GEM System: automatic prototypingof cell-wide metabolic pathway models from genomes.BMC Bioinformatics 2006, 7:168.
76. Kharchenko P, et al. Identifying metabolic enzymeswith multiple types of association evidence. BMC Bioin-formatics 2006, 7:177.
77. Kharchenko P, Vitkup D, Church GM. Filling gapsin a metabolic network using expression information.Bioinformatics 2004, 20:i178–i185.
78. Satish Kumar V, Dasika MS, Maranas CD. Optimiza-tion based automated curation of metabolic reconstruc-tions. BMC Bioinformatics 2007, 8:212.
79. Clauset A, Moore C, Newman ME. Hierarchical struc-ture and the prediction of missing links in networks.Nature 2008, 453:98–101.
80. Burgard AP, Maranas CD. Optimization-basedframework for inferring and testing hypothesizedmetabolic objective functions. Biotechnol Bioeng 2003,82:670–677.
81. Gianchandani EP, et al. Predicting biological systemobjectives de novo from internal state measurements.BMC Bioinformatics 2008, 9:43.
82. Pharkya P, Burgard AP, Maranas CD. Opt-Strain: a computational framework for redesign of
2009 John Wiley & Sons, Inc.

WIREs Systems Biology and Medicine Genome-scale metabolic networks
microbial production systems. Genome Res 2004,14:2367–2376.
83. Patil KR, et al. Evolutionary programming as a plat-form for in silico metabolic engineering. BMC Bioin-formatics 2005, 6:308.
84. Park JH, et al. Metabolic engineering of Escherichiacoli for the production of l-valine based on transcrip-tome analysis and in silico gene knockout simulation.Proc Natl Acad Sci USA 2007, 104:7797–7802.
85. Kompala DS, Ramkrishna D, Tsao GT. Cyberneticmodeling of microbial growth on multiple substrates.Biotechnol Bioeng 1984, 26:1272–1281.
86. Young JD, et al. Integrating cybernetic modeling withpathway analysis provides a dynamic, systems-leveldescription of metabolic control. Biotechnol Bioeng2008, 100:542–559.
87. Jamshidi N, Palsson BO. Formulating genome-scalekinetic models in the post-genome era. Mol Syst Biol2008, 4:171.
88. Kremling A, Bettenbrock K, Gilles ED. Analysis ofglobal control of Escherichia coli carbohydrate uptake.BMC Syst Biol 2007, 1:42.
89. Min Lee J, et al. Dynamic analysis of integrated signal-ing, metabolic, and regulatory networks. PLoS ComputBiol 2008, 4:e1000086.
90. Liebermeister W, Klipp E. Bringing metabolic networksto life: integration of kinetic, metabolic, and proteomicdata. Theor Biol Med Model 2006, 3:42.
91. Liebermeister W, Klipp E. Bringing metabolic networksto life: convenience rate law and thermodynamic con-straints. Theor Biol Med Model 2006, 3:41.
92. Tran LM, Rizk ML, Liao JC. Ensemble modeling ofmetabolic networks. Biophys J 2008, 95:5606–5617.
93. Craciun G, Tang Y, Feinberg M. Understanding bista-bility in complex enzyme-driven reaction networks.Proc Natl Acad Sci USA 2006, 103:8697–8702.
94. Conradi C, et al. Subnetwork analysis reveals dynamicfeatures of complex (bio)chemical networks. Proc NatlAcad Sci USA 2007, 104:19175–19180.
95. Vallabhajosyula RR, Chickarmane V, Sauro HM. Con-servation analysis of large biochemical networks. Bioin-formatics 2006, 22:346–353.
2009 John Wiley & Sons, Inc.