Embed Size (px)
Citation preview

Proceedings of DETC’01ASME 2001 Design Engineering Technical Conferences and Computers
and Information in Engineering ConferencePittsburgh, Pennsylvania, September 9-12, 2001
DETC2001/VIB-21619
ANALYSIS OF LOAD DEPENDENT DYNAMIC TRANSMISSION ERROR RESPONSEOF GEARS WITH RANDOM PITCH ERROR
János MárialigetiBudapest University of Technology and Economics
H-1521 Budapest, HungaryTel.: +361 463 1739, Fax: +361 463 1653
Email: [email protected]
László LovasBudapest University of Technology and
EconomicsH-1521 Budapest, Hungary
Tel.: +361 463 1739, Fax: +361 463 1653Email: [email protected]
Proceedings of DETC'01 ASME 2001 Design Engineering Technical Conference
and Computers and Information in Engineering Conference Pittsburgh, PA, September 9-12, 2001
DETC2001/VIB-21619
ABSTRACTFor more realistic gear dynamic behaviour predictions,
detailed gear dynamic models are needed, allowing taking intoconsideration the most important influencing factors. Systemmodel is presented, based on the separate handling of individualtooth pairs, with their specific profile corrections,manufacturing errors etc. Further on, non-linear single toothpair force-deflection curve is considered, resulting in loaddependent eigenfrequency characteristics. Simulation results arepresented for gears with randomly distributed pitch errors.Gears with normal tooth profile and with tip relief arecompared, and vibration response characteristics are analysedbased on Fourier analysis of simulated transmission errorresponse curves.
KEYWORDS: gear dynamics, random error, transmission error, Fourier analysis
1 INTRODUCTIONFor more realistic vibration characteristics predictions of
transmission systems especially in cases with important outerload variations, as e.g. in transport means transmissions,simplified rheo-linear models, supposing ideal involute toothprofiles and ideal mesh conditions, resulting in a linear systembehaviour [1], are not always satisfactory. As experiments andtheoretical considerations show, tooth geometry specialities, astip relief [7], one of the most effective tools for dynamicbehaviour improvement, real mesh conditions and meshirregularities, influenced considerably by manufacturing errors,(manufacturing errors mean in this context, the tolerateddeviations of real dimensions from the theoretical one) are totake into consideration. All these parameters, influencing
considerably frequency composition of the inner excitationeffects of gears, generate load dependent parametric excitation,so strongly non-linear system response develops [2,3].
Taking into account further, that real manufacturing errorsare of random character, models are needed, permitting thesimulation of the rolling down of more realistic gears withrandom errors. The results of the dynamic simulations, asdynamic force, or transmission error [7] versus time functionsin that case, can be considered as quasi-random functionrealisations, and can be handled with statistical tools. Furtheron, inner excitation function model for gears with random pitcherror, simulated transmission error curves for different nominalload values will be presented and their frequency characteristicswill be analysed and compared for normal toothing and withadequate tip relief.
2 NOMENCLATUREFNj normal force on unit width of jth tooth pairFN normal mesh force on unit widthJ1, J2 moment of inertia of pinion and gear respectivelyKj damping coefficient of jth tooth pairKD dynamic factor for tooth mesh forceN frequency ratioT1, T2 torque on pinion and gear respectivelyb gear widthh backlashfz tooth frequencym module [mm]n1 number of rotation, pinionrb1, rb2 base circle radius of pinion and gear respectively
1 Copyright © 2001 by ASME

js stiffness of jth tooth pair in mesh direction
js reduced stiffness of jth tooth pairs mesh spring stiffness function of gear drivewj tooth pair deflection in mesh directionωe system eigenfrequency (angular)ωz tooth frequency (angular)δj contact function of jth tooth pairδ contact function of gear driveϕ1, ϕ1 twist angles of pinion and gear respectively∆σ transmission error, measured on the pressure line
3 EXCITATION FUNCTION MODELThe inner excitation of the gears is due to the departure of
the real tooth flanks from the theoretical ones on one side, andto the mesh stiffness variation during rolling down, on the otherside. The first one, the kinematic excitation is caused byintended profile modifications, manufacturing errors, involvingload dependent mesh irregularities, whilst the second one, thedynamic excitation is originated from the stiffness variation ofthe tooth pairs in contact, from the non-linear tooth deflectioncurves [5] and the alterations of the number of teeth, beinginstantaneously in contact. As a result, non-uniform rotationtransmission is realised, i. e. transmission error develops.
Figure 1. Gear twist angle variation in case of pitch error
For the description of kinematic excitation component, letus consider a tooth pair, manufactured with a resultant basepitch error fpbrj, Fig. 1. Assuming the pinion in fixed angularposition ϕ1, for taking into contact the tooth flanks, wheelshould be turned back to angular position ϕ2, (neighbouringteeth imagined as removed), from its nominal ϕ2n position, withangle difference ∆ϕ2. For the jth tooth flank pair, contactfunction δj(ϕ1)=rb2.( ϕ2n -ϕ2 )>0 gives the travel error, measuredon the pressure line, for involute profiles, in case of contact ofthe given profile pair. So, for each individual profile paircombinations, realised during the rolling down on angularinterval Ω=2πz2, giving different combinations [1], individual
rb2ϕ2n
ϕ2
∆ϕ2 fpbrj
pinion
wheel
Figure 2. Contact functions for normal toothing (a.) and incase with tip relief (b)
contact functions can be defined, Fig 2. The curved parts on δjcontact functions for normal profiles Fig. 2.a., belong to the
Figure 3. Reduced stiffness function shape (a.) and itsinterpretation (b.)
mesh zones in the case of leaving later the contact and enteringearlier into it. These irregular mesh zones are originated totooth deflections under load or/and manufacturing errors. OnFig. 2.b. contact function series is represented for flanks withtip relief, showing inclined straight segments for involute reliefprofile. Other individual tooth error types can be modelled in asimilar way [4]. Assuming the manufacturing errors for each
ŝ(ϕ1; ∆σ)ŝ
∆σ
ŝ’(ϕ1; ∆σ)
h(ϕ1)
Ωδ
δ’ ϕ1
∆σ∆σŝ
ϕ1
ϕ1 δj
δj-1wj
wj-1
δj(ϕ1)δ(ϕ1)∆σ
δ(ϕ1)δj(ϕ1)
fpbrj+1fpbrj
tip relief
δ(ϕ1)
ϕ1
a. b.
a.
b.
2 Copyright © 2001 by ASME

profile to be known, one can set the δj functions, different foreach different profile pair combinations. For zero load, thekinematic excitation function δ(ϕ1)=min(δj(ϕ1)), where j are theindex numbers of profile pairs being in potential contactposition at pinion position ϕ1, can be than defined as the lowerboundary of δj(ϕ1) series, see Fig. 2, as the travel error on thepressure line. δ(ϕ1) is Ω periodic, and one can select the startingpoint for rolling down so, that δj(ϕ1)>0 for all j, hence δ(ϕ1)>0as well. The ∆σ(ϕ1;FN) = rb1.ϕ1 - rb2.ϕ2(ϕ1) transmission error atFN≥0 can be expressed generally as the sum of kinematic errorand tooth deflection, ∆σ=δj,(j+1)..(ϕ1)+wj,(j+1).., see Fig. 3.b.Hence, the transmission error, besides tooth deflection, toothprofile modifications, manufacturing errors, is influenced byload dependent mesh conditions as well.
Making use of the individual handling of tooth pairs beingactually in contact, for the integrated treatment of the differenttypes of excitation components, i. e. resulting in travel error,one can introduce the two variables reduced stiffness function,defined as:
( )( )
( ) ( ) ( )
>
−=
=
≤
=j
jj
jjj
jNj
ifswsF
if
s1
11
1
1
1 ,1..
,0);(
ϕδσ∆σ∆ϕδ
ϕσ∆
ϕ
σ∆
ϕδσ∆σ∆ϕ
(1)
being a generalisation of the mesh spring stiffness functions(ϕ1;∆σ), defined for ideal contact (without irregular meshzones), of ideal toothing, assuming non-linear tooth deflectioncurve [1]. In Eq. (1) j stands for the index number of profilepairs being actually in contact. In case of non-linear toothdeflection characteristics [5], Eq. (1) become morecomplicated, but essentially remains similar. On Fig. 3.a.reduced stiffness function is schematically presented, for normaland for reversed torque transmission with marked symbols, i.e.lower part. Reduced stiffness function curve to constant meshload can be obtained, as the intersection of surface
( ) ..;ˆ 1 constFs N ==σ∆σ∆ϕ , with surface ( )σ∆ϕ ;ˆ 1s .In general case, the reduced stiffness function can be written
as the sum of its Fourier components Ck, with the C0 averagevalue as follows:
( ) ( ) ( )
++=∞
=k
kk kCCs νϕ
Ωπσ∆σ∆σ∆ϕ 1
101 .2cos.;ˆ (2)
where Ω is the basic angular period of the reduced stiffnessfunction, k is the ordinal number of the Fourier components,and νk the phase angle. In the case of toothing with tip relief orwith manufacturing error or/and with non-linear single toothpair force-deflection curve, values of C0, Ck are load (i.e. ∆σ)dependent.
4 SYSTEM DYNAMIC MODELFor the study of the effect of toothing on transmission error
characteristics, a simple two mass model was applied, foravoiding the disturbances of other elements as shafts, bearingsetc. According to the modelling of excitation function describedin chapter 3, the two rotating masses are coupled with a springsystem, composed from individual tooth pairs,
Figure 4. System dynamic model (a.) and spring systemmodel (b.)
modelled with parallel connected spring and damping elements,completed with kinematic excitation components δj(ϕ1) andδ(ϕ1) respectively, Fig. 4., where symbols with mark stand forthe reversed torque transmission. Hence, the system ofdifferential equations of motion, containing the reducedstiffness term (Eq. (1)) will be as follows:
( )( ) ( )
( )( ) ( ) 21221
122
11111
111
.;ˆ...
.;ˆ...
TsrrKJ
TsrrKJ
bb
n
jjj
bb
n
jjj
−=+
−+
=+
−+
=
=
σ∆σ∆ϕϕδσ∆ϕ
σ∆σ∆ϕϕδσ∆ϕ
(3)
The above equation, containing the ( )σ∆ϕ ;ˆ 1s load dependentexcitation term, as a rheo-nonlinear system of differentialequations, results parametric vibrations with resonancelocations governed by system eigenfrequency, ωe. Theeigenfrequency is determined by s(ϕ1;∆σ) load dependent meshspring stiffness function in case of non-linear tooth deflectioncharacteristics [5], as a generalisation of the s(ϕ1) stiffnessfunction, belonging to constant tooth stiffness. The integralmean of s(ϕ1), determining value ωe is marked with cγ in ISOstandards and gear literature [1].
For resonance points location identification, symbolN=ωz/ωe will be applied. As it is known from the theory ofparametric vibrations [6], Eq. (3) gives resonance points notonly at N=1, but at points N=1/k and N=2/k, k=1,2,3..∝, withdecreasing on importance as k is increasing. In case of complexexcitation, as in Eq. (2), besides the main excitation frequency
ϕ1
ϕ2
rb1
rb2
J1
z1T1
J2
z2
T2a.
FN
-FN
FN
-FN
h
δ1 δ2 δn
δ1’ δ2’ δn’
s1’ sn’
s1 sn
K1’ Kn’
K1 Kn
b.
3 Copyright © 2001 by ASME

of ωz, other basic frequencies can be important, resulting in acomplex dynamic response.
In case of load dependent mesh spring stiffness s(ϕ1;∆σ),resonance locations being determined by that through ωe will beload dependent as well. The cγ in this case is load dependent aswell; so for resonance locations symbol N~ will be applied incases, if single tooth pair deflection characteristics are of non-linear type.
5 GENERATION AND ANALYSIS OF INNER EXCITATION FUNCTION
serial number of teeth (z1=53)
Figure 5. Pitch error and accumulated pitch error series for thepinion (z1=53)
The study of dynamic response of gear transmission iscarried out by the application of the previously presented gearinner excitation model in case of a train with gears of number ofteeth 53/65, and m=12. Two variants, one with normal toothprofiles, the other with long relief [7] were applied. For theprobabilistic law of pitch error values, as for manufacturedones, Gaussian normal distribution was assumed. Random pitcherror series was generated applying Monte-Carlo technique,under continuous control of the generated pitch error andaccumulated pitch error values, corresponding to tolerance classDIN 7. In this way, one can avoid to obtain non-realistic gearmodels, and results. On Fig 5. and Fig. 6. pitch error values andaccumulated pitch error functions are given, generated fromGaussian distribution function with zero expected value.
Accumulatedpitch error
Pitch error [µm]
80
60
40
20
[µm]
20
-20
serial number of teeth (z1=65)
Figure 6. Pitch error and accumulated pitch error series for thegear (z2=65)
For avoiding inertia influence, rolling down simulationswith n1~0 can be carried out, with different FN values, by takingthe corresponding outer torques on gears. In case of FN=0, thecontact function δ(ϕ1) is obtained. In this special
Figure 7. Transmission error curves for normal toothing (a.)and with tip relief (b)
case, transmission error function and kinematic excitationfunction are the same. On Fig. 7. δ(ϕ1) functions arerepresented for normal toothing and with tip relief, for twocomplete pinion rotation, realising the contact of 2.z1=106different profile pair combinations. Fourier components Cδ,k oftransmission error curve of Fig. 7.a., i. e. for normal toothing,are presented on Fig. 8. One can see that besides the excitation
20
-20
Pitch error [µm]
Accumulatedpitch error
80
40
60
20
100
[µm]
[µm]
[µm]δj φ1
π0 2π 3π 4π
50
100150
50
100
150
a.
b.
4 Copyright © 2001 by ASME

Figure 8. Fourier components of the transmission errorcurve at FN=0
Figure 9. Reduced stiffness curves at constant nominal load FN,for gears with tip relief
components around the fz, 2fz ... values, lower frequencycomponents appear, according to the pitch error influence.
Applying constant FN>0 mesh forces for rolling downsimulation, one can obtain with n1~0 the theoreticaltransmission error curves or the reduced stiffness functioncurves corresponding to FN=const. On Fig. 9. reduced stiffnesscurves are presented at different FN=const. load values, for caseof toothing with tip relief. These curves, as the constant load
[µm]Cδ,k
Ordinal number kfz 2fz 3fz
4 53 106 159 212 265 318
2
4
6
8
10
12
FN [N/mm]100050035010050
Ŝ [N/mmµm]
π 2π 3π 4π
φ1
φ1
φ1
5
10
15 δj15010050
π 2π 3π 4π0
sections of the general excitation function ( )σ∆ϕ ;ˆ 1s , accordingto Eq. (1), characterise all excitation components, involved bygear mesh.
For the frequency composition characterisation of theexcitation functions (reduced stiffness function) at constant loadvalues, Fourier analyses were carried out, Fig. 10. On thevertical axis, excitation intensity values )('
Nk FC , related to thek=3 excitation intensity of the FN=50N/mm curve are measured.kth excitation intensity is defined as the ratio of the )(,ˆ Nks FCamplitude of kth component and the )(0,ˆ Ns FC mean value ofexcitation function.
Figure 10. Fourier components of the reduced stiffness functionfor gears with tip relief
As expected, important lower frequency componentsappear, due to the lower frequency pitch error and accumulatedpitch error influence.
6 SIMULATED DYNAMIC TRANSMISSION ERROR CURVES
For representing the transmission error, the angulardisplacement error curves of the pinion (driver) were simulated,under steady state conditions, i. e. at rolling down with constantnominal speed and load. For the study of frequency response ofthe system, Fourier analyses of dynamic transmission errorresponse curves were carried out. For single tooth force-deflection curve a non-linear one, with two variants of basicstiffness value [5,8], coded as WBHp for a bigger, and WBHKpfor a smaller mean stiffness was applied.
Figure 11. and Fig 12. present mesh force dynamic factorcurves, obtained by continuous rolling down simulations under
Ck’(FN)=Cŝ,k(FN)/Cŝ,0(FN)
1,31
0,8
0,6
0,4
0,2
Ck’/C3’(50)
1 53106 159 212265 318
371424
477fz 2fz 3fz 4fz
Ordinal number k
500
6001000
350100
50FN [N/mm]
WBHp
5 Copyright © 2001 by ASME

smooth acceleration, with increasing n1 input speed andconstant nominal tooth mesh forces respectively. These curves(with different scales in horizontal direction at different meshforces) give a general orientation on highly different systembehaviour under different nominal mesh forces on one side, andin cases of different toothing types, i. e. normal toothing Fig.11. and that of with tip relief, Fig 12. on the other side.Differences between the two variants, the load influence and theload dependent, not monotonic response for case with tip reliefare clearly to identify. Detailed analysis of dynamic factors isgiven in [10].
Figure 11. KD mesh force dynamic factors for gears with normalprofiles
System behaviour with ideal toothing is not treated here, seee.g. in [9].
For frequency response analysis, continuous rolling downsimulations were carried out at constant nominal mesh forces,and constant input speeds. These latter were selected in theresonance regions N~ =1/2 and N~ =1, for two complete rotationof the driver, involving the sequential contact of 106 toothprofile pair combinations, corresponding to the contact functionon Fig. 7. Due to the fact that the gears are of random pitcherrors, the simulated curves present irregular shape and can beconsidered as quasi-random realisation functions of a randomprocess.
n1
n10 300 600 900 1200 [1/min]
0
0
0
00 300 600 900 1200 [1/min]
WBHKp
FN=1500 N/mm
FN=1000 N/mm
FN=500 N/mm
FN=350 N/mm
FN=200 N/mm
FN=100 N/mm
FN=50 N/mm
N
N
N
N
1
1
1
1
1/2
1/2
1/2
1/2
1/3
1/3
1/3
1/3
1/4
1/4
1/4
1/4
12
1
1
2
2
0
8
15
KD
0
0
1
1
Figure 12. KD mesh force dynamic factors for gears with tiprelief
Figure 13. Transmission error curves at N~ =1, for gears withnormal profiles
0
0
0
0
300 600 900 1200 [1/min]n1
n1300 600 900 1200 [1/min]
FN=50 N/mm
FN=100 N/mm
FN=200 N/mm
FN=350 N/mm
FN=500 N/mmFN=1000 N/mm
FN=1500 N/mm
N
Ñ
Ñ
Ñ
Ñ
N
1
1
1
1
11
1/2
1/2
1/2
1/2
1/21/2
1/3
1/3
1/3
1/3
1/31/3
1/4
1/4
1/4
1/4
1/41/4
0
0 0
1
1
2
2
246
8
15
KD
WBHKp
∆φ1
φ1
π 2π 3π 4π0
FN=50 N/mm, n1=890 1/min
FN=100 N/mm, n1=740 1/min
FN=200 N/mm, n1=850 1/min
FN=500 N/mm, n1=1050 1/min
FN=1000 N/mm, n1=1085 1/min
0
0
1
1
6 Copyright © 2001 by ASME

Figure 14. Transmission error curves at N~ =1, for gears withprofiles with tip relief
For the general overview of transmission error evolution,selected curves are represented, generated at speeds in regionsof resonance points at 1~ =N , Fig.13. and 14. On horizontalaxis nominal angular position (time) of the pinion (driver), andreal angular position difference ∆ϕ1, related to the nominal one,on the vertical axis are given. The two first harmoniccomponents of transmission error curves were removed for thesake of the better identification of the differences.
As comparison basis, empirical density functions, obtainedwith function values at equidistant rotation angle, in stepfunction form are given as well, representing well the scatterbands. The curve shapes and density functions reflect clearlythe differences at different nominal mesh forces, and for the twotypes of profiles, with considerably bigger scatters at low loadlevels, for the profiles with tip relief.
7 FREQUENCY ANALYSIS OF TRANSMISSION ERROR CURVES
For analysing the frequency response of the system, Fourieranalysis of the angular displacement error curves was applied.On Fig. 15. and 16, Fourier analysis results are presented inform of line spectra. The values correspond to
∆φ1
φ1π 2π 3π0
FN=1000 N/mm, n1=1040 1/min
FN=500 N/mm, n1=960 1/min
FN=200 N/mm, n1 =800 1/min
FN=100 N/mm, n1=1190 1/min
FN=50 N/mm, n1=1185 1/min
different nominal loads at load dependent resonance points atN=1/2, at input speeds, given on the Figures. For allowing thetreatment in a common basis, Fourier components kC ,1ϕ∆ arerelated to the basic component )(,1 Nk FC ϕ∆ at ordinal numbercorresponding to fz, at nominal mesh force of 50N/mm, gearwith tip relief. Components of the frequencies of fz and 2fz areseparately represented for the resonance points at N~ =1/2 onFig. 17, and at 1~ =N (main resonance point) on Fig. 18. Forsake of comparison, results obtained with errorless toothing aregiven as well.Figure 15. Fourier components of angular displacement errorcurves at different load values for gears with normal profiles at
N~ =1/2
In resonance points at N~ =1/2, expressed minimum regioncan be found, for the tooting with tip relief. Minimum values forteeth with pitch error are bigger as for errorless toothing,however the general curve behaviour is not changed. Optimumvalue is located at the tip relief design value. Starting from theoptimum region in both directions, fz Fourier componentsincrease, especially at lower nominal loads. Fourier componentsfor normal toothing show a monotonic character, in wide regionabove the values of gears with tip relief.
3 53 106 159212
265318371424
1
0,8
0,6
0,4
0,2
n1=300 1/min
n1=350 1/minn1=300 1/min
n1=520 1/minn1=530 1/minn1=550 1/min
n1=560 1/min
50
100
200350
500700
1000FN [N/mm]
∆φ1
φ1
Ordinal number k
fz 2fz 3fz 4fz
C∆φ1,k
C∆φ1,fz(50)
7 Copyright © 2001 by ASME

Figure 16. Fourier components of angular displacement errorcurves at different load values for gears with tip relief at N~ =1/2
Values for errorless toothing and with pitch error do not showremarkable differences.
The 2fz values have an expressed minimum as well, atgreater nominal loads as that of fz. It is to remark, that the localmaximum for errorless toothing (the origin of which can beexplained with excitation intensity characteristics for errorlessexcitation function, not detailed here), disappear for gears withpitch error. At lower loads 2fz components fall down.
In resonance points at N=1, more concentrated optimumregions were found, with more pronounced minimum values.The optimum point for teeth with pitch error is at a slightlylower nominal load, as in the errorless case. At low nominalloads the fz components are decreasing, because of the non-regular system response, see Fig. 11. and 12.
Comparing the Fourier spectra on Fig. 15. and 16, theimportance of components on interval 1/2fz...fz at lower loadsfor teeth with tip relief is remarkable, tending to decrease withincreasing load. However, at higher loads, components infrequency interval fz...2fz are increasing. In case of normaltoothing, components under frequency fz show only a slightvariation. However, the components on greater frequencies areimportant on the whole load range, with relatively big values at3fz. The region of the bigger frequencies in case of teeth
106533 159212
265318
371424
4fz3fz2fzfz
Ordinal number k
1
0,8
0,6
0,4
0,2FN=50 N/mmn1=395 1/min
FN=100 N/mmn1=590 1/min
FN=200 N/mmn1=430 1/min
FN=350 N/mmn1=460 1/min
FN=500 N/mmn1=490 1/min
FN=1000 N/mmn1=550 1/min
FN=700 N/mmn1=600 1/min
∆φ1
φ1
C∆φ1,fz(50)C∆φ1,k
Figure 17. fz and 2 fz, Fourier components vs. nominal load fornormal toothing and with tip relief, in case of errorless teeth and
with pitch error at N~ =1/2
with relief is characterised in general by small componentvalues, predicting more convenient noise behaviour.
These results are in agreement with results of acousticmeasurements in [11], showing similar tendencies for noiseintensity in case of gears with tip relief.
8 CONCLUSIONSFor more realistic frequency response predictions in case of
gear transmissions, taking into account randomly distributedpitch error series, methods are proposed for system modellingallowing the introduction and modelling the effects ofmanufacturing errors and tooth mesh specialities of any kind.For system response analysis, simulation results for drivermovement was analysed, via Fourier analysis. Results haveshown, that difference in system behaviour for gears withnormal toothing and with tip relief can be detected and loaddependence of system response can be followed. The Fourierspectra show, that one can predict, even in case of gears withmanufacturing error, a more convenient system response incertain loads in case of gears with tip relief, i. e. better noisecharacteristics can be expected.
C∆φ1,fz(50)C∆φ1; 1,2fz
x 10-5 [rad]
1,25
1
0,75
0,5
0,25
1,25
1
0,75
0,5
0,25
15001000700500350100
FN [N/mm]
WBHKp
WBHp
fz2fzfz
2fzfz
2fz
normal errorlessnormal with pitch errorerrorless with tip relief
pitch error with tipli f
8 Copyright © 2001 by ASME
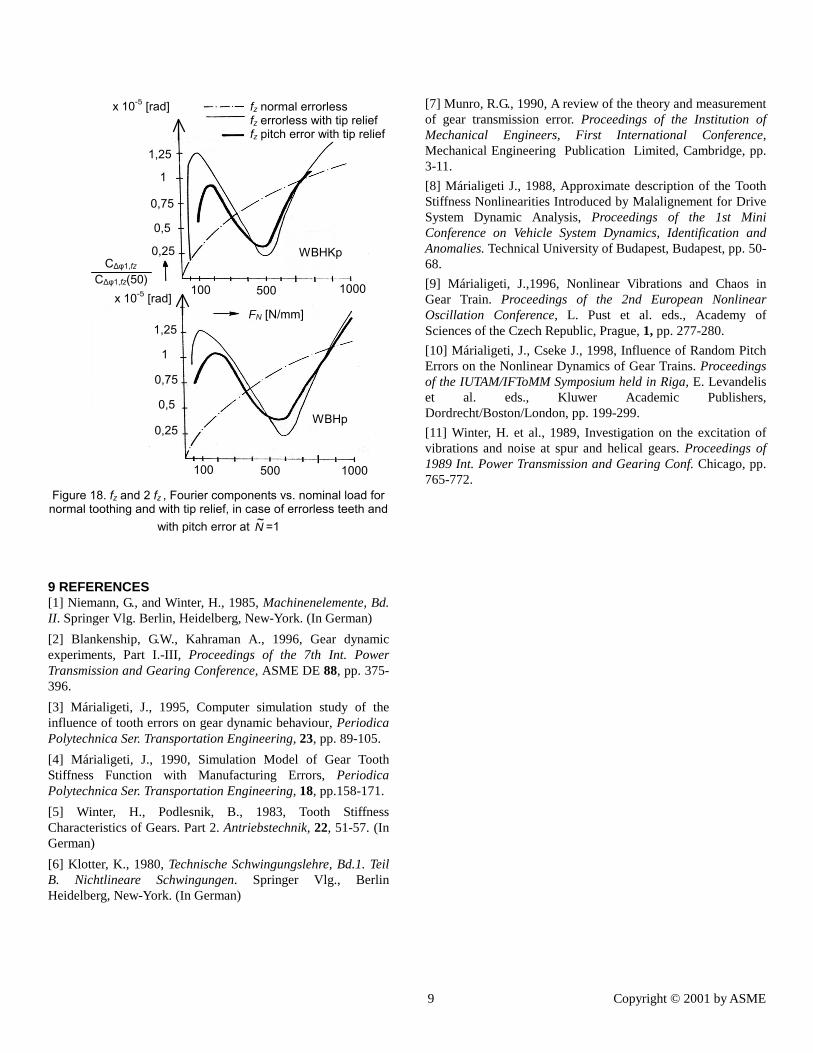
Figure 18. fz and 2 fz , Fourier components vs. nominal load fornormal toothing and with tip relief, in case of errorless teeth and
with pitch error at N~ =1
9 REFERENCES[1] Niemann, G., and Winter, H., 1985, Machinenelemente, Bd.II. Springer Vlg. Berlin, Heidelberg, New-York. (In German)[2] Blankenship, G.W., Kahraman A., 1996, Gear dynamicexperiments, Part I.-III, Proceedings of the 7th Int. PowerTransmission and Gearing Conference, ASME DE 88, pp. 375-396.[3] Márialigeti, J., 1995, Computer simulation study of theinfluence of tooth errors on gear dynamic behaviour, PeriodicaPolytechnica Ser. Transportation Engineering, 23, pp. 89-105.[4] Márialigeti, J., 1990, Simulation Model of Gear ToothStiffness Function with Manufacturing Errors, PeriodicaPolytechnica Ser. Transportation Engineering, 18, pp.158-171.[5] Winter, H., Podlesnik, B., 1983, Tooth StiffnessCharacteristics of Gears. Part 2. Antriebstechnik, 22, 51-57. (InGerman)[6] Klotter, K., 1980, Technische Schwingungslehre, Bd.1. TeilB. Nichtlineare Schwingungen. Springer Vlg., BerlinHeidelberg, New-York. (In German)
FN [N/mm]
C∆φ1,fz(50)C∆φ1,fz
x 10-5 [rad]
1,25
1
0,75
0,5
0,25
1,25
1
0,75
0,5
0,25
100 500 1000
100 500 1000
x 10-5 [rad]
WBHKp
WBHp
fz normal errorlessfz errorless with tip relieffz pitch error with tip relief
[7] Munro, R.G., 1990, A review of the theory and measurementof gear transmission error. Proceedings of the Institution ofMechanical Engineers, First International Conference,Mechanical Engineering Publication Limited, Cambridge, pp.3-11.[8] Márialigeti J., 1988, Approximate description of the ToothStiffness Nonlinearities Introduced by Malalignement for DriveSystem Dynamic Analysis, Proceedings of the 1st MiniConference on Vehicle System Dynamics, Identification andAnomalies. Technical University of Budapest, Budapest, pp. 50-68.[9] Márialigeti, J.,1996, Nonlinear Vibrations and Chaos inGear Train. Proceedings of the 2nd European NonlinearOscillation Conference, L. Pust et al. eds., Academy ofSciences of the Czech Republic, Prague, 1, pp. 277-280.[10] Márialigeti, J., Cseke J., 1998, Influence of Random PitchErrors on the Nonlinear Dynamics of Gear Trains. Proceedingsof the IUTAM/IFToMM Symposium held in Riga, E. Levandeliset al. eds., Kluwer Academic Publishers,Dordrecht/Boston/London, pp. 199-299.[11] Winter, H. et al., 1989, Investigation on the excitation ofvibrations and noise at spur and helical gears. Proceedings of1989 Int. Power Transmission and Gearing Conf. Chicago, pp.765-772.
9 Copyright © 2001 by ASME