Embed Size (px)
Citation preview

Final Report
Analysis of Impediments to Fair Housing Choice
Kansas City Region

Final Report
May 24, 2011
Analysis of Impediments to Fair Housing Choice
Prepared for
Johnson County, Kansas Kansas City, Kansas Leavenworth, Kansas Overland Park, Kansas Shawnee, Kansas Blue Springs, Missouri Independence, Missouri Kansas City, Missouri Lee’s Summit, Missouri Prepared by
BBC Research & Consulting 3773 Cherry Creek N. Drive, Suite 850 Denver, Colorado 80209-3868 303.321.2547 fax 303.399.0448 www.bbcresearch.com [email protected]

Table of Contents
BBC RESEARCH & CONSULTING i
I. Introduction and Executive Summary
Analysis of Impediments Background .......................................................................................... I–1
Fair Housing Act .......................................................................................................................... I–2
Geographic Areas Covered .......................................................................................................... I–2
Methodology .............................................................................................................................. I–4
Top Findings ............................................................................................................................... I–4
Fair Housing Action Plan ............................................................................................................... I-8
II. Community and Housing Profile
Population Demographics .......................................................................................................... II–2
Household Characteristics and Familial Status .......................................................................... II–16
Household Income ................................................................................................................... II–21
Persons with Disabilities ........................................................................................................... II–32
Employment............................................................................................................................. II–37
Housing ................................................................................................................................... II–39
III. Citizen and Stakeholder Input
Citizen Forums .......................................................................................................................... III–1
Stakeholder Survey .................................................................................................................... III–3
Advocate Respondent Profile ..................................................................................................... III–4
Housing Discrimination ............................................................................................................. III–5
Barriers to Fair Housing ............................................................................................................. III–7
Real-Estate Respondent Profile ................................................................................................... III–9
Barriers to Fair Housing ............................................................................................................. III–9
Addressing Fair Housing Issues ................................................................................................ III–12
Summary ................................................................................................................................ III–13
IV. Complaint, Legal and Lending Analysis
Fair Housing Complaints ........................................................................................................... IV–1
Legal Cases ................................................................................................................................ IV–7
Fair Lending Analysis ................................................................................................................. IV–9

Table of Contents
BBC RESEARCH & CONSULTING ii
V. Public Policies and Practices
Subsidized Rental Units .............................................................................................................. V–1
Land Use Policy Review ............................................................................................................ V–13
Other Public Sector Programs and Services ............................................................................... V–30
VI. Fair Housing Activities, Impediments and FHAP
Fair Housing Activities ............................................................................................................... VI–1
Fair Housing Impediments ......................................................................................................... VI–3
Fair Housing Action Plan ............................................................................................................ VI–7
APPENDICIES:
A. Public Meeting Materials ..................................................................................................... A–1

SECTION I. Introduction and Executive Summary
BBC RESEARCH & CONSULTING SECTION I, PAGE 1
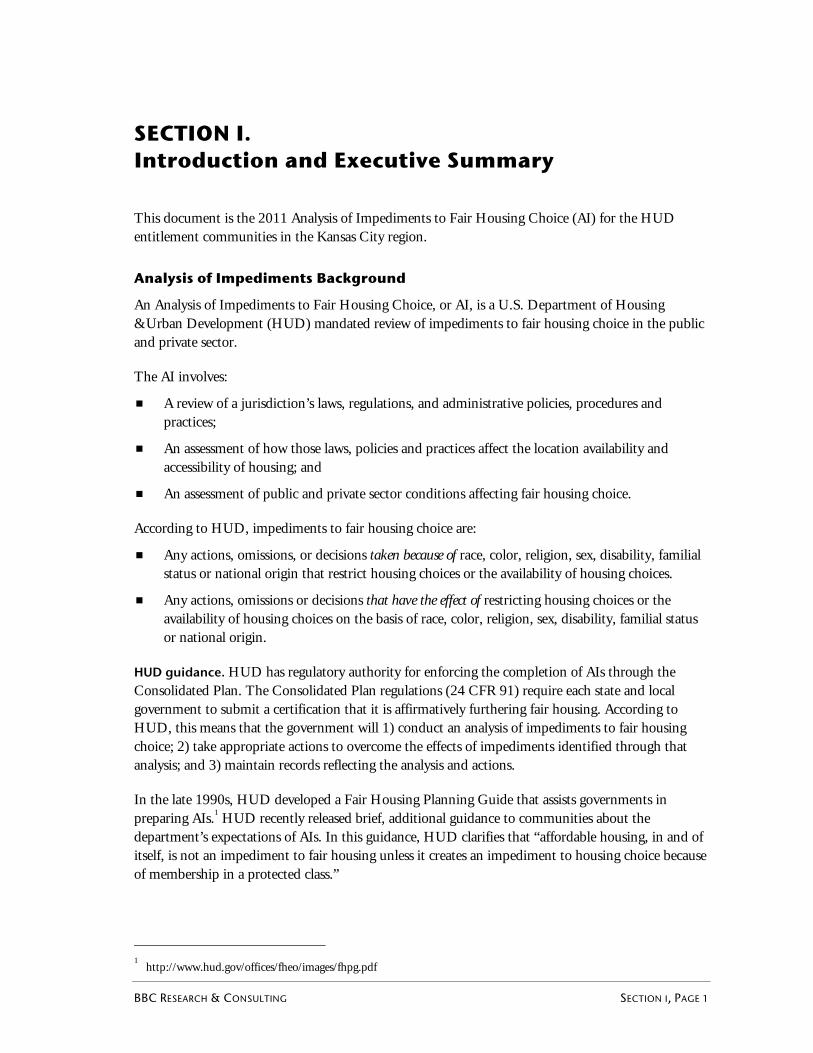
SECTION I. Introduction and Executive Summary
This document is the 2011 Analysis of Impediments to Fair Housing Choice (AI) for the HUD entitlement communities in the Kansas City region.
Analysis of Impediments Background
An Analysis of Impediments to Fair Housing Choice, or AI, is a U.S. Department of Housing &Urban Development (HUD) mandated review of impediments to fair housing choice in the public and private sector.
The AI involves:
A review of a jurisdiction’s laws, regulations, and administrative policies, procedures and practices;
An assessment of how those laws, policies and practices affect the location availability and accessibility of housing; and
An assessment of public and private sector conditions affecting fair housing choice.
According to HUD, impediments to fair housing choice are:
Any actions, omissions, or decisions taken because of race, color, religion, sex, disability, familial status or national origin that restrict housing choices or the availability of housing choices.
Any actions, omissions or decisions that have the effect of restricting housing choices or the availability of housing choices on the basis of race, color, religion, sex, disability, familial status or national origin.
HUD guidance. HUD has regulatory authority for enforcing the completion of AIs through the Consolidated Plan. The Consolidated Plan regulations (24 CFR 91) require each state and local government to submit a certification that it is affirmatively furthering fair housing. According to HUD, this means that the government will 1) conduct an analysis of impediments to fair housing choice; 2) take appropriate actions to overcome the effects of impediments identified through that analysis; and 3) maintain records reflecting the analysis and actions.
In the late 1990s, HUD developed a Fair Housing Planning Guide that assists governments in preparing AIs.1 HUD recently released brief, additional guidance to communities about the department’s expectations of AIs. In this guidance, HUD clarifies that “affordable housing, in and of itself, is not an impediment to fair housing unless it creates an impediment to housing choice because of membership in a protected class.”
1 http://www.hud.gov/offices/fheo/images/fhpg.pdf

PAGE 2, SECTION I BBC RESEARCH & CONSULTING
HUD further defines fair housing choice as “the ability of persons of similar incomes to have available to them the same housing choices regardless of race, color, religion, sex, disability, familial status or national origin. Policies, practices or procedures that appear neutral on their face but operate to deny or adversely affect the provisions of housing to persons (in any particular protected class) may constitute such impediments.”
Fair Housing Act
The Federal Fair Housing Act, passed in 1968 and amended in 1988, prohibits discrimination in housing on the basis of race, color, national origin, religion, gender, familial status and disability. The Fair Housing Act covers most types of housing including rental housing, home sales, mortgage and home improvement lending, and land use and zoning. Excluded from the Act are owner-occupied buildings with no more than four units, single family housing sold or rented without the use of a real estate agent or broker, housing operated by organizations and private clubs that limit occupancy to members, and housing for older persons.2
HUD has the primary authority for enforcing the Fair Housing Act. HUD investigates the complaints it receives and determines if there is a reasonable cause to believe that discrimination occurred. If reasonable cause is established, HUD brings the complaint before an Administrative Law Judge. Parties to the action can also elect to have the trial held in a federal court (in which case the Department of Justice brings the claim on behalf of the plaintiff).3
Geographic Areas Covered
The following communities participated in and are covered by this AI.
State of Kansas: State of Missouri:
Johnson County Blue Springs
Kansas City Independence
Leavenworth Kansas City
Overland Park Lee’s Summit
Shawnee
Data presented in this report for Johnson County exclude Shawnee and Overland Park, except for where noted.
2 This is a very general description of the Fair Housing Act and the actions and properties covered by the Act. For more
detailed information on the Fair Housing Act, please see the full text, which can be found on the U.S. Department of Justice’s website, www.usdoj.gov/crt/housing/title8.htm.
3 “How Much Do We Know? Public Awareness of the Nation’s Fair Housing Laws”, The U.S. Department of Housing
and Urban Development, Office of Policy and Research, April 2002.

BBC RESEARCH & CONSULTING SECTION I, PAGE 3
The Denver consulting firm BBC Research & Consulting completed this AI. The AI was coordinated by a working group with representatives from each of the jurisdictions. Contract oversight was maintained by Kansas City, Missouri Human Relations Department.
Figure I-1 shows a map of the region and jurisdictions covered by the AI.
Figure I-1. Regional Map of Jurisdictions
Source: BBC Research & Consulting.

PAGE 4, SECTION I BBC RESEARCH & CONSULTING
Methodology
BBC’s approach to the Kansas City regional AI was based on the methodologies recommended in HUD’s Fair Housing Planning Guide, Vol. I, our experience conducting AIs for other cities, and the workscope proposed for the study in response to the region’s request for proposals. The workscope consisted of the following:
Community and housing profile. Using current data on population and households from appropriate recently completed studies; the U.S. Census’ American Community Survey (ACS); Claritas projections on population and household characteristics, and other state and local data sources, BBC prepared a community and housing profile to provide background data for the AI.
Private market, fair housing activities and complaint data review. In this task, data on mortgage lending approvals, subprime mortgages (from Home Mortgage Disclosure Act or HMDA data), compliance with the Community Reinvestment Act (CRA), recent legal cases and fair housing complaints were analyzed to detect potential discriminatory patterns. We also reviewed the jurisdictions’ current and previous fair housing activities.
Policy review and analysis. For every city participating in the study, BBC reviewed city zoning, land use and planning and housing policies pertaining to residential housing for barriers to fair housing and fair housing concerns.
Community input. Resident and stakeholder input into the AI was received through key person interviews, an online and mail survey of real estate professionals and nonprofits, and four community forums.
Identification of impediments. In this task, we compiled the fair housing concerns identified through public participation, data analysis and review of land use policies into impediments to fair housing choice.
Actions to address past and current impediments. In this final task, BBC developed a recommended Fair Housing Action Plan (FHAP) for the cities in the region to use to address impediments identified in the current AI.
Top Findings
The following impediments were indentified through this research. The impediments are organized into regional impediments and city-specific impediments. These designations suggest if the remedies to address the impediments should be addressed regionally or by a specific city.
Impediments that need to be addressed regionally.
Regional Impediment No. 1. There is no coordinated effort to mitigate fair housing barriers and raise awareness of fair housing in the region. Each community in the region addresses fair housing education, outreach and enforcement independently and in some cases, differently. Some communities have a Human Rights Commission that oversees fair housing complaints; some refer residents seeking fair housing information to their City Clerk; two communities have the authority to enforce the Federal Fair Housing Act; some communities refer residents to HUD. A resident’s options differ depending on which community in which they reside.

BBC RESEARCH & CONSULTING SECTION I, PAGE 5
In the spirit of creating a regional fair housing system, there should be more coordination among communities and, ideally, one umbrella organization that is conducting fair housing education and outreach activities regionally.
Regional Impediment No. 2. Information about fair housing is difficult to find and can be confusing. Residents in the public forums conducted for this study said they did not know how to file a complaint or where to go to seek out fair housing information. Social service and housing providers who completed a fair housing survey for this study said most of their clients “do nothing” when faced with housing discrimination. A review of the jurisdictions’ websites found inconsistency in how fair housing information was communicated.
It should be noted, however, that in the fair housing survey they completed, real estate professionals identified few barriers related to lack of knowledge of fair housing issues in the real estate community.
Regional Impediment No. 3. Kansas City, MO contains high concentrations of minority and low income households. Kansas City, MO houses the majority of the region’s minority and low income populations: the city held 60 percent of the region’s African Americans and 46 percent of the region’s households earning less than $25,000 per year. This compares to 33 percent of the region’s population overall.
The region needs to provide more opportunities for racial and ethnic minorities and low income households to live in areas other than Kansas City, MO if they choose to.
Regional Impediment No. 4. Kansas City, MO has a disproportionate number of low rent units. An examination of the geographic location of the region’s public housing units and other HUD subsidized housing shows a significant concentration of units in Kansas City, MO (see Figure V-3 in Section V). More than half (51 percent) of all of the region’s public housing units and vouchers are provided by the Housing Authority of Kansas City, MO.
The region needs to provide more opportunities for very low income renters to live in areas other than Kansas City, MO if they choose to.
Regional Impediment No. 5. There is reportedly a shortage of accessible housing units. Attendees at one of the public forums held for this study mentioned a severe lack of handicapped accessible housing in the region. They also mentioned the discontinuation of KCMO’s barrier removal program as having a negative effect on persons with disabilities.

PAGE 6, SECTION I BBC RESEARCH & CONSULTING
Impediments to address by locality.
Local Impediment No. 1. Residents experience discrimination. Complaint data and a survey of stakeholders provide evidence that residents in the region experience housing discrimination. As shown in the following Figure I-2, all cities have had a share of the 577 complaints filed in the past 5 years (although in some cases, city officials were unaware that complaints had been filed).
Figure I-2. Share and Nature of Complaint by City, August 2005 through October 2010
Kansas City MSA
Kansas
Johnson County * 0% 0% 0% 0% 0% 0% 0%
Kansas City 18% 49% 24% 8% 6% 2% 10%
Leavenworth 1% 22% 33% 11% 22% 0% 11%
Overland Park 7% 35% 42% 13% 4% 4% 2%
Shawnee 3% 35% 50% 5% 0% 5% 5%
Missouri
Kansas City 60% 37% 28% 11% 5% 7% 12%
Independence 10% 33% 47% 5% 4% 5% 5%
Blue Springs 2% 47% 33% 0% 13% 7% 0%
Lee's Summit 2% 56% 25% 0% 13% 0% 6%
9%
Share of FamilyStatus
6%
Study Area Race Disability
31%
Complaints
39%
Other
10%
Gender
5%
Retaliation
Note: * Excluding Overland Park and Shawnee.
Source: HUD’s Kansas City Kansas Regional Office of Fair Housing and Equal Opportunity (FHEO).
The most common reasons for discrimination based on complaints and stakeholder surveys are race/ethnicity and disability. Placing tenants in the least desirable units, refusing to make reasonable accommodations and steering are the most common fair housing violations, according to stakeholders. Many stakeholders also cited “rent to own scams” as prevalent in the region.
Local Impediment No. 2. African Americans and Hispanics have much higher loan denial rates than Whites and Non-Hispanics. An In 2009, there were approximately 117,700 mortgage loan applications made in the Kansas City MSA. For the region overall, 64 percent of loans were approved and 16 percent denied (the others were withdrawn by the applicants, closed for incompleteness, etc).
Loan denial rates were much higher for African American and Hispanic applicants across all communities. Specifically,
In Johnson County, African American applicant mortgage loan denials were 8 percentage points higher than White applicants’. Hispanic applicant mortgage loan denials were 5 percentage points higher than non-Hispanic applicants’.
In Kansas City, KS, African American applicant mortgage loan denials were 14 percentage points higher than White applicants’. Hispanic applicant mortgage loan denials were also 14 percentage points higher than non-Hispanic applicants’.

BBC RESEARCH & CONSULTING SECTION I, PAGE 7
In Leavenworth, African American applicant mortgage loan denials were 8 percentage points higher than White applicants’. Hispanic applicant mortgage loan denials were 4 percentage points higher than non-Hispanic applicants’.
In Overland Park, African American applicant mortgage loan denials were 7 percentage points higher than White applicants’. Hispanic applicant mortgage loan denials were 5 percentage points higher than non-Hispanic applicants’.
In Shawnee, African American applicant mortgage loan denials were 6 percentage points higher than White applicants’. Hispanic applicant mortgage loan denials were 11 percentage points higher than non-Hispanic applicants’.
In Blue Springs, African American applicant mortgage loan denials were 7 percentage points higher than White applicants’. Hispanic applicant mortgage loan denials were 9 percentage points higher than non-Hispanic applicants’.
In Independence, African American applicant mortgage loan denials were 8 percentage points higher than White applicants’. Hispanic applicant mortgage loan denials were 9 percentage points higher than non-Hispanic applicants’.
In Lee’s Summit, African American applicant mortgage loan denials were 12 percentage points higher than White applicants’. Hispanic applicant mortgage loan denials were 7 percentage points higher than non-Hispanic applicants’.
In Kansas City, MO, African American applicant mortgage loan denials were 19 percentage points higher than White applicants’. Hispanic applicant mortgage loan denials were 10 percentage points higher than non-Hispanic applicants’. In addition, Kansas City, MO is the only community where the above average denial rates and presence of African Americans appear to be closely related.
In addition, 20 percent of respondents to the real estate survey conducted for this study indicated that predatory lending practices are a serious problem in the region.
Local Impediment No. 3. Jurisdictions need to improve some aspects of their public sector development and housing practices. Section V of this AI contains a comprehensive review of the participating jurisdictions’ land use and housing policies, including those of the public housing authorities. Although the review did not find egregious violations of the Federal Fair Housing Act, it did identify areas that may cause barriers to affordable housing development. These include:
No jurisdictions provide formal incentives to encourage the development of affordable and mixed-income housing.
Not all housing authorities allow residents to apply for public housing units and/or Section 8 vouchers by mailing in an application or completing an application online. Such policies can prevent persons with disabilities from fairly accessing housing.
Three public housing authorities have fewer than 5 percent of their public housing units that are accessible.
PAGE 8, SECTION I BBC RESEARCH & CONSULTING
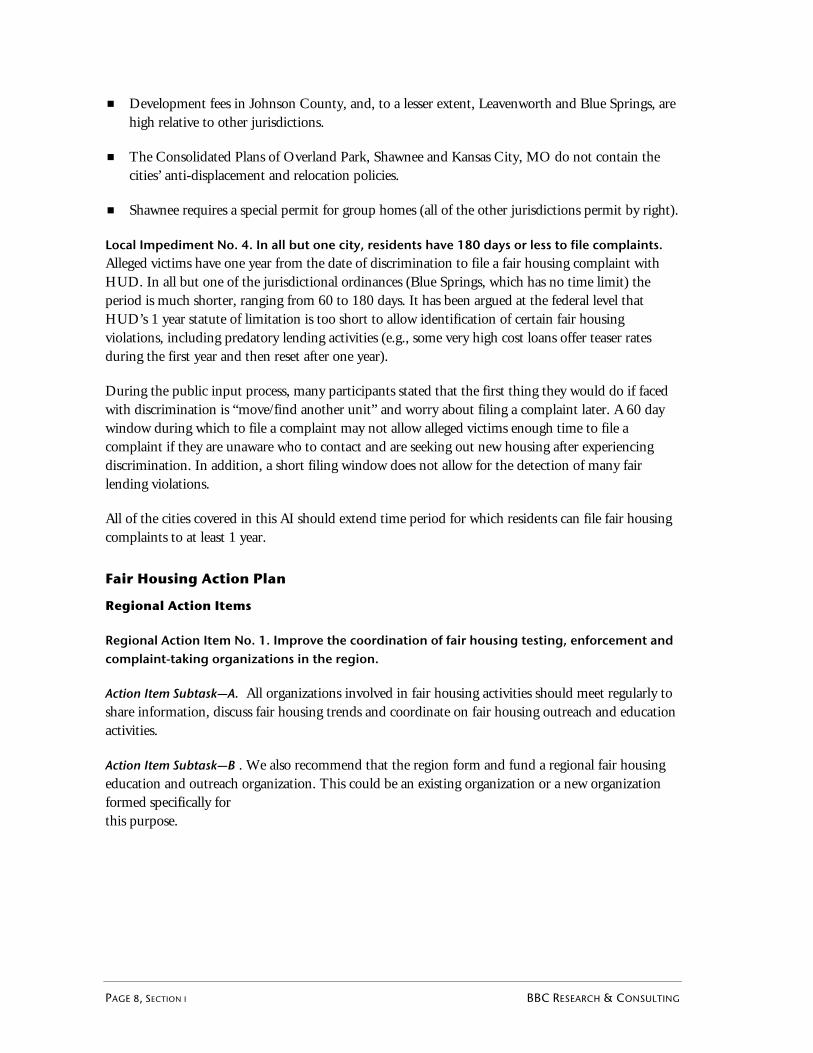
Development fees in Johnson County, and, to a lesser extent, Leavenworth and Blue Springs, are high relative to other jurisdictions.
The Consolidated Plans of Overland Park, Shawnee and Kansas City, MO do not contain the cities’ anti-displacement and relocation policies.
Shawnee requires a special permit for group homes (all of the other jurisdictions permit by right).
Local Impediment No. 4. In all but one city, residents have 180 days or less to file complaints. Alleged victims have one year from the date of discrimination to file a fair housing complaint with HUD. In all but one of the jurisdictional ordinances (Blue Springs, which has no time limit) the period is much shorter, ranging from 60 to 180 days. It has been argued at the federal level that HUD’s 1 year statute of limitation is too short to allow identification of certain fair housing violations, including predatory lending activities (e.g., some very high cost loans offer teaser rates during the first year and then reset after one year).
During the public input process, many participants stated that the first thing they would do if faced with discrimination is “move/find another unit” and worry about filing a complaint later. A 60 day window during which to file a complaint may not allow alleged victims enough time to file a complaint if they are unaware who to contact and are seeking out new housing after experiencing discrimination. In addition, a short filing window does not allow for the detection of many fair lending violations.
All of the cities covered in this AI should extend time period for which residents can file fair housing complaints to at least 1 year.
Fair Housing Action Plan
Regional Action Items
Regional Action Item No. 1. Improve the coordination of fair housing testing, enforcement and complaint-taking organizations in the region.
Action Item Subtask—A. All organizations involved in fair housing activities should meet regularly to share information, discuss fair housing trends and coordinate on fair housing outreach and education activities.
Action Item Subtask—B . We also recommend that the region form and fund a regional fair housing education and outreach organization. This could be an existing organization or a new organization formed specifically for this purpose.

BBC RESEARCH & CONSULTING SECTION I, PAGE 9
The activities this recommended organization would engage in include:
Website
i. The organization should maintain a central regional website with basic fair housing information, training course schedules, fair housing resources and events, transparent information about how each of the jurisdictions investigates and enforces fair housing, local fair housing contacts for each jurisdiction and complaint forms.
ii. The website should also be the central point for a housing accessibility registry that provides information about accessible, affordable housing opportunities in the region and allows residents seeking accessible housing to complete an inquiry form.
iii. In addition to providing basic information about fair housing the website should answer tricky questions like: Can renters be forced to move when their rental complex is being foreclosed upon? Do their rental agreements have to be honored?
iv. The website should also contain a standard lease agreement so that tenants could see what a fair lease agreement looks like when they are apartment hunting.
v. All information should be in English and Spanish
Fair Housing Activities
This organization should also be the lead organization on fair housing activities for the region. It should coordinate fair housing month events, work with local organizations to publicize their free fair housing training opportunities (e.g., those offered by the Kansas City Human Relations Department1), offer technical assistance to nonprofits whose clients have fair housing issues, potentially conduct fair housing testing, be the lead body for a regular regional housing summit or conference and coordinate funding of the enhanced SocialServe.com service.
Ideas for education and outreach activities that were contributed by attendees at the public forums include:
vi. Placing public service announcements (PSAs) about fair housing rights and good lending practices in For Rent magazines;
vii. Holding financial literacy and fair housing training after ESL classes, as part of diversity training classes;
viii. Improving the fair housing information on 211 and 311 sites (e.g., hotlines available to residents for information and referral services).
The organization should be funded through annual contributions from the jurisdictions from CDBG or General Funds, grants from HUD and potentially contributions by banks to meet their CRA requirements and regional public housing authorities.

PAGE 10, SECTION I BBC RESEARCH & CONSULTING
Regional Action Item No. 2. Disperse affordable housing opportunities regionally. As shown by Figure V-3, public housing and HUD subsidized units are heavily concentrated in Kansas City, MO.
The region needs to work cooperatively to provide more affordable housing opportunities—particularly for very low income renters—outside of Kansas City, MO and, to a lesser extent, Kansas City, KS.
As the housing market gains strength, all jurisdictions should focus on including mixed-income homeownership and affordable rental housing into newly developed housing. Areas where affordable housing is lacking—particularly on the western side of the region—should actively pursue Section 202, Section 108 and Low Income Housing Tax Credit developments. Providing a mix of residential products and building uses is consistent with the jurisdictions’ planning visions, as articulated in their Comprehensive Plans.
The region’s least affordable cities, including Overland Park, Lee’s Summit, Shawnee and Johnson County must provide incentives—fee waivers, streamlined development processes, land acquisition—for developers to integrate affordable units, particularly affordable rental units, into market rate housing. At the time this AI was prepared, none of the jurisdictions had formal programs to incentivize developers to include affordable and mixed-income housing into their developments.
Action Item Subtask—C. Incentives should be offered and encouraged in the region’s least affordable cities, especially for very affordable rental units, to encourage balanced housing communities in all jurisdictions.
Regional Action Item No. 3. Educate residents about personal finance and work with lenders to mitigate loan denial disparities. The region needs to raise its “housing literacy,” to both build better credit for minorities who are denied loans at much higher rates than whites and prevent residents from being taken advantage of by scams.
Action Item Subtask—D. The organization recommended in Action Item No. 1 could be the clearinghouse for fair lending information, including examples of scams and what residents should avoid. It could also coordinate and publicize regional efforts of homeownership counseling and foreclosure assistance.
Regional Action Item No. 4. Evaluate the demand for and increase accessible housing units. The jurisdictions in the region should review the adequacy of their current requirements for accessible units. If after consulting with service providers and surveying people with disabilities about how well their homes meet their accessibility needs, jurisdictions may want to consider raising the required percentage of accessible units in new construction and reestablishing or developing programs that fund accessibility improvements to residents’ homes.
In addition, the region should create and maintain a list of providers of accessible rental units and provide this list to nonprofits like The Whole Person. The jurisdictions may also want to jointly sponsor an event like an “accessibility fair” where residents who have questions about accessibility improvements learn about how these improvements can be made and the reasonable cost range for such repairs, as well as what the repairs should cost.

BBC RESEARCH & CONSULTING SECTION I, PAGE 11
Local Action Items
Local Action Items No. 1. Improve and make more uniform fair housing information on jurisdictional websites.
Action Item Subtask—E. Improve fair housing information on websites.
i. The State of Missouri Commission on Human Rights has an excellent website dedicated to filing a complaint. The website is easily found through a Google search using “housing discrimination Missouri.” All Missouri cities should have a link to the State’s Commission on Human Rights website, http://www.labor.mo.gov/mohumanrights/File_Complaint.
In addition, the following changes should be made to the jurisdictions’ and state websites:
ii. Blue Springs should add a “What should I do if I feel I have been discriminated against in finding housing?” question with a link to the Missouri Commission on Human Rights to its FAQ on its website of http://www.bluespringsgov.com/index.aspx?NID=189. The city does not have any source of fair housing information easily accessible on its website.
iii. Independence has a website about fair housing, “Fair Housing – General Information”. It would be useful if the website linked to the State’s Commission on Human Rights website (see above), in addition to HUD’s website, as the state’s website may be easier to understand by residents not familiar with fair housing.
iv. Lee’s Summit has fair housing information on the webpage of its Human Relations Commission, which includes an easy-to-complete online form that residents can send if they need more information on housing discrimination. This webpage is accessed through the Board and Commissions link. Residents who do not know that such a commission exists will not think to look at this link for fair housing information. The city should add a “What should I do if I feel I have been discriminated against in finding housing?” question with a link to its Human Relations Commission webpage to its FAQ list.
v. Kansas City, Missouri has a website dedicated to civil rights and fair housing enforcement, which includes the ability to file a complaint online (http://www.kcmo.org/CKCMO/Depts/ CityManagersOffice/HumanRelationsDivision/CivilRightsEnforcementSection/index.htm). The process covers violations that fall under the city’s ordinance only. The city should also add Fair Housing in its Housing Information list on http://www.kcmo.org/CKCMO/Residents/index.htm
vi. Missouri’s Housing Development Commission does not have a fair housing link on its home page http://www.mhdc.com/). It should have a link to the Commission on Human Rights.
vii. Kansas City, Kansas. We were unable to find information about filing a complaint or a fair housing contact on the following website( http://www.wycokck.org/Internetdept.aspx?id= 302&menu_id=1452&banner=15284). The city needs to have a webpage dedicated to fair housing information and resources, including how to file a fair housing complaint.

PAGE 12, SECTION I BBC RESEARCH & CONSULTING
viii. Johnson County has some fair housing information on its community development webpage, but the content could be improved and should also appear on the Health and Human Services webpage. Fair housing information should be added to its Housing link at http://hsa.jocogov.org/housing/housing.shtml. “Housing Discrimination” should also appear in the A-Z index on the county’s website. A good model from a county similar to Johnson in Colorado can be found at http://www.douglas.co.us/CDBG/Fair_Housing.html
ix. Leavenworth should add a “What should I do if I feel I have been discriminated against in finding housing?” question with a link to the Kansas Human Rights Commission and HUD’s regional fair housing offices to its FAQ on its website. The city does not have any source of fair housing information easily accessible on its website.
x. Overland Park should also add a “What should I do if I feel I have been discriminated against in finding housing?” question with a link to the Kansas Human Rights Commission and HUD’s regional fair housing offices to its FAQ on its website. The city does not have any source of fair housing information easily accessible on its website.
In addition, the city should have more direct information about its local fair housing ordinance, how to file a complaint with the city and a link to its ordnance on the Fair Housing Commission webpage at http://www.opkansas.org/Boards-and-Commissions/Detail/Boards-and-Commissions/Fair-Housing-Committee
xi. Shawnee has very little fair housing information on its website. Searches of “fair housing” and “housing discrimination” turn up a list of interesting reports and statistics, but nothing to assist a resident who feels they have been discriminated against. The city needs to have a webpage dedicated to fair housing information and resources, including how to file a fair housing complaint at the state and federal level.
xii. In addition, there should be an effort to improve the visibility and the information on the website of the Kansas Human Rights Commission. Although the website is managed at the state level, it is a resource for fair housing information for small communities in the state. It is important that the state website is visible and contains helpful information that may not appear on local websites.
Google searches for “fair housing Kansas” or “housing discrimination Kansas” do not lead to the Human Rights Commission page; instead, the Kansas City Housing Corporation is listed. We recommend that The Kansas Human Rights Commission needs to raise its visibility on search engines like Google.
The Kansas Human Rights Commission webpage has useful information on the state’s law and links to various forms, yet the process for filing a complaint is not transparent. For example, the website reads:
“KHRC's intake department is located in the Topeka office and is responsible for drafting complaints filed with the agency. A complaint may be filed personally or by attorney. An individual may write, telephone or come in to one of the Kansas Human Rights Commission's offices to begin the filing process. If the complaint falls within the Commission's jurisdiction, a formal complaint may be submitted. Intake workers are available to assist in drafting a complaint based on information
BBC RESEARCH & CONSULTING SECTION I, PAGE 13
provided by the complainant. The intake department also provides inquirers with referrals to other agencies for issues outside of KHRC's jurisdiction. The complaint must be signed and notarized before it can be officially filed with the Commission. A complaint alleging racial or other profiling is not required to be notarized.”
We recommend that:
The address and phone number to call to file a complaint should be visible and easy to find.
Complaints should be able to be filed online without a required notarized signature, which can be a barrier to filing a complaint, especially for persons with disabilities.
All jurisdictions located in Kansas should have links to the Kansas Human Rights Commission website at http://www.khrc.net/complaint.html, especially once these improvements have been made.
Local Action Item No. 2. The statute of limitations for filing fair housing complaints in local ordinances should be extended. Alleged victims have one year from the date of discrimination to file a fair housing complaint with HUD. In almost all of the jurisdictional ordinances the period is much shorter. Action Item Subtask—F. We recommend that the time period for filing a complaint is extended to at least 1 year if not longer.
Local Action Item No. 3. Jurisdictions need to improve some aspects of their zoning and land use regulations. Section V of this AI contains a comprehensive review of the participating jurisdictions’ land use and housing policies, including those of the public housing authorities. Although the review did not find egregious violations of the Federal Fair Housing Act, it did identify areas that may cause barriers to affordable housing development.
Action Item Subtask—G. To improve their zoning and land use regulations, the jurisdictions should:
i. The region’s most expensive jurisdictions, where affordable rental housing is lacking, should provide formal incentives to encourage the development of affordable and mixed-income housing.
ii. All housing authorities should allow residents to apply for public housing units and/or Section 8 vouchers by mailing in an application or completing an application online. This ensures fair access to publicly provided housing regardless of disability.
iii. Three public housing authorities have fewer than 5 percent of their public housing units that are accessible and need to work to reach the 5 percent accessibility standard.
iv. Development fees in Johnson County, and, to a lesser extent, Leavenworth and Blue Springs, are high relative to other jurisdictions. These communities should provide fee waivers for construction of affordable housing. The fee waivers should be based on a sliding scale with rental units affordable to 50 percent of the MFI and less receiving the largest amount of waiver.
v. The Consolidated Plans of Overland Park, Shawnee and Kansas City, MO do not contain the cities’ anti-displacement and relocation policies, and they should.
vi. Shawnee requires a special permit for group homes (all of the other jurisdictions permit by right). Shawnee should permit group homes by right.

PAGE 14, SECTION I BBC RESEARCH & CONSULTING
vii. In order to be more transparent and forthcoming concerning a jurisdictions’ zoning regulations of group homes, it is recommended jurisdictions include their definition of group home, which is similar to their respective State Statutes, in an easy to find and easy to understand manner. A good example of this is to include this type of group home in their definition of “family” or “household,” or however the jurisdiction determines who occupies the dwelling units. Both Kansas City, KS and Kansas City, MO do a good job of this by including this type of group home in their definitions of family/household.

SECTION II. Community and Housing Profile

BBC RESEARCH & CONSULTING SECTION II, PAGE 1
SECTION II. Community and Housing Profile
This section provides a community and housing profile for the jurisdictions participating in the AI. It includes the racial/ethnicity and income concentration maps required by HUD for AIs.
The data collected and analyzed for this section were primarily gathered from the following sources: the 2000 U.S. Census for historical context; 2006 to 2008 American Community Survey (ACS) 3-year survey for current estimates;1 2009 Claritas, a provider of commercial data estimates, for Census Tract level estimates; and, the Mid-American Regional Council (MARC). Data for Johnson County are presented in two ways: Johnson County (total) includes all of Johnson County and Johnson County (partial) does not include data for Overland Park and Shawnee.
Although some of the largest communities included in this study are represented in the ACS 1-year estimates, the 3-year estimates are used to ensure consistency for the entire study area.
Housing and demographic summary.
Kansas City, MO and, to a lesser extent, Kansas City, KS are the two cities in the region with the largest concentrations of African American and Hispanic residents. The cities, in addition to Independence, also have the highest concentrations of low income populations. Persons with disabilities and single parent households are more dispersed regionally.
Unemployment in the region has increased consistent with the economic downturn, but remains slightly below the U.S. average. The region is fortunate to have many large companies with professional and technical jobs that pay relatively high wages.
Overall, the region is very affordable. Households earning more than $25,000 per year can rent or buy in most communities without being cost burdened. Overall, 69 percent of households own the home in which they live, while 31 percent are renters. Johnson County, Shawnee, Blue Springs and Lee’s Summit have higher homeownership rates than the MSA, while Kansas City, KS, Leavenworth, Overland Park, Independence and Kansas City, MO have lower homeownership rates than the MSA.
Rental rates have increased throughout the study area since 2000. Lee’s Summit experienced the greatest percentage increase in rental rates (37 percent); as a result of the increase, renter households must earn $30,000 or more annually to afford the median rent. Kansas City, KS and Kansas City, MO continue to offer the most affordability for the region’s renters. Renter households earning approximately $20,000 each year can afford the median priced rental unit in these cities.
1 The American Community Survey provides 1-year estimates for communities with populations greater than 65,000.
Three-year estimates from the ACS are provided for communities with populations greater than 20,000. Since not all communities participating in this report are included in the 1-year estimates, the 3-year estimates are used for consistency.

PAGE 2, SECTION II BBC RESEARCH & CONSULTING
The value of owner-occupied housing units in the MSA has remained unchanged since 2000. This is good news for potential homebuyers, but is unfortunate for many long-time homeowners whose homes may not have appreciated in the last 10 years. Overland Park’s median home value of $160,900 is the highest in the study area, whereas the median home value of $51,900 in Kansas City, KS is lowest.
Population Demographics
The following figure displays population information for the participating jurisdictions for 2000, 2008 and 2010. Johnson County has grown by nearly 23 percent since 2000; Overland Park and Shawnee accounted for 37 percent of the growth in Johnson County. The population in Lee’s Summit grew by 29 percent between 2000 and 2010, which was the highest growth percentage among the Missouri communities in the study area. Kansas City, KS and Leavenworth have lost population since 2000.
Figure II-1. Population by Community, 2000 to 2008
Note: 2010 Census data not available for the Kansas City MSA. Source: 2000 and 2010 Census, American Community Survey 2006-2008 3-year estimate.
Kansas City MSA
Kansas
Johnson County (Total) 451,086 524,723 554,179 22.9%
Johnson County (Partial) 254,086 298,868 318,598 25.4%
Kansas City 146,867 141,984 145,786 -0.7%
Leavenworth 35,304 34,497 35,251 -0.2%
Overland Park 148,848 164,982 173,372 16.5%
Shawnee 48,152 60,873 62,209 29.2%
Missouri
Blue Springs 47,990 51,513 52,575 9.6%
Independence 113,207 118,520 116,830 3.2%
Kansas City 441,269 435,825 459,787 4.2%
Lee's Summit 71,074 91,431 91,364 28.5%
Percent Growth
2000 to 20102000 2008 2010
2,041,842 1,776,062 N/A
Age distribution. Figure II-2 compares the age distribution of each community’s population in 2000 and 2008. As seen in the figure, all communities experienced a decline, albeit small, in the percentage of young adults (aged 25 to 44), as well as growth in the proportion of baby boomers (aged 45 to 64). This demographic shift indicates an aging of the region, which is occurring throughout the country. It also indicates a stable population that has remained in the area through adulthood.

BBC RESEARCH & CONSULTING SECTION II, PAGE 3
Figure II-2. Age Distribution of Population, 2000 and 2008
2000
Infants and Toddlers (0 to 4) 7% 8% 8% 8% 7% 8% 8% 7% 7% 8%
School Aged Kids (5 to 17) 20% 20% 20% 19% 19% 19% 22% 17% 18% 21%
College Age Adults (18 to 24) 7% 8% 11% 9% 7% 8% 9% 9% 10% 6%
Young Adults (25 to 44) 33% 33% 30% 35% 33% 34% 32% 29% 33% 33%
Baby Boomers (45 to 64) 23% 22% 20% 19% 23% 23% 22% 23% 21% 21%
Seniors (65 and older) 10% 9% 12% 10% 12% 9% 7% 16% 12% 10%
2008
Infants and Toddlers (0 to 4) 7% 8% 9% 7% 7% 8% 8% 8% 8% 7%
School Aged Kids (5 to 17) 19% 19% 20% 17% 18% 19% 20% 17% 17% 22%
College Age Adults (18 to 24) 9% 9% 9% 10% 8% 8% 7% 8% 9% 7%
Young Adults (25 to 44) 29% 29% 28% 32% 29% 30% 28% 26% 30% 28%
Baby Boomers (45 to 64) 26% 26% 24% 24% 27% 26% 28% 27% 25% 26%
Seniors (65 and older) 10% 10% 10% 10% 12% 9% 8% 15% 11% 10%
Percent Changein 2000-2008
Infants and Toddlers (0 to 4) 0% 0% 1% -1% 0% 0% 0% 2% 0% -1%
School Aged Kids (5 to 17) -1% -1% -1% -2% -1% 0% -1% -1% -1% 1%
College Age Adults (18 to 24) 1% 1% -1% 1% 1% 0% -2% -1% -1% 0%
Young Adults (25 to 44) -4% -4% -2% -4% -4% -4% -4% -4% -3% -5%
Baby Boomers (45 to 64) 4% 4% 5% 5% 3% 3% 6% 4% 5% 5%
Seniors (65 and older) 0% 1% -1% 0% 1% 0% 1% 0% 0% 0%
Springs Independence City SummitBlue Kansas Lee's
(Total) (Partial) City Leavenworth Park Shawnee County County Kansas Overland
City Summit
Kansas Missouri
Johnson Johnson
Kansas Lee's (Total) (Partial) City Leavenworth Park Shawnee Springs Independence
Kansas Overland Blue
Missouri
Johnson Johnson
Park Shawnee Springs Independence City Summit County
(Partial) City Leavenworth(Total)
Kansas
County County
Kansas Lee's Kansas Overland Blue JohnsonJohnson County
MissouriKansas
Source: American Community Survey 2006-2008 3-year estimate.
Figures II-3 and II-4 examine the study area’s baby boomer and senior populations in greater detail. Since 2000, all communities have experienced a proportional increase in residents aged 45 to 64. For many communities, one out of every four residents falls within the baby boomer category.

PAGE 4, SECTION II BBC RESEARCH & CONSULTING
Figure II-3. Percentage of Baby Boomers, 2000 and 2008
Johnson County (total)
Johnson County (partial)
Kansas City
Leaven-worth
Overland Park
Shawnee Blue Springs
Indepen-dence
Kansas City
Lee's Summit
0%
5%
10%
15%
20%
25%
30%
35%
40%
22.6
% 26.2
%
22.4
% 26.4
%
19.6
%
24.1
%
18.8
%
24.1
%
23.1
% 26.6
%
23.0
% 25.7
%
22.5
%
28.0
%
22.9
% 26.6
%
20.6
%
25.3
%
21.4
%
25.9
%
2000
2008
100%
Kansas Missouri
Source: American Community Survey 2006-2008 3-year estimate.
Figure II-4 displays the proportion of seniors by Census Tract to determine where the highest concentrations of seniors reside within the study area. High concentrations—areas where seniors comprise greater than 21 percent of the Census Tract’s total population—occur throughout the area, but notable concentrations are located in the northern portion of Overland Park, the southwest portion of Independence, and the southern portion of Kansas City, MO.2
Race and ethnicity. In its surveys, the Census asks two different questions about race and ethnicity: the first question asks respondents to identify their race; the second asks whether respondents are of Hispanic/Latino origin. The Census Bureau does not classify
2 Seniors represent 11 percent of the Kansas City MSA’s total population.
Figure II-4. Percent Seniors (Age 65 and older) by Census Tract, 2009
Source: Claritas, 2009.

BBC RESEARCH & CONSULTING SECTION II, PAGE 5
Hispanic/Latino as a race, but rather as an identification of origin and ethnicity. If a respondent reported Hispanic/Latino ethnicity but did not mark a specific race category, they are classified in the “Some Other Race” category. Persons of Hispanic/Latino descent most commonly report their race as White or Some Other Race.
Figure II-5 displays the racial composition of each community’s population in 2008. Most of the communities contain predominantly white residents, with the exception of Kansas City, KS and Kansas City, MO, which have the highest proportions of African Americans.
Figure II-5 Racial Composition, 2008
Kansas
Johnson County (total) 461,782 20,087 1,623 19,781 446 9,973 11,031
Johnson County (partial) 265,328 0 12,081 0 971 8,779 397 5,243 6,069
Kansas City 80,630 39,813 1,145 2,733 21 14,588 3,054
Leavenworth 26,503 5,427 305 355 40 638 1,229
Overland Park 143,945 5,179 489 9,097 0 3,132 3,140
Shawnee 52,509 2,827 163 1,905 49 1,598 1,822
Missouri
Blue Springs 47,489 1,790 267 527 91 321 1,028
Independence 106,029 4,725 288 1,287 257 2,989 2,945
Kansas City 273,782 124,789 1,698 8,870 826 14,102 11,758
Lee's Summit 79,773 6,966 147 1,622 140 698 2,085
Kansas
Johnson County (total) 88% 4% 0% 4% 0% 2% 2%
Johnson County (partial) 89% # 4% # 0% 3% 0% 2% 2%
Kansas City 57% 28% 1% 2% 0% 10% 2%
Leavenworth 77% 16% 1% 1% 0% 2% 4%
Overland Park 87% 3% 0% 6% 0% 2% 2%
Shawnee 86% 5% 0% 3% 0% 3% 3%
Missouri
Blue Springs 92% 3% 1% 1% 0% 1% 2%
Independence 89% 4% 0% 1% 0% 3% 2%
Kansas City 63% 29% 0% 2% 0% 3% 3%
Lee's Summit 87% 8% 0% 2% 0% 1% 2%
More RacesWhite African
Alone American Indian Asian Hawaiian Other Race
Alone American Indian Asian Hawaiian Other RaceAmerican Native Some Two or
Two or More Races
White African American Native Some
Source: American Community Survey 2006-2008 3-year estimate.
In 2008, 15 percent of all residents in the U.S. identified themselves as being of Hispanic origin. As seen in Figure II-6, the study area contains a comparatively small proportion of Hispanic residents, with the exception of Kansas City, KS. However, since 2000, the Hispanic population has grown in every community within the study area, with some communities more than doubling their number of Hispanic residents.

PAGE 6, SECTION II BBC RESEARCH & CONSULTING
Figure II-6. Hispanic Residents, 2008
Kansas
Johnson County (total) 17,873 4% 30,655 6% 72%
Johnson County (partial) 10,222 4% 19,199 6% 88%
Kansas City 24,597 17% 33,761 24% 37%
Leavenworth 1,740 5% 2,023 6% 16%
Overland Park 5,559 4% 7,404 4% 33%
Shawnee 2,092 4% 4,052 7% 94%
Missouri
Blue Springs 1,170 2% NA NA NA
Independence 4,010 4% 8,539 7% 113%
Kansas City 30,374 7% 40,074 9% 32%
Lee's Summit 1,434 2% 2,428 3% 69%
Population
Growth
2000 and 2008Percent of
Percent
Number PopulationPercent of
20082000Between
Number
Note: Data on Hispanic residents not available for Blue Springs in the American Community Survey 2006-2008 3-year estimate.
Source: American Community Survey 2006-2008 3-year estimate.
The following maps display the geographic distribution of residents by race and ethnicity for each jurisdiction in the study. Maps display the distribution of non-white residents, African Americans, and Hispanic residents and highlight areas of racial and ethnic concentrations. Census Tracts shaded dark blue, represented in the third category on the map keys, contain concentrations.
For the purposes of this study, concentrations represent areas where persons of a particular race or ethnicity comprise a larger proportion of the population than the community overall. To align with HUD’s definition of “disproportionate need,” concentrations occur when the percentage of residents of a particular racial or ethnic group is 10 percent or more than the community-wide average. For example, if 20 percent of residents in a particular Census Tract are African American and African Americans comprise 10 percent of a community’s population overall, that Census Tract contains a concentration of African American residents.

BBC RESEARCH & CONSULTING SECTION II, PAGE 7
Johnson County, Kansas
Four percent of Johnson County’s residents are African American and 6 percent are Hispanic. Johnson County has no areas of concentration for African Americans and just a handful of Census Tracts with Hispanic concentrations.
Figure II-7. Percent Non-White Residents of Total Population by Census Tract, Johnson County, Kansas, 2009
Source: Claritas, 2009.
Figure II-8. Percent African American Residents of Total Population by Census Tract, Johnson County, Kansas, 2009
Source: Claritas, 2009.
Figure II-9. Percent Hispanic Residents of Total Population by Census Tract, Johnson County, Kansas, 2009
Source: Claritas, 2009.

PAGE 8, SECTION II BBC RESEARCH & CONSULTING
Kansas City, Kansas
Twenty-eight percent of residents in Kansas City, KS are African American and 24 percent are Hispanic. The heaviest concentrations of African American and non-white residents in Kansas City, KS lie in the central and northeast portions of the city. Hispanic residents are more heavily concentrated in the southeast portion of the city, south of the I-70 corridor.
Figure II-10. Percent Non-White Residents of Total Population by Census Tract, Kansas City, Kansas, 2009
Source: Claritas, 2009.
Figure II-11. Percent African American Residents of Total Population by Census Tract, Kansas City, Kansas, 2009
Source: Claritas, 2009.
Figure II-12. Percent Hispanic Residents of Total Population by Census Tract, Kansas City, Kansas, 2009
Source: Claritas, 2009.

BBC RESEARCH & CONSULTING SECTION II, PAGE 9
Leavenworth, Kansas
Sixteen percent of Leavenworth’s residents are African American and 6 percent are Hispanic. Non-white residents are dispersed throughout the northern and southern portions of Leavenworth, The most notable concentration of African American residents is apparent in the city’s north central Census Tract.
Figure II-13. Percent Non-White Residents of Total Population by Census Tract, Leavenworth, Kansas, 2009
Source: Claritas, 2009.
Figure II-14. Percent African American Residents of Total Population by Census Tract, Leavenworth, Kansas 2009
Source: Claritas, 2009.
Figure II-15. Percent Hispanic Residents of Total Population by Census Tract, Leavenworth, Kansas, 2009
Source: Claritas, 2009.

PAGE 10, SECTION II BBC RESEARCH & CONSULTING
Overland Park, Kansas
Eight-seven percent of residents in Overland Park consider themselves racially white, and its largest minority group is Asian (6 percent). An additional 3 percent of residents are African American, and 4 percent are Hispanic. Hispanic residents in Overland Park are more likely to reside in the northern portion of the city.
Figure II-16. Percent Non-White Residents of Total Population by Census Tract, Overland Park, Kansas, 2009
Source: Claritas, 2009.
Figure II-17. Percent African American Residents of Total Population by Census Tract, Overland Park, Kansas, 2009
Source: Claritas, 2009.
Figure II-18. Percent Hispanic Residents of Total Population by Census Tract, Overland Park, Kansas, 2009
Source: Claritas, 2009.

BBC RESEARCH & CONSULTING SECTION II, PAGE 11
Shawnee, Kansas
Five percent of Shawnee’s population identifies themselves as racially African American, and 7 percent are ethnically Hispanic. By the HUD definition of concentration, there are no areas of concentration for African Americans. Hispanic concentrations are located in east Shawnee.
Figure II-19. Percent Non-White Residents of Total Population by Census Tract, Shawnee, Kansas, 2009
Source: Claritas, 2009.
Figure II-20. Percent African American Residents of Total Population by Census Tract, Shawnee, Kansas, 2009
Source: Claritas, 2009.
Figure II-21. Percent Hispanic Residents of Total Population by Census Tract, Shawnee, Kansas, 2009
Source: Claritas, 2009.

PAGE 12, SECTION II BBC RESEARCH & CONSULTING
Blue Springs, Missouri
Ninety-three percent of residents in Blue Springs consider themselves racially white, which is the largest proportion of white residents within the study area. Its small proportions of African American (3 percent) and Hispanic residents reside through the city.
Figure II-22. Percent Non-White Residents of Total Population by Census Tract, Blue Springs, Missouri, 2009
Source: Claritas, 2009.
Figure II-23. Percent African American Residents of Total Population by Census Tract, Blue Springs, Missouri, 2009
Source: Claritas, 2009.
Figure II-24. Percent Hispanic Residents of Total Population by Census Tract, Blue Springs, Missouri, 2009
Source: Claritas, 2009.

BBC RESEARCH & CONSULTING SECTION II, PAGE 13
Independence, Missouri
Ninety percent of Independence’s residents consider themselves racially white. African American residents comprise 4 percent of the city’s total population. Census Tracts with the highest proportions of Hispanic residents are located in the city’s northwest and northern portions, although no concentrated areas exist.
Figure II-25. Percent Non-White Residents of Total Population by Census Tract, Independence, Missouri, 2009
Source: Claritas, 2009.
Figure II-26. Percent African American Residents of Total Population by Census Tract, Independence, Missouri, 2009
Source: Claritas, 2009.
Figure II-27. Percent Hispanic Residents of Total Population by Census Tract, Independence, Missouri, 2009
Source: Claritas, 2009.

PAGE 14, SECTION II BBC RESEARCH & CONSULTING
Kansas City, Missouri
In addition to Kansas City, KS, Kansas City, MO is one of the most diverse communities within the study area. Twenty-nine percent of residents are African American and 9 percent are Hispanic. There are many Census Tracts with African American concentrations in the southern portion of the city. The city’s growing Hispanic population is primarily concentrated in the central portion of the city.
Figure II-28. Percent Non-White Residents of Total Population by Census Tract, Kansas City, Missouri, 2009
Source: Claritas, 2009.
Figure II-29. Percent African American Residents of Total Population by Census Tract, Kansas City, Missouri, 2009
Source: Claritas, 2009.
Figure II-30. Percent Hispanic Residents of Total Population by Census Tract, Kansas City, Missouri, 2009
Source: Claritas, 2009.

BBC RESEARCH & CONSULTING PAGE 15
Lee’s Summit, Missouri
Eight percent of Lee’s Summit’s residents consider themselves racially African American. Figure II-32 displays no apparent concentration of African American residents. Similarly, Figure II-33 displays no apparent concentration of Hispanic residents, which comprise 3 percent of the population.
Figure II-31. Percent Non-White Residents of Total Population by Block Group, Lee’s Summit, Missouri, 2009
Source: Claritas, 2009
Figure II-32. Percent African American Residents of Total Population by Block Group, Lee’s Summit, Missouri, 2009
Source: Claritas, 2009
Figure II-33. Percent Hispanic Residents of Total Population by Block Group, Lee’s Summit, Missouri, 2009
Source: Claritas, 2009

PAGE 16, SECTION II BBC RESEARCH & CONSULTING
Household Characteristics and Familial Status
Communities within the study area are primarily comprised of family households, which include related persons living together. In Blue Springs, MO, three out of every four households are family households. In Kansas City, MO, 57 percent of households are family households, which is the lowest proportion of family households within the study area, but is still relatively high.
Familial status is protected under fair housing law. Surveys conducted by BBC as part of Analyses of Impediments to Fair Housing Choice (AI) have demonstrated some of the lowest support and awareness for fair housing protection based on familial status. Single parents may be particularly vulnerable to fair housing discrimination because of their lower incomes and, consequently, limited options in the housing market. As shown in Figure II-34, Kansas City, KS has the largest proportion of single parent households of total households (16 percent). Overland Park contains the smallest percentage of single parent households (7 percent).

BBC RESEARCH & CONSULTING SECTION II, PAGE 17
Figure II-34. Household Composition, 2008
Source: American Community Survey 2006-2008 3-year estimate.
Family Households 516,719 138,911 79540 34,563 7,730 43,293 16,078 14,417 30,309 104,496 25,388
Married Couples 391,563 114,152 65,676 21,919 5,714 35,123 13,353 11,423 21,992 67,919 20,884
with kids 182,074 56,386 32,680 10,743 2,945 16,755 6,951 5,641 8,649 29,072 10,735
without kids 209,489 57,766 32,996 11,176 2,769 18,368 6,402 5,782 13,343 38,847 10,149
Other Family 125,156 24,759 13,864 12,644 2,016 8,170 2,725 2,994 8,317 36,577 4,504
Male Householder, no wife 31,613 7,259 3,746 3,090 521 2,460 1,053 825 1,945 7,387 1,097
with kids 19,350 4,250 2,339 1,924 237 1,222 689 578 1,204 4,354 787
without kids 12,263 3,009 1,407 1,166 284 1,238 364 247 741 3,033 310
Female Householder, no husband 93,543 17,500 10,118 9,554 1,495 5,710 1,672 2,169 6,372 29,190 3,407
with kids 65,875 11,701 6,945 6,669 1,236 3,696 1,060 1,585 4,256 20,664 2,632
without kids 27,668 5,799 3,173 2,885 259 2,014 612 584 2,116 8,526 775
Non-family Households 260,477 64,168 32,890 19,747 4,054 24,317 6,961 4,778 18,644 80,039 9,127
Total Households 777,196 203,079 112,430 54,310 11,784 67,610 23,039 19,195 48,953 184,535 34,515
Family Households 66.5% 68.4% 70.7% 63.6% 65.6% 64.0% 69.8% 75.1% 61.9% 56.6% 73.6%
Married Couples 50.4% 56.2% 58.4% 40.4% 48.5% 51.9% 58.0% 59.5% 44.9% 36.8% 60.5%
with kids 23.4% 27.8% 29.1% 19.8% 25.0% 24.8% 30.2% 29.4% 17.7% 15.8% 31.1%
without kids 27.0% 28.4% 29.3% 20.6% 23.5% 27.2% 27.8% 30.1% 27.3% 21.1% 29.4%
Other Family 16.1% 12.2% 12.3% 23.3% 17.1% 12.1% 11.8% 15.6% 17.0% 19.8% 13.0%
Male Householder, no wife 4.1% 3.6% 3.3% 5.7% 4.4% 3.6% 4.6% 4.3% 4.0% 4.0% 3.2%
with kids 2.5% 2.1% 2.1% 3.5% 2.0% 1.8% 3.0% 3.0% 2.5% 2.4% 2.3%
without kids 1.6% 1.5% 1.3% 2.1% 2.4% 1.8% 1.6% 1.3% 1.5% 1.6% 0.9%
Female Householder, no husband 12.0% 8.6% 9.0% 17.6% 12.7% 8.4% 7.3% 11.3% 13.0% 15.8% 9.9%
with kids 8.5% 5.8% 6.2% 12.3% 10.5% 5.5% 4.6% 8.3% 8.7% 11.2% 7.6%
without kids 3.6% 2.9% 2.8% 5.3% 2.2% 3.0% 2.7% 3.0% 4.3% 4.6% 2.2%
Non-family Households 33.5% 31.6% 29.3% 36.4% 34.4% 36.0% 30.2% 24.9% 38.1% 43.4% 26.4%
Total Number Households 777,196 203,079 112,430 54,310 11,784 67,610 23,039 19,195 48,953 184,535 34,515
Springs Independence City SummitKansas Lee's
City MSA (Total) (Partial) City Leavenworth Park ShawneeKansas County County Kansas Overland Blue
Kansas Missouri
Johnson Johnson
SummitLeavenworth Park Shawnee Springs Independence CityKansas County
City MSA (Total) (Partial) CityLee'sOverland Blue Kansas
Kansas Missouri
JohnsonKansas
Johnson County

PAGE 18, SECTION II BBC RESEARCH & CONSULTING
The following series of maps display the percentage of single parent households to total households by Census Tract. Maps are provided for each participating jurisdiction. Similar to the racial and ethnic maps, concentrations of single parent households are highlighted in dark blue. The most notable concentrations of single parent households occur in Kansas City, KS and Kansas City, MO.
Figure II-35. Percent Single Parent Households of Total Households by Census Tract, Johnson County, Kansas, 2009
Source: Claritas, 2009
Figure II-36. Percent Single Parent Households of Total Households by Census Tract, Kansas City, Kansas, 2009
Source: Claritas, 2009
Figure II-37. Percent Single Parent Households of Total Households by Census Tract, Leavenworth, Kansas, 2009
Source: Claritas, 2009

BBC RESEARCH & CONSULTING SECTION II, PAGE 19
Figure II-38. Percent Single Parent Households of Total Households by Census Tract, Overland Park, Kansas, 2009
Source: Claritas, 2009
Figure II-39. Percent Single Parent Households of Total Households by Census Tract, Shawnee, Kansas, 2009
Source: Claritas, 2009
Figure II-40. Percent Single Parent Households of Total Households by Census Tract, Blue Springs, Missouri, 2009
Source: Claritas, 2009

PAGE 20, SECTION II BBC RESEARCH & CONSULTING
Figure II-41. Percent Single Parent Households of Total Households by Census Tract, Independence, Missouri, 2009
Source: Claritas, 2009
Figure II-42. Percent Single Parent Households of Total Households by Census Tract, Kansas City, Missouri, 2009
Source: Claritas, 2009
Figure II-43. Percent Single Parent Households of Total Households by Block Group, Lee’s Summit, Missouri, 2009
Source: Claritas, 2009.

BBC RESEARCH & CONSULTING SECTION II, PAGE 21
Household Income
The U.S. Census estimates and reports both family median and household median income. Median household income is usually lower than median family income, since household income includes single-person households and unrelated persons living together (e.g., students and unmarried partners), whereas median family income does not. In other words, the median family income category has a larger proportion of two-earner households, who usually have higher earnings than one-person households do.
Figure II-44 displays the median family and household incomes of all municipalities within the study area, as well as for the Kansas City MSA overall. As a point of comparison, median family income for the U.S. is $63,211 and the median household income is $52,175.3
Overland Park’s median family income is $93,970, which is nearly 50 percent higher than the U.S. as a whole and the highest in the study area. Johnson County and Lee’s Summit have median household incomes of approximately $75,000. Kansas City, KS has the lowest median family and household income in the study area at $46,243 and $38,100, respectively.
Figure II-44. Family and Household Median Income, 2008 Source: American Community Survey 2006-2008 3-year estimate. Kansas City MSA 69,240$ 55,858$
Kansas
Johnson County 91,214$ 74,552$
Kansas City 46,243$ 38,100$
Leavenworth 62,328$ 51,200$
Overland Park 93,970$ 72,319$
Shawnee 89,182$ 73,905$
Missouri
Blue Springs 75,448$ 68,684$
Independence 55,679$ 42,960$
Kansas City 56,092$ 44,566$
Lee's Summit 85,704$ 74,007$
MedianFamily
Income
MedianHousehold
Income
3 American Community Survey 2006-2008 3-year estimate.

PAGE 22, SECTION II BBC RESEARCH & CONSULTING
Figure II-45 displays poverty rates by age for the study area. Kansas City, KS has the highest poverty rate in the study area (22 percent), while Johnson County, Shawnee and Lee’s Summit have the lowest at about 5 percent each.
Figure II-45. Poverty by Age, 2008
Source: American Community Survey 2006-2008 3-year estimate.
Kansas
Total Poverty 5.3% 21.7% 11.1% 4.8% 5.7%
Under 5 8.0% 32.4% 20.7% 8.7% 9.9%
5 to 17 8.0% 35.0% 16.5% 7.1% 8.4%
18 to 24 11.8% 28.2% 12.5% 8.6% 10.0%
25 to 44 4.9% 21.3% 8.3% 4.3% 6.1%
45 to 64 2.6% 12.2% 10.5% 2.7% 1.6%
65 and older 4.3% 14.5% 6.3% 4.3% 4.8%
Missouri
Total Poverty 7.4% 13.6% 17.0% 5.1%
Under 5 14.4% 25.9% 29.1% 12.9%
5 to 17 12.2% 23.5% 28.8% 8.9%
18 to 24 12.7% 16.6% 24.6% 10.6%
25 to 44 6.2% 13.5% 14.6% 4.2%
45 to 64 4.5% 9.2% 11.8% 1.8%
65 and older 3.1% 6.8% 10.9% 4.3%
Kansas Blue Springs
Johnson Kansas OverlandCounty City Leavenworth Park
Lee's
Shawnee
Independence City Summit
The following series of figures display the overall family and household income for each community, as well as a map showing the geographic distribution of the community’s low income households, which earn $25,000 or less annually. Again, concentrations of low income households are displayed in dark blue.

BBC RESEARCH & CONSULTING SECTION II, PAGE 23
Johnson County, Kansas
Thirty-four percent of Johnson County’s households earn more than $100,000 per year. Approximately 11 percent all households are considered “low income,” i.e., earning less than $25,000 per year. Census Tracts that contain more than 11 percent low income households are primarily located along the I-35 corridor and in the northeast portion of the county.
Figure II-45a. Percent Low Income Households of Total Households by Census Tract, Johnson County, 2009
Figure II-45b. Household Income Distribution, Johnson County, 2008
$100,000 or more
$75K to $99,999
$50K to $74,999
$25K to $49,999
Less than $25,000
0% 20% 40% 60% 80% 100%
10.5%
20.7%
19.1%
15.5%
34.2%
Note: Low Income households represented by households earning $25,000 or less.
Source: Claritas, 2009.
Source: American Community Survey 2006-2008 3-year estimate.

PAGE 24, SECTION II BBC RESEARCH & CONSULTING
Kansas City, Kansas
Nearly one in three households earns less than $25,000 per year. Most Census Tracts in the city’s central and eastern portions have proportions of low income households that exceed city-wide averages.
Figure II-46a. Percent Low Income Households of Total Households by Census Tract, Kansas City, KS, 2009
Figure II-46b. Household Income Distribution, Kansas City, KS, 2008
$100,000 or more
$75K to $99,999
$50K to $74,999
$25K to $49,999
Less than $25,000
0% 20% 40% 60% 80% 100%
32.1%
30.9%
18.2%
9.3%
9.6%
Note: Low Income households represented by households earning $25,000 or less.
Source: Claritas, 2009.
Source: American Community Survey 2006-2008 3-year estimate.

BBC RESEARCH & CONSULTING SECTION II, PAGE 25
Leavenworth, Kansas
In Leavenworth, almost one-fourth of households earn $25,000 or less or less annually. A concentration of low income households is located in the east central portion of the city.
Figure II-47a. Percent Low Income Households of Total Households by Census Tract, Leavenworth, 2009
Figure II-47b. Household Income Distribution, Leavenworth, 2008
$100,000 or more
$75K to $99,999
$50K to $74,999
$25K to $49,999
Less than $25,000
0% 20% 40% 60% 80% 100%
23.5%
25.4%
19.6%
17.4%
14.1%
Note: Low Income households represented by households earning $25,000 or less.
Source: Claritas, 2009.
Source: American Community Survey 2006-2008 3-year estimate.

PAGE 26, SECTION II BBC RESEARCH & CONSULTING
Overland Park, Kansas
Eleven percent of Overland Park’s households are considered low income and more than one-third earn more than $100,000. Census Tracts that contain a larger proportion of low income households compared with the city overall are primarily located north of I-435.
Figure II-48a. Percent Low Income Households of Total Households by Census Tract, Overland Park, 2009
Figure II-48b. Household Income Distribution, Overland Park, 2008
$100,000 or more
$75K to $99,999
$50K to $74,999
$25K to $49,999
Less than $25,000
0% 20% 40% 60% 80% 100%
10.5%
22.1%
19.2%
14.3%
34.0%
Note: Low Income households represented by households earning $25,000 or less.
Source: Claritas, 2009.
Source: American Community Survey 2006-2008 3-year estimate.

BBC RESEARCH & CONSULTING SECTION II, PAGE 27
Shawnee, Kansas
Shawnee’s low income households are almost exclusively located in the city’s far eastern portion. Like Overland Park, nearly one-third of households earn more than $100,000.
Figure II-49a. Percent Low Income Households of Total Households by Census Tract, Shawnee, 2009
Figure II-49b. Household Income Distribution, Shawnee, 2008
$100,000 or more
$75K to $99,999
$50K to $74,999
$25K to $49,999
Less than $25,000
0% 20% 40% 60% 80% 100%
10.8%
20.8%
19.2%
17.8%
31.3%
Note: Low Income households represented by households earning $25,000 or less.
Source: Claritas, 2009.
Source: American Community Survey 2006-2008 3-year estimate.

PAGE 28, SECTION II BBC RESEARCH & CONSULTING
Blue Springs, Missouri
The household and family income distributions of Blue Springs are evenly distributed, with the exception of those households earning $25,000 or less, which comprise approximately 13 percent of the city’s households. Low income households are most likely to reside in the central portion of the city.
Figure II-50a. Percent Low Income Households of Total Households by Census Tract, Blue Springs, 2009
Figure II-50b. Household Income Distribution, Blue Springs, 2008
$100,000 or more
$75K to $99,999
$50K to $74,999
$25K to $49,999
Less than $25,000
0% 20% 40% 60% 80% 100%
12.5%
21.9%
22.3%
20.1%
23.3%
Note: Low Income households represented by households earning $25,000 or less.
Source: Claritas, 2009.
Source: American Community Survey 2006-2008 3-year estimate.

BBC RESEARCH & CONSULTING SECTION II, PAGE 29
Independence, Missouri
Twenty-five percent of Independence’s households are considered low income. These households are concentrated in the western portions of the city. The largest proportion of households in the city earn between $25,000 and $50,000 annually.
Figure II-51a. Percent Low Income Households of Total Households by Census Tract, Independence, 2009
Figure II-51b. Household Income Distribution, Independence, 2008
$100,000 or more
$75K to $99,999
$50K to $74,999
$25K to $49,999
Less than $25,000
0% 20% 40% 60% 80% 100%
25.4%
31.1%
20.8%
10.9%
11.8%
Note: Low Income households represented by households earning $25,000 or less.
Source: Claritas, 2009.
Source: American Community Survey 2006-2008 3-year estimate.

PAGE 30, SECTION II BBC RESEARCH & CONSULTING
Kansas City, Missouri
About half of the city’s households earn less than $50,000 per year, with the largest proportion (28 percent) earning less than $25,000 per year. Low income households in the city are heavily concentrated in the southern portion of the city.
Figure II-52a. Percent Low Income Households of Total Households by Census Tract, Kansas City, MO, 2009
Figure II-52b. Household Income Distribution, Kansas City, MO, 2008
$100,000 or more
$75K to $99,999
$50K to $74,999
$25K to $49,999
Less than $25,000
0% 20% 40% 60% 80% 100%
28.3%
27.1%
18.3%
10.6%
15.6%
Note: Low Income households represented by households earning $25,000 or less.
Source: Claritas, 2009.
Source: American Community Survey 2006-2008 3-year estimate.

BBC RESEARCH & CONSULTING SECTION II, PAGE 31
Lee’s Summit, Missouri
The largest proportion of households in Lee’s Summit earn $100,000 or more (32 percent). Overall, 12 percent of households are considered low income. Low income households are primarily located in the center of the city.
Figure II-53a. Percent Low Income Households of Total Households by Block Group, Lee’s Summit, 2009
Figure II-53b. Household Income Distribution, Lee’s Summit, 2008
$100,000 or more
$75K to $99,999
$50K to $74,999
$25K to $49,999
Less than $25,000
0% 20% 40% 60% 80% 100%
11.6%
20.2%
18.9%
17.6%
31.7%
Note: Low Income households represented by households earning $25,000 or less.
Source: Claritas, 2009.
Source: American Community Survey 2006-2008 3-year estimate.
PAGE 32, SECTION II BBC RESEARCH & CONSULTING
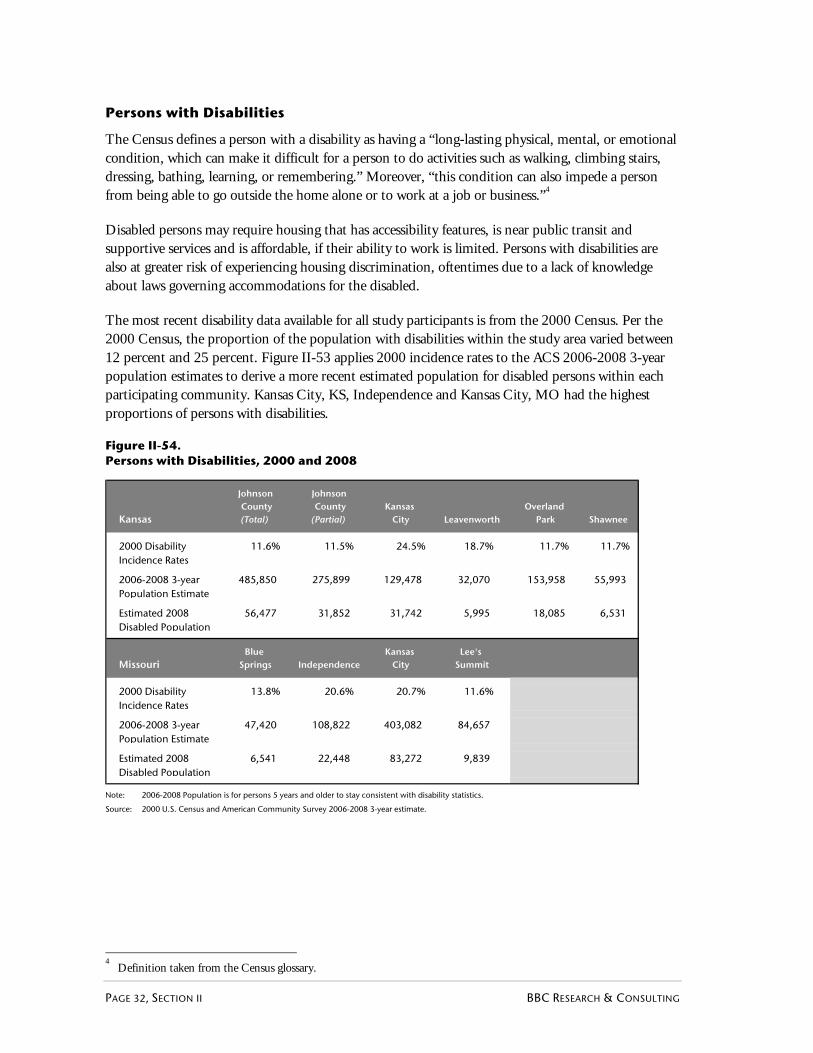
Persons with Disabilities
The Census defines a person with a disability as having a “long-lasting physical, mental, or emotional condition, which can make it difficult for a person to do activities such as walking, climbing stairs, dressing, bathing, learning, or remembering.” Moreover, “this condition can also impede a person from being able to go outside the home alone or to work at a job or business.”4
Disabled persons may require housing that has accessibility features, is near public transit and supportive services and is affordable, if their ability to work is limited. Persons with disabilities are also at greater risk of experiencing housing discrimination, oftentimes due to a lack of knowledge about laws governing accommodations for the disabled.
The most recent disability data available for all study participants is from the 2000 Census. Per the 2000 Census, the proportion of the population with disabilities within the study area varied between 12 percent and 25 percent. Figure II-53 applies 2000 incidence rates to the ACS 2006-2008 3-year population estimates to derive a more recent estimated population for disabled persons within each participating community. Kansas City, KS, Independence and Kansas City, MO had the highest proportions of persons with disabilities.
Figure II-54. Persons with Disabilities, 2000 and 2008
Kansas
2000 Disability Incidence Rates
11.6% 11.5% 24.5% 18.7% 11.7% 11.7%
2006-2008 3-year Population Estimate
485,850 275,899 129,478 32,070 153,958 55,993
Estimated 2008 Disabled Population
56,477 31,852 31,742 5,995 18,085 6,531
Missouri
2000 Disability Incidence Rates
13.8% 20.6% 20.7% 11.6%
2006-2008 3-year Population Estimate
47,420 108,822 403,082 84,657
Estimated 2008 Disabled Population
6,541 22,448 83,272 9,839
(Total) (Partial)
City
Leavenworth
SummitSprings IndependenceBlue Kansas Lee's
CountyShawnee
Overland Park
Johnson County Kansas
City
Johnson
Note: 2006-2008 Population is for persons 5 years and older to stay consistent with disability statistics.
Source: 2000 U.S. Census and American Community Survey 2006-2008 3-year estimate.
4 Definition taken from the Census glossary.

BBC RESEARCH & CONSULTING SECTION II, PAGE 33
Figure II-54 provides information on the type of disabilities reported in each community in 2000 and applies these incidence rates to more recent population statistics. Physical and employment disabilities are the most common disabilities in the study area. Employment disabilities occur when “physical, mental or emotional conditions make working at a job or business difficult.”5 Employment disabilities are the most common type of disability in most of the communities, followed by physical disability.
Figure II-55. Disability by Type, 2000 and 2008
2000 Incidence Rates
Sensory 2.3% 2.3% 4.2% 3.7% 2.2% 2.0% 2.6% 4.1% 3.4% 2.6%
Physical 4.6% 4.6% 10.7% 8.6% 4.7% 4.6% 5.0% 10.3% 8.5% 5.5%
Mental 2.9% 2.9% 5.4% 4.5% 3.1% 2.5% 3.2% 5.4% 4.9% 3.4%
Self-care 1.4% 1.4% 3.5% 2.3% 1.4% 1.4% 1.4% 3.0% 2.8% 1.6%
Go-outside-home 3.5% 3.3% 8.7% 5.5% 3.7% 4.2% 4.1% 7.0% 7.7% 3.4%
Employment 4.9% 5.0% 11.0% 8.2% 4.8% 5.1% 6.4% 7.7% 9.5% 3.9%
2008 Population:
Sensory 11,001 6,412 5,401 1,184 3,461 1,127 1,247 4,505 13,792 2,188
Physical 22,582 12,811 13,836 2,766 7,182 2,589 2,386 11,254 34,435 4,664
Mental 14,173 7,998 7,046 1,435 4,796 1,380 1,538 5,914 19,738 2,878
Self-care 6,769 3,797 4,512 724 2,175 797 662 3,253 11,158 1,383
Go-outside-home 17,219 9,181 11,201 1,752 5,693 2,345 1,922 7,574 30,858 2,888
Employment 23,868 13,679 14,189 2,645 7,335 2,855 3,013 8,376 38,201 3,285
JohnsonCounty
275,899
(Total) (Partial)
32,070
Independence
108,822 403,082 84,657
Kansas Lee'sLeavenworth
MissouriKansas
485,850 129,478 153,958 55,993 47,420
City Summit
JohnsonKansas Overland BlueCounty
City Park Shawnee Springs
Note: 2006-2008 Population is for persons 5 years and older to stay consistent with disability statistics.
Source: 2000 U.S. Census and American Community Survey 2006-2008 3-year estimate.
The following series of maps displays geographic distributions of persons with disabilities for each participating jurisdiction. Each community is mapped with the same breakpoints, as updated disability is not available to identify concentrations. Except for in Kansas City, MO, there are few areas of concentration by disability status.
5 http://www.census.gov/prod/2003pubs/c2kbr-17.pdf

PAGE 34, SECTION II BBC RESEARCH & CONSULTING
Figure II-56. Percent Disabled Residents of Total Population by Census Tract, Johnson County, Kansas, 2000
Source: 2000 U.S. Census.
Figure II-57. Percent Disabled Residents of Total Population by Census Tract, Kansas City, Kansas, 2000
Source: 2000 U.S. Census.
Figure II-58. Percent Disabled Residents of Total Population by Census Tract, Leavenworth, Kansas, 2000
Source: 2000 U.S. Census.

BBC RESEARCH & CONSULTING SECTION II, PAGE 35
Figure II-59. Percent Disabled Residents of Total Population by Census Tract, Overland Park, Kansas, 2000
Source: 2000 U.S. Census.
Figure II-60. Percent Disabled Residents of Total Population by Census Tract, Shawnee, Kansas, 2000
Source: 2000 U.S. Census.
Figure II-61. Percent Disabled Residents of Total Population by Census Tract, Blue Springs, Missouri, 2000
Source: 2000 U.S. Census.

PAGE 36, SECTION II BBC RESEARCH & CONSULTING
Figure II-62. Percent Disabled Residents of Total Population by Census Tract, Independence, Missouri, 2000
Source: 2000 U.S. Census.
Figure II-63. Percent Disabled Residents of Total Population by Census Tract, Kansas City, Missouri, 2000
Source: 2000 U.S. Census.
Figure II-64. Percent Disabled Residents of Total Population by Census Tract, Lee’s Summit, 2000
Source: 2000 U.S. Census.

BBC RESEARCH & CONSULTING SECTION II, PAGE 37
Employment
The Kansas City region is home to a number of corporate headquarters, which have helped the region’s economy remain strong during the recent economic crisis.
Major employers. Government entities (federal, state and local), school districts and medical facilities account for more than half of the region’s 30 largest employers. However, the Kansas City MSA is not solely reliant on government, educational and health services firms to provide local employment. Sprint and Hallmark have long called the Kansas City area their corporate homes. Additionally, Cerner Corporation (healthcare I.T.), DST systems (computer software), Black and Veatch (engineering), YRC (transportation) and Garmin (GPS) are also headquartered in the Kansas City MSA and represent a wide range of industries known for providing high paying employment opportunities.
Figure II-65. Major Employers, Kansas City MSA, 2009
Source: KCEconomy.com.
Employer Employer
Federal Government 37,000 Black & Veatch 3,800
Sprint Nextel Corp. 12,000 Johnson County, KS Govt. 3,800
Mc Donald’s USA 7,000 KCMO School Dist. 3,700
St. Luke’s Health Sys. 6,403 Blue Valley School Dist. 3,230
State of Missouri 6,146 Truman Medical Center 2,982
HCA Midwest Health 5,296 North KC School District 3,917
AT&T 5,230 UMKC 2,855
Cerner Corp. 4,800 Embarq 2,800
City of Kansas City, MO 4,669 U. of Kansas Hospital 2,780
Children’s Mercy Hospital 4,637 Lee’s Summit School Dist. 2,580
Olathe School Dist. 4,577 Honeywell 2,500
State of Kansas 4,542 YRC Worldwide Inc. 2,419
Ford Motor Co. 4,465 General Motors 2,400
DST Systems 4,425 Garmin International 2,370
Hallmark Cards 4,000 Total 161,152
KCK Public Schools 3,829
EmployeesNumber of Number of
Employees
Industries and wages. Firms falling within the professional and technical services industry account for the largest number of firms in the Kansas City MSA. In the 2nd quarter of 2010 (2Q10), these firms paid an average of $1,196 per week in wages, which equates to approximately $62,000 annually for full-time employees.6 More than 50,000 jobs in the MSA in 2Q10 were within the health care and social assistance sector, which pay an average of $824 per week ($43,000 annually for full-time employees). The Information sector boasts the highest average wages in the MSA with average weekly wages of $1,516, or approximately $79,000 annually for full-time employees. Jobs in the Information sector account for 5 percent of employment opportunities in the MSA.
In Figure II-66, each industry is assigned a wage category of low, medium or high. The average weekly wage for all industries within the MSA is $860. Low wage industries pay less than 80 percent of the average weekly wage (less than $688); medium wage industries pay between 80 percent and 120 percent (between $688 and $1,032); and high way industries have average weekly wages of more than $1,032. Six industries in the MSA are categorized as high wage industries, which include: Utilities, Manufacturing, Wholesale Trade, Information, Finance/Insurance, and Professional/Technical Services.
6 Assumes a 52 week work week.

PAGE 38, SECTION II BBC RESEARCH & CONSULTING
Figure II-66. Industrial Composition and Average Wages, Kansas City MSA, 2nd Quarter of 2010
Industry
Agriculture, Forestry, Fishing & Hunting
50 354 0.1% 502$ 26,104$ Low
Mining 72 528 0.2% 880$ 45,760$ Medium
Utilities 15 1,546 0.5% 1,224$ 63,648$ High
Construction 2,279 16,277 5.1% 977$ 50,804$ Medium
Manufacturing (31-33) 888 34,019 10.6% 1,041$ 54,132$ High
Wholesale Trade 3,728 23,712 7.4% 1,217$ 63,284$ High
Retail Trade (44-45) 2,633 44,820 14.0% 487$ 25,324$ Low
Transportation and Warehousing (48-49)
*** *** *** *** *** ***
Information 503 15,101 4.7% 1,516$ 78,832$ High
Finance and Insurance 2,114 25,350 7.9% 1,228$ 63,856$ High
Real Estate and Rental and Leasing
*** *** *** *** *** ***
Professional and Technical Services
4,294 32,008 10.0% 1,196$ 62,192$ High
Management of Companies and Enterprises
*** *** *** *** *** ***
Administrative and Waste Services
1,980 30,704 9.6% 636$ 33,072$ Low
Educational Services 317 4,067 1.3% 645$ 33,540$ Low
Health Care and Social Assistance
2,094 50,983 15.9% 824$ 42,848$ Medium
Arts, Entertainment and Recreation
*** *** *** *** *** ***
Accommodation and Food Services
1,416 30,301 9.5% 286$ 14,872$ Low
Other Services, Ex. Public Admin
1,847 10,544 3.3% 528$ 27,456$ Low
Wage Category
Percent Average Weekly
Wage
Average Annual Wages
Average Establishments
Average Employment
of Total Employment
Note: Average employment calculated by taking the average of the three months within the 2nd quarter of 2010.
Source: Kansas Labor Market Information, QCEW.
Forty-one percent of the MSA’s employment opportunities are in high-wage industries, 21 percent are in medium-wage industries and 38 percent of jobs are in industries paying low-wages. Persons working in low-wage industries may experience challenges finding affordable housing and may also rely more heavily on public services, such as public transportation. That said, the Kansas City region is comparatively very affordable overall, with a median home value of $104,000 and a median rent of $594. In general, a household earning more than $25,000 would be able to afford to rent or buy in the region.

BBC RESEARCH & CONSULTING SECTION II, PAGE 39
Unemployment. As of November 2010, the unemployment rate in the Kansas City MSA was 9.1 percent, slightly lower than the 9.3 percent unemployment rate for the U.S. as a whole. Of the 372 MSA’s reported by the Bureau of Labor Statistics (BLS), 147 MSA’s had higher unemployment rates than the Kansas City MSA.
Figure II-67. Unemployment Rates, Kansas City MSA,
0.0
1.0
2.0
3.0
4.0
5.0
6.0
7.0
8.0
9.0
10.0
Un
emp
loym
ent
Rat
e
1996 1997 1998 1999 2000 2001 2002 2003 2004 2005 2006 2007 2008 2009
Janu
ary
Feb
uar
y
Mar
ch
Ap
ril
May
June July
Au
gust
Sep
tem
ber
Oct
ober
Nov
embe
r
2010
Source: Bureau of Labor Statistics and MARC.
Housing
The housing market in the study area is described below within the context of housing tenure, overcrowding, housing costs and the presence of assisted units.
Housing units. Figure II-68 provides the housing unit estimates for the communities comprising the study area per the ACS 2006-2008 3-year estimates. Kansas City, MO contains the largest number of housing units, while Leavenworth contains the fewest.
Figure II-68. Housing Unit, Vacancy and Occupied Housing Unit Estimates, 2008
Source: American Community Survey 2006-2008 3-year estimate.
Housing
Kansas City MSA 859,931 10.0% 777,196
Kansas
Johnson County (Total) 214,404 5.3% 203,079
Johnson County (Partial) 117,689 4.5% 112,430
Kansas City, KS 63,048 13.9% 54,310
Leavenworth 13,578 13.2% 11,784
Overland Park 72,598 6.9% 67,610
Shawnee 24,117 4.5% 23,039
Missouri
Blue Springs 20,591 6.8% 19,195
Independence 54,551 10.3% 48,953
Kansas City, MO 217,305 15.1% 184,535
Lee's Summit 36,211 4.7% 34,515
OccupiedUnits Rates Housing Units
Vacancy

PAGE 40, SECTION II BBC RESEARCH & CONSULTING
Figure II-69 presents vacancy rates and reasons for vacancies for the study area.
Figure II-69. Housing Unit, Vacancy and Occupied Housing Unit Estimates, 2008
(Total)
Overall Vacancy 5.3% 4.5% 13.9% 6.9% 4.5% 10.3% 15.1% 4.7%
Number of Units 11,325 5,259 8,738 4,988 1,078 5,598 32,770 1,696
For rent 38.3% 28.1% 18.5% 47.4% 46.4% 28.3% 40.3% 16.6%
Rented, but not occupied
17.8% 17.3% 3.0% 18.5% 17.3% 3.7% 3.7% 7.4%
For sale 14.9% 14.4% 15.6% 13.9% 22.7% 10.8% 18.6% 26.0%
Sold, but not occupied
6.8% 9.7% 1.6% 5.2% 0.0% 7.3% 2.8% 8.1%
For seasonal, recreational or occasional use
4.5% 6.8% 1.5% 3.0% 0.0% 4.1% 1.6% 8.3%
Other vacant 17.6% 23.7% 59.8% 12.1% 13.6% 45.8% 32.9% 33.6%
SummitShawnee Independence City
JohnsonCounty
(Partial) City ParkCounty Kansas Overland
Kansas Missouri
JohnsonKansas Lee's
Note: Data is not available for Leavenworth and Blue Springs
Source: American Community Survey 2006-2008 3-year estimate.
Vacancy rates are highest in Kansas City, MO, Kansas City, KS and Independence. The largest proportion of vacant units in Kansas City, MO includes rental units with no tenants. Sixty percent of vacancies in Kansas City, KS are due to “other” reasons, which may include abandoned buildings or pending foreclosures.
Tenure. Figure II-70 displays household tenure for the Kansas City MSA and each community in the study area. Homeownership rates are high throughout the study area, with Johnson County, Shawnee, Blue Springs, and Lee’s Summit all reporting homeownership rates of 70 percent or more. Leavenworth has the lowest homeownership rate in the study area. The military presence in Leavenworth likely contributes to its relatively high renter rates.
Figure II-70. Tenure, 2008
Lee's Summit
Kansas City, MO
Independence
Blue Springs
Missouri
Shawnee
Overland Park
Leavenworth
Kansas City, KS
Johnson County (partial)
Johnson County (total)
Kansas
Kansas City MSA
0% 20% 40% 60% 80% 100%
69.3%30.7%
72.7%27.3%
76.2%23.8%
62.5%37.5%
51.1%48.9%
66.6%33.4%
73.8%26.2%
75.6%24.4%
68.1%31.9%
58.7%41.3%
76.6%23.4%
Owner occupied
Renter occupied
Source: American Community Survey 2006-2008 3-year estimate.

BBC RESEARCH & CONSULTING SECTION II, PAGE 41
Overcrowding. Overcrowding in housing can threaten public health, strain public infrastructure and neighborhoods, and points to the need for affordable housing. The amount of living space required to meet health and safety standards is not consistently specified; measurable standards for overcrowding vary by community. According to HUD, the most widely used measure assumes that a home becomes overcrowded when there is more than 1 household member per room.7 Another frequently used measure is the number of individuals per bedroom, with a standard of no more than two persons per bedroom. Assisted housing programs usually apply this standard.
Overcrowding data was only available for five communities within the study area, which are displayed in Figure II-71. In the Kansas City MSA, 1 percent of households are living in overcrowded conditions. Kansas City, KS has the greatest proportion of households experiencing overcrowding (3.5 percent). Overcrowded units in Kansas City, KS are equally renter-occupied (55 percent) and owner-occupied (45 percent). Overall, according to the Census data, overcrowding is very low in the region.8
Figure II-71. Proportion of Households with a Tenant to Room Ratio of Greater than 1, 2008
Total Households 777,196 203,079 54,310 19,195 48,953 184,535
Percent with 1.5 occupants per room or more 1.4% 0.8% 3.5% 1.3% 1.8% 1.6%
City MSA County City, KS Springs Independence City, MOKansas Johnson Kansas Blue Kansas
Note: Overcrowding data not available for Overland Park, Shawnee, Leavenworth and Lee’s Summit.
Source: American Community Survey 2006-2008 3-year estimate.
Housing costs. This section discusses rent and housing costs in the study area, with an emphasis on affordability.
Rental costs. Per the 2006-2008 3-year ACS estimate, the median contract rent for the Kansas City MSA was $594, which is a 26 percent increase since 2000. The highest median contract rents reported in the ACS were in Overland Park ($789) and Lee’s Summit ($771). Communities with a rent increase higher than the MSA percentage increase include Kansas City, KS; Leavenworth; Independence and Lee’s Summit. Overall, however, rents are very affordable in most communities with the median affordable to households earning less than $25,000.
7 The HUD American Housing Survey defines a room as an enclosed space used for living purposes, such as a bedroom,
living or dining room, kitchen, recreation room, or another finished room suitable for year-round use. Excluded are bathrooms, laundry rooms, utility rooms, pantries, and unfinished areas.
8 “Household” refers to the members who are living in a “housing unit.” A “housing unit” is the actual dwelling in which
household members reside. The number of occupied housing units and households is the same.

PAGE 42, SECTION II BBC RESEARCH & CONSULTING
Figure II-72. Median Contract Rent, 2000 and 2008
Source: 2000 U.S. Census and the American Community Survey 2006-2008 3-year estimate.
Kansas City MSA 473$ 594$ 121$ 25.6% $23,760
Kansas
Johnson County 622$ 730$ 108$ 17.4% $29,200
Kansas City 386$ 515$ 129$ 33.4% $20,600
Leavenworth 429$ 572$ 143$ 33.3% $22,880
Overland Park 681$ 789$ 108$ 15.9% $31,560
Shawnee 556$ 644$ 88$ 15.8% $25,760
Missouri
Blue Springs 543$ 642$ 99$ 18.2% $25,680
Independence 409$ 517$ 108$ 26.4% $20,680
Kansas City 445$ 556$ 111$ 24.9% $22,240
Lee's Summit 561$ 771$ 210$ 37.4% $30,840
Annual RenterPercent Income Needed
2000 2008 Change to AffordRental
Increase
Rental units with contract rents of $500 to $750 are the most abundant in the region. Kansas City, KS is the most affordable community in the study area, with 43 percent of rental units requiring contract rents of $500 or less. In contrast, Overland Park and Lee’s Summit offer some of the highest rents in the study area.
Figure II-73. Contract Rent Distribution, 2008
Kansas
Less than $250 7.1% 2.6% 11.8% 5.5% 1.7% 3.4%
$250 to $499 23.2% 7.4% 31.2% 30.5% 4.8% 8.2%
$500 to $749 39.9% 41.6% 42.6% 28.0% 33.4% 52.5%
$750 to $999 16.2% 29.0% 5.9% 7.1% 35.7% 22.9%
$1,000 to $1,500 6.0% 12.0% 1.0% 11.9% 17.0% 9.8%
$1,500 or more 2.2% 4.0% 0.2% 10.0% 4.1% 1.7%
No cash rent 5.3% 3.5% 7.3% 7.0% 3.4% 1.6%
Missouri
Less than $250 2.8% 8.3% 9.1% 5.2%
$250 to $499 18.1% 35.2% 26.9% 5.6%
$500 to $749 55.1% 40.6% 40.3% 34.4%
$750 to $999 16.2% 9.0% 13.3% 32.1%
$1,000 to $1,500 6.4% 2.2% 4.1% 13.1%
$1,500 or more 0.0% 0.5% 1.4% 8.5%
No cash rent 1.4% 4.4% 4.9% 1.2%
ShawneeKansas City
MSA
Blue Kansas Springs Independence City
Lee's Summit
Johnson Kansas Overland County City Leavenworth Park
Source: American Community Survey 2006-2008 3-year estimate.

BBC RESEARCH & CONSULTING SECTION II, PAGE 43
Homeownership costs. The median home values throughout the study area have experienced little to no appreciation since 2000. Overland Park has the highest median home values in the study area ($160,900), while Kansas City, KS has the lowest ($51,900).
Figure II-74. Median Home Value, 2000 and 2008
Source: 2000 U.S. Census and the American Community Survey 2006-2008 3-year estimate.
Kansas City MSA 104,700$ 104,400$ -0.3%
Kansas
Johnson County 150,100$ 149,300$ -0.5%
Kansas City 52,500$ 51,900$ -1.1%
Leavenworth 75,200$ 74,400$ -1.1%
Overland Park 162,800$ 160,900$ -1.2%
Shawnee 141,700$ 141,100$ -0.4%
Missouri
Blue Springs 108,300$ 108,200$ -0.1%
Independence 77,000$ 76,000$ -1.3%
Kansas City 84,000$ 83,300$ -0.8%
Lee's Summit 131,500$ 131,700$ 0.2%
2000 2008 ChangePercent
For much of the study area, the largest proportion of owner-occupied homes are valued at $100,000 or less. Overland Park contains the largest proportion of homes valued between $200,000 and $300,000. Johnson County has the largest proportion of homes valued at $300,000 or more (10 percent).

PAGE 44, SECTION II BBC RESEARCH & CONSULTING
Figure II-75. Value for Owner-Occupied Homes, 2008
Less than $100,000 224,145 47.5% 19,909 15.8% 30,926 89.8% 4,388 72.6% 5,791 14.2% 2,395 17.4%
$100,000 to $149,999 124,180 26.3% 43,845 34.7% 2,353 6.8% 1,235 20.4% 12,201 30.0% 5,602 40.6%
$150,000 to $200,000 61,851 13.1% 29,241 23.2% 625 1.8% 285 4.7% 10,312 25.3% 3,346 24.3%
$200,000 to $300,000 39,970 8.5% 20,703 16.4% 336 1.0% 121 2.0% 9,137 22.4% 1,610 11.7%
$300,000 to $500,000 16,437 3.5% 9,558 7.6% 120 0.3% 12 0.2% 2,893 7.1% 745 5.4%
$500,000 or more 5,308 1.1% 2,975 2.4% 64 0.2% 0 0.0% 398 1.0% 91 0.7%
Less than $100,000 5,460 42.5% 24,605 76.7% 66,355 62.6% 4,762 23.8%
$100,000 to $149,999 5,052 39.3% 4,994 15.6% 22,405 21.1% 8,146 40.6%
$150,000 to $200,000 1,510 11.8% 1,431 4.5% 9,416 8.9% 3,666 18.3%
$200,000 to $300,000 652 5.1% 817 2.5% 4,988 4.7% 2,390 11.9%
$300,000 to $500,000 137 1.1% 202 0.6% 1,928 1.8% 893 4.5%
$500,000 or more 38 0.3% 47 0.1% 986 0.9% 193 1.0%
Kansas City MSANumber Percent
Kansas City
Percent
Johnson County
NumberPercentNumber
Leavenworth Overland Park
Percent Number
Number Percent
Shawnee
Lee's SummitKansas CityIndependence
Number Percent Number Percent
Number Percent
Blue Springs
Number Percent Number Percent
Source: American Community Survey 2006-2008 3-year estimate.

SECTION III. Citizen and Stakeholder Input

BBC RESEARCH & CONSULTING SECTION III, PAGE 1
SECTION III. Citizen and Stakeholder Input
The Kansas City Regional AI offered two primary opportunities for citizen input and stakeholder consultation about fair housing barriers. These included:
Four public forums held on March 10, 2011. These forums included background information about fair housing law, a discussion of sample fair housing scenarios and residents’ experience with such barriers and an opportunity for the public to voice their concerns about fair housing.
Two versions of a stakeholder survey available December 2010 through February 15, 2011. One version was targeted to real estate professionals; the other was targeted to social service and housing providers.
Citizen Forums
On March 10, 2011, four citizen forums were held in four different locations in the Kansas City region. Two were held from 2 to 3:30 p.m.; two were held from 6 to 7:30 p.m. The meetings were held in Overland Park; Kansas City, MO; Independence and Kansas City, KS.
An average of 20 people attended each forum. Participants were a mix of:
Community-based organizations;
disability advocates,
landlords,
housing advocates;
property managers,
members of human rights commissions; and
residents.
The presentation that was given at the forums is appended to this section. The presentation began with some background about the study, provided an opportunity for residents to introduce themselves and then proceeded to a fair housing discussion. The discussion was oriented around common fair housing violation scenarios, so that attendees could talk about fair housing issues in the region without feeling put on the spot.
The discussions during the forums revealed the following fair housing issues in the region:
Accessibility Barriers
There is a need for an accessible housing registry or database. Landlords say they have accessible units that are available; advocates receive many calls from residents who need accessible units and cannot find them.

PAGE 2, SECTION III BBC RESEARCH & CONSULTING
The bus lifts to serve people in wheelchairs do not always work. Sometimes persons with disabilities have to wait for second bus.
Landlords often raise the rent after they make accessibility improvements, making the units unaffordable.
The fair market rents are much too high for persons living on Social Security Income to afford. They only receive $674/month and rents are in the $500 to $750 range.
Why did Kansas City, MO remove its barrier removal program? It was a good program and it should be brought back. Affordable accessibility modifications are very, very much in need.
There are units that were built after 1991 that are not in compliance with the FHA Design and Construction Guidelines.
Family Composition
In this economic downturn, it is common for grandparents to move in with their children, or children to move back in with their parents, creating overcrowded situations.
Refugees
Refugees are refused housing because they don’t have social security numbers.
General Fair Housing Barriers
Landlords that are being foreclosed upon give their tenants less than 30 days to be out of the units. It is unclear if foreclosing agencies are honoring lease agreements.
People who have faced housing discrimination need a home now. They don’t have time to file a complaint. And the process feels intimidating and overwhelming.
There is a need for an organization to teach people to “advocate for themselves” – e.g., how to file a complaint.
Complaint forms need to be in Spanish.
Large landlords have stringent fair housing requirements and routinely attend training. Small landlords are ignorant of fair housing laws. They should be required to take the same training classes as large, corporate landlords.
Felons have a very difficult time finding housing. Could there be a program for felons that provides them with housing as long as they “prove themselves” – stay clean, keep their units tidy, etc. This would allow felons to reestablish themselves into society.
There is discrimination against Section 8 voucher holders in Johnson County, out west.
In the state of Kansas, the laws governing the landlord/tenant relationship heavily favor landlords.

BBC RESEARCH & CONSULTING SECTION III, PAGE 3
Could property managers be required to attend fair housing training before they receive a certificate of occupancy on newly built units?
Advocates stated that fair housing testing is needed, but there are no resources to conduct testing. Landlords feel that they are unfairly tested to get small settlement agreements.
Landlords are not held accountable for their actions. There needs to be more high profile cases where landlords are found in violation of the Fair Housing Act and there are consequences.
It is hard for people to write down their complaints; it is difficult to clearly describe what has happened. Sometimes alleged victims will give up rather than go through the complaint-filing process.
There is no affordable housing for low income individuals in Johnson County. Wyandotte County is the best option.
Public transportation for low income residents is a problem.
There may be a disconnect between the staff and the property managers with respect to housing victims of domestic violence. The managers may know the fair housing law but staff may deny based on the safety issue.
Stakeholder Survey
In addition to citizen input through four public forums, BBC developed two additional surveys—one for public service providers and one for the real estate community. These surveys were distributed through a network of stakeholders in the Kansas City Region generated through email lists from participating jurisdictions, direct contact with stakeholders and notifications about the survey posted on jurisdiction websites.
A total of 43 public service providers and 41 members of the real estate community responded. Respondents were provided with two different surveys tailored to their professional backgrounds. One survey was tailored to organizations providing public services and affordable housing. The other was tailored to professionals in the private real estate industry.
This section presents the findings from these surveys. First, the results from the advocate survey are analyzed, followed by the real estate professional survey. Where questions are the same, data from the two surveys are compared. The data reported in this section should be interpreted as the experiences of these respondents only, not as being statistically representative of the broader stakeholder community.

PAGE 4, SECTION III BBC RESEARCH & CONSULTING
Advocate Respondent Profile
Participants in the advocate survey included:
Neighborhood associations, transitional and emergency housing providers, housing coalitions, development corporations, religious organizations; and
Public housing authorities, representatives from participating jurisdictions.
Most service providers served low income individuals. They also provided services to special needs populations, including persons and families that are homeless, people who are physically disabled, persons with mental illness, elderly and to a lesser extent, immigrants, people who are developmentally disabled, persons with HIV/AIDS, persons with substance abuse problems, victims of domestic violence, youth and veterans.
The primary area served by respondents was Kansas City (Missouri and Kansas) followed by Independence and Lee’s Summit.
Service delivery. Respondents were asked to rank the degree to which services are delivered equitably across their community. Advocate respondents identified public transportation as the most inequitably distributed, followed by schools. Figure III-1 displays the results for all service categories.
Figure III-1. Survey Question: “Rank the degree to which the following services are delivered equitably across neighborhoods in your community.”
Notes:
n=23; The average ranking for each category is shown in parenthesis.
Source:
BBC Research & Consulting, December 2010-Feburary 2011 stakeholder survey.
Trash pick up (0.8)
Fire services (0.9)
Parks and recreation (0.9)
Police services (1.0)
Water and sewerinfrastructure (1.3)
Street infrastructure (1.4)
Code enforcement (1.6)
Schools (1.6)
Public transportation (1.9)
0% 20% 40% 60% 80% 100%
21.7% 13.0% 17.4% 47.8%
24.0% 20.0% 28.0% 28.0%
8.7% 43.5% 30.4% 17.4%
20.0% 40.0% 30.0% 10.0%
20.8% 37.5% 33.3% 8.3%
36.4% 31.8% 18.2% 13.6%
30.4% 47.8% 13.0% 8.7%
52.2% 17.4% 17.4% 13.0%
50.0% 20.8% 25.0%
4.2%
0 (VeryEquitable)
1
2
3 (VeryInequitable)
If respondents chose to rank services as inequitable or very inequitable (ranking of 2 or 3), they were asked to identify the specific areas of service that are most needed. Some of the identified needs are listed below:
Public transportation: reliable bus service, improved street infrastructure, more conveniently located; broader public transportation options.
Other: better snow removal, better park maintenance and more code enforcement.

BBC RESEARCH & CONSULTING SECTION III, PAGE 5
Housing Discrimination
Advocates believe that most of their clients are likely to experience discrimination when trying to buy or rent housing. More specifically:
Fourteen percent of advocates believe their clients are “very likely” to experience housing discrimination; and
Fifty-nine percent believe their clients are “somewhat likely” to experience housing discrimination.
Provider perception of client discrimination experiences. On average, advocate respondents reported that about one in four of their clients have experienced housing discrimination at some point in time. By client type, immigrant clientele were most likely to have experienced housing discrimination at some point while persons with HIV/AIDS were least likely. Figure III-2 displays the average percentage assigned to each type of clientele by respondents.
Figure III-2. Survey Question: “What percentage of clients do you believe have experienced housing discrimination at some point in time?”
Notes:
n=26; Reported percentages are the average among respondents.
Source:
BBC Research & Consulting, December 2010-Feburary 2011 stakeholder survey.
Persons with HIV/AIDS
Youth
Elderly
Persons with mental illness
Victims of domestic violence
Persons with physical disabilities
Persons with developmental disabilities
Persons with substance abuse or addiction
Persons who are homeless
Low income individuals
Immigrants
0% 10% 20% 30% 40% 50%
8.3%
9.4%
15.9%
19.5%
20.6%
22.3%
23.2%
25.0%
27.1%
33.0%
34.3%
100%
Respondents were asked to identify what types of discrimination these clients are most likely to experience. Responses included the following:
“Immigrants feel they have little recourse when a landlord refuses to return deposits or maintain properties.”
“Immigrants are offered not so nice units first because they are usually considered desperate for housing and will select anything.”
“Domestic violence survivors are evicted because of the domestic violence incident which creates barriers for future properties.”
“Excessive rent, deposits and additional rent charges for all ethnic minorities and immigrants because of assumed past rental problems.”
“Clients have been turned down for housing due to physical disability, no accommodations were made.”
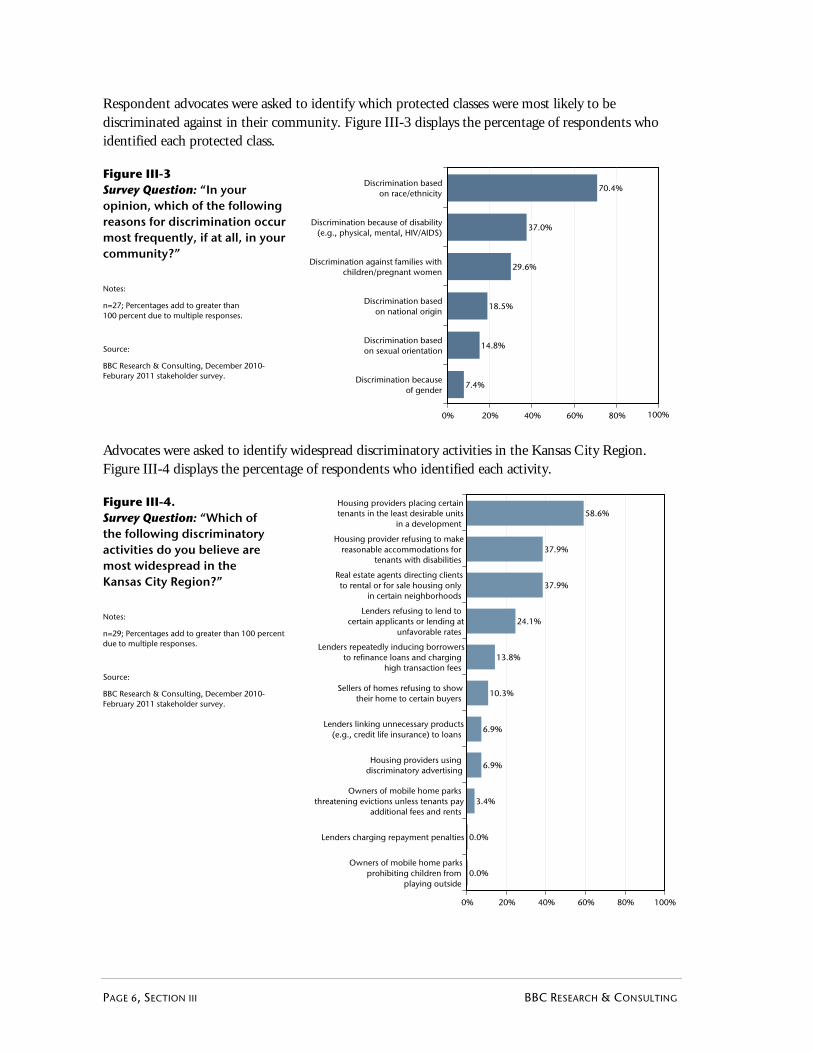
PAGE 6, SECTION III BBC RESEARCH & CONSULTING
Respondent advocates were asked to identify which protected classes were most likely to be discriminated against in their community. Figure III-3 displays the percentage of respondents who identified each protected class.
Figure III-3 Survey Question: “In your opinion, which of the following reasons for discrimination occur most frequently, if at all, in your community?”
Notes:
n=27; Percentages add to greater than 100 percent due to multiple responses.
Source:
BBC Research & Consulting, December 2010-Feburary 2011 stakeholder survey. Discrimination because
of gender
Discrimination basedon sexual orientation
Discrimination basedon national origin
Discrimination against families withchildren/pregnant women
Discrimination because of disability(e.g., physical, mental, HIV/AIDS)
Discrimination basedon race/ethnicity
0% 20% 40% 60% 80% 100%
70.4%
37.0%
29.6%
18.5%
14.8%
7.4%
100%
Advocates were asked to identify widespread discriminatory activities in the Kansas City Region. Figure III-4 displays the percentage of respondents who identified each activity.
Figure III-4. Survey Question: “Which of the following discriminatory activities do you believe are most widespread in the Kansas City Region?”
Notes:
n=29; Percentages add to greater than 100 percent due to multiple responses.
Source:
BBC Research & Consulting, December 2010-February 2011 stakeholder survey.
Owners of mobile home parksprohibiting children from
playing outside
Lenders charging repayment penalties
Owners of mobile home parksthreatening evictions unless tenants pay
additional fees and rents
Housing providers usingdiscriminatory advertising
Lenders linking unnecessary products(e.g., credit life insurance) to loans
Sellers of homes refusing to showtheir home to certain buyers
Lenders repeatedly inducing borrowersto refinance loans and charging
high transaction fees
Lenders refusing to lend tocertain applicants or lending at
unfavorable rates
Real estate agents directing clientsto rental or for sale housing only
in certain neighborhoods
Housing provider refusing to makereasonable accommodations for
tenants with disabilities
Housing providers placing certaintenants in the least desirable units
in a development
0% 20% 40% 60% 80% 100%
0.0%
0.0%
3.4%
6.9%
6.9%
10.3%
13.8%
24.1%
37.9%
37.9%
58.6%

BBC RESEARCH & CONSULTING SECTION III, PAGE 7
The most commonly recognized discriminatory activities are that housing providers place certain tenants in the least desirable units in the development and that housing providers refuse to make reasonable accommodations for tenants who are disabled. No respondents indicated that lenders charge repayment penalties or that mobile home park owners prohibit children from playing outside occur in the Kansas City Region. There was an option for respondents to indicate an “other” discriminatory activity. Nearly 30 percent of respondents selected the “other” option and identified a problem in the region of deceiving rent-to-own scams where the seller does not disclose the condition of the home.
Barriers to Fair Housing
Advocate respondents rated the degree of seriousness of potential barriers to fair housing in the Kansas City Region. Real estate stakeholders were given a more extensive list of barriers to evaluate, which are discussed later in this section.
Figure III-5. Degree of Seriousness of Potential Barriers, as Identified by Advocate Survey Respondents
Income levels of minority and female-headedhouseholds (2.9)
Concentration of low-income housing incertain areas (2.6)
Lack of knowledge among residents regardingfair housing (2.2)
Lack of knowledge among small landlordsregarding fair housing (2.1)
Lack of knowledge among large landlords/property managers regarding fair housing (1.8)
Use of “neighborhood stability” or similar factorsas proxies for racial makeup in appraisals (1.8)
Limited capacity of a local organization devotedto fair investigation/testing (1.5)
Lack of knowledge among real estate agentsregarding fair housing (1.5)
Lack of knowledge among bankers/lendersregarding fair housing (1.5)
Lack of knowledge among appraisers regardingfair housing (1.3)
Concentrations of group homes in certainneighborhoods (1.3)
Lack of knowledge among insurance industryrepresentatives regarding fair housing (1.3)
Restrictive covenants by homeowner associationsor neighborhood organizations (1.3)
Lack of adequate zoning for manufacturedhousing (1.2)
Limitations on density of housing (1.0)
0% 10% 20% 30% 40% 50% 60% 70% 80% 90% 100%
4.5% 4.5%
90.9%
43.5% 56.5%
4.3%
17.4%30.4% 47.8%
4.3%
13.0%47.8% 34.8%
4.5%
31.8%40.9% 22.7%
9.5% 14.3%61.9% 14.3%
13.6% 40.9%22.7% 22.7%
9.5% 42.9%33.3% 14.3%
17.4% 30.4%39.1% 13.0%
19.0% 33.3%42.9% 4.8%
27.3% 36.4%13.6% 22.7%
23.8% 33.3%33.3% 9.5%
17.4% 47.8%26.1% 8.7%
23.8% 42.9%23.8% 9.5%
31.8% 40.9%18.2% 9.1%
0(not abarrier)
1(minorbarrier)
2(modest barrier)
3(seriousbarrier)
0.0%
0.0%
Notes: n = 23; The average ranking for each category is shown in parenthesis.
Source: BBC Research & Consulting, December 2010-Feburary 2011 stakeholder survey.

PAGE 8, SECTION III BBC RESEARCH & CONSULTING
Ninety-six percent of respondents identified the income levels of minority and female headed households as a modest or serious barrier to fair housing and 100 percent of respondents identified a concentration of low-income housing in certain areas as a modest or serious barrier. The least serious barrier to affordable housing, as identified by respondents, was limitations on density of housing.
Filing a complaint. Twelve percent of advocates reported they have helped their clients file a housing discrimination complaint. Among the 88 percent who have not assisted a client file a housing discrimination complaint, approximately two-thirds said they knew which organization receives housing complaints.
Advocates were then asked to report the most common courses of action taken by their clients when they feel they have been discriminated against. The most common course of action was to do nothing. Figure III-6 displays the course of action most commonly taken by clients of respondents.
Figure III-6. Survey Question: “What is the most common course of action your clients take when they feel they have experienced housing discrimination?”
Notes:
n=25; Percentages add to greater than 100 percent due to multiple responses.
Source:
BBC Research & Consulting, December 2010–February 2011 stakeholder survey.
Call another organization
Call an attorney
Don't know
Call HUD
Call city government
Call Legal Aid
Call our organization
Do nothing
0% 20% 40% 60% 80% 100%
60.0%
36.0%
36.0%
28.0%
24.0%
20.0%
4.0%
0.0%
Beyond filing complaints, advocates were asked whether they believe some fair housing issues go unreported. All advocates who answered this question think that some fair housing issues are unreported. Specifically, they believe on average, 40 percent of fair housing violations are not reported in the Kansas City Region. Some of the reasons for clients not reporting fair housing issues include:
Renters have a fear of eviction, fear of future housing eligibility or retaliation by landlord;
Residents lack of knowledge, understanding or access to referral system; and,
Tenants and homebuyers don’t believe that they will receive help by reporting the discrimination.
Lastly, respondents were asked to identify what actions should be taken to address fair housing impediments or discrimination and who should be responsible for taking those actions. A list of frequently identified actions and responsible parties are listed below.
Actions:
Increase efforts to educate the public/landlords about fair housing rights and where to file complaints through ad campaigns or workshops.
Increase investigations and better code enforcement.

BBC RESEARCH & CONSULTING SECTION III, PAGE 9
Responsible party:
HUD, housing agencies, cities
Real Estate Respondent Profile
Participants of the real estate professional survey included individuals that serve:
Lee’s Summit, Independence, Blue Springs, City, KS and to a lesser extent, Kansas City, MO.
Members of the residential development industry had the largest representation among respondents. In addition, respondents also own rental properties, manage properties, offer loans, or sell real estate. Community housing leaders, planners and economic development advocates also participated in the real estate survey.
Barriers to Fair Housing
Real estate professional stakeholders rated the degree of seriousness of potential barriers to fair housing in the Kansas City Region among five categories: economic, demographic and housing factors; land use/zoning; knowledge/awareness issues; lending activities and; real estate activities.
Economic, demographic and housing factors. Figure III-7 depicts how real estate professionals rated the seriousness of several barriers to fair housing related to economics, demographics and housing. Real estate professionals consider the income of minority and female-headed households as well as the poor credit histories of minority borrowers to be more likely than other barriers to be serious.
Figure III-7 Degree of Seriousness of Potential Barriers to Fair Housing in Kansas City Region—Economic, Demographic and Housing Factors
Notes:
n=26; The average ranking for each category is shown in parenthesis.
Source:
BBC Research & Consulting, December 2010-Feburary 2011 stakeholder survey.
Lack of representation ofreal estate professionals bypersons of differing races,
ethnicities, disabilities, andgender (0.7)
Concentrations ofaffordable housing in
certain areas (1.3)
Income levels ofminority and female-headed
households (1.5)
Poor credit histories ofminority borrowers (1.6)
0% 20% 40% 60% 80% 100%
11.5% 34.6% 38.5% 15.4%
15.4% 42.3% 23.1% 19.2%
23.1% 42.3% 15.4% 19.2%
46.2% 38.5% 11.5%
3.8%
0(not abarrier)
1(minorbarrier)
2(modest barrier)
3(seriousbarrier)

PAGE 10, SECTION III BBC RESEARCH & CONSULTING
Land use/zoning. Figure III-8 depicts how real estate professionals rated the seriousness of several barriers to fair housing related to land use and zoning regulations. Respondents were most likely to identify a lack of adequate zoning for manufactured housing as a moderate or serious barrier among the land use/zoning categories. Approximately 88 percent of respondents indicated there is no barrier or a minor barrier to fair housing with regards to a concentration of group homes in certain neighborhoods.
Figure III-8 Degree of Seriousness of Potential Barriers to Fair Housing in Kansas City Region—Land Use and Zoning Factors
Notes:
n=26.
The average ranking for each category is shown in parenthesis.
Source
BBC Research & Consulting, December 2010-Feburary 2011 stakeholder survey.
Concentration of group homesin certain neighborhoods (0.8)
Restrictive covenants by buildersand developers and/or
homeowners associations (1.0)
Lack of adequate zoning formanufactured housing (1.0)
Limitations on densityof housing (1.2)
0% 20% 40% 60% 80% 100%
24.0% 48.0% 16.0% 12.0%
40.0% 28.0% 24.0% 8.0%
28.0% 48.0% 24.0%
30.8% 57.7% 7.7%
3.8%
0(not abarrier)
1(minorbarrier)
2(modest barrier)
3(seriousbarrier)
Knowledge/awareness issues. Figure III-9 depicts how real estate professionals rated the seriousness of several barriers to fair housing related to knowledge and awareness issues. Most respondents indicated that knowledge and awareness issues are not a barrier at all or a minor barrier to fair housing in the region. Approximately one third of respondents identified a lack of knowledge among bankers/lenders regarding fair housing as a moderate or serious barrier.
Figure III-9 Degree of Seriousness of Potential Barriers to Fair Housing in Kansas City Region—Knowledge and Awareness Issues
Note:
n=25.
The average ranking for each category is shown in parenthesis.
Source
BBC Research & Consulting, December 2010-Feburary 2011 stakeholder survey.
Limited capacity of a local organizationdevoted to fair housing investigation/
testing (1.0)
Lack of knowledge among appraisersregarding fair housing (1.0)
Lack of knowledge among insuranceindustry representatives regarding
fair housing (1.0)
Lack of knowledge among large landlords/property managers regarding
fair housing (1.0)
Lack of knowledge among realestate
agents regarding fair housing (1.1)
Lack of knowledge among bankers/lendersregarding fair housing (1.2)
Lack of knowledge among smalllandlords regarding fair housing (1.3)
Lack of knowledge among residentsregarding fair housing (1.3)
0% 20% 40% 60% 80% 100%
8% 64% 16% 12%
4% 72% 16% 8%
21% 46% 29% 4%
25% 54% 17% 4%
16% 68% 12% 4%
25% 50% 21% 4%
25% 50% 25%
28% 52% 16% 4%
0(not abarrier)
1(minorbarrier)
2(modest barrier)
3(seriousbarrier)

BBC RESEARCH & CONSULTING SECTION III, PAGE 11
Lending activities. Figure III-10 depicts how real estate professionals rated the seriousness of several barriers to fair housing related to lending activities. The majority of respondents identified lending activities as creating either no barrier or a minor barrier to fair housing. The most serious barrier, as identified by respondents, was a lack of knowledge among real estate agents regarding fair housing. Slightly more than 40 percent of respondents identified this lack of knowledge as a moderate or serious barrier to fair housing.
Real estate activities. Figure III-11 depicts how real estate professionals rated the seriousness of several barriers to fair housing related to real estate activities. The vast majority of respondents identified real estate activities as creating either no barrier or a minor barrier to fair housing. The most serious barrier, as identified by respondents, was rent-to-own programs that sell homes in poor condition to owners who cannot afford repairs. Approximately one quarter of respondents identified these rent-to-own programs as a moderate or serious barrier to fair housing.
Figure III-10 Degree of Seriousness of Potential Barriers to Fair Housing in Kansas City Region—Lending Activities
Lack of knowledge amongresidents regarding fair
housing (0.7)
Lack of knowledge among largelandlords/property managers
regarding fair housing (0.7)
Limited capacity of a localorganization devoted to fair housing
investigation/testing (0.7)
Lack of knowledge amongsmall landlords regarding fair
housing (1.0)
Lack of knowledge amongreal estate agents regarding
fair housing (1.2)
0% 20% 40% 60% 80% 100%
36.4% 22.7% 31.8% 9.1%
38.1% 28.6% 23.8% 9.5%
47.8% 34.8% 13.0%
4.3%
52.2% 30.4% 13.0%
4.3%
56.5% 26.1% 13.0%
4.3%
0(not abarrier)
1(minorbarrier)
2(modest barrier)
3(seriousbarrier)
Notes: n=24; The average ranking for each category is shown in parenthesis.
Source: BBC Research & Consulting, December 2010 – February 2011 stakeholder survey.
Figure III-11 Degree of Seriousness of Potential Barriers to Fair Housing in Kansas City Region—Real Estate Activities
Rent-to-own programs that sellhomes in poor rcondition to owners
who can’t afford repairs (0.9)
Real estate agents directing clientsto rental or sale of housing only in
certain neighborhoods (0.7)
Housing provider refusing to makereasonable accommodations for
tenants with disabilities (0.6)
Use of “neighborhood stability” orsimilar factors as proxies for
racial makeup in appraisals (0.6)
Insurance agency discrimination indecision to insure certain parties (0.5)
Housing providers placing certaintenants in the least desirableunits in a development (0.5)
Owners of mobile home parksprohibiting children from
playing outside (0.4)
Owners of mobile home parksthreatening evictions unless tenants
pay additional fees & rents (0.4)
Sellers of homes refusing to showtheir home to certain buyers (0.4)
Housing provider falsely denyingthat housing is available (0.4)
Housing providers usingdiscriminatory advertising (0.4)
0% 20% 40% 60% 80% 100%
42.3% 34.6% 15.4% 7.7%
53.8% 26.9% 11.5%7.7%
50.0% 42.3% 7.7%
56.0% 32.0% 12.0%
56.0% 36.0% 8.0%
57.7% 34.6% 7.7%
64.0% 28.0% 8.0%
60.0% 36.0% 4.0%
65.4% 30.8%
3.8%
61.5% 38.5%
61.5% 38.5%
0(not abarrier)
1(minorbarrier)
2(modest barrier)
3(seriousbarrier)
Notes: n = 26;
The average ranking for each category is shown in parenthesis.
Source: BBC Research & Consulting, December 2010-—February 2011 stakeholder survey.

PAGE 12, SECTION III BBC RESEARCH & CONSULTING
Eight percent of respondents identified there are land use or zoning regulations which create barriers to fair housing choice and twenty percent of respondents indicated that predatory lending practices are a serious problem in the region. 1 In both cases, the respondents did not identify specific examples of land use/zoning regulations or predatory lending practices.
Addressing Fair Housing Issues
Real estate professionals can address fair housing issues in a variety of ways including training staff or establishing fair housing programs within their organization. Some of the common ways real estate professionals have trained or monitored their staff to prevent discriminatory behavior are:
Attend training sessions with the National Apartment Association, Kansas Housing Resource Corporation, NeighborWorks America and local community development offices;
Stay current with fair housing law and train staff by examining recent cases; and
Complete online fair housing training.
When asked what programs or policies should be used to address fair housing issues, real estate respondents identified first-time homebuyer education.
Outside of their place of work or field, 90 percent of real estate respondents felt there are adequate information, resources, and training for fair housing laws in the Kansas City Region. Figure III-12 displays the best way to communicate with real estate professionals regarding fair housing issues, as identified by respondents.
Figure III-12. Survey Question: “What is the best way to communicate with professionals in your field about fair housing issues?”
Note:
n=20.
Source:
BBC Research & Consulting, December 2010-Feburary 2011 stakeholder survey.
GovernementPublications (10%)
IndustryPublications (25%)
Emails/websites (30%)
Conferences (25%)
Internal OrganizationMeetings (5%)
Internal Memos/Communication (0%)
City Public Hearings (5%)
1 Predatory lending practices might include targeting minority, woman-headed, and/or elderly households with high interest
rates; charging excessive fees without regard for borrower’s ability to pay; etc.

BBC RESEARCH & CONSULTING SECTION III, PAGE 13
Lastly, respondents were asked to identify what actions should be taken to address fair housing impediments or discrimination and who should be responsible for taking the actions. A list of the identified actions and responsible parties are listed below.
Actions:
Build/improve affordable housing;
Provide fair housing education and better enforcement;
Construct mixed-use and mixed-income development;
Publicize fair housing issues as they arise; and
Improve the quality of housing, not quantity of housing.
Responsible party:
HUD or social service agencies;
Elected officials;
Cities that receive CDBG funding; and
Local communities, NOT the federal government.
Summary
Generally, a small percentage of real estate survey respondents identified moderate or serious barriers to affordable housing where as advocates were more likely to identify moderate and serious barriers. To illustrate this difference, Figure III-13 displays six possible barriers to fair housing showing the disparity between advocate and real estate respondents.
In both surveys, there was agreement between advocates and real estate professional respondents that:
Rent-to-own programs are a problem in the region and create a barrier to fair housing,
There is a lack of knowledge among residents regarding their fair housing rights (although few real estate professionals indentified this as a barrier to fair housing),
There is a need for education and outreach efforts to inform residents of their fair housing rights, and
There is opportunity to improve and increase enforcement of fair housing rights.

PAG
E 1
4, S
ECTI
ON
III
B
BC
RES
EARC
H &
CO
NSU
LTIN
G
Fig
ure
III
-13
. C
om
par
iso
n b
etw
een
Ad
voca
te a
nd
Rea
l Est
ate
Pro
fess
ion
al S
urv
ey R
esp
on
den
ts C
lass
ific
atio
n o
f B
arri
ers
to F
air
Ho
usi
ng
Not
a b
arrie
r or
m
inor
bar
rier
Mod
erat
e or
se
rious
bar
rier
0%20%
40%
60%
80%
100%
4.5%
57.7
%
95.5
%
42.3
%
Inco
me
leve
ls o
f min
orit
y an
dfe
mal
e-h
ead
ed h
ouse
hol
ds
Not
a b
arrie
r or
m
inor
bar
rier
Mod
erat
e or
se
rious
bar
rier
0%20%
40%
60%
80%
100%
0.0%
65.4
%
100.
0%
34.6
%
Lack
of k
now
led
ge
amon
g r
eal
esta
te a
gen
ts r
egar
din
g fa
ir h
ousi
ng
Not
a b
arrie
r or
m
inor
bar
rier
Mod
erat
e or
se
rious
bar
rier
0%20%
40%
60%
80%
100%
21.7
%
72.0
%78
.3%
28.0
%
Lack
of k
now
led
ge
amon
g r
esid
ents
reg
ard
ing
fair
hou
sin
g
Not
a b
arrie
r or
m
inor
bar
rier
Mod
erat
e or
se
rious
bar
rier
0%20%
40%
60%
80%
100%
17.4
%
76.0
%82
.6%
24.0
%
Lack
of k
now
led
ge
amon
g s
mal
lla
nd
lord
s re
gar
din
g fa
ir h
ousi
ng
Not
a b
arrie
r or
m
inor
bar
rier
Mod
erat
e or
se
rious
bar
rier
0%20%
40%
60%
80%
100%
36.4
%
84.0
%
63.6
%
16.0
%
Lack
of k
now
led
ge
amon
g la
rge
lan
dlo
rds/
pro
per
ty m
anag
ers
reg
ard
ing
fair
hou
sin
g
Not
a b
arrie
r or
m
inor
bar
rier
Mod
erat
e or
se
rious
bar
rier
0%20%
40%
60%
80%
100%
23.8
%
88.0
%
76.2
%
12.0
%
Use
of “
nei
gh
bor
hoo
d s
tab
ility
” or
sim
ilar
fact
ors
as p
roxi
es fo
r ra
cial
mak
eup
in a
pp
rais
als
Not
a b
arrie
r or
m
inor
bar
rier
Mod
erat
e or
se
rious
bar
rier
0%20%
40%
60%
80%
100%
54.5
%
80.0
%
45.5
%
20.0
%
Lim
ited
cap
acit
y of
a lo
cal
org
aniz
atio
n d
evot
ed t
o fa
irin
vest
igat
ion
/tes
tin
g
Not
a b
arrie
r or
m
inor
bar
rier
Mod
erat
e or
se
rious
bar
rier
0%20%
40%
60%
80%
100%
52.4
%
79.2
%
47.6
%
20.8
%
Lack
of k
now
led
ge
amon
g r
eal
esta
te a
gen
ts r
egar
din
g fa
ir h
ousi
ng
Ad
voca
te R
esp
ond
ents
Rea
l-es
tate
Res
pon
den
ts
Not
e:
n=25
.
Sour
ce:
BBC
Res
earc
h &
Con
sulti
ng, D
ecem
ber
2010
– F
ebru
ary
2011
sta
keho
lder
sur
vey.

SECTION IV. Complaint, Legal and Lending Analysis

BBC RESEARCH & CONSULTING SECTION IV, PAGE 1
SECTION IV. Complaint, Legal and Lending Analysis
This section examines private barriers to fair housing choice, as well as violations of the Fair Housing Act. It analyzes the fair housing complaints received by HUD during the past 6 years, discusses legal cases concerning fair housing issues and ends with a quantitative evaluation of lending practices in the Kansas City region.
Complaint and legal analysis summary.
Since August 2005, a total of 577 complaints were filed with HUD by residents in the Kansas City region. The complaints were largely filed on the basis of race and disability discrimination (at 39 and 31 percent of the complaints, respectively).
The majority of complaints originated from Kansas City, MO (60 percent), followed by Kansas City, KS (18 percent) and Independence (10 percent). Kansas City, MO, with 33 percent of the region’s population therefore has disproportionately more complaints filed.
In 2009, there were approximately 117,700 loan applications made in the Kansas City MSA. For the region overall, 64 percent of loans were approved and 16 percent were denied (the others were withdrawn by the applicants, closed for incompleteness, etc). Loan denial rates were much higher for African American and Hispanic applicants across all communities. The differences in loan denial rates between African American versus white applicants and Hispanic versus non-Hispanic applicants were the greatest in Kansas City, KS and Kansas City, MO.
Census Tracts with high loan denial rates and presence of African Americans is most notable in Kansas City, MO.
Fair Housing Complaints
Citizens of Kansas City who believe they have experienced discrimination in violation of the Federal Fair Housing Act or state fair housing laws may report their complaints to the following entities:
HUD’s Office of Fair Housing and Equal Opportunity in Kansas City, Kansas (FHEO);1
The State of Kansas Human Rights Commission;
The Missouri Commission on Human Rights;
Kansas City, Kansas Human Relations Commission;
Leavenworth Human Relations Commission;
Overland Park’s City Clerk;
Shawnee City Clerk;
1 HUD also has an office in St. Louis which covers the eastern half of Missouri.

BBC RESEARCH & CONSULTING SECTION IV, PAGE 2
Blue Springs, Missouri City Attorney;
Independence, Missouri Human Relations Department;
Kansas City , Missouri Civil Rights Division; and
Lee’s Summit Human Relations Commission.
HUD complaint procedures. Housing discrimination complaints filed with HUD may be done online at (http://www.hud.gov/complaints/housediscrim.cfm), by calling 1-800-669-9777 or by contacting the HUD Regional Office of Fair Housing and Equal Opportunity in Kansas City (1-800-743-5323).
When HUD receives a complaint, the department will notify the person who filed the complaint, then notify the alleged violator and allow that person to submit a response. The complaint will be investigated to determine whether there has been a violation of the Fair Housing Act.
A complaint may be resolved in a number of ways. First, HUD attempts to reach an agreement between the two parties involved. If achieved, this “conciliation agreement” must lay out provisions to protect the filer of the complaint and public interest. If an agreement is signed, HUD will take no further action unless the agreement is breached, in which case HUD will recommend that the Attorney General file suit.
If a person needs immediate help to stop a serious problem being caused by a Fair Housing Act violation, HUD may assist as soon as a complaint is filed. HUD may authorize the Attorney General to go to court to seek temporary or preliminary relief, pending the outcome of the complaint, if irreparable harm is likely to occur without HUD's intervention and there is substantial evidence indicating a violation of the Fair Housing Act.
Kansas state complaint procedures. The State of Kansas law provides that any person who claims to be aggrieved by an unlawful practice in the areas of employment, housing, or public accommodations based on race, religion, color, sex, disability, ancestry, national origin, age in the area of employment only, familial status in the area of housing only, and retaliation) may file a complaint with the Kansas Human Rights Commission (KHRC).
In addition, a state law enacted in April 2005 allows any person who believes they have been subjected to racial or other profiling by a law enforcement officer or agency to file a complaint with the KHRC.
A complaint may be filed personally or by attorney. An individual may write, telephone or come in to one of the Kansas Human Rights Commission's offices to begin the filing process. If the complaint falls within the Commission's jurisdiction, a formal complaint may be submitted. Intake workers are available to assist in drafting a complaint based on information provided by the complainant. The intake department also provides inquirers with referrals to other agencies for issues outside of KHRC's jurisdiction.
The complaint must be signed and notarized before it can be officially filed with the Commission. A complaint alleging racial or other profiling is not required to be notarized.

BBC RESEARCH & CONSULTING SECTION IV, PAGE 3
During the investigation of a complaint, a field investigator will interview the complainant, review relevant documents, conduct interviews with witnesses, and summarize the case for the investigating commissioner. The investigator does not determine the outcome of the case, but rather gathers and presents the facts to a commissioner for determination.
Depending upon the information obtained during the investigative process, the investigating commissioner makes a determination of either "Probable Cause" or "No Probable Cause." If the Commission finds "Probable Cause,” then an attempt will be made to reach a written settlement between complainant and respondent. If conciliation efforts fail, the case may be scheduled for a public hearing.
The Commission offers a third-party mediation program statewide through Kansas Legal Services.
Missouri state complaint procedures. The Missouri Revised Statutes Chapter 213 defines human rights violations and unlawful discriminatory practices for employment, public accommodations and housing. The Missouri Commission on Human Rights (MCHR) enforces the statute. The division’s website outlines steps a resident should take if they think their rights have been violated, and includes a four-question discrimination assessment complaint form.2 Complaints must be filed within 180 days of the alleged discrimination.
After a complaint is filed, MCHR provides the complaint to the accused parties and invites them to mediate or settle with the complainant. If the complainant requests a right-to-sue letter, they have 90 days to file suit. 3 If there is no intent to sue, a neutral investigator is assigned to the case to conduct witness interviews, gather and review pertinent documents and provide an investigative summary. MCHR then uses the investigative findings to determine whether there is probable cause of discrimination.
If there is no probable cause, the MCHR closes its case and notifies the complainant of their Right to Sue. The complainant then has 90 days to file suit against the respondent.
If probable cause has been determined and the case is not resolved, the case is set for hearing or dismissal. At the hearing MCHR’s case is generally presented by an Assistant Attorney General. The Hearing Examiner conducts the hearing and issues a finding and recommendation. If no discrimination is found, then the case is dismissed. If probable cause is found (discrimination may exist), remedies are ordered. Either party has the right to appeal the decision to circuit court.
Local ordinances and procedures.
Kansas City, Kansas. The City’s Human Relations Commission was created in 1964. The Commission consists of 13 members, who meet monthly. The city has empowered the Commission to function in an advisory role to the unified government board of commissioners on problems affective of “human and intergroup relations.” In addition, the Commission can “mediate disputes voluntarily referred to it in order to minimize or eliminate prejudice, intolerance, bigotry, disorder or discrimination and in order to promote good will in the community. “
2 http://www.labor.mo.gov/mohumanrights/File_Complaint/
3 The Right to Sue Letter (RTS) allows complainants to file a suit in state court on the discriminatory acts alleged in the
complaint filed with MCHR. If a RTS Letter is obtained, then MCHR stops its investigation.

BBC RESEARCH & CONSULTING SECTION IV, PAGE 4
The government’s human services department has the actual authority to investigate complaints. To file a complaint, a resident must sign the complaint and file it with the department within 180 days after the alleged discriminatory practice has occurred. The complaint must include the date, place and circumstances of the alleged discriminatory practice.
Leavenworth has a Human Relations Commission that oversees the city’s non-discrimination ordinance. Citizens who want to file a complaint can contact the Commission (there is not a specific form to use for complaints). Residents have 90 days to file a complaint after the alleged violation has occurred.
Overland Park has a local fair housing ordinance that is very similar to the Federal Fair Housing Act. Citizens who want to file a complaint under the ordinance are referred to the City Clerk; complaints must be filed within 180 days of the alleged violation.
A citizen of Overland Park that may have a fair housing complaint can go to city hall and file a complaint with the Fair Housing Board (FHB). The Fair Housing Board will review the complaint and determine whether the complaint should be investigated (by the FHB or HUD) or if there is no cause. The city has not received a complaint in more than 8 years.
Shawnee has a fair housing policy that is overseen by its Fair Housing Committee. The Fair Housing Policy includes provisions to protect the sale or rental of housing, financing of housing and housing brokerage services. Citizens wishing to file complaints must do so in written form with the City Clerk within 180 days of the violation.
Blue Springs passed a fair housing ordinance (#2115) in 1991, which contains protections similar to the Federal Fair Housing Act. The local ordinance is enforced by the City Attorney. The city may also refer a complainant to HUD to file under the federal act. The city has not had a fair housing complaint in more than 10 years.
Independence. City attorneys provide advisory support services to city staff and the Human Relations Department, which is responsible for receiving and managing fair housing complaints. The first point of contact for fair housing issues in Independence is the city’s Human Relations specialist in the Human Relations Department. If the city cannot answer fair housing questions from residents, they are referred to HUD.
Kansas City, Missouri. The Kansas City Human Relations Department, Civil Rights Division enforces the city’s fair housing laws. The section has a good website outlining the steps a resident should take if they think their rights have been violated and what constitutes a violation, which includes a form that allows residents to file a complaint.4 Complaints must be filed within 180 days of the alleged discrimination.
Written complaints must contain: Name and address of the persons filing the complaint; the name and address of the subject of complaint; and a description of acts or omissions in the alleged violation.
4 http://www.kcmo.org/CKCMO/Depts/CityManagersOffice/HumanRelationsDivision/CivilRightsEnforcementSection

BBC RESEARCH & CONSULTING SECTION IV, PAGE 5
Within 30 days of receiving the written complaint, the Director of Human Relations will commence investigation of the allegation. Both parties, the complainant and those accused of discrimination, will be served notice of the complaint. The investigation will be completed within 100 days of the complaint filing, unless this is impractical. A final administrative disposition will be issued within one year of the original complaint.
If the Human Relations Department determines probable cause does not exist, the director will issue and serve all parties a written notice indicating no probable cause exists. If the Human Relations Department determines that probable cause for discrimination does exist, the director begins the process to eliminate the unlawful, discriminatory acts. Agreements made with accused parties always include a provision requiring the parties to refrain from the alleged discriminatory practices in the future and may include additional provisions agreed upon by the parties.
A party that fails to eliminate the unlawful discriminatory practice in the agreed upon manner is served a written notice of continued violation. The director may also refer this matter to the Kansas City Human Rights Commission or to the city attorney for possible prosecution in municipal court.
The ordinance prohibits discrimination in housing based on a person’s race, marital status, color, religion, sex, disability, familial status, national origin, sexual orientation and gender identity.
During the past year (July 1, 2009 through June 30, 2010) the section fielded over a hundred inquiries regarding possible discriminatory conduct, and conducted 40 formal investigations of discrimination. Most of the claims involved allegations of discrimination based on disability (13) and race (10). Of the 40 formal complaints filed, 19 were resolved through successful conciliation either prior to or after a Reasonable Cause determination had been rendered. Complainants received over $37,000 in settlements. Three complaints alleging sexual harassment at an apartment complex are currently being reviewed by the U.S. Department of Justice to determine whether they will file lawsuits in the cases.
Lee’s Summit. Since 1964, Lee’s Summit has had a Human Relations Commission. The Commission consists of seven citizen members, appointed by the mayor with the consent of the City Council, for three-year terms. In May 1993, Lee’s Summit updated Chapter 15, Human Rights, of the Lee’s Summit Code of Ordinances to eliminate and prevent discrimination in all employment relations; eliminate and prevent discrimination, segregation or separation in all areas of public accommodations; and, eliminate and prevent discrimination, segregation or separation in housing. The city’s Deputy City Manager’s office investigates complaints.
Citizens of Lee’s Summit who feel they have been discriminated against can file a complaint with the City’s Human Relations Commission. The commission has the responsibility to address all complaints. Depending on the complexity and realm of the discrimination, the commission will either try to resolve the complaint, refer it to The Missouri Human Relations Commission (between a market-rate rental property and a tenant), or to HUD (if the discrimination involved public housing or a Section 8 voucher).

BBC RESEARCH & CONSULTING SECTION IV, PAGE 6
Complaints filed with HUD. Since August 2005, a total of 577 complaints were filed with HUD by residents in the Kansas City region. Figure VI-1 displays the percentage of complaints by protected class and cause of discrimination.
Figure IV-I. Complaints Filed with HUD, Kansas City Region, August, 2005 through October, 2010
Note: A total of 577 separate complaints were filed. Some complaints were filed for more than one reason; there were a total of 662 reasons.
Source:
HUD’s Kansas City Kansas Regional Office of Fair Housing and Equal Opportunity (FHEO).
Disability (31%)
Race (39%)
Retaliation (5%)
Gender (9%)
National Origin (3%)Family Status (6%)
Other Origin (3%)Religion (2%)
Harassment (2%)
Race and disability were the most common protected classes in the complaints (at 39 and 31 percent of the complaints, respectively). The next highest percentage was a much lower alleged discrimination because of gender (9 percent). Discrimination based on religion (2 percent) and national origin (3 percent) were less commonly cited.
As shown in Figure IV-2, the majority of complaints originated from Kansas City, MO (60 percent), followed by Kansas City, KS (18 percent) and Independence (10 percent). Kansas City, MO, with 33 percent of the region’s population therefore has disproportionately more complaints filed.
The columns to the right of the Share of Study Area Complaints column show the basis of the complaints in each community by protected class.
Figure IV-2. Share and Nature of Complaint by City, August 2005 through October 2010
Kansas City MSA 577
Kansas
Johnson County * 16% 93 48% 25% 8% 7% 2% 10%
Kansas City 15% 87 49% 24% 8% 6% 2% 10%
Leavenworth 1% 6 22% 33% 11% 22% 0% 11%
Overland Park 7% 40 35% 42% 13% 4% 4% 2%
Shawnee 3% 17 35% 50% 5% 0% 5% 5%
Missouri
Kansas City 60% 346 37% 28% 11% 5% 7% 12%
Independence 10% 58 33% 47% 5% 4% 5% 5%
Blue Springs 2% 12 47% 33% 0% 13% 7% 0%
Lee's Summit 2% 11 56% 25% 0% 13% 0% 6%
RetaliationNumber of Complaints
31%
Complaints
39%
Other
10%
Gender
5%9%
Share of FamilyStatus
6%
Study Area Race Disability
Note: * Excluding Overland Park and Shawnee.
Source: HUD’s Kansas City Kansas Regional Office of Fair Housing and Equal Opportunity (FHEO).

BBC RESEARCH & CONSULTING SECTION IV, PAGE 7
According to HUD, the vast majority of the fair housing complaints filed involved “discriminatory terms, conditions, privileges, or services and facilities.” The second most common type of discrimination was a discriminatory refusal to rent.
Approximately one in five of the complaints filed (22 percent) was successfully resolved. The largest portion of cases (45 percent) was found to have no reasonable cause. The remaining cases (34 percent) were withdrawn by the complainant, lacked complainant cooperation or dismissed for lack of jurisdiction and could not be investigated further.
Figure IV-3. Outcome of HUD Complaints, Kansas City Region, 2005 to 2010
Note:
Complaint data was collected for Blue Springs, Lee’s Summit, Kansas City KS, Kansas City MO, Independence, Johnson County, Leavenworth, Overland Park and Shawnee
“Other” reasons include: untimely filing, inability to locate complainant or complaint closed for the start of a trial.
Source:
HUD’s Kansas City Kansas Regional Office of Fair Housing and Equal Opportunity (FHEO).
No CauseDetermination (45%)
Conciliation/SettlementSuccessful (22%)
ComplaintWithdrawn By
Complainant (19%)
Complainant FailedTo Cooperate (12%)
Dismissed For Lack ofJurisdiction and Other (3%)
Legal Cases
As part of the fair housing analysis, recent legal cases were reviewed to determine significant fair housing issues and trends in the Kansas City area. Searches of the Department of Justice and the National Fair Housing Advocate case databases found four cases involving the Fair Housing Act in the Kansas City study area since 2000. This section summarizes the issues and outcomes in these cases. Most of the cases involve alleged claims of discrimination based on race.
Housing discrimination on the basis of race. The following cases pertain to fair housing violations on the basis race.
United States of America v. Margie Loftus (2005). In November, 2004 Mr. Zachary asked a friend to view an apartment in Roeland Park, Kansas for rent at a four-unit apartment complex on his behalf. The friend viewed the apartment and told the owner and manager, Margie Loftus, that her friend would be interested in renting the apartment. Upon learning that the friend (Mr. Zachary) is African American, Ms. Loftus stated she could not rent to African Americans because other tenants would move out and the apartments were her only source of income. After several unsuccessful attempts to schedule an appointment to view the apartment with Ms. Loftus, Mr. Zachary filed a complaint with HUD alleging that Ms. Loftus violated the Fair Housing Act by refusing to rent a unit to him on the basis of race. In September 2005, the district court found that Ms. Loftus had violated the Fair Housing Act by engaging in racially discriminatory housing practices. In September 2006, a consent order was issued by the district court. The order provides that Ms. Loftus pay $17,500 in monetary damages to Mr. Zachary as well as implement measures and training methods to ensure that she and all of her employees refrain from discriminatory practices in the future.

BBC RESEARCH & CONSULTING SECTION IV, PAGE 8
King v. Metcalf 56 Homeowners Association (2005). In late 2004, Tremica King filed a lawsuit against Metcalf 56 Homeowners Association and former neighbors Linda Baker and Richard Kinney. Ms. King alleged a violation of the FHA claiming she was harassed by her neighbors (one of whom was on the Homeowner’s Association board and managed the property) because of her race while renting a duplex in the Metcalf 56 Development located in Mission, Kansas. The lawsuit also included a common law claim for invasion of privacy for intrusion upon seclusion. Defendants in the case moved for summary judgment5 on both claims, however summary judgment was only granted for the invasion of privacy claim. The FHA violation was set for trial in October, 2005. On October 24, 2005 the case was dismissed by the District Court of Kansas due to a telephone conference between the parties one week earlier where all disputes between the parties were resolved.
United States v. Sturdevant, et. al.(2007). On June 1, 2007 the United States filed a complaint against Stacy Sturdevant, and AIMCO Properties L.P. alleging discrimination on the basis of race as well as interfering, coercing or intimidating a person exercising or encouraging another person to exercise rights granted to them by the FHA. The complaint was amended on September 18, 2008. The complainant, Ms. Kothe, was an employee of AIMCO Properties L.P. and witnessed Ms. Sturdevant use inappropriate and disrespectful language towards a tenant, who was of a different race than Ms. Sturdevant at the apartment complex she managed in Kansas City, Kansas. When federal investigators asked Ms. Kothe about the incident as well as previous racial discrimination complaints, Ms. Kothe confirmed the discrimination.6 As a result of Ms. Kothe’s compliance and advocacy of fair housing laws for tenants of the property, Ms. Sturdevant told Ms. Kothe she did not want her to advocate for tenants regarding fair housing issues and accused Ms. Kothe of filing a falsified resident document. The alleged falsified document led AIMCO Properties L.P to suspend and eventually terminate Ms. Kothe. On February, 24 2010, the Court issued a consent order to settle the dispute with a cash payment of $1,890,000 to the aggrieved persons and an additional $95,000 in civil penalties paid U.S. Treasury. The Consent Order constituted “a full and final resolution of all claims of violation of the Fair Housing Act that the United States alleged, or could have alleged against the AIMCO Defendants relating to housing discrimination at the subject property.” On May 13, 2010 the court issued an order for default judgment against Ms. Sturdevant banning her from ever working in rental housing and ordering her to pay $55,000 in civil penalties to the U.S. Treasury.
Failure to comply with accessibility standards. The following case pertains to fair housing violations on the basis disability.
United States of America v. Todd E. Bleakley, et. al (2002). In 2002, The United States filed a second complaint against Mr.Bleakley, developer and owner of the Wyncroft and Homestead apartment complexes located in Olathe, Kansas. The complaint alleged that Mr.Bleakley engaged in a pattern of discrimination by failing to design both of the aforementioned properties with the features of accessible and adaptive design. In addition, the United States alleged that the defendants engaged in a pattern or practice of violating the ADA because the rental offices at the two properties were not readily accessible or usable by individuals with disabilities. Both properties did not have elevators and were more than four units, which according to the Fair Housing Act, mandates special qualifications on the accessibility of the units on the bottom floor: all of the units must include certain basic features
5 Summary judgment is a decision made by the court without a full trial.
6 Ms. Sturdevant allegedly exhibited a pattern or practice of discrimination by discriminating in the terms, conditions, or
privileges of the rental of a dwelling including derogatory remarks towards African Americans and hostile materials such as hangman’s nooses.
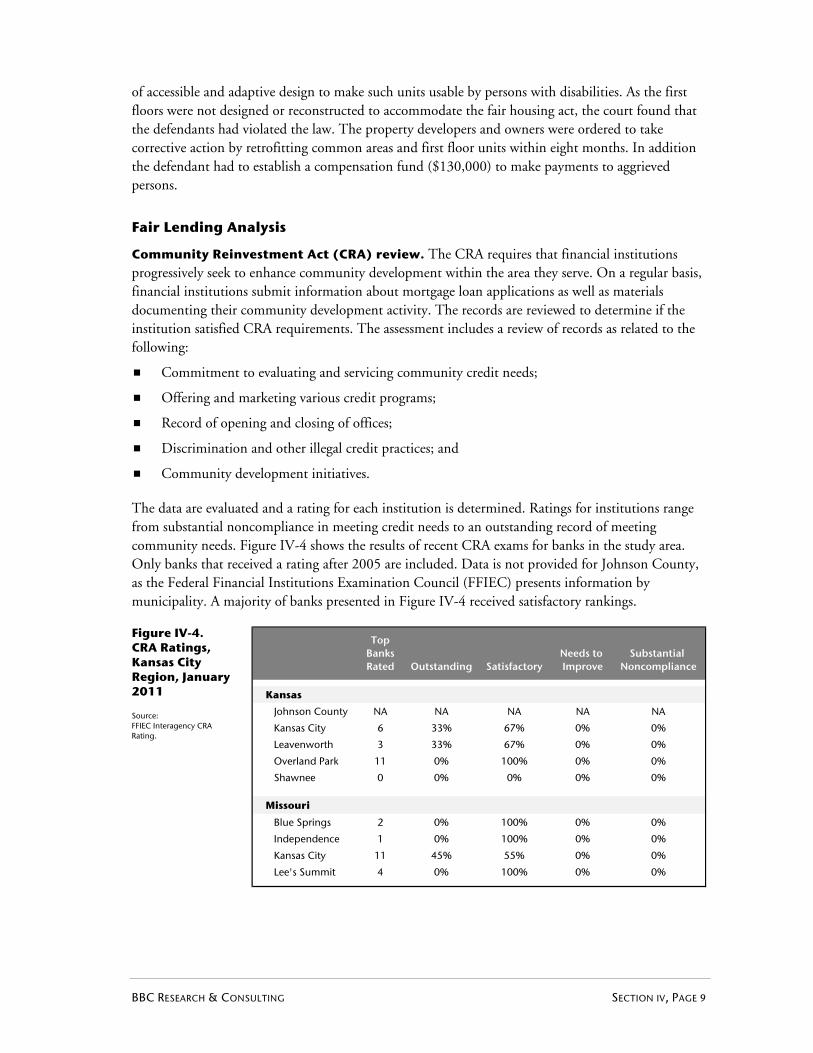
BBC RESEARCH & CONSULTING SECTION IV, PAGE 9
of accessible and adaptive design to make such units usable by persons with disabilities. As the first floors were not designed or reconstructed to accommodate the fair housing act, the court found that the defendants had violated the law. The property developers and owners were ordered to take corrective action by retrofitting common areas and first floor units within eight months. In addition the defendant had to establish a compensation fund ($130,000) to make payments to aggrieved persons.
Fair Lending Analysis
Community Reinvestment Act (CRA) review. The CRA requires that financial institutions progressively seek to enhance community development within the area they serve. On a regular basis, financial institutions submit information about mortgage loan applications as well as materials documenting their community development activity. The records are reviewed to determine if the institution satisfied CRA requirements. The assessment includes a review of records as related to the following:
Commitment to evaluating and servicing community credit needs;
Offering and marketing various credit programs;
Record of opening and closing of offices;
Discrimination and other illegal credit practices; and
Community development initiatives.
The data are evaluated and a rating for each institution is determined. Ratings for institutions range from substantial noncompliance in meeting credit needs to an outstanding record of meeting community needs. Figure IV-4 shows the results of recent CRA exams for banks in the study area. Only banks that received a rating after 2005 are included. Data is not provided for Johnson County, as the Federal Financial Institutions Examination Council (FFIEC) presents information by municipality. A majority of banks presented in Figure IV-4 received satisfactory rankings.
Figure IV-4. CRA Ratings, Kansas City Region, January 2011
Source: FFIEC Interagency CRA Rating.
Kansas
Johnson County NA NA NA NA NA
Kansas City 6 33% 67% 0% 0%
Leavenworth 3 33% 67% 0% 0%
Overland Park 11 0% 100% 0% 0%
Shawnee 0 0% 0% 0% 0%
Missouri
Blue Springs 2 0% 100% 0% 0%
Independence 1 0% 100% 0% 0%
Kansas City 11 45% 55% 0% 0%
Lee's Summit 4 0% 100% 0% 0%
Needs to Improve
Substantial Noncompliance
Top
Rated Outstanding SatisfactoryBanks

BBC RESEARCH & CONSULTING SECTION IV, PAGE 10
Home Mortgage Disclosure Act (HMDA) Data analysis. HMDA data are widely used to detect evidence of discrimination in mortgage lending. In fact, concern about discriminatory lending practices in the 1970s led to the requirement for financial institutions to collect and report HMDA data. The variables contained in the HMDA dataset have expanded over time, allowing for more comprehensive analyses and better results. However, despite expansions in the data reported, HMDA analyses remain limited because of the information that is not reported.
As such, studies of lending disparities that use HMDA data carry a similar caveat: HMDA data can be used to determine disparities in loan originations and interest rates among borrowers of different races, ethnicities, genders, and location of the property they hope to own. The data can also be used to explain many of the reasons for any lending disparities (e.g., poor credit history). Yet HMDA data do not contain all of the factors that are evaluated by lending institutions when they decide to make a loan to a borrower. Basically, the data provide a lot of information about the lending decision—but not all of the information.
Beginning in 2004, HMDA data contained the interest rates on higher-priced mortgage loans. This allows examinations of disparities in high-cost, including subprime, loans among different racial and ethnic groups. It is important to remember that subprime loans are not always predatory or suggest fair lending issues, and that the numerous factors that can make a loan “predatory” are not adequately represented in available data. Therefore, actual predatory practices cannot be identified through HMDA data analysis. However, the data analysis can be used to identify where additional scrutiny is warranted, and how public education and outreach efforts should be targeted.
HMDA data report several types of loans. These include loans used to purchase homes, loans to make home improvements and refinancing of existing mortgage loans, as defined below.
Home purchase loan. A home purchase loan is any loan secured by and made for the purpose of purchasing a housing unit.
Home improvement loan. A home improvement loan is used, at least in part, for repairing, rehabilitating, remodeling, or improving a housing unit or the real property on which the unit is located.
Refinancing. Refinancing is any dwelling-secured loan that replaces and satisfies another dwelling-secured loan to the same borrower. The purpose for which a loan is refinanced is not relevant for HMDA purposes.
The HMDA data are separated into two primary loan categories: conventional loans and government-guaranteed loans. Government-guaranteed loans are those insured by the Federal Housing Administration and Veterans Administration.
The most recent HMDA data is available for 2009.This section uses the analysis of 2009 HMDA data to uncover:
The geographic areas in communities where high-cost lending and loan denials are concentrated, and the correlation of these areas with concentrations of minority and low income households; and
Disparities in high-cost lending and loan denials across different racial and ethnic groups.

BBC RESEARCH & CONSULTING SECTION IV, PAGE 11
Number of loans. In 2009, there were approximately 117,700 loan applications made in the Kansas City MSA. Figure IV-5 presents the distribution of loan applications by jurisdiction alongside the overall population distribution of the MSA. The largest proportion of loan applications (43 percent) in the MSA was made in Kansas City, MO, which also contains 22 percent of the MSA’s population.
Figure IV-5. Number of Loan Applications, 2009
Source: Home Mortgage Disclosure Act (HMDA), 2009.
Kansas
Johnson County 39,645 33.7% 26.5%
Kansas City 11,867 10.1% 7.2%
Leavenworth 2,210 1.9% 1.7%
Overland Park 17,610 15.0% 8.3%
Shawnee 8,499 7.2% 3.1%0.0%
Missouri
Blue Springs 4,840 4.1% 2.6%
Independence 9,129 7.8% 6.0%
Kansas City 50,947 43.3% 22.0%
Lee's Summit 10,826 9.2% 4.6%
Percent of
MSA's Population
Percent MSA's
Loan Applications
Loan
Applications
Types of loans. Conventional loans were the most common type of loan used in applications submitted in 2009. Sixty-four percent of all loan applications submitted in 2009 in the MSA were for conventional loans. Given the military presence in Leavenworth, it is not surprising that 19 percent of loan applications in that community were for VA-Guaranteed loan products administered by the Veterans Administration. Figure IV-6 summarizes the types of loan products applied for in 2009.
Figure IV-6. Types of Loan Applications, Study Area, 2009 Source: Home Mortgage Disclosure Act (HMDA), 2009.
Kansas City MSA 63.8% 31.7% 1.1% 3.4%
KansasJohnson County 73.7% 23.7% 0.5% 2.1%
Kansas City 62.0% 32.6% 0.4% 4.9%
Leavenworth 58.2% 22.2% 0.5% 19.0%
Overland Park 78.9% 19.6% 0.0% 1.5%
Shawnee 72.1% 25.1% 0.6% 2.2%
MissouriBlue Springs 57.1% 38.6% 0.3% 3.9%
Independence 53.4% 42.7% 0.3% 3.6%
Kansas City 61.6% 34.4% 0.2% 3.7%
Lee's Summit 65.6% 31.0% 0.0% 3.4%
Conventional InsuredFHA FSA-RHS
(Farm Service) VA-Guaranteed
Most loan applications in the study area were submitted to refinance existing mortgages. For example, 74 percent of loan applications submitted by Overland Park residents were for refinance loans. Approximately one-quarter of applicants in each of the study’s participating communities applied for home purchase loans. Lastly, few applicants sought home improvement loans; 9 percent of loan applications in Leavenworth were for home improvement loans, which is the largest percentage in the study area. Figure IV-7 summarizes loan purpose by jurisdiction.

BBC RESEARCH & CONSULTING SECTION IV, PAGE 12
Figure IV-7. Purpose of Loan Applications, Study Area, 2009 Source: Home Mortgage Disclosure Act (HMDA), 2009.
Kansas City MSA 4.4% 24.7% 71.0%
Kansas
Johnson County 3.2% 24.2% 72.6%
Kansas City 5.2% 26.1% 68.7%
Leavenworth 8.8% 24.7% 66.5%
Overland Park 3.3% 23.1% 73.6%
Shawnee 3.6% 23.3% 73.2%
Missouri
Blue Springs 4.3% 23.7% 72.0%
Independence 6.1% 25.4% 68.5%
Kansas City 4.5% 25.3% 70.2%
Lee's Summit 3.3% 21.1% 75.6%
Home
Improvement
Home
Purchase
Home
Refinance
Loan denials. Sixty four percent of loan applications in the Kansas City MSA originated, while 16 percent were denied. Blue Springs’ applicants had the highest loan origination rate at 72 percent; Independence had the lowest at 59 percent. Similarly, Independence’s denial rate of 20 percent was the highest in the study area; Johnson County’s was the lowest at 11 percent.
Figure IV-8. Action Taken on Loan Application, Study Area, 2009
Kansas City MSA 5.0% 16.1% 12.3% 2.4% 64.3%
Kansas
Johnson County 4.6% 11.3% 11.5% 1.9% 70.7% 39,645
Kansas City 4.9% 17.2% 11.5% 2.7% 63.7% 11,867
Leavenworth 4.2% 16.9% 10.6% 2.1% 66.2% 2,210
Overland Park 4.7% 10.9% 11.7% 2.0% 70.8% 17,610
Shawnee 4.6% 13.1% 11.7% 2.1% 68.5% 8,499
Missouri
Blue Springs 6.3% 18.8% 0.5% 2.7% 71.6% 4,240
Independence 5.2% 20.0% 13.6% 2.6% 58.6% 9,129
Kansas City 5.2% 17.4% 12.6% 2.5% 62.3% 50,947
Lee's Summit 5.2% 13.7% 12.8% 2.4% 65.9% 10,826
LoanOriginated
TotalNumber of Loans
ApplicationWithdrawn by Applicant
File closed for
Incompleteness
Application Approved but Not Accepted
ApplicationDenied
Source: Home Mortgage Disclosure Act (HMDA), 2009.
Denial rates by race. This section presents denial rates by race and ethnicity. For each participating jurisdiction, a table is provided that compares the results of mortgage applications by race and ethnicity. Additionally, two maps are presented for each community, which display African American and Hispanic concentrations by Census Tracts overlaid with areas where denial rates exceeded city-wide averages. Kansas City, MO is the only community where the above average denial rates and presence of African Americans appear to be closely related.

BBC RESEARCH & CONSULTING SECTION IV, PAGE 13
Johnson County, Kansas
Figure IV-9. Result of Mortgage Loan Applications by Race/Ethnicity, Johnson County, 2009
Johnson CountyAfrican American 60.2% 4.5% 18.6% 13.0% 3.7%
White 73.7% 4.5% 10.2% 9.9% 1.7%
Hispanic 65.2% 5.4% 15.4% 12.0% 2.0%
Not Hispanic 73.1% 4.6% 10.4% 10.1% 1.8%
Racial/Ethnic ComparisonsAfrican American/White -13.5% -0.1% 8.4% 3.1% 2.0%
Hispanic/Not Hispanic -7.9% 0.8% 5.0% 1.9% 0.1%
LoanOriginated
Application Withdrawn closed forApplication File
Approved but ApplicationNot Accepted Denied by Applicant Incompleteness
Source: FFIEC HMDA Aggregate Reports, 2009, and BBC Research & Consulting.
Figure IV-10. Higher than Community Average Denials by Percent African American, Johnson County, Kansas, 2009 Source: FFIEC HMDA Aggregate Reports 2009 and Claritas, 2009.
Figure IV-11. Higher than Community Average Denials by Percent Hispanic, Johnson County, Kansas, 2009 Source: FFIEC HMDA Aggregate Reports 2009 and Claritas, 2009.

BBC RESEARCH & CONSULTING SECTION IV, PAGE 14
Kansas City, Kansas
Figure IV-12. Result of Mortgage Loan Applications by Race/Ethnicity, Kansas City, KS, 2009
Kansas City, KSAfrican American 47.6% 6.3% 28.6% 11.3% 6.3%
White 68.1% 4.8% 14.5% 10.3% 2.3%
Hispanic 48.7% 5.9% 29.5% 13.0% 2.8%
Not Hispanic 67.1% 4.9% 14.9% 10.4% 2.7%
Racial/Ethnic ComparisonsAfrican American/White -20.5% 1.5% 14.2% 0.9% 3.9%
Hispanic/Not Hispanic -18.4% 1.0% 14.6% 2.6% 0.2%
Application Application
Originated Not Accepted Denied by Applicant Incompleteness
File Loan Approved but Application Withdrawn closed for
Source: FFIEC HMDA Aggregate Reports, 2009, and BBC Research & Consulting.
Figure IV-13. Higher than Community Average Denials by Percent African American, Kansas City, Kansas, 2009 Source: FFIEC HMDA Aggregate Reports 2009 and Claritas, 2009.
Figure IV-14. Higher than Community Average Denials by Percent Hispanic, Kansas City, Kansas, 2009
Source: FFIEC HMDA Aggregate Reports 2009 and Claritas, 2009.

BBC RESEARCH & CONSULTING SECTION IV, PAGE 15
Leavenworth, Kansas
Figure IV-15. Result of Mortgage Loan Applications by Race/Ethnicity, Leavenworth, 2009
LeavenworthAfrican American 57.0% 7.0% 23.7% 10.5% 1.8%
White 68.7% 4.1% 15.8% 9.4% 1.9%
Hispanic 57.4% 6.6% 19.7% 14.8% 1.6%
Not Hispanic 68.3% 4.3% 16.0% 9.3% 2.1%
Racial/Ethnic ComparisonsAfrican American/White -11.7% 2.9% 7.9% 1.1% -0.2%
Hispanic/Not Hispanic -10.9% 2.2% 3.6% 5.4% -0.4%
Loan Approved but Application Withdrawn closed forApplication Application File
Originated Not Accepted Denied by Applicant Incompleteness
Source: FFIEC HMDA Aggregate Reports, 2009, and BBC Research & Consulting.
Figure IV-16. Higher than Community Average Denials by Percent African American, Leavenworth, Kansas, 2009
Source: FFIEC HMDA Aggregate Reports 2009 and Claritas, 2009.
Figure IV-17. Higher than Community Average Denials by Percent Hispanic, Leavenworth, Kansas, 2009
Source: FFIEC HMDA Aggregate Reports 2009 and Claritas, 2009.

BBC RESEARCH & CONSULTING SECTION IV, PAGE 16
Overland Park, Kansas
Figure IV-18. Result of Mortgage Loan Applications by Race/Ethnicity, Overland Park, 2009
Overland ParkAfrican American 58.6% 4.7% 16.9% 16.3% 3.4%
White 73.9% 4.5% 9.9% 10.0% 1.7%
Hispanic 66.8% 4.5% 14.5% 11.9% 2.4%
Not Hispanic 73.1% 4.6% 10.0% 10.4% 1.8%
Racial/Ethnic ComparisonsAfrican American/White -15.3% 0.3% 7.1% 6.3% 1.6%
Hispanic/Not Hispanic -6.3% -0.2% 4.5% 1.5% 0.5%
Application Application File
Originated Not Accepted Denied by Applicant IncompletenessLoan Approved but Application Withdrawn closed for
Source: FFIEC HMDA Aggregate Reports, 2009, and BBC Research & Consulting.
Figure IV-19. Higher than Community Average Denials by Percent African American, Overland Park, Kansas, 2009
Source: FFIEC HMDA Aggregate Reports 2009 and Claritas, 2009.
Figure IV-20. Higher than Community Average Denials by Percent Hispanic, Overland Park, Kansas, 2009
Source: FFIEC HMDA Aggregate Reports 2009 and Claritas, 2009.

BBC RESEARCH & CONSULTING SECTION IV, PAGE 17
Shawnee, Kansas
Figure IV-21. Result of Mortgage Loan Applications by Race/Ethnicity, Shawnee, 2009
ShawneeAfrican American 60.0% 7.1% 17.9% 10.7% 4.3%
White 71.1% 4.7% 12.1% 10.1% 2.0%
Hispanic 59.4% 5.7% 22.8% 10.7% 1.4%
Not Hispanic 70.8% 4.8% 12.0% 10.2% 2.1%
Racial/Ethnic ComparisonsAfrican American/White -11.1% 2.4% 5.8% 0.7% 2.2%
Hispanic/Not Hispanic -11.3% 0.9% 10.7% 0.4% -0.7%
Loan Approved but Application Withdrawn closed forApplication Application File
Originated Not Accepted Denied by Applicant Incompleteness
Source: FFIEC HMDA Aggregate Reports, 2009, and BBC Research & Consulting.
Figure IV-22. Higher than Community Average Denials by Percent African American, Shawnee, Kansas, 2009
Source: FFIEC HMDA Aggregate Reports 2009 and Claritas, 2009.
Figure IV-23. Higher than Community Average Denials by Percent Hispanic, Shawnee, Kansas, 2009 Source: FFIEC HMDA Aggregate Reports 2009 and Claritas, 2009.

BBC RESEARCH & CONSULTING SECTION IV, PAGE 18
Blue Springs, Missouri
Figure IV-24. Result of Mortgage Loan Applications by Race/Ethnicity, Blue Springs, 2009
Blue SpringsAfrican American 62.2% 7.3% 19.5% 8.5% 2.4%
White 65.8% 5.5% 15.3% 11.1% 2.3%
Hispanic 52.2% 7.8% 24.4% 12.2% 3.3%
Not Hispanic 65.4% 5.6% 15.7% 11.0% 2.3%
Racial/Ethnic ComparisonsAfrican American/White -3.6% 1.8% 4.2% -2.6% 0.2%
Hispanic/Not Hispanic -13.2% 2.2% 8.8% 1.2% 1.0%
Application Application File
Originated Not Accepted Denied by Applicant IncompletenessLoan Approved but Application Withdrawn closed for
Source: FFIEC HMDA Aggregate Reports, 2009, and BBC Research & Consulting.
Figure IV-25. Higher than Community Average Denials by Percent African American, Blue Springs, Missouri, 2009
Source: FFIEC HMDA Aggregate Reports 2009 and Claritas, 2009.
Figure IV-26. Higher than Community Average Denials by Percent Hispanic, Blue Springs, Missouri 2009
Source: FFIEC HMDA Aggregate Reports 2009 and Claritas, 2009.

BBC RESEARCH & CONSULTING SECTION IV, PAGE 19
Independence, Missouri
Figure IV-27. Result of Mortgage Loan Applications by Race/Ethnicity, Independence, 2009
IndependenceAfrican American 55.9% 6.2% 25.5% 11.5% 0.9%
White 62.6% 5.3% 17.7% 11.8% 2.7%
Hispanic 56.8% 4.0% 25.2% 13.3% 0.7%
Not Hispanic 61.9% 5.4% 18.2% 11.8% 2.7%
Racial/Ethnic ComparisonsAfrican American/White -6.7% 0.9% 7.8% -0.2% -1.8%
Hispanic/Not Hispanic -5.0% -1.5% 7.0% 1.5% -2.0%
Loan Approved but Application Withdrawn closed forApplication Application File
Originated Not Accepted Denied by Applicant Incompleteness
Source: FFIEC HMDA Aggregate Reports, 2009, and BBC Research & Consulting.
Figure IV-28. Higher than Community Average Denials by Percent African American, Independence, Missouri, 2009
Source: FFIEC HMDA Aggregate Reports 2009 and Claritas, 2009.
Figure IV-29. Higher than Community Average Denials by Percent Hispanic, Independence, Missouri, 2009
Source: FFIEC HMDA Aggregate Reports 2009 and Claritas, 2009.

BBC RESEARCH & CONSULTING SECTION IV, PAGE 20
Kansas City, Missouri
Figure IV-30. Result of Mortgage Loan Applications by Race/Ethnicity, Kansas City, MO, 2009
Kansas City, MOAfrican American 49.6% 6.8% 33.5% 5.9% 4.2%
White 67.4% 5.1% 14.4% 10.8% 2.4%
Hispanic 52.5% 6.0% 25.8% 12.8% 2.9%
Not Hispanic 65.4% 5.2% 15.7% 11.2% 2.5%
Racial/Ethnic ComparisonsAfrican American/White -17.8% 1.7% 19.2% -4.9% 1.8%
Hispanic/Not Hispanic -12.8% 0.8% 10.1% 1.6% 0.3%
Application Application File
Originated Not Accepted Denied by Applicant IncompletenessLoan Approved but Application Withdrawn closed for
Source: FFIEC HMDA Aggregate Reports, 2009, and BBC Research & Consulting.
Figure IV-31. Higher than Community Average Denials by Percent African American, Kansas City, Missouri, 2009
Source: FFIEC HMDA Aggregate Reports 2009 and Claritas, 2009.
Figure IV-32. Higher than Community Average Denials by Percent Hispanic, Kansas City, Missouri, 2009
Source: FFIEC HMDA Aggregate Reports 2009 and Claritas, 2009.

BBC RESEARCH & CONSULTING SECTION IV, PAGE 21
Lee’s Summit, Missouri
Figure IV-33. Result of Mortgage Loan Applications by Race/Ethnicity, Lee’s Summit, 2009
Lee's SummitAfrican American 57.6% 6.8% 21.2% 11.7% 2.7%
White 69.2% 5.2% 12.1% 11.2% 2.3%
Hispanic 59.6% 2.5% 23.6% 10.6% 3.7%
Not Hispanic 68.4% 5.3% 12.6% 11.3% 2.3%
Racial/Ethnic ComparisonsAfrican American/White -11.6% 1.6% 9.1% 0.5% 0.4%
Hispanic/Not Hispanic -8.8% -2.8% 11.0% -0.8% 1.4%
Loan Approved but Application Withdrawn closed forOriginated Not Accepted Denied by Applicant Incompleteness
Application Application File
Source: FFIEC HMDA Aggregate Reports, 2009, and BBC Research & Consulting.
Figure IV-34. Higher than Community Average Denials by Percent African American, Lee’s Summit, Missouri, 2009
Source: FFIEC HMDA Aggregate Reports 2009 and Claritas, 2009.
Figure IV-35. Higher than Community Average Denials by Percent Hispanic, Lee’s Summit, Missouri, 2009
Source: FFIEC HMDA Aggregate Reports 2009 and Claritas, 2009.

BBC RESEARCH & CONSULTING SECTION IV, PAGE 22
Subprime analysis. This section examines the prevalence of subprime loans in the study area. For the purposes of this section, we define “subprime” as a loan with an APR higher than comparable Treasuries.
Overall, 5 percent of originated loans in the MSA received subprime rates. Eight percent of originated loans in Leavenworth were considered subprime, compared with only 2 percent in Overland Park.
Figure IV-36. Subprime Loans by Municipality, Study Area, 2009 Source: FFIEC HMDA Aggregate Reports 2009.
Kansas City MSA 75,712 3,815 5.0%
Kansas
Johnson County 28,029 739 2.6%
Kansas City 7,560 403 5.3%
Leavenworth 1,463 117 8.0%
Overland Park 12,473 239 1.9%
Shawnee 5,818 173 3.0%
Missouri
Blue Springs 3,034 136 4.5%
Indpendence 5,351 369 6.9%
Kansas City 31,749 1,496 4.7%
Lee's Summit 7,137 280 3.9%
Originated
Loans
Subprime
Loans
Percent
Subprime
Of the subprime loans that were originated to borrowers in the Kansas City MSA, 85 percent were made to borrowers who are racially white; 6 percent to African American borrowers; and 6 percent to borrowers where racial information was not available. Ethnically, 89 percent of subprime loans were made to non-Hispanic applicants, 6 percent were made to borrowers where ethnic information was not available and 4 percent were made to Hispanic residents.
The following series of maps highlight Census Tracts with a higher percentage of subprime loan originations than their respective communities overall.
Johnson County, Kansas
Figure IV-37. Subprime Loans Compared to Community Average, Johnson County, 2009
Source:
FFIEC HMDA Aggregate Reports, 2009, and BBC Research & Consulting.

BBC RESEARCH & CONSULTING SECTION IV, PAGE 23
Kansas City, Kansas
Figure IV-38. Subprime Loans Compared to Community Average, Kansas City, KS, 2009
Source:
FFIEC HMDA Aggregate Reports, 2009, and BBC Research & Consulting.
Leavenworth, Kansas
Figure IV-39. Subprime Loans Compared to Community Average, Leavenworth, 2009
Source:
FFIEC HMDA Aggregate Reports, 2009, and BBC Research & Consulting.
Overland Park, Kansas
Figure IV-40. Subprime Loans Compared to Community Average, Overland Park, 2009
Source:
FFIEC HMDA Aggregate Reports, 2009, and BBC Research & Consulting.

BBC RESEARCH & CONSULTING SECTION IV, PAGE 24
Shawnee, Kansas
Figure IV-41. Subprime Loans Compared to Community Average, Shawnee, 2009
Source:
FFIEC HMDA Aggregate Reports, 2009, and BBC Research & Consulting.
Blue Springs, Missouri
Figure IV-42. Subprime Loans Compared to Community Average, Blue Springs, 2009
Source:
FFIEC HMDA Aggregate Reports, 2009, and BBC Research & Consulting.
Independence, Missouri
Figure IV-43. Subprime Loans Compared to Community Average, Independence, 2009
Source:
FFIEC HMDA Aggregate Reports, 2009, and BBC Research & Consulting.

BBC RESEARCH & CONSULTING SECTION IV, PAGE 25
Kansas City, Missouri
Figure IV-44 Subprime Loans Compared to Community Average, Kansas City, MO, 2009
Source:
FFIEC HMDA Aggregate Reports, 2009, and BBC Research & Consulting.
Lee’s Summit, Missouri
Figure IV-45. Subprime Loans Compared to Community Average, Lee’s Summit, 2009
Source:
FFIEC HMDA Aggregate Reports, 2009, and BBC Research & Consulting.

SECTION V. Public Policies and Practices

BBC RESEARCH & CONSULTING SECTION V, PAGE 1
SECTION V. Public Policies and Practices
This section contains an analysis of public sector barriers to fair housing choice in the context of housing policies and procedures and land use policies. This section addresses the following topics:
Policies of public housing authorities;
Concentrations of public housing and HUD subsidized rental units;
Placement of and zoning for group homes;
General zoning and land use laws that may restrict the placement of affordable housing or encourage areas of minority concentration;
Planning, development and building fees;
Building, occupancy, health and safety codes;
Affordable housing programs and incentives.
Subsidized Rental Units
The following provides a brief history of government subsidized housing rental units in the Kansas City Metropolitan Area. It discusses the policies of the region’s public housing authorities (PHA or HA) and concludes with a discussion of the concentrations of subsidized units in the area.
Public Housing Authorities. As part of the AI, the policies and procedures of the following eight public housing authorities serving the Kansas City region were reviewed:1
Johnson County Housing Authority. Administers Section 8 Housing Choice Vouchers (HCV) for the Kansas cities of De Soto, Edgerton, Gardner, Lenexa, Merriam, Mission, Overland Park, Prairie Village, Roeland Park, Shawnee, Springhill and Westwood areas, Leawood, Fairway, and Stillwell.
Kansas City, KS Housing Authority. The largest public housing authority in the State of Kansas; owns and manages 2,170 public housing units, and administers approximately 1,500 HCVs. The jurisdictions covered by the housing authority are the cities of Kansas City, Bonner Springs and Edwardsville, Kansas and the county of Wyandotte.
Leavenworth Housing Authority. The Community Development Department of the City of Leavenworth includes the Public Housing Division and operates a 105 unit elderly Public Housing apartment building and administers approximately 200 HCVs.
Olathe Housing Authority. Owns and manages 130 conventional public housing units and administers 509 HCVs.
1 The cities of Shawnee, Overland Park and Blue Springs do not have their own public housing authorities. The cities of
Shawnee and Overland Park work through the Johnson County Housing Authority. The City of Blue Springs is served by the Independence Housing Authority, which serves all of Jackson County.

PAGE 2, SECTION V BBC RESEARCH & CONSULTING
Bonner Springs Housing Authority. Manages 50 public housing units for the elderly and families.
Housing Authority of Kansas City, MO. Operates and maintains over 1,900 Public Housing units, administers 1,469 HCVs throughout the Kansas City Metropolitan area.
Independence Housing Authority. Owns and manages three public housing developments consisting of 525 units and administers 1,647 HCVs.
Lee's Summit Housing Authority. Has two public housing developments that include 116 units of public housing and administers 649 HCVs. The HCVs are operated in Greater Jackson County and includes the cities of Lee’s Summit, Greenwood, Oak Grove, Lone Jack, Buckner, Blue Springs, Independence, Grain Valley, Kansas City, Grandview and Raytown.
Each of the previous listed PHA’s approved Five-year Plan and current Annual Plan were reviewed and staff from all of the PHAs were contacted and interviewed for additional input into this AI.
The Kansas City Region’s lowest income renters are primarily served through public housing units and the Section 8 Housing Choice Voucher (HCV) program. The following figure shows the number of HCVs and public housing units each of the housing authorities provide, as well as the number of public housing units that are accessible to persons with disabilities.
As the exhibit shows, the Olathe, Bonner Springs and Kansas City, KS PHAs had the smallest proportions of accessible housing units, all at less than 5 percent, which is the accepted standard for accessible units in federally assisted developments.
The majority (73 percent) of the housing is subsidized through the HCV program and over half (51 percent) of all of the public housing units and vouchers are provided by the Housing Authority of Kansas City, MO.
Figure V-1. Number of Housing Choice Vouchers and Public Housing Units, Kansas City Region, 2010
Note:
Accessible public housing units are units accessible to persons with disabilities.
Source:
U.S. Department of Housing & Urban Development Approved PHA Plans; Bonner Springs Housing Authority; Johnson County Housing Authority; Kansas City, KS Housing Authority; Leavenworth Housing Authority; Olathe Housing Authority; Housing Authority of Kansas City, MO; Independence Housing Authority; and Lee's Summit Housing Authority.
Housing Authority (HA)
Kansas
Bonner Springs HA 0 50 2 4.0%
Johnson County HA 1,447 0 NA
Kansas City, KS HA 1,469 2,170 90 4.1%
Leavenworth HA 199 105 8 7.6%
Olathe HA 509 130 3 2.3%
Missouri
HA of Kansas City, MO 7,610 1,920 133 6.9%
Independence HA 1,647 525 48 9.1%
Lee's Summit HA 649 116 9 7.8%
Total 13,530 5,016 293 5.8%
Housing Choice
Vouchers
Public Housing
Units
Accessible Public Housing
Units

BBC RESEARCH & CONSULTING SECTION V, PAGE 3
Policies and procedures. The following section discusses the policies and procedures of the eight public housing authorities in the Kansas City region. As part of this study, we interviewed PHA staff, using the questions suggested by HUD in its fair housing planning guide. The interviews discussed policies and procedures of placing residents in PHA developments and in distributing HCVs, procedures to mitigate racial and ethnic segregation, and efforts to provide housing to persons who require accessibility accommodations. In addition, the PHA’s approved Five-year Plans and current Annual Plans were consulted. Significant findings are included below.
The following figure includes summary information on each of the public housing authorities, including the HUD performance designation and information on the waiting lists for both public housing and the HCV program.

PAG
E 4
, SE
CTI
ON
V
BB
C R
ESEA
RCH
& C
ON
SULT
ING
Fig
ure
V-2
. P
ub
lic
Ho
usi
ng
Au
tho
riti
es, K
ansa
s C
ity
Reg
ion
Hou
sin
g
Au
thor
ity
(HA
)Pr
efer
ence
sPr
efer
ence
s*
Kan
sas
Bonn
er S
prin
gs
HA
Smal
lN
AN
AN
AO
pen
abou
t 12
mon
ths
Dat
e an
d tim
e
John
son
Cou
nty
HA
Hig
h Pe
rfor
min
gC
lose
d34
5 fa
mili
es-
Resi
den
cy (
live
and/
or w
ork)
- El
derl
y/D
isab
led
- Vi
ctim
s of
Dom
estic
Vio
lenc
e
NA
NA
NA
Kans
as C
ity, K
S H
ASt
and
ard
Op
en2,
600
fam
ilies
- Re
side
nt o
f Kan
sas
City
, Kan
sas
- Su
bsta
ndar
d ho
usin
g-
Invo
lun
tary
dis
pla
cem
ent
- Re
nt b
urde
n gr
eate
r th
an 5
0%-
Hom
eles
s-
Thre
at o
f bod
ily h
arm
- G
EAR
UP
pro
gra
m c
omp
letio
n-
Col
lege
bou
nd-
Frai
l/el
derl
y
Op
en41
0 fa
mili
es-
Invo
lunt
ary
disp
lace
men
t-
Resi
dent
of W
yand
otte
Cou
nty
- Su
bst
anda
rd h
ousi
ng-
Rent
bur
den
grea
ter
than
50%
- H
omel
ess
- Ea
rned
inco
me
- Th
reat
of b
odily
har
m
Leav
enw
orth
HA
Smal
lO
pen
abou
t 2
year
s-
Elde
rly
- D
isab
led
- Em
plo
yed
full
time
(25
hour
s)
- Fu
ll tim
e st
ude
nts
(hea
d of
hou
seho
ld/c
o-he
ad o
f hou
seho
ld)
Op
enun
know
nD
esig
nat
ed H
ousi
ng fo
r El
derl
y an
d D
isab
led
Fam
ilies
Ola
the
HA
Hig
h Pe
rfor
min
g**
Clo
sed
(com
bine
d lis
ts)
714
fam
ilies
ab
out
2-3
year
s-
Loca
l wor
king
pre
fere
nce
(25
hour
s)
- Li
ve a
nd/o
r w
ork
in O
lath
e -
Elde
rly
(62
year
s) a
nd d
isab
led
Op
en, h
igh-
rise
Clo
sed
, sc
atte
red
site
124
fam
ilies
1 ye
ar o
r lo
nger
- Loc
al w
orki
ng
pre
fere
nce
(25
hour
s)
- Liv
e an
d/or
wor
k in
Ola
the
- Eld
erly
(62
yea
rs)
and
disa
bled
Mis
sou
ri
HA
of K
ansa
s C
ity, M
OSt
and
ard
Op
en15
,177
fam
ilies
abou
t 2 y
ears
(1)
Wor
king
, Wor
k Tr
aini
ng P
rog
ram
,
E
lder
ly, a
nd D
isab
led;
(2)
Hom
eles
s, Jo
b Tr
ain
ing
Prog
ram
,
H
ousi
ng F
acto
r an
d Re
nt B
urde
n;(3
) N
on-p
refe
ren
ce.
Op
en6,
675
fam
ilies
ab
out 2
yea
rs(1
) W
orki
ng, W
ork
Trai
ning
Pro
gram
,
E
lder
ly, a
nd D
isab
led;
(2)
Hom
eles
s, Jo
b Tr
aini
ng
Prog
ram
,
H
ousi
ng
Fact
or a
nd R
ent B
urd
en;
(3)
Non
-pre
fere
nce.
Inde
pen
denc
e H
ASt
and
ard
Clo
sed
4,42
8 fa
mili
esD
isp
lace
d by
nat
ural
dis
aste
rO
pen
271
fam
ilies
Dis
pla
ced
by
natu
ral d
isas
ter
Lee'
s Su
mm
it H
AH
igh
Perf
orm
ing
Clo
sed
100
fam
ilies
Non
eO
pen
325
fam
ilies
- Se
nior
s (6
2 ye
ars
of a
ge a
nd o
lder
) -
Han
dica
pp
ed/d
isab
led
Ho
usi
ng
Ch
oic
e V
ou
cher
s
Wai
t Li
st S
tatu
sW
ait
List
leng
th
Pu
bli
c H
ou
sin
gH
UD
Pe
rfor
man
ce
Des
ign
atio
nW
ait
List
Sta
tus
Wai
t Li
st le
ngth
Not
e:
*All
pre
fere
nces
for
pu
blic
hou
sing
uni
ts in
clud
e da
te a
nd ti
me
of a
pp
licat
ion
and
also
siz
e an
d ty
pe
of u
nit t
hey
req
uire
.
**
The
Ola
the
Hou
sing
Aut
horit
y co
mbi
nes
thei
r w
ait l
ists
for
HC
V an
d th
eir
fam
ily s
catt
ered
site
uni
ts.
Sour
ce:
U.S
. Dep
artm
ent o
f Hou
sing
& U
rban
Dev
elop
men
t Ap
pro
ved
PHA
Pla
ns: B
onne
r Sp
rings
Hou
sing
Aut
horit
y; Jo
hnso
n C
ount
y H
ousi
ng A
utho
rity;
Kan
sas
City
, KS
Hou
sing
Au
thor
ity; L
eave
nwor
th H
ousi
ng A
utho
rity;
O
lath
e H
ousi
ng A
utho
rity;
Hou
sing
Aut
horit
y of
Kan
sas
City
, MO
; Ind
epen
denc
e H
ousi
ng A
utho
rity;
and
Lee
's S
umm
it H
ousi
ng A
utho
rity.

BBC RESEARCH & CONSULTING SECTION V, PAGE 5
HUD performance designation. According to HUD, none of the nine public housing authorities are designated as being “troubled.” Three of the nine housing authorities, including the Johnson County Housing Authority, the Olathe Housing Authority and the Lee’s Summit Housing Authority, received the HUD designation of “high performing.”
The Housing Authority of Kansas City, MO (HAKC) was placed in Court Receivership in July 1993 and the judge appointed Jeffrey K. Lines, president of TAG Associates of Kansas City, Inc., as Receiver for the HAKC. According to HAKC, prior to the housing authority being placed under Receivership, “…the agency`s housing stock was largely distressed and obsolete as evidenced by a 43 percent vacancy rate, enormous backlogs of uncompleted maintenance work, rampant criminal activity and hundreds of families living in dangerous, substandard conditions.”2
Since HAKC was placed under Receivership, the housing authority has improved vacancy rates, redeveloped three public housing developments3 into new mixed-income communities, developed new mixed-income rental and homeownership units, and built or acquired over 400 single family or small multifamily homes “scattered” across Kansas City, MO.
In September 2002 the HAKC transitioned to a local Board of Commissioner governance structure, and the role of the Receiver changed to that of Special Master, with oversight responsibilities of the Board and the housing authority.4 Presently, HAKC is nearing the end of their process to appoint a new seven member Board. The Board’s first meeting is scheduled for March 9, 2011. In the near future, the goal of HAKC is to return back to Court in approximately 12 to 18 months with the objective of being removed from the court appointed status of receivership.
Intake and wait lists. The procedures and policies to handle requests for housing assistance for all of the housing authorities were standard and did not signal any fair housing concerns.
Johnson County HA — The wait list is currently closed. In March of 2009, the wait list was opened approximately two weeks. During this short period of time, the PHA received over 860 applications for HCV rental assistance. Current wait list is approximately 345. Potential residents have 60-days to find unit with an additional 60 days possible (120 max).
Independence HA — HCV is currently closed. Last opened September 2010 (before that was April 2007) and received approximately 5,000 applications. Applications (when open) can be downloaded from Web (this feature was not working when we tested it) and had 4 locations to pick-up applications. All applications must be mailed to the PHA. The public housing list is currently open and is 271 households long.
2 http://www.hakc.org/about.php?AId=5
3 Guinotte Manor, Riverview Gardens and Theron B. Watkins.
4 http://www.hakc.org/about.php?AId=4

PAGE 6, SECTION V BBC RESEARCH & CONSULTING
Housing Authority of Kansas City, MO — Both lists are always open. The PHA holds weekly briefings where potential tenants come to a designated located to sign-up. Interested parties are able to sign up at each particular public housing development as well. About 100 people come each week. Most (85 percent) sign-up for both wait lists. The public housing list is 6,675 residents long, or approximately a 2 year wait on average. The HCV list is 15,177 long and about a 2 year wait. This PHA has a notable website (www.hakc.org/voucher_program5) for both PH and HCV, and offers reasonable accommodations for those in need when applying.
Kansas City, KS HA — Both waiting lists are open. Applications are accepted at their location.
The wait list for public housing units includes 410 families and is a 6 months to 1 year wait. The HCV wait list is about 2,600 long and up to a 4 year wait.
The Waiting List is routinely purged by a mailing to all applicants to ensure that the waiting list is current and accurate. The mailing asks for confirmation of continued interest. Any mailings to the applicant which require a response will state that failure to respond within 30 days will result in the applicant’s name being dropped from the waiting list. An extension of 30 days to respond will be granted, if requested and needed as a reasonable accommodation for a person with a disability. If the applicant does not respond to the PHA request for information or updates because of a family member’s disability, the PHA will reinstate the applicant in the family’s former position on the waiting list. If a letter is returned with a forwarding address, it is re-mailed to the address indicated.
The PHA has units designed for persons with mobility, sight and hearing impairments (referred to as accessibility units). These units were designed and constructed specifically to meet the needs of persons requiring the use of wheelchairs and persons requiring other modifications. (Chap 4. PH Plan, page 7, under I).
Leavenworth HA — The LHA opened the Section 8 waiting list the past fiscal year (2009) with preferences being given to elderly, disabled, employed (25 hours) and full time student head of household or co-head of household families. PH for elderly/disabled list is open.
Lee’s Summit HA —The waiting list for public housing is open and has 328 families. HCV waiting list has been closed since April 2007 (36 months). The LSHA expects to reopen the list in the LSHA plan year. The LSHA does not permit specific categories of families onto the waiting list, even if generally closed. The HCV waiting list has approx 100 families.
All applicants must come into the office for an application. The office can provide Spanish translation if needed to people with limited English proficiency. Offices are fully accessible.
Bonner Springs HA — Public housing only. List is open. Must go into office to apply.
5 http://www.hakc.org/voucher_program.php?SId=11

BBC RESEARCH & CONSULTING SECTION V, PAGE 7
Olathe HA —The PHA has a combined wait list (currently closed) for the HCVs and the scattered site public housing units of 714 families (as included in the PHA Plan). The four story high-rise public housing complex has a waiting list of 124 families (PHA Plan) and this waiting list is currently open. The wait is about 2 years. The PHA recently established a local working preference, which includes those who work at least 25 hours/week that live and/or work in Olathe; the elderly (62 years); and persons who are disabled.
Preferences.
JCHA — HCV only = Residency (an applicant who lives in Johnson County. Additionally, applicants who work or have been hired to work in Johnson County.). Preferences also given to victims of domestic violence, and elderly/disabled. All preferences are weighted equally.
Independence HA — HCV = Displaced by natural disaster. Public housing = 1. Displaced and 2. Working (employed). However, because a policy for employment has yet to be written it is therefore not being used.
HAKC — All admissions to Public Housing and Section 8 are based upon the following local preferences, in order of priority:
(1) Working, Work Training Program, Elderly, and Disabled;
(2) Homeless, Job Training Program, Housing Factor and Rent Burden; and
(3) Non-preference.
Within each local preference category, applicants are ranked by the date and time of their application for either Public Housing and/or Section 8.
KCKHA — HCV: Each preference will receive an allocation of points. The more preference points an applicant has, the higher the applicant’s place on the waiting list. Among applicants with equal preference status, the waiting list is organized by date and time.
Involuntary Displacement: 400 points
Substandard Housing: 400 points
Rent Burdened: 400 points
Homeless: 400 points
Local Residency: 600 points
Threat of Bodily Harm: 400 points
GEAR UP: 400 points
Frail/Elderly: 400 points
College Bound: 400 points

PAGE 8, SECTION V BBC RESEARCH & CONSULTING
KCKHA — The PHA has established the following local admissions preferences for general occupancy (family) public housing developments:
Date and time of receipt of a completed application, and list other local preferences.
Each preference is assigned points as listed below. The more preference points an applicant has, the higher the applicant's place on the waiting list.
Involuntary Displacement: 400 Points
Substandard Housing: 400 Points
Rent Burdened: 400 Points
Homeless: 400 Points
Earned Income:6 1,100 Points
Local Residency: 600 Points
Threat of Bodily Harm: 400 Points
LHA —The Section 8 waiting list policy was revised in 2009 to establish a preference to those families that are elderly, disabled, full time employed (25 hours) and full time students applicable to the head of household and/or the co-head of household. PH is designated housing for Elderly and Disabled Families.
LSHA — HCV has no preferences. Public housing preference is for seniors (62 years of age and older or handicapped/disabled).
Olathe HA — Local working preference, 25 hours/week and live and/or work in Olathe; elderly (62 years) and disabled.
Landlord participation and outreach. In order to increase the number of units available to their HCV holders, with the hope of increasing voucher mobility and to decrease areas of poverty concentration, housing authorities provide information and outreach to landlords in their communities. In addition, several of the housing authorities include a strategy or goal to increase the participation of landlords in their HCV programs. The following includes summary information of what the housing authorities are doing to increase landlord participation:
Johnson County HA— Hold workshops once a year and provide detailed information for landlords about the HCV program on their website.
Kansas City, KS HA — Provide information regarding the HCV program, as well as sample copies of forms that will be used during the landlord's participation in the HCV program on their Web site. KCKHA also includes the following goal in their Five-year PHA Plan: Education of housing choices is provided by voucher mobility counseling, outreach efforts to potential voucher landlords, and the implementation of the voucher homeownership program.
6 Earned Income/A household whose head or spouse is working or is receiving social security, supplemental security
disability income, or any other payments based on this individual’s inability to work. (i.e. workman’s compensation)

BBC RESEARCH & CONSULTING SECTION V, PAGE 9
Leavenworth HA — Recruit landlords by contacting rental agencies; informational packets about the HCV program are passed out to landlords.
Olathe HA — Conducted workshops for landlords and provide information packets about the program. The housing authority includes the Goal/Objective in their Fiver Year PHA Plan: Conduct outreach with landlords by conducting annual meeting.
HA of Kansas City, MO — Include a “landlord” link on webpage, which provides information on their HCV program. HAKC’s Five-year PHA Plan includes the following strategy to address housing needs: HAKC will work with the landlords to facilitate deconcentration opportunities for the clients of the HCV program.
Independence HA — Ask that their landlords participate in the website, socialserve.com, an affordable housing database.
Lee’s Summit HA — Provide a landlord/owner packet of information on the HCV program. Their Five-year PHA Plan includes the following goal/objective: “to facilitate partnerships between landlords and families for affordable rental housing opportunities.” Additionally, Lee’s Summit 2010-2014 Consolidated Plan included: “LSHA will work to market our Section 8 program to new Landlords to increase the number of units available and expand opportunities for program participants; and decrease areas of poverty.”
Discrimination complaints. All housing authorities are required to submit Form HUD-50077 (PHA Certifications of Compliance with the PHA Plans and Related Regulations), which includes all certifications relating to Civil Rights. In regards to fair housing, all nine of the housing authorities provide their tenants and HCV holders information regarding fair housing and how to file a complaint. The following includes additional detail regarding fair housing for the housing authorities:
Johnson County HA — They inform the HCV holders at the briefing of fair housing law and provide them with a HUD fair housing complaint form. HCV holders are told they can come to JCHA for help to complete the fair housing form or go directly to HUD.
Kansas City, KS HA — KCKHA has an attorney on-staff who deals with tenant issues involving evictions, lease violations, etc. KCKHA provides their Admissions and Continued Occupancy Policy for public housing and their Section 8 Administrative Plan on their Web site, which includes their Fair Housing Policy and how they handle complaints. All applicable Fair Housing Information and Discrimination Complaint Forms are included in the Voucher holder's briefing packet and available upon request at the front desk of KCKHA. Both the public housing and HCV programs do not discriminate on the basis of race, color, sex, religion, national origin, familial or marital status, handicap or disability or sexual orientation.
LHA — Have Civil Rights Certification. No mention of fair housing in PHA Plan.
Olathe HA — Include Goal and Objectives in PHA Plan: “Ensure equal opportunity and affirmatively further fair housing.”

PAGE 10, SECTION V BBC RESEARCH & CONSULTING
HAKC — All complaints go directly to the Executive Director, who then consults with HAKC’s attorney. HAKC’s PHA Five-Year and Annual Plan for 2010 to 2014 included the following in their progress report:
“HAKC continued to support Legal Aid of Western Missouri in their applications for funds to assist low and very low income families that faced possible fair housing issues.”
“HAKC continued to work with the Public Housing Resident Council to establish means of strengthening the resident council and HAKC provided technical assistance to the resident leaders and groups to help improve the lives of the residents of public housing.”
Independence HA — Goal 8. To ensure compliance with Title VI of the Civil Rights Act of 1964 and all applicable Federal laws and regulations. In our communication, the PHA noted that there were 19 fair housing complaints filed against the PHA in the past five years. Of these, 11 were dismissed with no cause, 4 were settled, one was withdrawn and the rest are pending.
LSHA — Have Civil Rights Certification. In the PHA plan, it is noted that: “The Lee’s Summit Housing Authority has worked to promote adequate and affordable housing and a suitable living environment free from discrimination.”
Bonner Springs HA — Included in PHA Plan goals and Objectives: “ensure equal opportunity and further fair housing objectives.”
Location of public housing units and HUD subsidized rental units. Figure V-3 shows the location of the public housing units, HUD Low Income Housing Tax Credits and HUD multifamily and Section 8 units. The map shows 1,356 developments, which includes 34,850 units of subsidized housing.
As demonstrated by the map, the vast majority of subsidized rental units are located in Kansas City, MO.

BB
C R
ESEA
RCH
& C
ON
SULT
ING
SE
CTI
ON
V, P
AG
E 1
1
Fig
ure
V-3
. P
ub
lic
Ho
usi
ng
Un
its
an
d H
UD
Su
bsi
diz
ed
Un
its,
Kan
sas
Cit
y R
egio
n
Sour
ce:
U.S
. Dep
artm
ent o
f Hou
sing
& U
rban
Dev
elop
men
t’s
Mul
tifam
ily A
ssis
tanc
e an
d Se
ctio
n 8
Con
trac
ts
data
base
, up
date
d D
ecem
ber
17, 2
009;
HU
D N
atio
nal
Low
Inco
me
Hou
sing
Tax
Cre
dit (
LIH
TC)
Dat
abas
e,
1987
-200
7; K
ansa
s C
ity, K
S H
ousi
ng A
utho
rity;
Le
aven
wor
th H
ousi
ng A
utho
rity;
Hou
sing
Au
thor
ity o
f Ka
nsas
City
, MO
; Ind
epen
denc
e H
ousi
ng A
uth
ority
; an
d Le
e's
Sum
mit
Hou
sing
Aut
horit
y.

PAGE 12, SECTION V BBC RESEARCH & CONSULTING
Subsidized rental units nearing expiration. According to the Multifamily Assistance and Section 8 Contract database provided by HUD, over the next five years (2011 to 2015) just over half (51 percent) of these government-assisted rental units in the Kansas City Metro Region are scheduled to expire. This means there is a chance the region could lose approximately 5,440 units of the government-assisted rental housing stock in the next five years.
Just under half of these expiring units (47 percent or 5,058 units) are located in Kansas City, MO as shown in the following figure.
Figure V-5. HUD Multifamily Assistance and Section 8 Contract Subsidized Units by Year to Expire and Place, Kansas City Metro Area
Kansas
Bonner Springs 0 0 0 0 75 0 75 1%
Edwardsville 0 0 0 55 0 0 55 1%
Gardner 45 0 20 0 0 0 65 1%
Kansas City 98 161 136 64 159 642 1,260 12%
Leavenworth 0 0 8 0 0 340 348 3%
Lenexa 0 0 0 0 0 20 20 0%
Merriam 0 0 0 0 0 177 177 2%
Olathe 353 0 0 0 65 63 481 4%
Osawatomie 0 0 54 0 0 64 118 1%
Overland Park 0 0 16 12 374 60 462 4%
Paola 15 0 16 0 0 43 74 1%
Shawnee 0 0 8 0 53 0 61 1%
Missouri
Belton 0 0 0 0 0 83 83 1%
Blue Springs 114 0 0 0 0 66 180 2%
Buckner 42 0 0 0 0 0 42 0%
Excelsior Springs 65 0 0 0 110 0 175 2%
Grandview 13 80 0 0 0 48 141 1%
Harrisonville 0 0 0 0 0 86 86 1%
Independence 229 29 0 0 33 809 1,100 10%
Kansas City 1,066 393 149 796 145 2,509 5,058 47%
Lee's Summit 152 0 0 84 0 74 310 3%
Liberty 18 62 0 0 0 112 192 2%
Oak Grove 0 0 0 0 0 40 40 0%
Pleasant Hill 0 0 0 0 0 24 24 0%
Raymore 0 0 0 0 0 34 34 0%
Raytown 75 0 0 0 0 0 75 1%
Riverside 0 0 0 0 0 13 13 0%
Total 2,285 725 407 1,011 1,014 5,307 10,749 100%
TotalPercent of Total
2016 and after201420122011 2013 2015
Source: U.S. Department of Housing & Urban Development’s Multifamily Assistance and Section 8 Contracts database, updated December 17, 2009.
Figure V-4.Expiration Date of HUD Multifamily Assistance and Section 8 Contracts, Kansas City Metro Area
Year to Expire
2011 2,285 21%
2012 725 7%
2013 407 4%
2014 1,011 9%
2015 1,014 9%
2016 and after 5,307 49%
Total 10,749 100%
Number of Assisted Units
Source: U.S. Department of Housing & Urban Development’s Multifamily Assistance and Section 8 Contracts database, updated December 17, 2009.

BBC RESEARCH & CONSULTING SECTION V, PAGE 13
Land Use Policy Review
BBC reviewed the nine jurisdictions’ codes, Comprehensive Plans, planning fees and other city/county programs and policies to assess potential fair housing concerns, as well as policies that encourage or discourage the development of affordable housing. This section summarizes the findings from this review.
Comprehensive Plans. Each of the nine jurisdictions have completed and adopted a Comprehensive Plan (also known as a Master Plan). These are important policy documents that serve as general guides that provide direction to the jurisdictions on a variety of growth, development and land use issues. The Plans have a number of components that encourage fair housing development by offering a variety of housing types, promoting a mix of uses in certain areas and other planning policies.
The following figure shows the year the most recent Comprehensive Plan was adopted by the jurisdictions, along with whether the Plans address diverse housing types, mixed-uses and include a plan to implement the goals and objectives.
Figure V-6. Comprehensive Plans, Kansas City Metro Consortium Note: * The City of Independence is currently in the process of developing a new Comprehensive Plan, Independence 2030: A Comprehensive Plan. Source: The Kansas jurisdictions of Johnson County and the cities of Kansas City, Leavenworth, Overland Park and Shawnee, and the Missouri jurisdictions of Blue Springs, Independence, Kansas City and Lee’s Summit.
Kansas
Johnson County (unincorporated)
2004 NA NA Yes
Kansas City 2008 Yes Yes Yes
Leavenworth 2010 (draft) Yes Yes Yes
Overland Park 2010 update Yes Yes Yes
Shawnee 2006 Yes Yes Yes
Missouri
Blue Springs 2003 Yes Yes Yes
Independence 1993* Yes Yes Yes
Kansas City 1997 Yes Yes Yes
Lee's Summit 2005 Yes Yes Yes
Year Adopted
Supports Mixed-Use?
Includes Action Plan/Plan Implementation?
Promotes diverse types of housing?
Diverse housing types:
Johnson County — The Rural Comprehensive Plan: A Plan for the Unincorporated Area of Johnson County, adopted in 2004, provides guidance for the rural (unincorporated) area of the county, as well the county as a whole, “because the future of the unincorporated area and the cities are so closely tied together.” The Plan includes the following Statement of Purpose concerning housing, “To encourage development within existing residential areas so that public services may be most efficiently provided.”

PAGE 14, SECTION V BBC RESEARCH & CONSULTING
Kansas City, KS — The 2008 Unified Government of Wyandotte County / Kansas City, KS City-Wide Master Plan includes the following policies that address diverse housing types:
Neighborhood Conservation: Reward housing projects that foster mixed income neighborhoods and discourage the concentration of low-income households.
Community Development: New development should support a full range of housing choices for multiple demographic groups.
Leavenworth — The 2010 Comprehensive Land Use Plan is currently in draft form (December 16, 2010) and includes relevant housing goals and action steps in regards to diverse housing:
Goal #1: Create more choices for all types of housing stock – single family, multifamily, apartments, new construction and rehabilitation – to better serve the increasingly diverse residents of Leavenworth.
Goal #2: Promote and encourage private investment in older housing stock, elderly living facilities, urban style living, and mixed use housing developments.
Housing Action Steps – Objective #2: Encourage mixed-use development and redevelopment in residential zoning districts as a means to promoting a variety of housing types, styles, and price-points.
Overland Park — The Master Plan includes five goals concerning medium- and higher-density residential land use, “allow for the provision of medium- and higher-density residential development that is safe, attractive, and accessible to necessary facilities and services.” The Plan also includes the following Planned Residential Neighborhoods Land Use goal and policy:
Goal 1: Create a Unique Living Environment Planned Residential Neighborhoods should offer a creative, well-developed concept that allows residents an opportunity to experience a unique living environment, not currently offered in other residential developments.
Policy 1.1: Provide for a Mix of Different Housing Types -Allow developers the flexibility to provide for diverse housing types within one development without sacrificing the existing image and character of the surrounding area.
Shawnee — The Shawnee Comprehensive Plan includes the following Residential Land Use goal and objective:
Goal: To ensure a variety of residential living units are appropriately located throughout the community in high quality residential developments.
Objective 1. To provide diversity in housing design and placement. Home design in planned single family developments will be expected to contain a variety of architectural features, as well as the use of brick or stone.
Blue Springs — Blue Springs Comprehensive Plan includes goals, objectives and policies that promote housing diversity and home maintenance.

BBC RESEARCH & CONSULTING SECTION V, PAGE 15
Independence — The city is currently in the process of completing a new Comprehensive Plan, Independence 2030: A Comprehensive Plan. The current plan, adopted in 1993, includes a Housing Program section which includes an action plan to improve housing condition and opportunities for low and moderate income households.
Kansas City, MO —The FOCUS Kansas City Plan’s Physical Framework Plan includes several action items pertaining to diverse housing types:
O. Promote a diversity of housing stock so that Kansas City attracts first time home buyers and also appeals to move-up and executive level markets.
Q. Locate public housing in all areas of the city that have access to public transportation.
R. Create a combination of incentives & partnerships to encourage the rehab of existing housing & the availability of moderate incoming housing in existing neighborhoods.
S. Develop design standards & urban design guidelines for low & moderate income housing so that it blends with any neighborhood.
According to the city, since 1997 (the year the city adopted FOCUS) the Kansas City Department of Housing and Community Development has implemented FOCUS as a guiding principal to diversify the city’s housing stock. However, FOCUS does not exclusively qualify as the city’s sole planning and development for fair and affordable housing. The city’s Consolidated Plan identifies specific housing needs and establishes program goals and objectives, which supports the creation of affordable and diverse housing in various strategy areas, e.g., outside of the immediate urban core.
Lee’s Summit — The Comprehensive Plan 2005 (as amended) includes the following long-term goal, objective and policies concerning residential development and diverse housing types:
Goal 3. Achieve a high-quality living environment and diversified housing market.
Objective 3.3. Provide diverse housing types to meet the changing housing needs of the community.
Policies:
o A. Establish regulatory provisions and land use plans that allow mixed-use development in designated areas.
o B. Encourage development plans that effectively integrate diverse housing types and styles.
Mixed-use:
Johnson County — The Land Use Plan, Chapter 2, includes the following Action Step concerning mixed-use when addressing the county’s goal concerning the sense of community and rural character: “Prepare a community-centered mixed-use plan for Stilwell in the vicinity of 199th and Metcalf Avenue as recommended in the Aubry Oxford Township Planning Committee (AOTPC) Report.”

PAGE 16, SECTION V BBC RESEARCH & CONSULTING
Kansas City, KS — The Master Plan includes a policy framework that addresses mixed-use and highlights the following mixed-use policies and recommendations:
Mixed-Use, Guiding Principles: Encourage a mix of residential densities and products.
Policy: Provide opportunities for housing choice and diversity including but not limited to: multiple price points; attached and detached products; owner-occupied; and renter occupied.
o Priority Recommendations: 1. Modify existing Zoning and Subdivision regulations to allow a mix of uses by right within these areas.
Leavenworth — The 2010 Land Use Plan includes the following land use action step to allow for mixed-uses: Revise the city’s zoning, sign, and subdivision development ordinances to allow for a variety of new residential and commercial mixed uses and clustered residential development.
Overland Park — The Master Plan includes five Mixed-Use Land Use Goals, which “are needed to facilitate the mixing, rather than separation of, land uses – residential, commercial, office, hotels, public and semipublic, and parks, recreation, and open space – in one distinctive environment.”
Shawnee — The Plan includes the following goal concerning the I-435 Corridor and mixed-use:
Goal: To create a series of integrated developments, which provide mixed use opportunities for housing, commerce, and destination attractions at a higher density than may be seen in other areas of the community.
Blue Springs — Blue Springs Goal: Development Density Options. Promote options such as mixed-use development as a way to maintain property values, aesthetics and quality of life, and to promote quality development in Blue Springs.
Independence — The city’s current Comprehensive Plan (adopted in 1993) includes a Land Use chapter that includes a proposed Mixed-Use District and chapter on zoning and subdivision regulations with proposed changes to the zoning code.
Kansas City, MO — The FOCUS Kansas City Plan’s Urban Core Plan includes mixed-use design guidelines and the guidelines are designed to support the following:
Restructure zoning ordinance to embrace mixed-use concept. To support and encourage higher density mixed-use development as described in this plan, the City will restructure the existing Zoning Ordinance that is cumbersome and lacks critical requirements for the development of a quality urban environment. The ordinance will be simplified by combining existing categories into a series of “Mixed-use” categories that would be applicable throughout the Central Business Corridor and the Mixed-use Centers. Critical additions to the ordinance include the requirement of a “build-to” line that would require a certain percentage of new construction to be built adjacent to the street, reinforcing the historic streetwall that characterizes Kansas City.
Lee’s Summit — The Comprehensive Plan 2005 (as amended) includes the following long-term goal and policies concerning residential development and mixed-use development:
Goal 4. Establish a strong, high-quality commercial base in the area that provides diversified, accessible, and convenient services.

BBC RESEARCH & CONSULTING SECTION V, PAGE 17
Policies:
Preserve at least 1,000 feet of depth along major traffic-ways and at major interchanges/intersections for future commercial, office and mixed-use development.
Encourage master planned commercial centers, office parks or mixed-use development at key locations.
Code of Ordinances. The Code of Ordinances or Municipal Code for jurisdictions are a compilation of ordinances, commonly known as local laws, which have been adopted by the local City Council or other local governing board. Typically ordinances help municipalities with maintaining public safety, health, morals, and general welfare of their communities. An important part of the Municipal Code is the Zoning Code, also referred to as the Development Code. The Zoning Code governs the land use, development and planning activities of the community and typically divides land into different districts, such as agricultural, residential, commercial and industrial. The following includes a review of the nine jurisdictions’ codes, focusing generally on the Zoning Code, to assess potential fair housing concerns.
Minimum lot size per unit. A key element of the zoning/development code in regards to fair housing choice is the minimum lot size per unit requirement. Zoning codes should, ideally, include zoning regulations and minimum lot requirements that are feasible for all types of developments. Overly large lot requirements may discourage or hinder affordable housing development. Figure V-7 summarizes the minimum square foot lot area per unit requirements for the various zoning areas of the nine jurisdictions.
Figure V-7. Minimum Lot Size (Square Feet or Acres) Per Unit for Residential Districts, Kansas City Metro Consortium
Kansas
Johnson County (Unincorporated)
1 - 3 acres 10,000 - 20,000 4,500 - 10,000 3,575
Kansas City 1 acre 5,000 - 7,150 2,500 - 4,000 1,500 - 3,000
Leavenworth 25,000 or 1 acre 6,000 - 9,000 4,000 - 6,000 3,000 - 6,000
Overland Park 1 acre, 5 units per acre 4,250 - 8,000 4,000 - 6,000 1,000 - 3,000
Shawnee 1 - 2.5 acres 5,000 - 12,000 6,000 800 - 3,333
Missouri
Blue Springs 1 acre 7,200 - 12,000 3,000 - 7,200 2,400 - 6,000
Independence 40,000 - 3 acres 7,000 - 20,000 2,400 - 3,000 1,450
Kansas City 10,000 - 80,000 5,000 - 7,500 2,500 - 5,000 300 - 1,500
Lee's Summit 1/2 - 10 acres 6,600 - 8,400 4,000 - 6,000 3,500
Very Low Density
Low Density
Medium Density
High Density
Note: Very low density includes rural and estate residential districts; low density includes single family residential; medium density includes districts for duplex to townhome type residential; and high density includes multifamily residential.
Source: The Kansas jurisdictions of Johnson County and the cities of Kansas City, Leavenworth, Overland Park and Shawnee, and the Missouri jurisdictions of Blue Springs, Independence, Kansas City and Lee’s Summit.
As shown in the previous figure, lot requirements are somewhat similar from jurisdiction to jurisdiction. However, minimum lot sizes per unit in Johnson County, which includes the unincorporated (more rural) portion of the county, are typically larger when compared to the cities.

PAGE 18, SECTION V BBC RESEARCH & CONSULTING
The low density (or single family residential) districts’ typical minimum lot sizes are in the range of 6,000 to 7,000 square feet, with the more urban cities of Kansas City, MO and KS as low as 5,000 square feet. Overland Park had the lowest minimum lot size per unit requirement, stipulating 4,250 square feet for the Planned Single-Family Infill Residential District (RP-1N).
Housing for persons with disabilities. The Federal Fair Housing Act prohibits discrimination in housing on the basis of race, color, national origin, religion, gender/sex, familial status and disability. Therefore it is important that local zoning codes do not prohibit or discourage housing that serves these populations, including housing commonly referred to as group homes. An example of such discouragement is if a city does not permit a home that will house an acceptable number of persons with developmental disabilities (commonly 6 to 8 persons) and their caregiver(s) in residential districts. This may be done by including a definition of “family” that is narrowly defined or by not allowing these types of housing arrangements in some of the residential districts.
The State Statutes of Kansas and Missouri both include sections concerning group homes pertaining to municipal zoning ordinances.
The Kansas Statutes, Chapter 12: Cities And Municipalities, Article 7: Planning And Zoning, Statute 12-736 (K.S.A. 12-736)7 states:
12-736: Group homes, exclusion of, prohibited; conditions; definitions.
(a) It is hereby declared to be the policy of the state of Kansas that persons with a disability shall not be excluded from the benefits of single family residential surroundings by any municipal zoning ordinance, resolution or regulation.
(b) For the purpose of this act:
(1) "Group home" means any dwelling occupied by not more than 10 persons, including eight or fewer persons with a disability who need not be related by blood or marriage and not to exceed two staff residents who need not be related by blood or marriage to each other or to the residents of the home, which dwelling is licensed by a regulatory agency of this state;
(2) "municipality" means any township, city or county located in Kansas;
(3) "disability" means, with respect to a person:
(A) a physical or mental impairment which substantially limits one or more of such person's major life activities;
(B) a record of having such an impairment; or
(C) being regarded as having such an impairment. Such term does not include current, illegal use of or addiction to a controlled substance, as defined in section 102 of the controlled substance act (21 U.S.C. 802);
(4) "licensed provider" means a person or agency who provides mental health services and is licensed by:…
7 http://kansasstatutes.lesterama.org/Chapter_12/Article_7/#12-736

BBC RESEARCH & CONSULTING SECTION V, PAGE 19
(c) (1) No mentally ill person shall be eligible for placement in a group home unless such person has been evaluated by a licensed provider and such provider determines that the mentally ill person is not dangerous to others and is suitable for group-home placement. A group home shall not be a licensed provider for the purposes of evaluating or approving for placement a mentally ill person in a group home.
(2) No person shall be eligible for placement in a group home if such person is:
(A) assigned to a community corrections program or a diversion program;
(B) on parole from a correctional institution or on probation for a felony offense; or
(C) in a state mental institution following a finding of mental disease or defect excluding criminal responsibility, pursuant to K.S.A. 22-3220 and 22-3221.
(d) No person shall be placed in a group home under this act unless such dwelling is licensed as a group home by the department of social and rehabilitation services or the department of health and environment.
(e) No municipality shall prohibit the location of a group home in any zone or area where single family dwellings are permitted. Any zoning ordinance, resolution or regulation which prohibits the location of a group home in such zone or area or which subjects group homes to regulations not applicable to other single family dwellings in the same zone or area is invalid. Notwithstanding the provisions of this act, group homes shall be subject to all other regulations applicable to other property and buildings located in the zone or area that are imposed by any municipality through zoning ordinance, resolution or regulation, its building regulatory codes, subdivision regulations or other nondiscriminatory regulations.
(f) No person or entity shall contract or enter into a contract, restrictive covenant, equitable servitude or such similar restriction, which would restrict group homes or their location in a manner inconsistent with the provisions of subsection (e).
The Missouri Revised Statutes, Title VII. Cities, Towns and Village, Chapter 89, Zoning and Planning, Section 89.020 (RSMo 89.020) 8 states:
89.020…
2. For the purpose of any zoning law, ordinance or code, the classification single family dwelling or single family residence shall include any home in which eight or fewer unrelated mentally or physically handicapped persons reside, and may include two additional persons acting as houseparents or guardians who need not be related to each other or to any of the mentally or physically handicapped persons residing in the home. In the case of any such residential home for mentally or physically handicapped persons, the local zoning authority may require that the exterior appearance of the home and property be in reasonable conformance with the general neighborhood standards. Further, the local zoning authority may establish reasonable standards regarding the density of such individual homes in any specific single family dwelling neighborhood.
8 http://www.moga.mo.gov/statutes/C000-099/0890000020.HTM

PAGE 20, SECTION V BBC RESEARCH & CONSULTING
3. No person or entity shall contract or enter into a contract which would restrict group homes or their location as defined in this section from and after September 28, 1985.
5. Should a single family dwelling or single family residence as defined in subsection 2 of this section cease to operate for the purpose as set forth in subsection 2 of this section, any other use of such home, other than allowed by local zoning restrictions, must be approved by the local zoning authority.
6. For purposes of any zoning law, ordinance or code the classification of single family dwelling or single family residence shall include any private residence licensed by the division of family services or department of mental health to provide foster care to one or more but less than seven children who are unrelated to either foster parent by blood, marriage or adoption. Nothing in this subsection shall be construed to relieve the division of family services, the department of mental health or any other person, firm or corporation occupying or utilizing any single family dwelling or single family residence for the purposes specified in this subsection from compliance with any ordinance or regulation relating to occupancy permits except as to number and relationship of occupants or from compliance with any building or safety code applicable to actual use of such single family dwelling or single family residence.
Several of the jurisdictions include references to these State Statues in their Codes, including the Kansas cities of Overland Park and Shawnee and the Missouri cities of Kansas City and Lee’s Summit. In addition Johnson County and Kansas City, KS Codes include similar (if not the same) language concerning these type of group homes in their codes as the Kansas Statute, however these jurisdictions do not reference the actual statute in their codes.
According to both of the State Statutes, the jurisdictions’ classifications of single family dwelling or single family residence shall include theses type of group homes. The Kansas Statute (K.S.A. 12-736) specifically states that:
“No municipality shall prohibit the location of a group home in any zone or area where single family dwellings are permitted. Any zoning ordinance, resolution or regulation which prohibits the location of a group home in such zone or area or which subjects group homes to regulations not applicable to other single family dwellings in the same zone or area is invalid.”
The Missouri Revised Statute (RSMo 89.020) states that a single family dwelling also includes this type of group home:
“For the purpose of any zoning law, ordinance or code, the classification single family dwelling or single family residence shall include any home in which eight or fewer unrelated mentally or physically handicapped persons reside….”
Therefore, by these statutes, it is understood that jurisdictions in Kansas and Missouri shall allow these types of group homes in districts that also allow single family residential units, and that jurisdictions are not allowed to require additional regulations for group homes than what is required for single family dwelling in districts that permit single family dwellings.

BBC RESEARCH & CONSULTING SECTION V, PAGE 21
The following figure shows whether group homes are permitted in the residential districts for each jurisdiction. Each jurisdiction includes a definition of a group home, either separately or it is included in the definition of “family.” Each jurisdiction’s definition of group home is similar to the following definition:
Group home. Any dwelling occupied by not more than 10 persons, including eight or fewer persons with a disability who need not be related by blood or marriage and not to exceed two staff residents who need not be related by blood or marriage to each other or to the residents of the home, which dwelling is licensed by a regulatory agency of the state.
As shown in the figure, group homes are permitted uses in the residential districts that are zoned for single family homes, these include the “very low density” and “low density” categories. However, as shown in their Municipal Code, the City of Shawnee requires a special use permit for a group home (adult/children) in the residential districts zoned for single family homes. 9 This appears to be in violation of the Kansas Statute, K.S.A. 12-736. Planning staff responded the City of Shawnee does not require a special use permit for a group home (as defined in the Zoning Code10) and that group homes in Shawnee have not been a problem.
Figure V-8. Zoning of Group Homes in Residential Districts, Kansas City Metro ConsortiumNote:
P = Permitted Use; C = Conditional Use; S = Special Use
Group home is generally defined as a home where eight or fewer persons with a disability and up to two staff residents dwell.
Very low density includes rural and estate residential districts; low density includes single family residential; medium density includes districts for duplex to townhome type residential; and high density includes multifamily residential.
* Single family homes Located within an RP-4 district are nonconforming and are considered to be the same as a single family unit. Therefore, they can be used as a group home with 8 or fewer persons. Source:
Johnson County, Kansas Zoning and Subdivision Regulations; Code of the Unified Government of Wyandotte County/Kansas City, KS; Leavenworth, Kansas Code of Ordinances; Overland Park, Kansas Municipal Code; Shawnee, Kansas Municipal Code; Blue Springs, Missouri Municipal Code; Independence, Missouri Code of Ordinances; Kansas City, MO Code of Ordinances; and Lee's Summit, Missouri Code of Ordinances.
Group Home
Kansas
Johnson County P P C C
Kansas City P P P P
Leavenworth P P S P
Overland Park P P P P
Shawnee S S P P
Missouri
Blue Springs P P P P
Independence P P P P
Kansas City P P P P
Lee's Summit* P P P P
Very Low
DensityLow
DensityMedium Density
High Density
In order to be more transparent and forthcoming concerning a jurisdictions’ zoning regulations of group homes, it is recommended jurisdictions include their definition of group home, which is similar to their respective State Statutes, in an easy to find and easy to understand manner. A good example of this is to include this type of group home in their definition of “family” or “household,” or however the jurisdiction determines who occupies the dwelling units. Both Kansas City, KS and Kansas City, MO do a good job of this by including this type of group home in their definitions of family/household.
9 Shawnee, Kansas Municipal Code, Chapter 17.51 Table of General Use Regulations.
10 Shawnee, Kansas Municipal Code, 17.04.163(a) Group Home.

PAGE 22, SECTION V BBC RESEARCH & CONSULTING
Code of the Unified Government of Wyandotte County/Kansas City, KS, Chapter 27—Planning and Development, Article VIII — Zoning: “Family” means one or more persons who are related by blood or marriage, and including any foster children, or a group of not more than five persons living together by joint agreement on a nonprofit cost sharing basis, or a combination of persons related by blood or marriage along with no more than two unrelated adults to a maximum number of five persons, living together and occupying a single housekeeping unit with single kitchen facilities. In addition, up to ten persons, including eight or fewer persons with a disability or handicap and not to exceed two staff residents residing in a dwelling shall be considered to be a family. Handicapped persons are defined in Title VIII of the Civil Rights Act of 1968, as amended by the "Fair Housing Amendments Act of 1988."11
Zoning and Development Code of the City of Kansas City, MO (Chapter 88): The type of group home described by Missouri Revised Statutes is included in the city’s definition of household and group home. The Code is very clear that this type of group home is allowed in, “all districts that allow household living uses.”
“Household” means an individual; or two or more persons related by blood, marriage or adoption; or a group of not more than five persons, excluding servants, who need not be related by blood or marriage, living together and subsisting in common as a separate nonprofit housekeeping unit which provides one kitchen; or a group of eight or fewer unrelated mentally or physically handicapped persons, which may include two additional persons acting as house-parents or guardians who need not be related to each other or to any of the mentally or physically handicapped persons residing in the home.12
1. GROUP HOME. A single dwelling occupied on a permanent basis by a group of unrelated persons with disabilities. Group homes may also be occupied by paid staff and caregivers. Group homes are typically operated for the care of developmentally disabled persons. It expressly excludes halfway houses for alcoholics, drug addicts, prisoners, or juvenile delinquents, or any facility for individuals under court-mandated supervision. Group homes for 8 or fewer mentally or physically handicapped persons, with up to two additional persons acting as house-parents or guardians, are considered "households" and are allowed as-of-right in all districts that allow household living uses.13
A variety of housing types. Allowing for a variety and mixture of housing types is important to ensure an array of homes in different price ranges. Allowing for medium and high density residential dwellings, cluster developments, accessory dwelling units and mixed uses are all ways jurisdictions can provide a wide range of housing types at all income levels.
All of the nine jurisdictions’ codes include residential districts zoned for very low density (more rural) to high density (multifamily dwellings). Additionally, all of the jurisdictions include districts for planned/cluster development. The following figure shows whether the jurisdictions allow for accessory dwelling units, mixed use and planned or cluster development, along with the zoning districts these uses/development types are allowed.
11
� Code of the Unified Government of Wyandotte County/Kansas City, Kansas, Chapter 27—Planning and Development, Article VIII—Zoning, Sec. 27-340—Definitions.
12 Zoning and Development Code of the City of Kansas City, Missouri (Chapter 88), 88-810 Definitions.
13 Zoning and Development Code of the City of Kansas City, Missouri (Chapter 88), 88-805-02-B. Group Living.

BBC RESEARCH & CONSULTING SECTION V, PAGE 23
Figure V-9. Zoning/Development Code, Kansas City Metro Consortium
Kansas
Johnson County (unincorporated)
No ― Rural District, allows for one secondary farm residence for farmhands on >20 acre lot
No Yes ― Planned Residential Neighborhood-2, PRN-1 and all PRU districts
Kansas City No Yes ― Central Business District (C-D) No― Traditional Neighborhood Design
District (TND)
Leavenworth No Yes ― NBD Neighborhood Business District
Yes ― PUD, Planned Unit Development District
― (PUD) Planned Unit Development District
Overland Park Yes ― Planned Residential Neighborhood District
Yes ― Chapter 18.275, MXD, Planned Mixed Use District
Yes ― Planned zoning districts
― Downtown Form District
Shawnee Yes ― PUDMX, Planned Unit Development Mixed Use District
Yes ― PUDMX, Planned Unit Development Mixed Use District
Yes ― PUD, Planned Unit Development Districts
― Downtown District
Missouri
Blue Springs Yes ― SECTION 404.240: Downtown Development Code (DDC)
Yes ― MX-O, Mixed Use Development Overlay District
Yes ― SECTION 407.110: Planned Unit Development Regulations
Independence No Yes ― O-1 DISTRICT, Office-Residential Yes ― 14-703 Planned Unit Developments
― C-1 DISTRICT, Neighborhood Commercial
― 14-902 /PUD
Kansas City Yes - 88-305 Accessory Uses and Structures
Yes ― 88-130-02-C. DX, Downtown Mixed-Use
Yes ― 88-280 MPD, Master Planned Development District
― 88-130-02-D. DR, Downtown Residential
― 88-280 MPD, Master Planned Development District
Lee's Summit Yes Yes ― Section 5.140. PRO Planned residential office district
Yes ― Section 5.230. PMIX Planned mixed use district
― Section 5.160. TNZ Transitional Neighborhood Zone
― Section 5.230. PMIX Planned mixed use district
Mixed Use Development Planned/Cluster Development
Allow? Allow? Zoning DistrictZoning DistrictZoning DistrictAllow?
Accessory Dwelling Units
Source: Johnson County, Kansas Zoning and Subdivision Regulations; Code of the Unified Government of Wyandotte County/Kansas City, KS; Leavenworth, Kansas Code of Ordinances; Overland Park, Kansas Municipal Code; Shawnee, Kansas Municipal Code; Blue Springs, Missouri Municipal Code; Independence, Missouri Code of Ordinances; Kansas City, MO Code of Ordinances; and Lee's Summit, Missouri Code of Ordinances.

PAGE 24, SECTION V BBC RESEARCH & CONSULTING
Parking requirements. According to Urban Planner Don Elliot of Clarion Associates, the traditional standard of two parking spaces per dwelling unit may be reasonable in some communities; however a lower standard can and generally should be used for affordable housing, multifamily housing, group housing and special needs housing. Parking requirements tend to increase the cost of providing housing by pulling away resources that could be used to reduce overall development costs, in turn lower rents, or provide more services.
A review of the jurisdictions parking requirements found similar parking requirements for all jurisdictions and no concerns.
Planning, development and building fees. As part of the land use review for the AI, the level of fees for zoning changes, variance requests and the development of residential housing were reviewed. Except for fees in Johnson County and, to a lesser extent, fees in Leavenworth and Blue Springs, the jurisdictions’ development fees appeared similar and reasonable.
Figure V-10. Common Planning and Development Fees for Residential Development, Kansas City Metro Consortium
Kansas
Johnson County $375 $150 $300 -$1,200 $2,195 ***
Kansas City $350 ** $100 $150 - $250 ** $576 ****
Leavenworth $75 $350 $150 - $500 $1,727 ****
Overland Park $375 * $120 $375 currently deferred
Shawnee $250 $125 $375 -$750 $960
Missouri
Blue Springs $385 $400 $385 $1,942 ****
Independence $250 ** $150 $250 ** $650 ****
Kansas City $500 $250 $625 $576 ****
Lee's Summit $900 ***** $300 ***** $700 ***** $618 ****
Special/ ConditionalUse Permit Variance Rezoning
Estimated Building Permit
Note: * $50 = Exception: Special Use Permits for the keeping of horses, ponies, cows, chickens, or other animals on less than three acres and Group Care Homes, including pre-school and private kindergartens
** Five acres or less.
*** For a home valued at $350,000.
**** For a single family home valued at $200,000.
***** Plus two legal notice publishing charge.
Source: The Kansas jurisdictions of Johnson County and the cities of Kansas City, Leavenworth, Overland Park and Shawnee, and the Missouri jurisdictions of Blue Springs, Independence, Kansas City and Lee’s Summit.
Building, occupancy and health and safety codes. A jurisdiction’s building codes, as well as other health and safety codes, intent is to provide a minimum suitable level of safety for the community in regards to buildings and other structures. Each jurisdiction includes their adopted and enforced building codes in their respective code of ordinances and appears to be in line with their appropriate state statute requirements.

BBC RESEARCH & CONSULTING SECTION V, PAGE 25
Occupancy requirements. Cities often define occupancy requirements in order to protect the health and safety of its residents by attempting to prevent overcrowding. The 2006 International Building Code establishes for residential dwelling a maximum floor area allowance per occupant to be 200 square feet. Additionally, jurisdictions commonly establish a definition of “family” or “household” and typically one household is allowed to occupy a dwelling unit. The following figure provides the term the jurisdiction uses in their code, either family or households, as well as the maximum number of unrelated persons included in their definition.
Figure V-11. Zoning Code Definition Term and Maximum Number of Unrelated Persons, Kansas City Metro Consortium
Source:
Johnson County, Kansas Zoning and Subdivision Regulations; Code of the Unified Government of Wyandotte County/Kansas City, KS; Leavenworth, Kansas Code of Ordinances; Overland Park, Kansas Municipal Code; Shawnee, Kansas Municipal Code; Blue Springs, Missouri Municipal Code; Independence, Missouri Code of Ordinances; Kansas City, MO Code of Ordinances; and Lee's Summit, Missouri Code of Ordinances.
Kansas
Johnson County Family None
Kansas City Family 5
Leavenworth Family 4
Overland Park Family 4
Shawnee Family 4
Missouri
Blue Springs Family 4
Independence Household 6
Kansas City Household 5
Lee's Summit Family 4
Term Used
in Code
Maximum Number of
Unrelated Persons
Every jurisdiction allows for an unlimited number of related persons in a household, and typically they include the following phase or something similar, “…who are living together as a single housekeeping unit.” The following lists the definitions for family/household for each of the nine jurisdictions:
Johnson County — Zoning & Subdivision Regulations, Article 2:
"Family" One or more individuals who are occupying and living together in and occupying a single housekeeping unit with common kitchen facilities.
Kansas City, KS — Article IV Section 1, of the Zoning Resolution and Subdivision Regulations:
Family means one or more persons who are related by blood or marriage, and including any foster children, or a group of not more than five persons living together by joint agreement on a nonprofit cost sharing basis, or a combination of persons related by blood or marriage along with no more than two unrelated adults to a maximum number of five persons, living together and occupying a single housekeeping unit with single kitchen facilities. In addition, up to ten persons, including eight or fewer persons with a disability or handicap and not to exceed two staff residents residing in a dwelling shall be considered to be a family. Handicapped persons are defined in Title VIII of the Civil Rights Act of 1968, as amended by the "Fair Housing Amendments Act of 1988.14
14
This is the amended version of family, of the definition contained in Article IV Section 1, of the Zoning Resolution and Subdivision Regulations, Wyandotte County, as adopted in section 27-170.

PAGE 26, SECTION V BBC RESEARCH & CONSULTING
Leavenworth — Article X of the Zoning Ordinance:
FAMILY: One or more persons related by blood, marriage, or adoption, living together as a single housekeeping unit; or a group of not more than four (4) unrelated persons living together as a single housekeeping unit on a non-profit cost-sharing basis; plus in either case, usual domestic servants. A family shall under no circumstances be construed as a boarding or rooming house, fraternity or sorority house, club, lodging house, hotel, motel, or commune.
Overland Park — 18.110.240 of the Municipal code:
“Family” means any of the following:
1. A group of not more than four (4) related or unrelated persons of any age living together by joint agreement and occupying a single housekeeping unit with common kitchen facilities, or a mixed group of related and non-related persons of any age who together constitute no more than a cumulative total of four (4) persons living together by joint agreement and occupying a single housekeeping unit with common kitchen facilities.
2. A group of any size and age consisting entirely of an immediate family. For the purpose of this section an “immediate family” shall be a group consisting of only a spouse, parent, child, grandchild, grandparent, brother or sister, all related by marriage or consanguinity, and all of who can provide documentation of such relationship within a reasonable time upon request by the appropriate enforcement officers of the City. Ten (10) calendar days shall constitute a reasonable period of time unless the occupants can establish the necessity of an extension of time to obtain such documentation from the authorized sources, and any request for an extension of time to the City must be submitted in writing prior to the expiration of the ten day response time, and must be accompanied by names, dates and location of the births or marriages sought to be documented.
3. A group of not more than seven (7) persons who are 18 years of age or older who are related by marriage or consanguinity, all living together and occupying a single housekeeping unit with common kitchen facilities, and all of who can provide documentation of such relationship within a reasonable time upon request by the appropriate enforcement officers of the City, as provided in subsection (2) above.
4. In any civil or criminal prosecution for violation of the permitted occupancy of a single family dwelling, a court may, where appropriate, infer from the evidence presented in that prosecution, including, without being limited to, evidence that more than four (4) persons age 18 or older are occupying a single family dwelling, that such occupancy constitutes an occupancy in violation of the Municipal Code.
Shawnee — 17.04.120 of the Municipal Code:
"Family" means a group of persons living together as a single nonprofit housekeeping unit and consisting of either:
A. One or more persons related by blood, marriage or adoption;
B. Not more than four persons not necessarily related by blood, marriage or adoption.
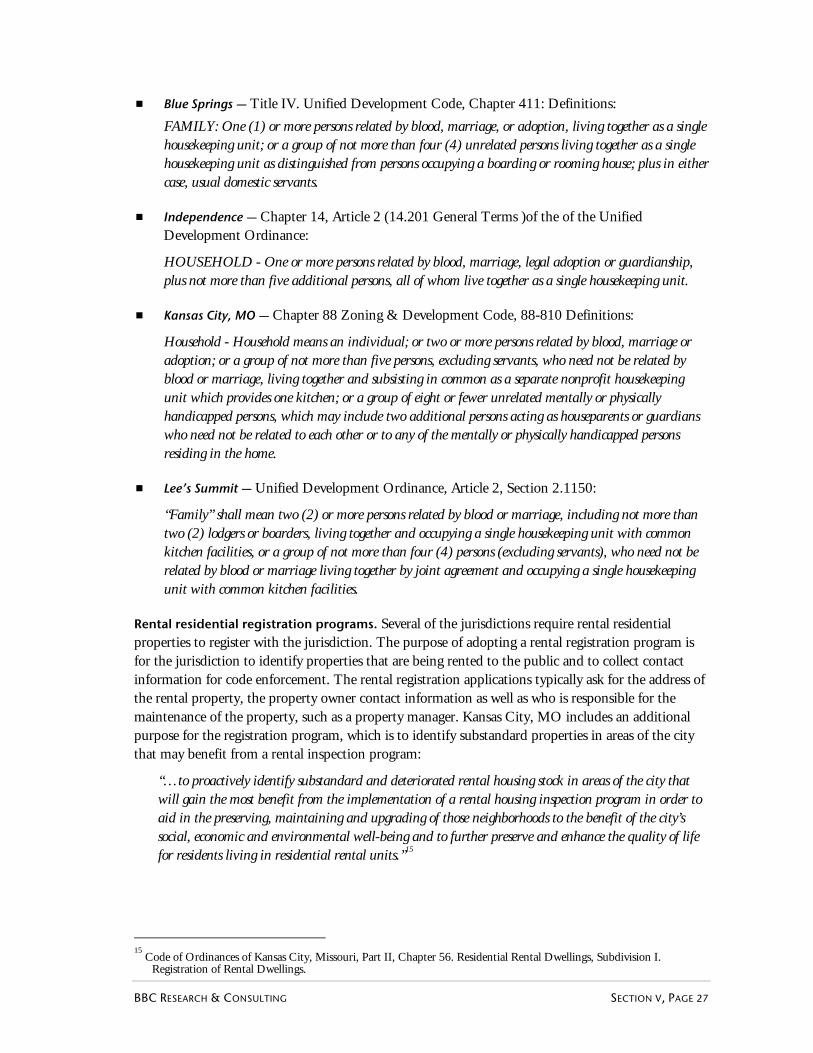
BBC RESEARCH & CONSULTING SECTION V, PAGE 27
Blue Springs — Title IV. Unified Development Code, Chapter 411: Definitions:
FAMILY: One (1) or more persons related by blood, marriage, or adoption, living together as a single housekeeping unit; or a group of not more than four (4) unrelated persons living together as a single housekeeping unit as distinguished from persons occupying a boarding or rooming house; plus in either case, usual domestic servants.
Independence — Chapter 14, Article 2 (14.201 General Terms )of the of the Unified Development Ordinance:
HOUSEHOLD - One or more persons related by blood, marriage, legal adoption or guardianship, plus not more than five additional persons, all of whom live together as a single housekeeping unit.
Kansas City, MO — Chapter 88 Zoning & Development Code, 88-810 Definitions:
Household - Household means an individual; or two or more persons related by blood, marriage or adoption; or a group of not more than five persons, excluding servants, who need not be related by blood or marriage, living together and subsisting in common as a separate nonprofit housekeeping unit which provides one kitchen; or a group of eight or fewer unrelated mentally or physically handicapped persons, which may include two additional persons acting as houseparents or guardians who need not be related to each other or to any of the mentally or physically handicapped persons residing in the home.
Lee’s Summit — Unified Development Ordinance, Article 2, Section 2.1150:
“Family” shall mean two (2) or more persons related by blood or marriage, including not more than two (2) lodgers or boarders, living together and occupying a single housekeeping unit with common kitchen facilities, or a group of not more than four (4) persons (excluding servants), who need not be related by blood or marriage living together by joint agreement and occupying a single housekeeping unit with common kitchen facilities.
Rental residential registration programs. Several of the jurisdictions require rental residential properties to register with the jurisdiction. The purpose of adopting a rental registration program is for the jurisdiction to identify properties that are being rented to the public and to collect contact information for code enforcement. The rental registration applications typically ask for the address of the rental property, the property owner contact information as well as who is responsible for the maintenance of the property, such as a property manager. Kansas City, MO includes an additional purpose for the registration program, which is to identify substandard properties in areas of the city that may benefit from a rental inspection program:
“…to proactively identify substandard and deteriorated rental housing stock in areas of the city that will gain the most benefit from the implementation of a rental housing inspection program in order to aid in the preserving, maintaining and upgrading of those neighborhoods to the benefit of the city’s social, economic and environmental well-being and to further preserve and enhance the quality of life for residents living in residential rental units.”15
15
Code of Ordinances of Kansas City, Missouri, Part II, Chapter 56. Residential Rental Dwellings, Subdivision I. Registration of Rental Dwellings.

PAGE 28, SECTION V BBC RESEARCH & CONSULTING
A rental inspection program is a tool used by other municipalities across the nation that require rental properties to register with the jurisdiction and may require an interior and exterior inspection of the property. These programs may be citywide or else targeted to designated neighborhoods. The purpose of these programs is to protect the health and safety of those residing in the rental units and to improve and/or preserve the quality of the units and neighborhoods, if neighborhoods are targeted.
As shown in the following figure the Kansas cities of Kansas City, Leavenworth, Overland Park and Shawnee, and Kansas City, MO have a rental residential registration program. The City of Kansas City, MO requires an inspection of a rental properties located in neighborhoods that have been designated as “targeted” by the City Council every two, three or 4 years depending on the condition of the unit and how timely violations were corrected. Kansas City, KS requires a city-wide inspection of single family to 6-unit rental properties every five years.
Figure V-12. Residential Rental Registration and Inspection Programs, Kansas City Metro Consortium
Type of Residential Property Location Fee
Kansas
Johnson County No -- -- -- --
Kansas City Registration All rentals City-wide Annually
InspectionSinge family to6 unit rentals
City-wide Every 5 years
Inspection7+ units (multifamily complexes)
City-wide Every 2 years
Leavenworth Registration All rentals City-wide One time $20
Overland Park Registration All rentals City-wide Annually $10 for first unit and $2 for each additional unit
Shawnee Registration Duplex, tri-plex and other multifamily rentals
City-wide Annually 0.006 cents per square foot
Inspection * Single family rental * City-wide * Yes, determine reasonable cost
Missouri
Blue Springs No -- -- -- --
Independence No -- -- -- --
Kansas City Registration All rentals City-wide Annually None
Inspection All rentalsTarget neighborhoods **
2, 3 or 4 years None
Lee's Summit No -- -- -- --
Rental Registration/
Inspection Program
Frequency of
Registration
$32.00 for the building and $23.00 each unit
Note: *Single family Residential rental property which has received three (3) or more Violation Notices within any consecutive twelve (12) month calendar day will request approval to conduct an interior inspection from the occupant of the single family residential property.
**The Blue Hills, Hyde Park, Ivanhoe, Pendleton Heights, Scarritt Renaissance, Town Fork Creek and West Plaza neighborhoods have been designated by the City Council as target neighborhoods for rental housing inspections in Kansas City, MO.
Source: The Kansas jurisdictions of Johnson County, Kansas City, Leavenworth, Overland Park and Shawnee, and the Missouri jurisdictions of Blue springs, Independence, Kansas City and Lee’s Summit.

BBC RESEARCH & CONSULTING SECTION V, PAGE 29
Accessibility requirements. According to HUD, all states and many cities and counties have developed their own building codes for accessibility for persons with physical disabilities. These are usually based on the specifications contained in national standards such as American National Standards Institute (ANSI) and Uniform Federal Accessibility Standards (UFAS). If the local code diverges from the national standards the universal rule is to follow which ever requirement is stricter.16
Both Kansas and Missouri statutes include citations for ANSI A117.117 in their statutes along with their interpretation of the federal accessibility requirements in new multifamily residential construction. The follow lists where these are located in their respective statutes:
Kansas Statues:
Chapter 58: Personal And Real Property, Article 14: Accessibility Standards For Certain Dwellings (K.S.A.58-1401); and
Chapter 44: Labor And Industries, Article 10: Kansas Acts Against Discrimination, 44-1016: Same; unlawful acts in connection with sale or rental of real property. Subject to the provisions of K.S.A. 44-1018 and amendments thereto, it shall be unlawful for any person (K.S.A 44-1016).
Missouri Revised Statutes:
Chapter 213. Human Rights, Unlawful housing practices--discrimination in housing--sufficient compliance with other standards--local government compliance--construction of law--housing for older persons, defined--conviction for controlled substances, effect--religious organizations, effect of, 213.040 (RSMo 213).
Neither of the states includes provisions for new multifamily housing that are more stringent than the required Fair Housing Act. Additionally, the Uniform Federal Accessibility Standards (UFAS) requires that a federally funded residential rental project must include five (5) percent of the total units (or at least one unit) in projects of 15 or more dwelling units that are designed so that physically handicapped persons will have ready access to and use of the dwelling units.18
The U.S. Department of Justice recently revised ADA requirements. Effective March 15, 2011, among other changes, newly constructed or altered public facilities will need to comply with enhanced accessibility provisions, which, over time, will have the effect of improving accessibility.
16
Fair Housing Act Design Manual: A Manual To Assist Designers and Builders in Meeting the Accessibility Requirements of the Fair Housing Act.
17 American National Standard for Buildings and Facilities providing accessibility and usability for people with physical
disabilities. 18
http://www.access-board.gov/ufas/ufas-html/ufas.htm
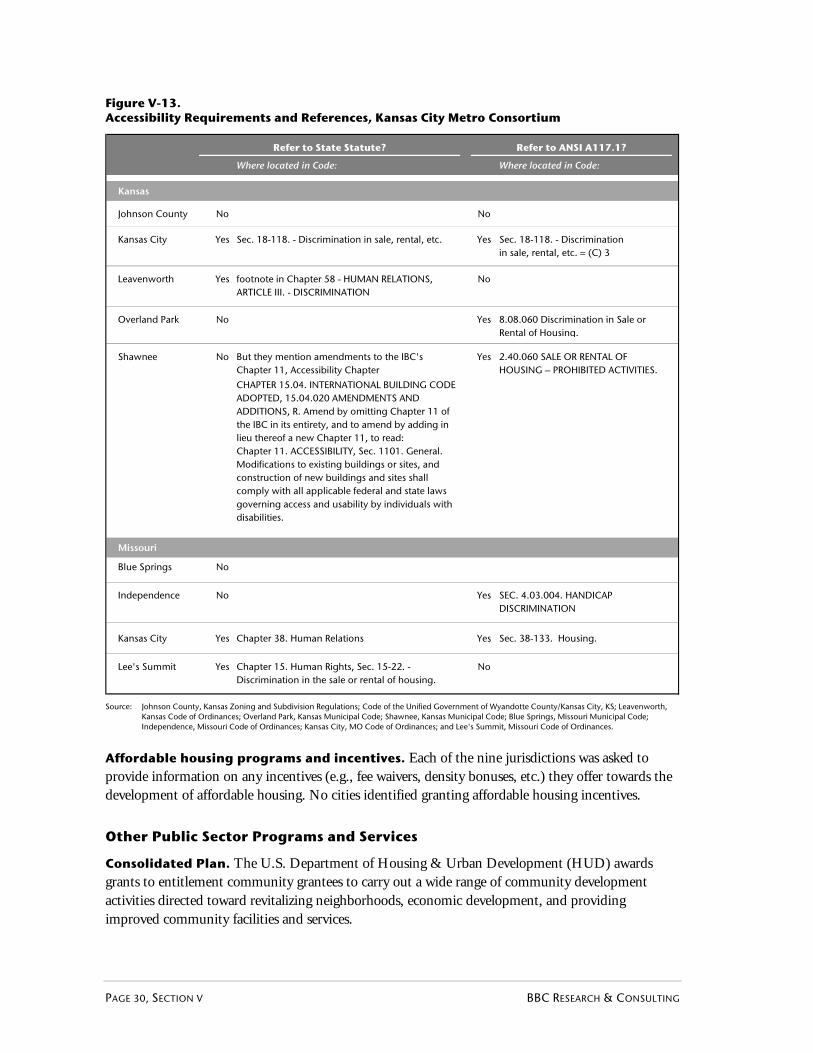
PAGE 30, SECTION V BBC RESEARCH & CONSULTING
Figure V-13. Accessibility Requirements and References, Kansas City Metro Consortium
Where located in Code: Where located in Code:
Kansas
Johnson County No No
Kansas City Yes Sec. 18-118. - Discrimination in sale, rental, etc. Yes Sec. 18-118. - Discrimination in sale, rental, etc. = (C) 3
Leavenworth Yes footnote in Chapter 58 - HUMAN RELATIONS, ARTICLE III. - DISCRIMINATION
No
Overland Park No Yes 8.08.060 Discrimination in Sale or Rental of Housing.
Shawnee No But they mention amendments to the IBC's Chapter 11, Accessibility Chapter
Yes 2.40.060 SALE OR RENTAL OF HOUSING – PROHIBITED ACTIVITIES.
CHAPTER 15.04. INTERNATIONAL BUILDING CODE ADOPTED, 15.04.020 AMENDMENTS AND ADDITIONS, R. Amend by omitting Chapter 11 of the IBC in its entirety, and to amend by adding in lieu thereof a new Chapter 11, to read: Chapter 11. ACCESSIBILITY, Sec. 1101. General. Modifications to existing buildings or sites, and construction of new buildings and sites shall comply with all applicable federal and state laws governing access and usability by individuals with disabilities.
Missouri
Blue Springs No
Independence No Yes SEC. 4.03.004. HANDICAP DISCRIMINATION
Kansas City Yes Chapter 38. Human Relations Yes Sec. 38-133. Housing.
Lee's Summit Yes Chapter 15. Human Rights, Sec. 15-22. - Discrimination in the sale or rental of housing.
No
Refer to State Statute? Refer to ANSI A117.1?
Source: Johnson County, Kansas Zoning and Subdivision Regulations; Code of the Unified Government of Wyandotte County/Kansas City, KS; Leavenworth, Kansas Code of Ordinances; Overland Park, Kansas Municipal Code; Shawnee, Kansas Municipal Code; Blue Springs, Missouri Municipal Code; Independence, Missouri Code of Ordinances; Kansas City, MO Code of Ordinances; and Lee's Summit, Missouri Code of Ordinances.
Affordable housing programs and incentives. Each of the nine jurisdictions was asked to provide information on any incentives (e.g., fee waivers, density bonuses, etc.) they offer towards the development of affordable housing. No cities identified granting affordable housing incentives.
Other Public Sector Programs and Services
Consolidated Plan. The U.S. Department of Housing & Urban Development (HUD) awards grants to entitlement community grantees to carry out a wide range of community development activities directed toward revitalizing neighborhoods, economic development, and providing improved community facilities and services.

BBC RESEARCH & CONSULTING SECTION V, PAGE 31
The following are the entitlement communities located in the Kansas City region and are required to complete a Consolidated Plan, annual Action Plans, annual yearend evaluation reports and an Analysis of Impediments to Fair Housing Choice:
Kansas City, KS
Leavenworth, Kansas
Overland Park, Kansas
Shawnee, Kansas
Johnson County, Kansas
Blue Springs, Missouri
Independence, Missouri
Kansas City, MO
Lee’s Summit, Missouri
Together these jurisdictions are entitled to approximately $23 million annually in federal grants.19 Typical activities and programs funded with the federal grants include housing rehabilitation and repair programs; accessibility improvements for persons with disabilities, including home modifications and sidewalk improvements; code enforcement; housing development projects; public facility improvements; tenant/landlord dispute resolution assistance; and public services. Additionally, each jurisdiction must certify that they will affirmatively further fair housing choice in their community.
Figure V-14. Entitlement Jurisdictions, Kansas City Metro Consortium
Entitlement Grants2010
AllocationsAnti-Displacement and Relocation Policy
Kansas
Johnson County CDBG, HOME $2,275,404 Yes, in CAPER 2009, none
Kansas City CDBG, HOME, ESG $3,764,218 Yes, in CAPER 2009, yes
Leavenworth CDBG $390,422 Yes, in Consolidated Plan 2009-10, none
Overland Park CDBG $705,790 Certify only 2009, none
Shawnee CDBG $248,832 Certify only 2010, none
Missouri
Blue Springs CDBG $248,345 Yes, in Consolidated Plan 2009, none
Independence CDBG, HOME $1,305,129 Yes, in CDBG application and Code 2009-10, none
Kansas City CDBG, HOME, ESG, HOPWA $13,688,010 Certify only 2009, none
Lee's Summit CDBG $340,946 Yes, in Consolidated Plan 2009, none
Recent Displacement Activity?
Source: The Kansas jurisdictions of Johnson County and the cities of Kansas City, Leavenworth, Overland Park and Shawnee, and the Missouri jurisdictions of Blue Springs, Independence, Kansas City and Lee’s Summit.
Anti-displacement and relocation policy. According the HUD, the Consolidated Plans’ citizen participation plan must set forth the jurisdiction's plans to minimize displacement of persons and to assist any persons displaced, specifying the types and levels of assistance the jurisdiction will make available (or require others to make available) to persons displaced, even if the jurisdiction expects no displacement to occur. Additionally, all grantees receiving CDBG funds must submit narrative information on any anti-displacement and relocation activities for projects that involved acquisition, rehabilitation or demolition of occupied real property.
19
The federal grants include the Community Development Block Grant, HOME Investment Partnerships, Emergency Shelter Grant and Housing Opportunities for Persons with AIDS.

PAGE 32, SECTION V BBC RESEARCH & CONSULTING
A review of the jurisdictions recent Consolidated Plans, Action Plans and Consolidated Annual Performance and Evaluation Reports (CAPER) found that six of the nine jurisdictions included some information on their anti-displacement and relocation policies and three jurisdictions did not include any information, as shown in the previous figure. Only one jurisdiction, Kansas City, KS, reported that families had to be relocated during a project using CDBG and HOME funds. According to the city, “The families were provided with notice and level relocation benefits. The specific compliance steps have depended on the fact that the family occupied the property and that there were no involuntary acquisitions.”
Mid America Regional Council and public transportation. The Mid-America Regional Council (MARC) is the metropolitan planning organization for the Kansas and Missouri Kansas City region. MARC is governed by a board of local elected officials and serves nine counties and 120 cities. Member counties include:
Johnson County, Kansas;
Leavenworth County, Kansas;
Miami County, Kansas;
Wyandotte County, Kansas;
Cass County, Missouri;
Clay County, Missouri;
Jackson County, Missouri;
Platte County, Missouri; and
Ray County, Missouri
MARC works to advance social, economic and environmental progress for the Kansas City region by promoting regional cooperation and by developing regional solutions. MARC develops regional plans for transportation, the environment, emergency response, etc. One of these plans, the Transportation Outlook 2040 Plan, describes how the region will manage, operate and invest in its multimodal transportation system over the next three decades. The plan was approved June 2010 and includes a chapter on Public Transportation and Human Services Transportation.
Public transit and human services (paratransit) transportation support the plan’s policy goals covering issues important to the elderly, persons with disabilities and low income population, such as accessibility, economic vitality, and safety and security, to name a few. Additionally, the Public Transit and Human Services Transportation chapter includes an Action Plan that supports the strategies of the chapter. The following Action Plan items are particularly important to the elderly, persons with disabilities and low income persons:
1. Support the maintenance and operations of existing services for the elderly, individuals with disabilities and low income persons. These efforts may include but are not limited to the following actions:
a) MARC will encourage the maintenance and sustainability of existing public transit and human-services transportation services.
b) MARC will encourage the procurement of equipment eligible under federal guidance to support the maintenance and operations of existing fleets.

BBC RESEARCH & CONSULTING SECTION V, PAGE 33
2. Pursue enhanced usability of existing services:
a) MARC will partner will local transit agencies to develop regional service standards, including transit user information that supports the image and use of the regional transit network as one seamless system.
b) MARC will work with transit agencies and alternative transportation partners to identify opportunities for infrastructure enhancements that would improve the connections between public transportation services and pedestrian and bicycle activities.
c) MARC will work with human-service transportation providers, public transit providers to identify opportunities to coordinate human-services transportation users and providers with existing mainstream fixed-route service.
3. Promote the expansion of services for the elderly, and individuals with disabilities or low income persons.
a) MARC will encourage the procurement of equipment eligible under federal guidance to support expansion of existing fleets.
b) MARC will encourage the expansion of existing public transit and human-services transportation services and implementation of new services compatible with existing state, regional or local plans.
4. Promote transit-supportive development from the regional urban form level to the site plan level.
a) MARC will work in partnership with public transit and human-service transportation providers and local planning agencies to bring major projects to the attention of service providers and ensure that local planning agencies consider transit in their review of local plans.
Public transportation. According to the Transportation Outlook 2040 Plan, regional public transportation services include those from the following organizations:
Kansas City Area Transportation Authority (KCATA)—The KCATA Metro bus system provides public transportation for Jackson County and portions of Clay, Platte and Wyandotte counties. KCATA also operates service into Johnson County. In addition, the KCATA provides the Share-A-Fare program that serves people who need door-to-door transportation because a disability prevents them from independently using fixed-route bus service.
Unified Government Transit—The Unified Government Transit was created to extend public transportation into areas of Wyandotte County not covered by contracted KCATA service. They offer a fixed-route service and operate a Dial-a-Ride paratransit system, Senior Group Transportation and Aging transit services.
Johnson County Transit—Johnson County Transit provides fixed-route commuter service (The JO) and the Special Edition for people over 60 and those with disabilities.

PAGE 34, SECTION V BBC RESEARCH & CONSULTING
The plan also includes an analysis of bus service coverage for the region and concludes that the best coverage exists south of the Missouri River in Kansas City, MO. However, there is some peak hour service available in many areas of the region. Off-peak and weekend service is particularly limited outside of Kansas City, MO.
Human services transportation (Paratransit) services. The Transportation Outlook 2040 Plan also provides a description of the major paratransit agencies serving the Kansas City region. As required by the American Disabilities Act (ADA), each of the three fixed-route providers is required to provide ADA complementary paratransit service with origins and destinations within 3/4 mile of either side of any bus route, excluding commuter service, for any person with a disability. The Transportation Outlook 2040 Plan includes a list of significant paratransit/special needs/human-service transportation systems in the area in addition to the following programs:
Share-a-Fare, a service administered by KCATA, which primarily provides service for elderly and disabled persons in Clay, Platte and Jackson counties in Missouri;
MARC’s Aging Department, which contracts with several providers for transportation service for elderly and disabled persons, as well as meal delivery, in Cass, Clay, Jackson, Platte and Ray counties in Missouri;
Unified Government Transit Dial-a-Ride, service for persons with disabilities in Wyandotte County, Kansas.;
Jackson County Board of Services, which provides transportation to disabled persons in Jackson County, Kansas;
The JO—Special Edition, which provides service to elderly and disabled persons in Johnson County, Kansas;
OATS, Inc., a private, not-for-profit corporation offering door-to-door transportation to the general public with an emphasis on senior citizens and the disabled in Platte, Clay, Jackson, and Cass counties in the MARC region;
Olathe Taxi Coupon program (Kansas County) — provides contract-based services to senior and disabled low income residents;
Leavenworth Council on Aging; and
Independence Missouri Dial-a-Ride.

SECTION VI. Fair Housing Activities, Impediments and FHAP

BBC RESEARCH & CONSULTING SECTION VI, PAGE 1
SECTION VI. Fair Housing Activities, Impediments and FHAP
This section discusses the fair housing impediments identified through the research conducted for the Kansas City regional Analysis of Impediments to Fair Housing Choice (AI). It begins with an overview of the fair housing activities in the region and concludes with a recommended Fair Housing Action Plan (FHAP).
Fair Housing Activities
Each jurisdiction covered in this study approaches fair housing enforcement, education and outreach and a bit differently.
Johnson County belongs to the Johnson County Community Housing Resource Board (CHRB), which updates the fair housing brochures distributed to local governments and county multi-service centers and sponsors an educational seminar on fair housing each fall. The county has not funded organizations to conduct education and outreach or testing in the past because none have applied for funding for such activities.
Kansas City, Kansas provides funding to the Human Relations Commission of $10,000 annually for fair housing activities. The Human Relations Division handles complaints and is trained in the mediation process; however, the Human Relations Commission has no statutory authority to act on the complaints.
Most of the commission’s activities involve fair housing education and outreach, including having fair housing information available at the Ethnic Festival, the Juneteenth Festival and the Cinco de Mayo Festival. The commission also purchased 1,500 back to school kits for the school district which contained fair housing outreach information and placed ads in the city’s baseball season program.
Leavenworth contracts with Catholic Charities of NE Kansas to handle complaints, which are usually landlord/tenant problems. The organization handles mediation of all complaints and does some education and outreach. The city does not hold fair housing activities directly.
Overland Park. The city’s Fair Housing Committee investigates fair housing complaints that are filed with the City Clerk and are responsible for conducting hearings on these complaints. Regular meetings are not held; however, they are called whenever a complaint is filed with the city. The public is welcome.
Shawnee. The City of Shawnee designates April as Fair Housing Month by a proclamation of the City Council. The city has included an article in the City Line newsletter regarding fair housing laws. The newsletter is mailed to all residential structures in the City. Pamphlets from the Department of Housing and Urban Development are available at the front counter of the Planning Department, as well as on display in the City Clerk and Municipal Court area in City Hall. The pamphlets are available in both Spanish and English.

PAGE 2, SECTION VI BBC RESEARCH & CONSULTING
Blue Springs. Blue Springs passed a fair housing ordinance (#2115) in 1991, which contains protections similar to the Federal Fair Housing Act. The local ordinance is enforced by the City Attorney. The city may also refer a complainant to HUD to file under the federal act.
Independence. The city sponsors a regional Fair Housing Summit to renew local awareness concerning fair housing issues. This summit is not done annually, but on an as-needed basis. The city also partners with the Human Relations Commission, LINC and other community interests to sponsor an annual Independence Heritage Festival, which focuses on promoting acceptance of diversity in every aspect of community life, including housing and accessibility related matters.
Lee’s Summit has a Human Relations Committee which enforces Chapter 15 of the city’s Code of Ordinances. The Committee is also charged with implementing and coordinating fair housing programs and bringing issues to the attention of the City Council and advising and consulting on matters involving discrimination.
The city does not fund outside organizations to conduct fair housing outreach and education, testing or complaint-taking activities.
Kansas City, Missouri has a Civil Rights Division dedicated to enforcing the city’s Civil Rights Ordinance, which protects citizens against housing discrimination. The ordinance offers the same protections as the federal Fair Housing Act plus sexual orientation, marital status and gender identity.
The city is eligible for funding from HUD as a Fair Housing Assistance Program organization. In this capacity, the city conducts fair housing training sessions for housing professionals, tenant groups, community groups, neighborhood organizations and others. The city also produces fair housing brochures and literature for citizens and participates in events each year where fair housing information is distributed.
The city also funds local organizations to conduct fair housing testing of design and construction of multifamily complexes.1
Kansas City, Missouri regularly monitors fair housing trends that are evident through inquiries to and complaints with the Civil Rights Division. The city has goals to conduct more testing of apartment buildings’ compliance with ADA and to begin testing for discrimination based on familial status, as well as extending fair housing education and outreach to include more information on familial status.
Fair housing information on websites. Nearly all of the jurisdictions included in the AI have fair housing information on their websites; however, the amount and quality of information on the websites varies considerably. As discussed in the Fair Housing Action Plan below, this variability creates an opportunity to improve the quality and consistency of fair housing information in the region.
1 The city funded Legal Aid of Western Missouri and The Whole Person at $15,000 per organization for testing activities.

BBC RESEARCH & CONSULTING SECTION VI, PAGE 3
Fair Housing Impediments
The research methodology conducted for this AI consisted of the following:
Community and housing profile. In this task, BBC analyzed current demographics and housing affordability, which included an examination of concentrations of households by race, ethnicity, low incomes, disability and single parent status. For the affordability analysis, we examined how rental and homeownership affordability varied by community.
Private market, fair housing activities and complaint data review. In this task, data on mortgage lending approvals, subprime mortgages (from Home Mortgage Disclosure Act or HMDA data), compliance with the Community Reinvestment Act (CRA), recent legal cases and fair housing complaints were analyzed to detect potential discriminatory patterns.
Policy review and analysis. For every city participating in the study, BBC reviewed city zoning, land use and planning and housing policies pertaining to residential housing for barriers to fair housing and fair housing concerns.
Community input. Resident and stakeholder input into the AI was received through key person interviews, an online and mail survey of real estate professionals and nonprofits, and four community forums held on March 10, 2011.
The following impediments were indentified through this research. The impediments are organized into regional impediments and city-specific impediments. These designations suggest if the remedies to address the impediments should be addresses regionally or by a specific city.
Impediments that Need to be Addressed Regionally
Regional Impediment No. 1. There is no coordinated effort to mitigate fair housing barriers and raise awareness of fair housing in the region. Each community in the region addresses fair housing education, outreach and enforcement independently and in some cases, differently. Some communities have a Human Rights Commission that oversees fair housing complaints; some refer residents seeking fair housing information to their City Clerk; two communities have the authority to enforce the Federal Fair Housing Act; some communities refer residents to HUD. A resident’s options differ depending on which community in which they reside.
In the spirit of creating a unified government system, there should be more coordination among communities and, ideally, one umbrella organization that is conducting fair housing education and outreach activities regionally.
Regional Impediment No. 2. Information about fair housing is difficult to find and can be confusing. Residents in the public forums conducted for this study said they did not know how to file a complaint or where to go to seek out fair housing information. Social service and housing providers who completed a fair housing survey for this study said most of their clients “do nothing” when faced with housing discrimination. A review of the jurisdictions’ websites found inconsistency in how fair housing information was communicated.
It should be noted, however, that in the fair housing survey they completed, real estate professionals identified few barriers related to lack of knowledge of fair housing issues in the real estate community.

PAGE 4, SECTION VI BBC RESEARCH & CONSULTING
Regional Impediment No. 3. Kansas City, MO contains high concentrations of minority and low income households. Kansas City, MO houses the majority of the region’s minority and low income populations: the city held 60 percent of the region’s African Americans and 46 percent of the region’s households earning less than $25,000 per year. This compares to 33 percent of the region’s population overall.
The region needs to provide more opportunities for racial and ethnic minorities and low income households to live in areas other than Kansas City, MO if they choose to.
Regional Impediment No. 4. Kansas City, MO has a disproportionate number of low rent units. An examination of the geographic location of the region’s public housing units and other HUD subsidized housing shows a significant concentration of units in Kansas City, MO (see Figure V-3 in Section V). More than half (51 percent) of all of the region’s public housing units and vouchers are provided by the Housing Authority of Kansas City, MO.
The region needs to provide more opportunities for very low income renters to live in areas other than Kansas City, MO if they choose to.
Regional Impediment No. 5. There is reportedly a shortage of accessible housing units. Attendees at one of the public forums held for this study mentioned a severe lack of handicapped accessible housing in the region. They also mentioned the discontinuation of KCMO’s barrier removal program as having a negative effect on persons with disabilities.
Impediments to Address City by City
Local Impediment No. 1. Residents experience discrimination. Complaint data and a survey of stakeholders provide evidence that residents in the region experience housing discrimination. As shown in the following table, all cities have had a share of the 577 complaints filed in the past 5 years (although in some cases, city officials were unaware that complaints had been filed).
Figure VI-2. Share and Nature of Complaint by City, August 2005 through October 2010
Kansas City MSA 577
Kansas
Johnson County * 16% 93 48% 25% 8% 7% 2% 10%
Kansas City 15% 87 49% 24% 8% 6% 2% 10%
Leavenworth 1% 6 22% 33% 11% 22% 0% 11%
Overland Park 7% 40 35% 42% 13% 4% 4% 2%
Shawnee 3% 17 35% 50% 5% 0% 5% 5%
Missouri
Kansas City 60% 346 37% 28% 11% 5% 7% 12%
Independence 10% 58 33% 47% 5% 4% 5% 5%
Blue Springs 2% 12 47% 33% 0% 13% 7% 0%
Lee's Summit 2% 11 56% 25% 0% 13% 0% 6%
Study Area Race Disability Other
10%
Gender
5%9%
FamilyStatus
6%
RetaliationNumber of Complaints
31%
Complaints
39%
Share of
Note: * Excluding Overland Park and Shawnee.
Source: HUD’s Kansas City Kansas Regional Office of Fair Housing and Equal Opportunity (FHEO).

BBC RESEARCH & CONSULTING SECTION VI, PAGE 5
The most common reasons for discrimination based on complaints and stakeholder surveys are race/ethnicity and disability. Placing tenants in the least desirable units, refusing to make reasonable accommodations and steering are the most common fair housing violations, according to stakeholders. Many stakeholders also cited “rent to own scams” as prevalent in the region.
Local Impediment No. 2. African Americans and Hispanics have much higher loan denial rates than Whites and Non-Hispanics. In 2009, there were approximately 117,700 mortgage loan applications made in the Kansas City MSA. For the region overall, 64 percent of loans were approved and 16 percent denied (the others were withdrawn by the applicants, closed for incompleteness, etc).
Loan denial rates were much higher for African American and Hispanic applicants across all communities. Specifically,
In Johnson County, African American applicant mortgage loan denials were 8 percentage points higher than White applicants’. Hispanic applicant mortgage loan denials were 5 percentage points higher than non-Hispanic applicants’.
In Kansas City, KS, African American applicant mortgage loan denials were 14 percentage points higher than White applicants’. Hispanic applicant mortgage loan denials were also 14 percentage points higher than non-Hispanic applicants’.
In Leavenworth, African American applicant mortgage loan denials were 8 percentage points higher than White applicants’. Hispanic applicant mortgage loan denials were 4 percentage points higher than non-Hispanic applicants’.
In Overland Park, African American applicant mortgage loan denials were 7 percentage points higher than White applicants’. Hispanic applicant mortgage loan denials were 5 percentage points higher than non-Hispanic applicants’.
In Shawnee, African American applicant mortgage loan denials were 6 percentage points higher than White applicants’. Hispanic applicant mortgage loan denials were 11 percentage points higher than non-Hispanic applicants’.
In Blue Springs, African American applicant mortgage loan denials were 7 percentage points higher than White applicants’. Hispanic applicant mortgage loan denials were 9 percentage points higher than non-Hispanic applicants’.
In Independence, African American applicant mortgage loan denials were 8 percentage points higher than White applicants’. Hispanic applicant mortgage loan denials were 7 percentage points higher than non-Hispanic applicants’.
In Independence, African American applicant mortgage loan denials were 8 percentage points higher than White applicants’. Hispanic applicant mortgage loan denials were 9 percentage points higher than non-Hispanic applicants’.

PAGE 6, SECTION VI BBC RESEARCH & CONSULTING
In Kansas City, MO, African American applicant mortgage loan denials were 19 percentage points higher than White applicants’. Hispanic applicant mortgage loan denials were 10 percentage points higher than non-Hispanic applicants’. In addition, Kansas City, MO is the only community where the above average denial rates and presence of African Americans appear to be closely related.
In addition, 20 percent of respondents to the real estate survey conducted for this study indicated that predatory lending practices are a serious problem in the region.
Local Impediment No. 3. Jurisdictions need to improve some aspects of their public sector development and housing practices. Section V of this AI contains a comprehensive review of the participating jurisdictions’ land use and housing policies, including those of the public housing authorities. Although the review did not find egregious violations of the Federal Fair Housing Act, it did identify areas that may cause barriers to affordable housing development. These include:
No jurisdictions provide formal incentives to encourage the development of affordable and mixed-income housing.
Not all housing authorities allow residents to apply for public housing units and/or Section 8 vouchers by mailing in an application or completing an application online. Such policies can prevent persons with disabilities from fairly accessing housing.
Three public housing authorities have fewer than 5 percent of their public housing units that are accessible.
Development fees in Johnson County, and, to a lesser extent, Leavenworth and Blue Springs, are high relative to other jurisdictions.
The Consolidated Plans of Overland Park, Shawnee and Kansas City, MO do not contain the cities’ anti-displacement and relocation policies.
Shawnee requires a special permit for group homes (all of the other jurisdictions permit by right).
Local Impediment No. 4. In all but one city, residents have 180 days or less to file complaints. Alleged victims have one year from the date of discrimination to file a fair housing complaint with HUD. In all but one of the jurisdictional ordinances (Blue Springs, which has no time limit) the period is much shorter, ranging from 60 to 180 days. It has been argued at the federal level that HUD’s 1 year statute of limitation is too short to allow identification of certain fair housing violations, including predatory lending activities (e.g., some very high cost loans offer teaser rates during the first year and then reset after one year).
During the public input process, many participants stated that the first thing they would do if faced with discrimination is “move/find another unit” and worry about filing a complaint later. A 60 day window during which to file a complaint may not allow alleged victims enough time to file a complaint if they are unaware who to contact and are seeking new housing after experiencing discrimination. In addition, a short filing window does not allow for the detection of many fair lending violations.

BBC RESEARCH & CONSULTING SECTION VI, PAGE 7
All of the cities covered in this AI should extend time period for which residents can file fair housing complaints to at least 1 year.
Fair Housing Action Plan
Regional Action Items
Regional Action Item No. 1. Improve the coordination of fair housing testing, enforcement and complaint-taking organizations in the region.
Action Item Subtask—A. All organizations involved in fair housing activities should meet regularly to share information, discuss fair housing trends and coordinate on fair housing outreach and education activities.
Action Item Subtask—B. We also recommend that the region form and fund a regional fair housing education and outreach organization. This could be an existing organization or a new organization formed specifically for this purpose.
The activities this recommended organization would engage in include:
Website
i. The organization should maintain a central regional website with basic fair housing information, training course schedules, fair housing resources and events, transparent information about how each of the jurisdictions investigates and enforces fair housing, local fair housing contacts for each jurisdiction and complaint forms.
ii. The website should also be the central point for a housing accessibility registry that provides information about accessible, affordable housing opportunities in the region and allows residents seeking accessible housing to complete an inquiry form.
iii. In addition to providing basic information about fair housing the website should answer tricky questions like: Can renters be forced to move when their rental complex is being foreclosed upon? Do their rental agreements have to be honored?
iv. The website should also contain a standard lease agreement so that tenants could see what a fair lease agreement looks like when they are apartment hunting.
v. All information should be in English and Spanish
Fair Housing Activities
This organization should also be the lead organization on fair housing activities for the region. It should coordinate fair housing month events, work with local organizations to publicize their free fair housing training opportunities (e.g., those offered by the Kansas City Human Relations Department 1), offer technical assistance to nonprofits whose clients have fair housing issues, potentially conduct fair housing testing, be the lead body for a regular regional housing summit or conference and coordinate funding of the enhanced SocialServe.com service.

PAGE 8, SECTION VI BBC RESEARCH & CONSULTING
Ideas for education and outreach activities that were contributed by attendees at the public forums include:
vi. Placing public service announcements (PSAs) about fair housing rights and good lending practices in For Rent magazines;
vii. Holding financial literacy and fair housing training after ESL classes, as part of diversity training classes;
viii. Improving the fair housing information on 211 and 311 sites (e.g., hotlines available to residents for information and referral services).
The organization should be funded through annual contributions from the jurisdictions from CDBG or General Funds, grants from HUD and potentially contributions by banks to meet their CRA requirements and regional public housing authorities.
Regional Action Item No. 2. Disperse affordable housing opportunities regionally. As shown by Figure V-3, public housing and HUD subsidized units are heavily concentrated in Kansas City, MO.
The region needs to work cooperatively to provide more affordable housing opportunities—particularly for very low income renters—outside of Kansas City, MO and, to a lesser extent, Kansas City, KS.
As the housing market gains strength, all jurisdictions should focus on including mixed-income homeownership and affordable rental housing into newly developed housing. Areas where affordable housing is lacking—particularly on the western side of the region—should actively pursue Section 202, Section 108 and Low Income Housing Tax Credit developments. Providing a mix of residential products and building uses is consistent with the jurisdictions’ planning visions, as articulated in their Comprehensive Plans.
The region’s least affordable cities, including Overland Park, Lee’s Summit, Shawnee and Johnson County must provide incentives—fee waivers, streamlined development processes, land acquisition—for developers to integrate affordable units, particularly affordable rental units, into market rate housing. At the time this AI was prepared, none of the jurisdictions had formal programs to incentivize developers to include affordable and mixed-income housing into their developments.
Action Item Subtask—C. Incentives should be offered and encouraged in the region’s least affordable cities, especially for very affordable rental units, to encourage balanced housing communities in all jurisdictions.
Regional Action Item No. 3. Educate residents about personal finance and work with lenders to mitigate loan denial disparities. The region needs to raise its “housing literacy,” to both build better credit for minorities who are denied loans at much higher rates than whites and prevent residents from being taken advantage of by scams.

BBC RESEARCH & CONSULTING SECTION VI, PAGE 9
Action Item Subtask—D. The organization recommended in Action Item No. 1 could be the clearinghouse for fair lending information, including examples of scams and what residents should avoid. It could also coordinate and publicize regional efforts of homeownership counseling and foreclosure assistance.
Regional Action Item No. 4. Evaluate the demand for and increase accessible housing units. The jurisdictions in the region should review the adequacy of their current requirements for accessible units. If after consulting with service providers and surveying people with disabilities about how well their homes meet their accessibility needs, jurisdictions may want to consider raising the required percentage of accessible units in new construction and reestablishing or developing programs that fund accessibility improvements to residents’ homes.
In addition, the region should create and maintain a list of providers of accessible rental units and provide this list to nonprofits like The Whole Person. The jurisdictions may also want to jointly sponsor an event like an “accessibility fair” where residents who have questions about accessibility improvements learn about how these improvements can be made and the reasonable cost range for such repairs, as well as what the repairs should cost.
Local Action Items
Local Action Items No. 1. Improve and make more uniform fair housing information on jurisdictional websites.
Action Item Subtask—E. Improve fair housing information on websites.
i. The State of Missouri Commission on Human Rights has an excellent website dedicated to filing a complaint. The website is easily found through a Google search using “housing discrimination Missouri.” All Missouri cities should have a link to the State’s Commission on Human Rights website, http://www.labor.mo.gov/mohumanrights/File_Complaint/
In addition, the following changes should be made to the jurisdictions’ and state websites:
ii. Blue Springs should add a “What should I do if I feel I have been discriminated against in finding housing?” question with a link to the Missouri Commission on Human Rights to its FAQ on its website of http://www.bluespringsgov.com/index.aspx?NID=189. The city does not have any source of fair housing information easily accessible on its website.
iii. Independence has a website about fair housing, “Fair Housing – General Information”. It would be useful if the website linked to the State’s Commission on Human Rights website (see above), in addition to HUD’s website, as the state’s website may be easier to understand by residents not familiar with fair housing.
iv. Lee’s Summit has fair housing information on the webpage of its Human Relations Commission, which includes an easy-to-complete online form that residents can send if they need more information on housing discrimination. This webpage is accessed through the Board and Commissions link. Residents who do not know that such a commission exists will not think to look at this link for fair housing information. The city should add a “What should I do if I feel I have been discriminated against in finding housing?” question with a link to its Human Relations Commission webpage to its FAQ list.

PAGE 10, SECTION VI BBC RESEARCH & CONSULTING
v. Kansas City, Missouri has a website dedicated to civil rights and fair housing enforcement, which includes the ability to file a complaint online (http://www.kcmo.org/CKCMO/Depts/ CityManagersOffice/HumanRelationsDivision/CivilRightsEnforcementSection/index.htm). The process covers violations that fall under the city’s ordinance only. The city should also add Fair Housing in its Housing Information list on http://www.kcmo.org/CKCMO/Residents/index.htm
vi. Missouri’s Housing Development Commission does not have a fair housing link on its home page http://www.mhdc.com/). It should have a link to the Commission on Human Rights.
vii. Kansas City, Kansas. We were unable to find information about filing a complaint or a fair housing contact on the following website( http://www.wycokck.org/Internetdept.aspx?id= 302&menu_id=1452&banner=15284). The city needs to have a webpage dedicated to fair housing information and resources, including how to file a fair housing complaint.
viii. Johnson County has some fair housing information on its community development webpage, but the content could be improved and should also appear on the Health and Human Services webpage. Fair housing information should be added to its Housing link at http://hsa.jocogov.org/housing/housing.shtml. “Housing Discrimination” should also appear in the A-Z index on the county’s website. A good model from a county similar to Johnson in Colorado can be found at http://www.douglas.co.us/CDBG/Fair_Housing.html
ix. Leavenworth should add a “What should I do if I feel I have been discriminated against in finding housing?” question with a link to the Kansas Human Rights Commission and HUD’s regional fair housing offices to its FAQ on its website. The city does not have any source of fair housing information easily accessible on its website.
x. Overland Park should also add a “What should I do if I feel I have been discriminated against in finding housing?” question with a link to the Kansas Human Rights Commission and HUD’s regional fair housing offices to its FAQ on its website. The city does not have any source of fair housing information easily accessible on its website.
In addition, the city should have more direct information about its local fair housing ordinance, how to file a complaint with the city and a link to its ordnance on the Fair Housing Commission webpage at http://www.opkansas.org/Boards-and-Commissions/Detail/Boards-and-Commissions/Fair-Housing-Committee
xi. Shawnee has very little fair housing information on its website. Searches of “fair housing” and “housing discrimination” turn up a list of interesting reports and statistics, but nothing to assist a resident who feels they have been discriminated against. The city needs to have a webpage dedicated to fair housing information and resources, including how to file a fair housing complaint at the state and federal level.
xii. In addition, there should be an effort to improve the visibility and the information on the website of the Kansas Human Rights Commission. Although the website is managed at the state level, it is a resource for fair housing information for small communities in the state. It is important that the state website is visible and contains helpful information that may not appear on local websites.

BBC RESEARCH & CONSULTING SECTION VI, PAGE 11
Google searches for “fair housing Kansas” or “housing discrimination Kansas” do not lead to the Human Rights Commission page; instead, the Kansas City Housing Corporation is listed. We recommend that The Kansas Human Rights Commission needs to raise its visibility on search engines like Google.
The Kansas Human Rights Commission webpage has useful information on the state’s law and links to various forms, yet the process for filing a complaint is not transparent. For example, the website reads:
“KHRC's intake department is located in the Topeka office and is responsible for drafting complaints filed with the agency. A complaint may be filed personally or by attorney. An individual may write, telephone or come in to one of the Kansas Human Rights Commission's offices to begin the filing process. If the complaint falls within the Commission's jurisdiction, a formal complaint may be submitted. Intake workers are available to assist in drafting a complaint based on information provided by the complainant. The intake department also provides inquirers with referrals to other agencies for issues outside of KHRC's jurisdiction. The complaint must be signed and notarized before it can be officially filed with the Commission. A complaint alleging racial or other profiling is not required to be notarized.”
We recommend that:
The address and phone number to call to file a complaint should be visible and easy to find.
Complaints should be able to be filed online without a required notarized signature, which can be a barrier to filing a complaint, especially for persons with disabilities.
All jurisdictions located in Kansas should have links to the Kansas Human Rights Commission website at http://www.khrc.net/complaint.html, especially once these improvements have been made.
Local Action Item No. 2. The statute of limitations for filing fair housing complaints in local ordinances should be extended. Alleged victims have one year from the date of discrimination to file a fair housing complaint with HUD. In almost all of the jurisdictional ordinances the period is much shorter. Action Item Subtask—F. We recommend that the time period for filing a complaint is extended to at least 1 year if not longer.
Local Action Item No. 3. Jurisdictions need to improve some aspects of their zoning and land use regulations. Section V of this AI contains a comprehensive review of the participating jurisdictions’ land use and housing policies, including those of the public housing authorities. Although the review did not find egregious violations of the Federal Fair Housing Act, it did identify areas that may cause barriers to affordable housing development.
Action Item Subtask—G. To improve their zoning and land use regulations, the jurisdictions should:
i. The region’s most expensive jurisdictions, where affordable rental housing is lacking, should provide formal incentives to encourage the development of affordable and mixed-income housing. Examples of incentives that are used in other jurisdictions to encourage affordable housing development include:
Fast track development approval process for residential developments that incorporate a certain percentage (10 to 15 percent is common) of affordable rental or for sale units into their development;

PAGE 12, SECTION VI BBC RESEARCH & CONSULTING
Development fee waivers for affordable units;
Donation of underutilized or vacant land for affordable housing and mixed-income developments. This is sometimes done with obsolete and closed school sites, in which case school district employees are offered the first opportunity to occupy the newly developed units.
Density bonuses, reduced parking standards and flexibility in setbacks and site design for developments that incorporate a certain percentage of affordable units.
ii. All housing authorities should allow residents to apply for public housing units and/or Section 8 vouchers by mailing in an application or completing an application online. This ensures fair access to publicly provided housing regardless of disability.
iii. Three public housing authorities have fewer than 5 percent of their public housing units that are accessible and need to work to reach the 5 percent accessibility standard.
iv. Development fees in Johnson County, and, to a lesser extent, Leavenworth and Blue Springs, are high relative to other jurisdictions. These communities should provide fee waivers for construction of affordable housing. The fee waivers should be based on a sliding scale with rental units affordable to 50 percent of the MFI and less receiving the largest amount of waiver.
v. The Consolidated Plans of Overland Park, Shawnee and Kansas City, MO do not contain the cities’ anti-displacement and relocation policies, and they should.
vi. Shawnee requires a special permit for group homes (all of the other jurisdictions permit by right). Shawnee should permit group homes by right.
vii. In order to be more transparent and forthcoming concerning a jurisdictions’ zoning regulations of group homes, it is recommended jurisdictions include their definition of group home, which is similar to their respective State Statutes, in an easy to find and easy to understand manner. A good example of this is to include this type of group home in their definition of “family” or “household,” or however the jurisdiction determines who occupies the dwelling units. Both Kansas City, KS and Kansas City, MO do a good job of this by including this type of group home in their definitions of family/household.

APPENDIX A. Public Meeting Materials

Th ursday, March 10, 20112:00 PM to 3:30 PMSoutheast Community Center4201 E. 63rd StreetKansas City, MO 64130tel: (816) 513-0632
Date:Time:
Address:
Kansas City Region Fair Housing StudyKansas City Region Fair Housing StudyIf it has always been easy for you to fi nd an apartment to rent or a home to buy, you may not have thought much (or at all) about housing discrimination. But for some people, housing discrimination and other barriers to housing choice are a very real problem.Th e governments in the Kansas City Region are currently conducting a study to identify barriers to housing choice, including discriminatory activities. Th e study will investigate many diff erent types of impediments to housing choice and develop a plan for the Region to address the identifi ed barriers.
Ms. Heidi Aggeler, Managing DirectorBBC Research & Consulting
If you have questions about the forums, or need special accommodations for the meetings, please contact:
Other questions or needs?Other questions or needs?
Th ursday, March 10, 20116:00 PM to 7:30 PMHilton Garden Inn520 Minnesota AvenueEisenhower RoomKansas City, KS 66101tel: (913) 342-7900
Date:Time:
Address:
Th ursday March 10, 20116:00 PM to 7:30 PMTruman Memorial BuildingPresidential Hall A416 W. MapleIndependence, MO 64050tel: (816) 325-7843
Date:Time:
Address:
We need your input intoWe need your input intothe study! Please join us at the study! Please join us at one of the meetings listed one of the meetings listed on the right. on the right.
Th ursday, March 10, 20112:00 PM to 3:30 PMMyron E Scarfe Building8500 AntiochOverland Park, KS 66212tel: (913) 895-6346
Date:Time:
Address:
Light refreshments will be provided at all meetings.

Kans
as C
ity R
egio
n
Pd b
yg
Anal
ysis
of Im
pedi
men
ts to
Fair
Hous
ing C
hoice
BB
C R
esea
rch
& C
on
sult
ing
3773
Ch
erry
Cre
ek N
ort
h D
rive
, Su
ite
850
Den
ver,
Co
lora
do
802
09p
ho
ne:
303
321
2547
fax:
303
399
0448
Pres
ente
d by:
Com
mun
ity F
orum
sM
arch
10
201
1p
ho
ne:
303
.321
.254
7 f
ax:
303.
399.
044
8ag
gel
er@
bb
cres
earc
h.c
om
w
ww
.bb
cres
earc
h.c
om
Mar
ch 1
0, 2
011

Td
’ A
dTo
day’
s A
gend
a
Fa
ir h
ousi
ng A
I bac
kgro
und
Fa
ir h
ousi
ng A
I bac
kgro
und
In
trod
ucti
ons
D
iscu
ssio
n of
fair
hou
sing
nee
ds
2

Wh
t i
Fi
Hi
?W
hat
is F
air
Ho
usin
g?
Fair
Ho
usin
g A
ct (F
HA
):
Ti
tle V
III o
f th
e C
ivil
Rig
hts
Act
of
19
68
, pro
hibi
ts
disc
rim
inat
ion
in t
he s
ale
ren
tal a
nd fi
nanc
ing
of d
wel
lings
di
scri
min
atio
n in
the
sal
e, r
enta
l and
fina
ncin
g of
dw
ellin
gs
base
d on
rac
e, c
olor
, rel
igio
n, s
ex a
nd n
atio
nal o
rigi
n.
A
men
ded
in 1
98
8 t
o pr
ohib
it di
scri
min
atio
n on
the
bas
is o
f
Am
ende
d in
19
88
to
proh
ibit
disc
rim
inat
ion
on t
he b
asis
of
disa
bilit
y or
fam
ilial
sta
tus.
Exem
ptio
ns f
rom
FH
A:
Exem
ptio
ns f
rom
FH
A:
H
ousi
ng d
evel
opm
ents
for
seni
ors,
hou
sing
str
ictly
res
erve
d fo
r m
embe
rs o
f re
ligio
us o
rgan
izat
ions
or
priv
ate
club
s,
for
mem
bers
of
relig
ious
org
aniz
atio
ns o
r pr
ivat
e cl
ubs,
m
ultif
amily
hou
sing
of
four
uni
ts o
r le
ss w
ith t
he o
wne
r oc
cupy
ing
one
unit.
3

It
dti
Intr
odu
ctio
ns
Yo
ur n
ame,
if y
ou o
wn
or r
ent?
H
ow lo
ng h
ave
you
lived
in y
our
curr
ent
hom
e?
How
long
hav
e yo
u liv
ed in
you
r cu
rren
t ho
me?
W
hat
wou
ld y
ou
chan
ge a
bout
you
r ho
usin
g if
you
coul
d?
4

Fidi
P
l t
Li
Find
ing
a P
lace
to
Liv
e
W
hat
was
the
mai
n re
ason
you
cho
se y
our
curr
ent
hom
e?
W
hat
did
you
com
prom
ise
on?
W
hat
chal
leng
es d
id y
ou e
ncou
nter
—an
d g
yho
w d
id y
ou o
verc
ome
them
?
H
ave
you
ever
felt
you
wer
e tr
eate
d un
fair
ly
yy
yin
find
ing
hous
ing?
5

Fi
Hi
Oi
iFa
ir H
ous
ing
Opi
nio
ns
S
cena
rio
1.A
sin
gle
mot
her
of a
13
yea
r ol
d m
ade
an
appo
intm
ent
to lo
ok a
t an
apa
rtm
ent
for
rent
. Th
e la
ndlo
rd
met
her
and
her
chi
ld a
t th
e ap
artm
ent.
Whe
n he
dis
cove
red
that
she
had
a c
hild
, he
told
her
he
does
n’t
allo
w c
hild
ren
in
his
apar
tmen
t com
plex
.
S
cena
rio
2.A
n A
fric
an A
mer
ican
fam
ily w
ants
to b
uy a
hou
se
and
finds
a r
eal e
stat
e ag
ent
to s
how
them
hou
ses
in t
heir
pr
ice
rang
e T
he r
eal e
stat
e ag
ent
is a
lso
Afr
ican
Am
eric
an
pric
e ra
nge.
The
rea
l est
ate
agen
t is
als
o A
fric
an A
mer
ican
. Th
eir
agen
t on
ly s
how
s th
em h
ouse
s in
Afr
ican
Am
eric
an
area
s of
tow
n, e
ven
thou
gh t
here
are
hou
ses
they
cou
ld a
ffor
d in
oth
er n
eigh
borh
oods
, bec
ause
she
thi
nks
they
will
be
mor
e co
mfo
rtab
le in
the
Afr
ican
Am
eric
an n
eigh
borh
ood.
6

Fi
Hi
Oi
iFa
ir H
ous
ing
Opi
nio
ns
S
cena
rio
3. A
His
pani
c co
uple
app
lies
for
a m
ortg
age
loan
at
a lo
cal b
ank
and
thei
r ap
plic
atio
n is
app
rove
d. T
he lo
an
offic
er w
ho m
akes
the
loan
dec
ides
to
char
ge t
hem
a h
ighe
r in
tere
st r
ate
than
he
did
a w
hite
cou
ple
he m
ade
a lo
an to
the
da
y be
fore
, eve
n th
ough
the
ir c
redi
t w
as ju
st a
s go
od.
He
does
this
bec
ause
he
belie
ves
that
His
pani
cs a
re m
ore
likel
y p
yto
def
ault
on t
heir
loan
s th
an w
hite
s.
S
cena
rio
4.A
n ap
artm
ent b
uild
ing
owne
r is
ren
ting
to
pg
gso
meo
ne w
ho u
ses
a w
heel
chai
r. T
he b
uild
ing
is o
ld a
nd d
oes
not
have
a w
heel
chai
r ra
mp.
The
ren
ter
asks
if h
e co
uld
arra
nge
to h
ave
a ra
mp
built
so
he c
an g
et in
to t
he b
uild
ing
arra
nge
to h
ave
a ra
mp
built
so
he c
an g
et in
to t
he b
uild
ing
mor
e ea
sily
. The
ren
ter
has
offe
red
to p
ay fo
r th
e ra
mp.
The
ow
ner
thin
ks a
ram
p w
ill r
uin
the
look
of t
he b
uild
ing,
so
he
refu
ses
to h
ave
one
built
7
refu
ses
to h
ave
one
built
.

Fil
iit
it
h H
i D
ii
iti
Fam
ilia
rity
wit
h H
ous
ing
Dis
crim
inat
ion
H
ave
you
or a
per
son
you
know
eve
r ex
peri
ence
d di
scri
min
atio
n w
hen
you
wer
e tr
ying
to
rent
or
buy
a ho
me?
C
an y
ou d
escr
ibe
wha
t ha
ppen
ed?
Wha
t di
d yo
u do
abo
ut it
?
Su
ppos
e yo
u or
som
eone
you
kno
w w
as d
iscr
imin
ated
ag
ains
t in
try
ing
to r
ent
or b
uy a
hou
se.
Wha
t w
ould
you
do
or r
ecom
men
d?
If
you
eve
r fe
lt y
ou w
ere
disc
rim
inat
ed a
gain
st a
nd w
ante
d to
rep
ort
it, d
o yo
u kn
ow w
ho y
ou w
ould
con
tact
?
D
o yo
u kn
ow w
ho in
vest
igat
es h
ousi
ng d
iscr
imin
atio
n in
the
K
ansa
s C
ity
regi
on?
If
you
wan
ted
to k
now
mor
e ab
out
your
fair
hou
sing
rig
hts,
h
ld
t i
fti
?
8
how
wou
ld y
ou g
et in
form
atio
n?

W
Wra
p up
Are
the
re a
ny o
ther
issu
es r
elat
ed t
o ho
usin
g di
scri
min
atio
n in
Kan
sas
Cit
y th
at w
e ne
ed t
o di
scus
s?
9

Barri
ers t
o Fai
r Hou
sing C
hoice
in th
e Kan
sas C
ity R
egio
n
Hei
di A
gg
eler
, Man
agin
g D
irec
tor
BB
C R
ese
arc
h &
Co
nsu
ltin
g37
73C
her
ryC
ree
kN
ort
hD
rive
,S
uit
e85
0
Pres
ente
d by: 37
73 C
her
ry C
ree
k N
ort
h D
rive
, S
uit
e 85
0D
enve
r, C
olo
rad
o 8
020
9p
ho
ne:
303
.321
.254
7 (X
:256
) fa
x: 3
03.3
99.0
448
agg
eler
@b
bcr
esea
rch
.co
m
ww
w.b
bcr
esea
rch
.co
m
April
29,
201
1

Toda
y’s A
gend
aTo
day’s
Age
nda
Wha
t is a
n An
alys
is of
Impe
dim
ents
to Fa
ir Ho
usin
g Cho
ice (
AI)?
Met
hodo
logy
to E
xam
ine B
arrie
rs to
Hou
sing C
hoic
e in
the K
ansa
s City
Reg
ion
Iden
tifie
d Im
pedi
men
ts
to Fa
ir Ho
usin
g Cho
ice
Reco
mm
ende
d Fa
ir Ho
usin
g Act
ion
Plan
2

Defin
ition
of Fa
irDe
finiti
on of
Fair
3

Fair
Hous
ing P
rote
ctio
ns
Stem
from
Civi
l Rig
hts A
ctSt
em fr
om C
ivil R
ight
s Act
The p
rom
ise of
the F
air
Hous
ing A
ct, a
s Ho
usin
g Act
, as
artic
ulat
ed in
196
8 by
Se
nato
r Wal
ther
Mon
dale
, wa
s to c
reat
e tru
ly in
tegr
ated
and
bala
nced
livin
g pat
tern
s
HUD
in 2
011:
Bui
ld in
clusiv
e and
sust
aina
ble c
omm
uniti
es fr
ee fr
om
disc
rimin
atio
n
4

Defin
ition
of a
n AI
Defin
ition
of a
n AI
An “A
I” is
an
Anal
ysis
of Im
pedi
men
ts to
Fair
Hous
ing C
hoic
e.
Ever
y city
, cou
nty o
r sta
te th
at re
ceive
s HUD
blo
ck gr
ant f
unds
is
yy,
yg
requ
ired
to co
mpl
ete a
n AI
stud
y eve
ry 3
to 5
year
s.
Acco
rdin
g to H
UD, i
mpe
dim
ents
to fa
ir ho
usin
g cho
ice a
re:
Any a
ctio
ns, o
miss
ions
, or d
ecisi
ons t
aken
beca
use o
f rac
e, co
lor,
relig
ion,
sex,
disa
bilit
y, fa
mili
al st
atus
, or n
atio
nal o
rigin
whi
ch re
stric
t ho
usin
g cho
ices o
r the
ava
ilabi
lity o
f hou
sing c
hoice
s.
Any a
ctio
ns, o
miss
ions
, or d
ecisi
ons w
hich h
ave t
he ef
fect
of re
stric
ting
hous
ing c
hoice
s or t
he a
vaila
bilit
y of h
ousin
g cho
ices o
n th
e bas
is of
ra
ce, c
olor
, rel
igio
n, se
x, di
sabi
lity,
fam
ilial
stat
us, o
r nat
iona
l orig
in.
5

Defin
ition
of a
n AI
Defin
ition
of a
n AI
AIs a
re in
tend
ed to
:
Serve
as t
he su
bsta
ntive
, log
ical b
asis
for F
air H
ousin
g Pla
nnin
g;
Prov
ide e
ssen
tial a
nd d
etai
led
info
rmat
ion
to p
olicy
mak
ers,
adm
inist
rativ
e sta
ff, h
ousin
g pro
vider
s, le
nder
s, an
d fa
ir ho
usin
g ad
min
istra
tive s
taff,
hou
sing p
rovid
ers,
lend
ers,
and
fair
hous
ing
advo
cate
s; an
d
Assis
t in
build
ing p
ublic
supp
ort f
or fa
ir ho
usin
g effo
rts.
6

Kans
as C
ity A
I Met
hodo
logy
Kans
as C
ity A
I Met
hodo
logy
Incl
uded
Ju
risdi
ctio
ns:
Stat
e of K
ansa
s•
John
son C
ount
y•
Kans
as C
ity, K
S•
Leav
enwo
rth•
Over
land
Par
k•
Shaw
nee
Stat
e of M
issou
ri•
Blue
Spr
ings
•Bl
ue S
prin
gs•
Inde
pend
ence
•Ka
nsas
City
, MO
•Le
e’s S
umm
it
7
•Le
e’s S
umm
it

Kans
as C
ity A
I Met
hodo
logy
Kans
as C
ity A
I Met
hodo
logy
Com
mun
ity a
nd h
ousin
g pro
file.
Pop
ulat
ion a
nd ho
useh
old
char
acte
ristic
s, ho
usin
g cos
t, ra
ce/e
thni
c con
cent
ratio
n, in
com
e ,
g,
/,
conc
entra
tion,
subs
idize
d ho
usin
g con
cent
ratio
n.
Priva
te m
arke
t, fa
ir ho
usin
g act
ivitie
s and
com
plai
nt d
ata
revie
w.
ff
Anal
ysis
of m
ortg
age l
endi
ng ap
prov
als,
subp
rime m
ortg
ages
(fro
m
Hom
e Mor
tgag
e Disc
losu
re A
ct or
HM
DA d
ata)
, com
plia
nce w
ith th
e Co
mm
unity
Rei
nves
tmen
t Act
(CRA
), re
cent
lega
l cas
es an
d fa
ir ho
usin
g com
plai
nts a
nd fa
ir ho
usin
g act
ivity.
hous
ing c
ompl
aint
s and
fair
hous
ing a
ctivi
ty.
Polic
y rev
iew
and
anal
ysis.
Rev
iew
of ci
ty zo
ning
, land
use a
nd
plan
ning
and
hous
ing p
olici
es p
erta
inin
g to
resid
entia
l hou
sing f
or
barri
ers t
o fa
ir ho
usin
g, an
d fa
ir ho
usin
g con
cern
s.
8

Kans
as C
ity A
I Met
hodo
logy
Kans
as C
ity A
I Met
hodo
logy
Com
mun
ity in
put.
Key p
erso
n int
ervie
ws, a
n onl
ine a
nd m
ail s
urve
y of
real
esta
te p
rofe
ssio
nals
and
nonp
rofit
s, an
d fo
ur co
mm
unity
p
p,
yfo
rum
s.
Iden
tific
atio
n of
impe
dim
ents
.
Actio
ns to
add
ress
pas
t and
curre
nt im
pedi
men
ts. R
ecom
men
ded
Fair
Hous
ing A
ctio
n Pla
n (FH
AP) f
or th
e citi
es in
the r
egio
n to u
se to
ad
dres
s ide
ntifi
ed im
pedi
men
tsad
dres
s ide
ntifi
ed im
pedi
men
ts.
9

AI Fi
ndin
gsAI
Find
ings
Kans
as C
ity, M
issou
ri (K
CMO)
and
Kan
sas C
ity, K
ansa
s (KC
K)
have
the h
ighe
st p
ropo
rtion
s of A
frica
n Am
eric
an a
nd H
ispan
ic
gp
pp
Resid
ents
.
Raci
al
Com
posit
ion,
200
8Tw
o or
M
ore
Race
sW
hit
eA
fric
anA
mer
ican
Nat
ive
Som
eA
lon
eA
mer
ican
Ind
ian
Asi
anH
awai
ian
Oth
er R
ace
Kan
sas
John
son
Cou
nty
461,
782
20,0
871,
623
19,7
8144
69,
973
11,0
31
Kans
as C
ity80
,630
39,8
131,
145
2,73
321
14,5
883,
054
Leav
enw
orth
26,5
035,
427
305
355
4063
81,
229
Ove
rlan
d Pa
rk14
3,94
55,
179
489
9,09
70
3,13
23,
140
Shaw
nee
52,5
092,
827
163
1,90
549
1,59
81,
822
Mis
sou
ri
Sour
ce:
Amer
ican
Com
mun
ity S
urve
y 20
06-2
008
3-ye
ar es
timat
e.
Mis
sou
ri
Blue
Sp
rings
47,4
891,
790
267
527
9132
11,
028
Inde
pen
denc
e10
6,02
94,
725
288
1,28
725
72,
989
2,94
5
Kans
as C
ity27
3,78
212
4,78
91,
698
8,87
082
614
,102
11,7
58
Lee'
s Su
mm
it79
,773
6,96
614
71,
622
140
698
2,08
5
Two
or
Am
eric
anIn
dia
nA
sian
Haw
aiia
nO
ther
Rac
eA
mer
ican
Nat
ive
Som
eM
ore
Race
sW
hit
eA
fric
anA
lon
e
Kan
sas
John
son
Cou
nty
88%
4%0%
4%0%
2%2%
Kans
as C
ity57
%28
%1%
2%0%
10%
2%
Leav
enw
orth
77%
16%
1%1%
0%2%
4%
Ove
rlan
d Pa
rk87
%3%
0%6%
0%2%
2%
Shaw
nee
86%
5%0%
3%0%
3%3%
10
Mis
sou
ri
Blue
Sp
rings
92%
3%1%
1%0%
1%2%
Inde
pen
denc
e89
%4%
0%1%
0%3%
2%
Kans
as C
ity63
%29
%0%
2%0%
3%3%
Lee'
s Su
mm
it87
%8%
0%2%
0%1%
2%

AI Fi
ndin
gsAI
Find
ings
Perc
ent
Hisp
anic
Kan
sas
John
son
Cou
nty
17,8
734%
30,6
556%
72%
2000
an
d 2
008
Perc
ent
of
Num
ber
Pop
ulat
ion
Perc
ent
of
20
08
20
00
Bet
wee
nN
umbe
rPo
pula
tion
Gro
wth
Resid
ents
, 200
8
Note
: Da
ta o
n Hi
span
ic re
siden
ts is
not
Jo
hnso
n C
ount
y17
,873
4%30
,655
6%7
2%
Kans
as C
ity24
,597
17%
33,7
6124
%3
7%
Leav
enw
orth
1,74
05%
2,02
36%
16%
Ove
rlan
d Pa
rk5,
559
4%7,
404
4%3
3%
Shaw
nee
2,09
24%
4,05
27%
94%
avai
labl
e fo
r Blu
e Spr
ings
in th
e Am
erica
n Co
mm
unity
Sur
vey
2006
-200
8 3-
year
estim
ate.
Sour
ce:
Amer
ican
Com
mun
ity S
urve
y M
isso
uri
Blue
Sp
rings
1,17
02%
NA
NA
NA
Inde
pen
denc
e4,
010
4%8,
539
7%11
3%
Kans
as C
ity30
,374
7%40
,074
9%3
2%
Lee'
s Su
mm
it1,
434
2%2,
428
3%6
9%
2006
-200
8 3-
year
estim
ate.
11

AI Fi
ndin
gsAI
Find
ings
Perc
ent A
frica
n Am
eric
an R
esid
ents
of
Tota
l Pop
ulat
ion
by
Cens
us Tr
act,
Kans
as
City,
Miss
ouri,
200
9So
urce
: So
urce
: Cl
arita
s, 20
09.
1212

AI Fi
ndin
gsAI
Find
ings
Perc
ent H
ispan
ic
Resid
ents
of T
otal
Po
pula
tion
by C
ensu
s Tr
act,
Kans
as C
ity,
Miss
ouri,
200
9So
urce
: So
urce
: Cl
arita
s, 20
09.
1313

AI Fi
ndin
gsAI
Find
ings
Perc
ent A
frica
n A
i R
idt
Am
eric
an R
esid
ents
of
Tota
l Pop
ulat
ion
by
Cens
us Tr
act,
Kans
as
City,
Kan
sas,
200
9
Sour
ce:
Clar
itas,
2009
.
14

AI Fi
ndin
gsAI
Find
ings
Perc
ent H
ispan
ic
Rid
t
f Tt
l Re
siden
ts o
f Tot
al
Popu
latio
n by
Cen
sus
Trac
t, Ka
nsas
City
, Ka
nsas
, 200
9
Sour
ce:
Clar
itas,
2009
.
15

AI Fi
ndin
gs
Affo
rdab
le re
ntal
uni
ts
are h
eavil
y con
cent
rate
d in
Kan
sas C
ity
in K
ansa
s City
, M
issou
ri...
Publ
ic H
ousin
g Un
its a
nd
HUD
Subs
idize
d Un
its,
Kans
as C
ity R
egio
n
Sour
ce:
Clar
itas,
2009
.
16

AI Fi
ndin
gs…
and
low
inco
me
hous
ehol
ds a
re
conc
entra
ted
in
KCM
O an
d KC
KKC
MO
and
KCK
L I
Lo
w In
com
e,
Kans
as C
ity
Regi
on, 2
010
Sour
ce:
BBC
Rese
arch
& C
onsu
lting
,

AI Fi
ndin
gsAI
Find
ings
An
nu
al R
ente
rM
edia
n Co
ntra
ct
Kan
sas
Cit
y M
SA47
3$
5
94$
12
1$
25
.6%
$23,
760
Kan
sas
Perc
ent
Inco
me
Nee
ded
20
0020
08C
han
ge
to A
ffor
dRe
nta
l In
crea
seRe
nt, 2
000
and
2008
S
John
son
Cou
nty
622
$
730
$
108
$
17.4
%$2
9,20
0
Kans
as C
ity38
6$
51
5$
12
9$
33
.4%
$20,
600
Leav
enw
orth
429
$
572
$
143
$
33.3
%$2
2,88
0
Ove
rlan
d Pa
rk68
1$
78
9$
10
8$
15
.9%
$31,
560
Sour
ce:
2000
U.S
. Cen
sus a
nd th
e Am
erica
n Co
mm
unity
Sur
vey
2006
-200
8 3-
year
estim
ate.
Shaw
nee
556
$
644
$
88$
15.8
%$2
5,76
0
Mis
sou
ri
Blue
Sp
rings
543
$
642
$
99$
18.2
%$2
5,68
0
Inde
pen
denc
e40
9$
51
7$
10
8$
26
.4%
$20,
680
Kans
as C
ity44
5$
55
6$
11
1$
24
.9%
$22,
240
Lee'
s Su
mm
it56
1$
77
1$
21
0$
37
.4%
$30,
840
18

AI Fi
ndin
gsAI
Find
ings
Med
ian
Hom
e Val
ue,
2000
d
2008
Perc
ent
2000
and
200
8
Sour
ce:
2000
U.S
. Cen
sus a
nd th
e Am
erica
n Co
mm
unity
Sur
vey 2
006-
2008
Kan
sas
Cit
y M
SA1
04,7
00$
10
4,40
0$
-0
.3%
Kan
sas
200
020
08 C
han
ge
yy
3-ye
ar es
timat
e.Jo
hnso
n C
ount
y15
0,10
0$
14
9,30
0$
-0
.5%
Kans
as C
ity52
,500
$
51
,900
$
-1
.1%
Leav
enw
orth
75,2
00$
74,4
00$
-1.1
%
Ove
rlan
d Pa
rk16
2,80
0$
16
0,90
0$
-1
.2%
Shaw
nee
141,
700
$
141,
100
$
-0.4
%
Mis
sou
ri
Blue
Sp
rings
108,
300
$
108,
200
$
-0.1
%
Inde
pen
denc
e77
,000
$
76
,000
$
-1
.3%
Kans
as C
ity84
,000
$
83
,300
$
-0
.8%
Lee'
s Su
mm
it13
1,50
0$
13
1,70
0$
0.
2%
19
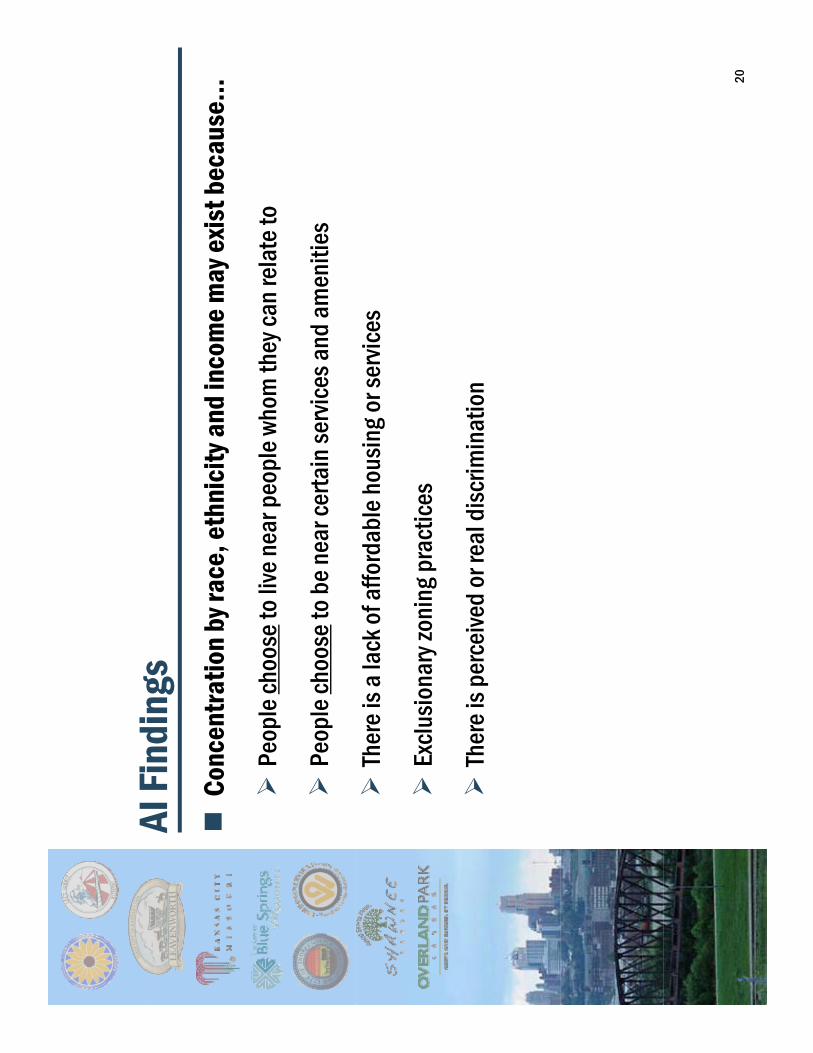
AI Fi
ndin
gsAI
Find
ings
Conc
entra
tion
by ra
ce, e
thni
city
and
inco
me m
ay ex
ist b
ecau
se…
Peop
le ch
oose
to liv
e nea
r peo
ple w
hom
they
can
rela
te to
Peop
le ch
oose
to b
e nea
r cer
tain
servi
ces a
nd a
men
ities
Ther
e is a
lack
of a
fford
able
hou
sing o
r ser
vices
Exclu
siona
ry zo
ning
pra
ctice
s
Ther
e is p
erce
ived
or re
al d
iscrim
inat
ion
20

AI Fi
ndin
gsAI
Find
ings
Oper
ative
wor
d is
CHOI
CE
Even
if cl
ient
seem
s to
pref
er liv
ing n
ear o
ther
s like
them
, st
eerin
g is n
ot o
kay
Ever
y com
mun
ity sh
ould
offe
r a ra
nge o
f hou
sing o
ptio
ns
Ever
y com
mun
ity sh
ould
offe
r a ra
nge o
f hou
sing o
ptio
ns
and
choi
ces
Servi
ces a
nd co
mm
ercia
l of
ferin
gs w
ill d
iffer
or
offe
rings
will
diff
er, o
r wi
ll be t
ailo
red
to m
arke
t de
man
d
Howe
ver
basic
socia
l Ho
weve
r, ba
sic so
cial
supp
orts
shou
ld ex
ist a
nd
be ac
cess
ible
in ev
ery
com
mun
ity
21

AI Fi
ndin
gsAI
Find
ings
Are i
mpe
dim
ents
to fa
ir ho
usin
g cho
ice c
ausin
g the
se p
atte
rns?
In
som
e cas
es, a
ccor
ding
to a
dvoc
ates
:,
g
Scho
ols
(1.6
)
Publ
ic tr
ansp
orta
tion
(1.9
)21
.7%
13.0
%17
.4%
47.8
%
24.0
%20
.0%
28.0
%28
.0%
0 (V
ery
E qui
tabl
e)
Surv
ey Q
uest
ion:
“R
ank t
he de
gree
to
hih t
h f
lli
Wat
er a
nd s
ewer
Stre
et in
fras
truc
ture
(1.
4)
Cod
e en
forc
emen
t (1.
6)
Scho
ols
(1.6
)
8.7%
43.5
%30
.4%
17.4
%
20.0
%40
.0%
30.0
%10
.0%
20.8
%37
.5%
33.3
%8.
3%
q 1
which
the f
ollo
wing
se
rvice
s are
deliv
ered
eq
uita
bly a
cros
s ne
ighb
orho
ods i
n you
r co
mm
unity
.”
Fire
serv
ices
(09)
Park
s an
d re
crea
tion
(0.9
)
Polic
e se
rvic
es (
1.0)
infr
astr
uctu
re (
1.3)
20.8
%37
.5%
33.3
%8.
3%
36.4
%31
.8%
18.2
%13
.6%
30.4
%47
.8%
13.0
%8.
7%
522%
174%
174%
130%
2 3(V
ery
com
mun
ity.
Note
s:
n=23
; The
ave
rage
rank
ing
for
each
cate
gory
is sh
own
in
pare
nthe
sis.
Tras
h p
ick
up (
0.8)
Fire
ser
vice
s (0
.9) 0%
20%
40%
60%
80%
100%
52.2
%17
.4%
17.4
%13
.0%
50.0
%20
.8%
25.0
%
4.2%
3 (V
ery
Ineq
uita
ble)
Sour
ce:
BBC
Rese
arch
& C
onsu
lting
, De
cem
ber 2
010-
Febr
uary
2011
st
akeh
olde
r sur
vey.
22

AI Fi
ndin
gs
Rest
rictiv
e co
vena
nts
by h
omeo
wne
r as
soci
atio
nsor
neig
hbor
hood
orga
niza
tions
(13)
Lack
of a
deq
uate
zon
ing
for
man
ufac
ture
dho
usin
g (1
.2)
Lim
itatio
ns o
n de
nsity
of h
ousi
ng (
1.0)
17.4
%47
.8%
26.1
%8.
7%
23.8
%42
.9%
23.8
%9.
5%
31.8
%40
.9%
18.2
%9.
1%
0 (not
aba
rrie
r)
Degr
ee o
f Se
rious
ness
of
Pote
ntia
l Ba
rrier
s, a
s Id
entif
ied
b
Lack
ofkn
owle
dge
amon
gap
pra
iser
sre
gard
ing
Con
cent
ratio
ns o
f gro
up h
omes
in c
erta
inne
ighb
orho
ods
(1.3
)
Lack
of k
now
ledg
e am
ong
insu
ranc
e in
dust
ryre
pre
sent
ativ
es r
egar
ding
fair
hous
ing
(1.3
)
or n
eigh
borh
ood
orga
niza
tions
(1.
3)
27.3
%36
.4%
13.6
%22
.7%
23.8
%33
.3%
33.3
%9.
5%
1
Iden
tifie
d by
Ad
voca
te S
urve
y Re
spon
dent
s
Lack
of k
now
ledg
e am
ong
real
est
ate
agen
tsre
gard
ing
fair
hous
ing
(1.5
)
Lack
of k
now
ledg
e am
ong
bank
ers/
lend
ers
rega
rdin
g fa
ir ho
usin
g (1
.5)
Lack
of k
now
ledg
e am
ong
app
rais
ers
rega
rdin
gfa
ir ho
usin
g (1
.3)
9.5%
42.9
%33
.3%
14.3
%
17.4
%30
.4%
39.1
%13
.0%
19.0
%33
.3%
42.9
%4.
8%1 (m
inor
barr
ier)
Note
s:
n=23
;
The a
vera
ge ra
nkin
g fo
r ea
ch ca
tego
ry is
show
n in
pa
rent
hesis
.
Lack
of k
now
ledg
e am
ong
larg
e la
ndlo
rds/
pro
per
ty m
anag
ers
rega
rdin
g fa
ir ho
usin
g (1
.8)
Use
of “
neig
hbor
hood
sta
bilit
y” o
r si
mila
r fa
ctor
sas
pro
xies
for
raci
al m
akeu
p in
ap
pra
isal
s (1
.8)
Lim
ited
cap
acity
of a
loca
l org
aniz
atio
n de
vote
dto
fair
inve
stig
atio
n/te
stin
g (1
.5)
4.5%
31.8
%40
.9%
22.7
%
9.5%
14.3
%61
.9%
14.3
%
13.6
%40
.9%
22.7
%22
.7%
2 (mod
est
bar
rier)
pae
tes
s
Sour
ce:
BBC
Rese
arch
& C
onsu
lting
, De
cem
ber 2
010-
Febr
uary
2011
stak
ehol
der s
urve
y.
Con
cent
ratio
n of
low
-inco
me
hous
ing
in
Lack
of k
now
ledg
e am
ong
resi
dent
s re
gard
ing
fair
hous
ing
(2.2
)
Lack
of k
now
ledg
e am
ong
smal
l lan
dlor
dsre
gard
ing
fair
hous
ing
(2.1
)
pp
yg
gg
g(
)
435%
565%
4.3%
17.4
%30
.4%
47.8
%
4.3%
13.0
%47
.8%
34.8
%
3 (ser
ious
barr
ier)
Inco
me
leve
ls o
f min
ority
and
fem
ale-
head
edho
useh
olds
(2.
9)
cert
ain
area
s (2
.6) 0%
10%
20%
30%
40%
50%
60%
70%
80%
90%
100%
4.5%
4.5%
90.9
%
43.5
%56
.5%
barr
ier)
23

AI Fi
ndin
gsAI
Find
ings
Abili
ty to
acc
ess c
redi
t is a
lso a
conc
ern.
Actio
n Ta
ken
on Lo
an A
pplic
atio
n, S
tudy
Are
a, 2
009
Lo
anO
rig
inat
ed
Tota
lN
um
ber
of
Loan
s
Ap
plic
atio
nW
ith
dra
wn
b
yA
pp
lican
t
File
cl
osed
for
Inco
mp
lete
nes
s
Ap
plic
atio
n
Ap
pro
ved
bu
t N
otA
ccep
ted
Ap
plic
atio
nD
enie
d
Kan
sas
Cit
y M
SA5.
0%16
.1%
12.3
%2.
4%64
.3%
Kan
sas
John
son
Cou
nty
4.6%
11.3
%11
.5%
1.9%
70.7
%39
,645
Ori
gin
ated
of L
oan
sb
y A
pp
lican
tIn
com
ple
ten
ess
Not
Acc
epte
dD
enie
d
Kans
as C
ity4.
9%17
.2%
11.5
%2.
7%63
.7%
11,8
67
Leav
enw
orth
4.2%
16.9
%10
.6%
2.1%
66.2
%2,
210
Ove
rlan
d Pa
rk4.
7%10
.9%
11.7
%2.
0%70
.8%
17,6
10
Shaw
nee
4.6%
13.1
%11
.7%
2.1%
68.5
%8,
499
Mis
sou
ri
Blue
Sp
rings
6.3%
18.8
%0.
5%2.
7%71
.6%
4,24
0
Inde
pen
denc
e5.
2%20
.0%
13.6
%2.
6%58
.6%
9,12
9
Kans
as C
ity5.
2%17
.4%
12.6
%2.
5%62
.3%
50,9
47
Lee'
sSu
mm
it5
2%13
7%12
8%2
4%65
9%10
826
24
Sour
ce:
Hom
e Mor
tgag
e Disc
losu
re A
ct (H
MDA
), 20
09.
Lee
s Su
mm
it5.
2%13
.7%
12.8
%2.
4%65
.9%
10,8
26

AI Fi
ndin
gsAI
Find
ings
Resu
lt of
Mor
tgag
e Lo
an A
pplic
atio
ns b
y Rac
e/Et
hnic
ity, J
ohns
on C
ount
y, Ka
nsas
, 200
9g
gpp
y/
y,y,
,
Jh
C
Loan
Ori
gin
ated
Ap
plic
atio
n
Wit
hd
raw
n
clos
ed fo
rA
pp
licat
ion
File
A
pp
rove
d b
ut
Ap
plic
atio
nN
ot A
ccep
ted
Den
ied
by
Ap
plic
ant
Inco
mp
lete
nes
s
Joh
nso
n C
ou
nty
Afr
ican
Am
eric
an60
.2%
4.5%
18.6
%13
.0%
3.7%
Whi
te73
.7%
4.5%
10.2
%9.
9%1.
7%
His
pan
ic65
.2%
5.4%
15.4
%12
.0%
2.0%
Not
His
pan
ic73
.1%
4.6%
10.4
%10
.1%
1.8%
Sour
ce:
FFIE
C HM
DA A
ggre
gate
Rep
orts
, 200
9, a
nd B
BC R
esea
rch &
Con
sulti
ng.
Rac
ial/
Eth
nic
Co
mp
aris
on
sA
fric
an A
mer
ican
/Whi
te-1
3.5%
-0.1
%8.
4%3.
1%2.
0%
His
pan
ic/N
ot H
isp
anic
-7.9
%0.
8%5.
0%1.
9%0.
1%
25

AI Fi
ndin
gsAI
Find
ings
Resu
lt of
Mor
tgag
e Lo
an A
pplic
atio
ns b
y Rac
e/Et
hnic
ity, K
CK, 2
009
gg
ppy
/y,
,
KC
iK
S
Ap
plic
atio
n
Ap
plic
atio
n
Ori
gin
ated
Not
Acc
epte
dD
enie
db
y A
pp
lican
tIn
com
ple
ten
ess
File
Lo
anA
pp
rove
d b
ut
Ap
plic
atio
nW
ith
dra
wn
cl
osed
for
Kan
sas
Cit
y, K
SA
fric
an A
mer
ican
47.6
%6.
3%28
.6%
11.3
%6.
3%
Whi
te68
.1%
4.8%
14.5
%10
.3%
2.3%
His
pan
ic48
.7%
5.9%
29.5
%13
.0%
2.8%
Not
His
pan
ic67
.1%
4.9%
14.9
%10
.4%
2.7%
Rac
ial/
Eth
nic
Co
mp
aris
on
sA
fric
an A
mer
ican
/Whi
te-2
0.5%
1.5%
14.2
%0.
9%3.
9%
His
pan
ic/N
ot H
isp
anic
-18.
4%1.
0%14
.6%
2.6%
0.2%
Sour
ce:
FFIE
C HM
DA A
ggre
gate
Rep
orts
, 200
9, a
nd B
BC R
esea
rch &
Con
sulti
ng.
26

AI Fi
ndin
gsAI
Find
ings
Resu
lt of
Mor
tgag
e Lo
an A
pplic
atio
ns b
y Rac
e/Et
hnic
ity, L
eave
nwor
th, K
ansa
s, 2
009
gg
ppy
/y,
,,
Lh
Loan
Ap
pro
ved
bu
t A
pp
licat
ion
Wit
hd
raw
n
clos
ed fo
rA
pp
licat
ion
A
pp
licat
ion
File
Ori
gin
ated
Not
Acc
epte
dD
enie
db
y A
pp
lican
tIn
com
ple
ten
ess
Leav
enw
ort
hA
fric
an A
mer
ican
57.0
%7.
0%23
.7%
10.5
%1.
8%
Whi
te68
.7%
4.1%
15.8
%9.
4%1.
9%
His
pan
ic57
.4%
6.6%
19.7
%14
.8%
1.6%
Not
His
pan
ic68
.3%
4.3%
16.0
%9.
3%2.
1%
Sour
ce:
FFIE
C HM
DA A
ggre
gate
Rep
orts
, 200
9, a
nd B
BC R
esea
rch &
Con
sulti
ng.
Rac
ial/
Eth
nic
Co
mp
aris
on
sA
fric
an A
mer
ican
/Whi
te-1
1.7%
2.9%
7.9%
1.1%
-0.2
%
His
pan
ic/N
ot H
isp
anic
-10.
9%2.
2%3.
6%5.
4%-0
.4%
27

AI Fi
ndin
gsAI
Find
ings
Resu
lt of
Mor
tgag
e Lo
an A
pplic
atio
ns b
y Rac
e/Et
hnic
ity, O
verla
nd P
ark,
Kan
sas,
200
9g
gpp
y/
y,,
,
Ol
dP
k
Ap
plic
atio
n
Ap
plic
atio
nFi
le
Ori
gin
ated
Not
Acc
epte
dD
enie
db
y A
pp
lican
tIn
com
ple
ten
ess
Loan
Ap
pro
ved
bu
t A
pp
licat
ion
Wit
hd
raw
n
clos
ed fo
r
Ove
rlan
d P
ark
Afr
ican
Am
eric
an58
.6%
4.7%
16.9
%16
.3%
3.4%
Whi
te73
.9%
4.5%
9.9%
10.0
%1.
7%
His
pan
ic66
.8%
4.5%
14.5
%11
.9%
2.4%
Not
His
pan
ic73
.1%
4.6%
10.0
%10
.4%
1.8%
Rac
ial/
Eth
nic
Co
mp
aris
on
sA
fric
an A
mer
ican
/Whi
te-1
5.3%
0.3%
7.1%
6.3%
1.6%
His
pan
ic/N
ot H
isp
anic
-6.3
%-0
.2%
4.5%
1.5%
0.5%
Sour
ce:
FFIE
C HM
DA A
ggre
gate
Rep
orts
, 200
9, a
nd B
BC R
esea
rch &
Con
sulti
ng.
28

AI Fi
ndin
gsAI
Find
ings
Resu
lt of
Mor
tgag
e Lo
an A
pplic
atio
ns b
y Rac
e/Et
hnic
ity, S
hawn
ee, K
ansa
s, 2
009
gg
ppy
/y,
,,
Sh
Loan
Ap
pro
ved
bu
t A
pp
licat
ion
Wit
hd
raw
n
clos
ed fo
rA
pp
licat
ion
A
pp
licat
ion
File
Ori
gin
ated
Not
Acc
epte
dD
enie
db
y A
pp
lican
tIn
com
ple
ten
ess
Shaw
nee
Afr
ican
Am
eric
an60
.0%
7.1%
17.9
%10
.7%
4.3%
Whi
te71
.1%
4.7%
12.1
%10
.1%
2.0%
His
pan
ic59
.4%
5.7%
22.8
%10
.7%
1.4%
Not
His
pan
ic70
.8%
4.8%
12.0
%10
.2%
2.1%
Rac
ial/
Eth
nic
Co
mp
aris
on
sA
fric
an A
mer
ican
/Whi
te-1
1.1%
2.4%
5.8%
0.7%
2.2%
His
pan
ic/N
ot H
isp
anic
-11.
3%0.
9%10
.7%
0.4%
-0.7
%
Sour
ce:
FFIE
C HM
DA A
ggre
gate
Rep
orts
, 200
9, a
nd B
BC R
esea
rch &
Con
sulti
ng.
29

AI Fi
ndin
gsAI
Find
ings
Resu
lt of
Mor
tgag
e Lo
an A
pplic
atio
ns b
y Rac
e/Et
hnic
ity, B
lue S
prin
gs, M
issou
ri, 2
009
Bl
Si
Ap
plic
atio
n
Ap
plic
atio
nFi
le
Ori
gin
ated
Not
Acc
epte
dD
enie
db
y A
pp
lican
tIn
com
ple
ten
ess
Loan
Ap
pro
ved
bu
t A
pp
licat
ion
Wit
hd
raw
n
clos
ed fo
r
gg
ppy
/y,
pg
,,
Blu
e Sp
rin
gs
Afr
ican
Am
eric
an62
.2%
7.3%
19.5
%8.
5%2.
4%
Whi
te65
.8%
5.5%
15.3
%11
.1%
2.3%
His
pan
ic52
.2%
7.8%
24.4
%12
.2%
3.3%
Not
His
pan
ic65
.4%
5.6%
15.7
%11
.0%
2.3%
Rac
ial/
Eth
nic
Co
mp
aris
on
sA
fric
an A
mer
ican
/Whi
te-3
.6%
1.8%
4.2%
-2.6
%0.
2%
His
pan
ic/N
ot H
isp
anic
-13.
2%2.
2%8.
8%1.
2%1.
0%
Sour
ce:
FFIE
C HM
DA A
ggre
gate
Rep
orts
, 200
9, a
nd B
BC R
esea
rch &
Con
sulti
ng.
30

AI Fi
ndin
gsAI
Find
ings
Resu
lt of
Mor
tgag
e Lo
an A
pplic
atio
ns b
y Rac
e/Et
hnic
ity, I
ndep
ende
nce,
Miss
ouri,
200
9g
gpp
y/
y,p
,,
Id
d
Loan
Ap
pro
ved
bu
t A
pp
licat
ion
Wit
hd
raw
n
clos
ed fo
rA
pp
licat
ion
A
pp
licat
ion
File
Ori
gin
ated
Not
Acc
epte
dD
enie
db
y A
pp
lican
tIn
com
ple
ten
ess
Ind
epen
den
ceA
fric
an A
mer
ican
55.9
%6.
2%25
.5%
11.5
%0.
9%
Whi
te62
.6%
5.3%
17.7
%11
.8%
2.7%
His
pan
ic56
.8%
4.0%
25.2
%13
.3%
0.7%
Not
His
pan
ic61
.9%
5.4%
18.2
%11
.8%
2.7%
Sour
ce:
FFIE
C HM
DA A
ggre
gate
Rep
orts
, 200
9, a
nd B
BC R
esea
rch &
Con
sulti
ng.
Rac
ial/
Eth
nic
Co
mp
aris
on
sA
fric
an A
mer
ican
/Whi
te-6
.7%
0.9%
7.8%
-0.2
%-1
.8%
His
pan
ic/N
ot H
isp
anic
-5.0
%-1
.5%
7.0%
1.5%
-2.0
%
31

AI Fi
ndin
gsAI
Find
ings
Resu
lt of
Mor
tgag
e Lo
an A
pplic
atio
ns b
y Rac
e/Et
hnic
ity, K
CMO,
200
9g
gpp
y/
y,,
KC
iM
O
Ap
plic
atio
n
Ap
plic
atio
nFi
le
Ori
gin
ated
Not
Acc
epte
dD
enie
db
y A
pp
lican
tIn
com
ple
ten
ess
Loan
Ap
pro
ved
bu
t A
pp
licat
ion
Wit
hd
raw
n
clos
ed fo
r
Kan
sas
Cit
y, M
OA
fric
an A
mer
ican
49.6
%6.
8%33
.5%
5.9%
4.2%
Whi
te67
.4%
5.1%
14.4
%10
.8%
2.4%
His
pan
ic52
.5%
6.0%
25.8
%12
.8%
2.9%
Not
His
pan
ic65
.4%
5.2%
15.7
%11
.2%
2.5%
Sour
ce:
FFIE
C HM
DA A
ggre
gate
Rep
orts
, 200
9, a
nd B
BC R
esea
rch &
Con
sulti
ng.
Rac
ial/
Eth
nic
Co
mp
aris
on
sA
fric
an A
mer
ican
/Whi
te-1
7.8%
1.7%
19.2
%-4
.9%
1.8%
His
pan
ic/N
ot H
isp
anic
-12.
8%0.
8%10
.1%
1.6%
0.3%
32

AI Fi
ndin
gsAI
Find
ings
Resu
lt of
Mor
tgag
e Lo
an A
pplic
atio
ns b
y Rac
e/Et
hnic
ity, L
ee’s
Sum
mit,
Miss
ouri,
200
9g
gpp
y/
y,,
,
L'
Si
Loan
Ap
pro
ved
bu
t A
pp
licat
ion
Wit
hd
raw
n
clos
ed fo
rO
rig
inat
edN
ot A
ccep
ted
Den
ied
by
Ap
plic
ant
Inco
mp
lete
nes
s
Ap
plic
atio
n
Ap
plic
atio
nFi
le
Lee'
s Su
mm
itA
fric
an A
mer
ican
57.6
%6.
8%21
.2%
11.7
%2.
7%
Whi
te69
.2%
5.2%
12.1
%11
.2%
2.3%
His
pan
ic59
.6%
2.5%
23.6
%10
.6%
3.7%
Not
His
pan
ic68
.4%
5.3%
12.6
%11
.3%
2.3%
Rac
ial/
Eth
nic
Co
mp
aris
on
sA
fric
an A
mer
ican
/Whi
te-1
1.6%
1.6%
9.1%
0.5%
0.4%
His
pan
ic/N
ot H
isp
anic
-8.8
%-2
.8%
11.0
%-0
.8%
1.4%
Sour
ce:
FFIE
C HM
DA A
ggre
gate
Rep
orts
, 200
9, a
nd B
BC R
esea
rch &
Con
sulti
ng.
33
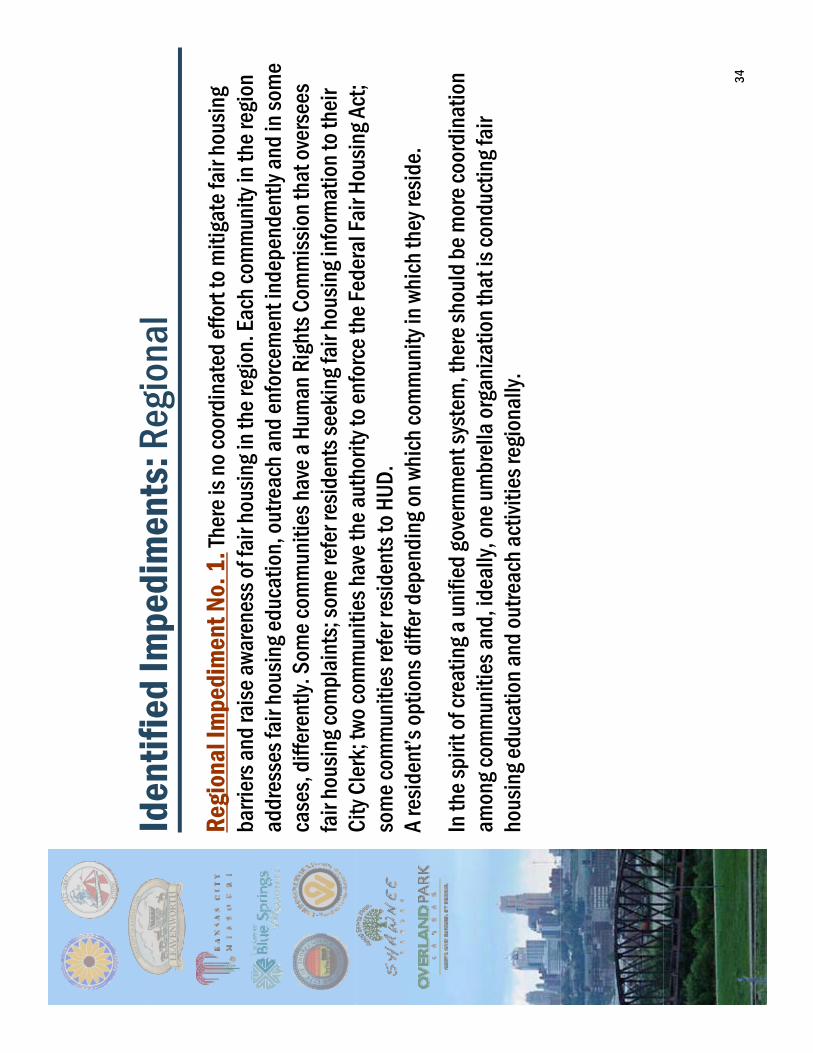
Iden
tifie
d Im
pedi
men
ts: R
egio
nal
Iden
tifie
d Im
pedi
men
ts: R
egio
nal
Regi
onal
Impe
dim
ent N
o. 1
.The
re is
no co
ordi
nate
d ef
fort
to m
itiga
te fa
ir ho
usin
g ba
rrier
s and
raise
awar
enes
s of f
air h
ousin
g in t
he re
gion
. Eac
h com
mun
ity in
the r
egio
n ba
esa
da
sea
ae
esso
aou
sg
te
ego
acco
uty
te
ego
addr
esse
s fai
r hou
sing e
duca
tion,
outre
ach a
nd en
forc
emen
t ind
epen
dent
ly an
d in
som
e ca
ses,
diffe
rent
ly. S
ome c
omm
uniti
es ha
ve a
Hum
an R
ight
s Com
miss
ion t
hat o
vers
ees
fair
hous
ing c
ompl
aint
s; so
me r
efer
resid
ents
seek
ing f
air h
ousin
g inf
orm
atio
n to t
heir
City
Cler
k; tw
o com
mun
ities
have
the a
utho
rity t
o enf
orce
the F
eder
al Fa
ir Ho
usin
g Act
; Ci
ty Cl
erk;
two c
omm
uniti
es ha
ve th
e aut
horit
y to e
nfor
ce th
e Fed
eral
Fair
Hous
ing A
ct;
som
e com
mun
ities
refe
r res
iden
ts to
HUD
. A
resid
ent’s
optio
ns d
iffer
dep
endi
ng o
n whi
ch co
mm
unity
in w
hich
they
resid
e.
In th
e spi
rit of
crea
ting a
unifi
ed go
vern
men
t sys
tem
ther
e sho
uld
be m
ore c
oord
inat
ion
In th
e spi
rit of
crea
ting a
unifi
ed go
vern
men
t sys
tem
, the
re sh
ould
be m
ore c
oord
inat
ion
amon
g com
mun
ities
and,
idea
lly, o
ne um
brel
la or
gani
zatio
n tha
t is c
ondu
ctin
g fai
r ho
usin
g edu
catio
n and
outre
ach a
ctivi
ties r
egio
nally
.
34

Iden
tifie
d Im
pedi
men
ts: R
egio
nal
Iden
tifie
d Im
pedi
men
ts: R
egio
nal
Regi
onal
Impe
dim
ent N
o. 2
.In
form
atio
n abo
ut fa
ir ho
usin
g is d
ifficu
lt to
find
and
can
be co
nfus
ing.
Res
iden
ts in
the p
ublic
foru
ms c
ondu
cted
for t
his s
tudy
said
they
did
not
be
cous
ges
dets
tep
ubc
ou
sco
duct
edo
tss
tudy
sad
tey
dd
otkn
ow ho
w to
file
a co
mpl
aint
or w
here
to go
to se
ek ou
t fai
r hou
sing i
nfor
mat
ion.
Soc
ial
servi
ce an
d ho
usin
g pro
vider
s who
com
plet
ed a
fair
hous
ing s
urve
y for
this
stud
y sai
d m
ost o
f the
ir cli
ents
“do
noth
ing”
whe
n fa
ced
with
hous
ing d
iscrim
inat
ion.
A re
view
of th
e ju
risdi
ctio
ns’ w
ebsit
es fo
und
inco
nsist
ency
in ho
w fa
ir ho
usin
g inf
orm
atio
n was
ju
risdi
ctio
ns w
ebsit
es fo
und
inco
nsist
ency
in ho
w fa
ir ho
usin
g inf
orm
atio
n was
co
mm
unica
ted.
It sh
ould
be n
oted
, how
ever
, tha
t in t
he fa
ir ho
usin
g sur
vey t
hey c
ompl
eted
, rea
l est
ate
prof
essio
nals
iden
tifie
d fe
w ba
rrier
s rel
ated
to la
ck of
know
ledg
e of f
air h
ousin
g iss
ues i
n pr
ofes
siona
ls id
entif
ied
few
barri
ers r
elat
ed to
lack
of kn
owle
dge o
f fai
r hou
sing i
ssue
s in
the r
eal e
stat
e com
mun
ity.
35

Iden
tifie
d Im
pedi
men
ts: R
egio
nal
Iden
tifie
d Im
pedi
men
ts: R
egio
nal
Regi
onal
Impe
dim
ent N
o. 3
.KCM
O co
ntai
ns hi
gh co
ncen
tratio
ns of
min
ority
and
low
inco
me h
ouse
hold
s KC
MO
hous
es th
e maj
ority
of th
e reg
ion’
s min
ority
and
low
inco
me
inco
me h
ouse
hold
s. KC
MO
hous
es th
e maj
ority
of th
e reg
ion
s min
ority
and
low
inco
me
popu
latio
ns: t
he ci
ty he
ld 6
0% o
f the
regi
on’s
Afric
an A
mer
icans
and
46%
of t
he re
gion
’s ho
useh
olds
earn
ing l
ess t
han $
25,0
00 p
er ye
ar. T
his c
ompa
res t
o 33%
of t
he re
gion
’s po
pula
tion o
vera
ll.
The r
egio
n nee
ds to
pro
vide m
ore o
ppor
tuni
ties f
or ra
cial a
nd et
hnic
min
oriti
es an
d lo
w in
com
e hou
seho
lds t
o live
in ar
eas o
ther
than
KCM
O if
they
choo
se to
.
Ri
l Idi
t N 4
KCM
O h
di
i
b
f l
i
A
Regi
onal
Impe
dim
ent N
o. 4
.KCM
O ha
s a d
ispro
porti
onat
e num
ber o
f low
rent
units
. An
exam
inat
ion o
f the
geog
raph
ic lo
catio
n of t
he re
gion
’s pu
blic
hous
ing u
nits
and
othe
r HUD
su
bsid
ized
hous
ing s
hows
a sig
nific
ant c
once
ntra
tion o
f uni
ts in
KCM
O. M
ore t
han h
alf
(51%
) of a
ll of t
he re
gion
’s pu
blic
hous
ing u
nits
and
vouc
hers
are p
rovid
ed b
y the
Hou
sing
()
gp
gp
yg
Auth
ority
of K
CMO.
The r
egio
n nee
ds to
pro
vide m
ore o
ppor
tuni
ties f
or ve
ry lo
w in
com
e ren
ters
to liv
e in a
reas
ot
her t
han K
CMO
if th
ey ch
oose
to.
36

Iden
tifie
d Im
pedi
men
ts: C
ityId
entif
ied
Impe
dim
ents
: City
City
Impe
dim
ent N
o. 1
.Res
iden
ts ex
perie
nce d
iscrim
inat
ion.
Com
plai
nt d
ata a
nd a
surve
y of s
take
hold
ers p
rovid
e evid
ence
that
resid
ents
in th
e reg
ion e
xper
ienc
e hou
sing
suey
ost
ae
ode
spo
dee
dece
tat
esde
tst
eeg
oe
pee
ceou
sg
disc
rimin
atio
n. A
ll citi
es ha
ve ha
d a s
hare
of th
e 577
com
plai
nts f
iled
in th
e pas
t 5 ye
ars
(alth
ough
in so
me c
ases
, city
offi
cials
were
una
ware
that
com
plai
nts h
ad b
een
filed
).
Sh
d N
t
Kan
sas
Cit
y M
SA
Oth
er
10%
Race
Shar
e of
Fa
mily
Stat
us
6%
Reta
liati
on
5%
Dis
ailit
y
31%
Gen
der
9%
Stu
dy
Are
a C
omp
lain
ts
39%
Shar
e and
Nat
ure
of C
ompl
aint
by
City,
Aug
ust 2
005
thro
ugh
Octo
ber
2010
Kan
sas
Kans
as C
ity60
%37
%28
%11
%5%
7%12
%
Inde
pen
denc
e10
%33
%47
%5%
4%5%
5%
Blue
Sp
rings
2%47
%33
%0%
13%
7%0%
Lee'
s Su
mm
it2%
56%
25%
0%13
%0%
6%
2010
Sour
ce:
HUD’
s Kan
sas C
ity K
ansa
s
Mis
sou
ri
Kans
as C
ity18
%49
%24
%8%
6%2%
10%
Leav
ensw
orth
1%22
%33
%11
%22
%0%
11%
Ove
rlan
d Pa
rk7%
35%
42%
13%
4%4%
2%
Shaw
nee
3%35
%50
%5%
0%5%
5%
Regi
onal
Offi
ce of
Fair
Hous
ing a
nd E
qual
Op
portu
nity
(FHE
O).
37

Iden
tifie
d Im
pedi
men
ts: C
ityId
entif
ied
Impe
dim
ents
: City
City
Impe
dim
ent N
o. 2
.Afri
can A
mer
icans
and
Hisp
anics
hav
e muc
h hig
her l
oan d
enia
l ra
tes t
han W
hite
s and
Non
-Hisp
anics
. In 2
009,
ther
e wer
e app
roxim
atel
y 117
,700
at
est
ate
sad
osp
acs
009,
te
ee
eapp
oat
ey
,00
mor
tgag
e loa
n app
licat
ions
mad
e in t
he K
ansa
s City
MSA
. For
the r
egio
n ove
rall,
64%
of
loan
s wer
e app
rove
d an
d 16
% d
enie
d (th
e oth
ers w
ere w
ithdr
awn b
y the
appl
icant
s, clo
sed
for i
ncom
plet
enes
s, et
c).
Loan
den
ial r
ates
wer
e muc
h hig
her f
or A
frica
n Am
erica
n and
Hisp
anic
appl
icant
s acr
oss
all c
omm
uniti
es.
38

Iden
tifie
d Im
pedi
men
ts: C
ityId
entif
ied
Impe
dim
ents
: City
City
Impe
dim
ent N
o. 3
.Citi
es co
uld
impr
ove s
ome a
spec
ts of
thei
r zon
ing a
nd la
nd us
e re
gula
tions
. Sec
tion V
of th
is AI
cont
ains
a co
mpr
ehen
sive r
evie
w of
the p
artic
ipat
ing
egu
ato
sSe
cto
ot
sco
tasa
cop
ee
se
ee
ot
epa
tcpa
tg
juris
dict
ions
’ land
use a
nd ho
usin
g pol
icies
, inclu
ding
thos
e of t
he p
ublic
hous
ing
auth
oriti
es. A
lthou
gh th
e rev
iew
did
not f
ind
egre
giou
s vio
latio
ns of
the F
eder
al Fa
ir Ho
usin
g Act
, it d
id id
entif
y are
as th
at m
ay ca
use b
arrie
rs to
affo
rdab
le ho
usin
g de
velo
pmen
t Th
ese i
nclu
de:
deve
lopm
ent.
Thes
e inc
lude
:No
juris
dict
ions
pro
vide f
orm
al in
cent
ives t
o en
cour
age t
he d
evel
opm
ent o
f affo
rdab
le a
nd
mixe
d-in
com
e hou
sing.
Not a
ll hou
sing a
utho
ritie
s allo
w re
siden
ts to
appl
y for
pub
lic ho
usin
g uni
ts an
d/or
Sec
tion 8
g
ppy
pg
/vo
uche
rs b
y mai
ling i
n an a
pplic
atio
n or c
ompl
etin
g an a
pplic
atio
n onl
ine.
Suc
h pol
icies
can
prev
ent p
erso
ns w
ith d
isabi
litie
s fro
m fa
irly a
cces
sing h
ousin
g.
Thre
e pub
lic ho
usin
g aut
horit
ies h
ave f
ewer
than
5%
of th
eir p
ublic
hous
ing u
nits
that
are
acce
ssib
le.
Deve
lopm
ent f
ees i
n Joh
nson
Cou
nty,
and,
to a
less
er ex
tent
, Lea
venw
orth
and
Blue
Spr
ings
, ar
e hig
h rel
ative
to ot
her j
urisd
ictio
ns.
The C
onso
lidat
ed P
lans
of O
verla
nd P
ark,
Sha
wnee
and
KCM
O do
not
cont
ain t
he ci
ties’
anti-
disp
lace
men
t and
relo
catio
n pol
icies
39
disp
lace
men
t and
relo
catio
n pol
icies
.
Shaw
nee r
equi
res a
spec
ial p
erm
it fo
r gro
up ho
mes
(all o
f the
oth
er ju
risdi
ctio
ns p
erm
it by
righ
t).

Iden
tifie
d Im
pedi
men
ts: C
ityId
entif
ied
Impe
dim
ents
: City
City
Impe
dim
ent N
o. 4
.In a
ll but
one c
ity, r
esid
ents
have
180
day
s or l
ess t
o file
co
mpl
aint
s. Al
lege
d vic
tims h
ave o
ne ye
ar fr
om th
e dat
e of d
iscrim
inat
ion t
o file
a fa
ir co
pa
tseg
edct
sa
eoey
eao
ted
ateo
dsc
ato
toea
aho
usin
g com
plai
nt w
ith H
UD. I
n all b
ut on
e of t
he ju
risdi
ctio
nal o
rdin
ance
s (Bl
ue S
prin
gs,
which
has n
o tim
e lim
it) th
e per
iod
is m
uch s
horte
r, ra
ngin
g fro
m 6
0 to
180
day
s. It
has
been
argu
ed at
the f
eder
al le
vel t
hat H
UD’s
1 ye
ar st
atut
e of l
imita
tion i
s too
shor
t to
allo
w id
entif
icatio
n of c
erta
in fa
ir ho
usin
g vio
latio
ns in
cludi
ng p
reda
tory
lend
ing
allo
w id
entif
icatio
n of c
erta
in fa
ir ho
usin
g vio
latio
ns, in
cludi
ng p
reda
tory
lend
ing
activ
ities
(e.g
., so
me v
ery h
igh c
ost l
oans
offe
r tea
ser r
ates
dur
ing t
he fi
rst y
ear a
nd th
en
rese
t afte
r one
year
).
Durin
g the
pub
lic in
put p
roce
ss m
any p
artic
ipan
ts st
ated
that
the f
irst t
hing
they
wou
ld
Durin
g the
pub
lic in
put p
roce
ss, m
any p
artic
ipan
ts st
ated
that
the f
irst t
hing
they
wou
ld
do if
face
d wi
th d
iscrim
inat
ion i
s “m
ove/
find
anot
her u
nit”
and
worry
abou
t fili
ng a
com
plai
nt la
ter.
A 60
day
win
dow
durin
g whi
ch to
file
a co
mpl
aint
may
not
allo
w al
lege
d vic
tims e
noug
h tim
e to f
ile a
com
plai
nt if
they
are
unaw
are w
ho to
cont
act a
nd ar
e ki
hi
f
ii
di
ii
i I
ddi
i
h fi
li
seek
ing o
ut ne
w ho
usin
g afte
r exp
erie
ncin
g disc
rimin
atio
n. In
addi
tion,
a sh
ort f
iling
wi
ndow
doe
s not
allo
w fo
r the
det
ectio
n of m
any f
air l
endi
ng vi
olat
ions
.
All o
f the
citie
s cov
ered
in th
is AI
shou
ld ex
tend
tim
e per
iod
for w
hich
resid
ents
can f
ile
fi
hi
g l
it
t t
lt 1
40
fair
hous
ing c
ompl
aint
s to a
t lea
st 1
year
.