Embed Size (px)
Citation preview

1
Analysis of Human-Robot Interaction at the DARPA Robotics Challenge Finals
Adam Norton1, Willard Ober2, Lisa Baraniecki3, Eric McCann4, Jean Scholtz5, David Shane2, Anna Skinner3, Robert Watson2, and Holly Yanco4
1New England Robotics Validation and Experimentation (NERVE) Center, University of Massachusetts Lowell, 1001 Pawtucket Blvd, Lowell, MA 01854, [email protected] 2Boston Engineering Corporation, 300 Bear Hill Road, Waltham, MA 02451, {wober, dshane, rwatson}@boston-engineering.com 3AnthroTronix, 8737 Colesville Rd, Silver Spring, MD 20910, {lisa.baraniecki, anna.skinner}@atinc.com 4Computer Science Department, University of Massachusetts Lowell, 1 University Ave, Lowell, MA 01854, {emccann, holly}@cs.uml.edu 5Pacific Northwest National Laboratory, 902 Battelle Blvd, Richland, WA 99394, [email protected]
Abstract In June 2015, the Defense Advanced Research Projects Agency (DARPA) Robotics Challenge (DRC) Finals were held in Pomona, California. The DRC Finals served as the third phase of the program designed to test the capabilities of semi-autonomous, remote humanoid robots to perform disaster response tasks with degraded communications. All competition teams were responsible for developing their own interaction method to control their robot. Of the 23 teams in the competition, 20 consented to participate in this study of human-robot interaction (HRI). The evaluation team observed the consented teams during task execution in their control rooms (with the operators), and all 23 teams were observed on the field during the public event (with the robot). A variety of data were collected both before the competition and on-site. Each participating team’s interaction methods were distilled into a set of characteristics pertaining to the robot, operator strategies, control methods, and sensor fusion. Each task was decomposed into subtasks that were classified according to the complexity of the mobility and/or manipulation actions being performed. Performance metrics were calculated regarding the number of task attempts, performance time, and critical incidents, which were then correlated to each team’s interaction methods. The results of this analysis suggest that a combination of HRI characteristics, including balancing capabilities of the operator with those of the robot and multiple sensor fusion instances with variable reference frames, positively impacted task performance. A set of guidelines for designing HRI with remote, semi-autonomous humanoid robots is proposed based on these results.
1. Introduction In 2000, urban search and rescue (USAR) was suggested as a grand challenge for robotics, given the many complex challenges associated with performing tasks in obstacle-ridden, unknown, and dynamic environments in which humans may not be able to safely or efficiently venture, and in which time may be of the essence [Kitano, 2000]. In 2001, several roboticists working with search and rescue teams operated small, unmanned vehicles in the rubble after the World Trade Center disaster in New York; the

2
results of this real-world usage further emphasized the deficiencies and pervasive challenges presented by such complex and dangerous task conditions [Micire, 2002]. Shortly after the Fukushima Daiichi disaster in March 2011, additional robots were sent in to navigate inside the reactors. This type of scenario is, at least theoretically, ideal for the use of robotics as robots can operate in such hazardous conditions, and ideally can operate semi-autonomously with supervisory control provided from a human operator in a safe location. In June 2011, additional robots were used at Fukushima Daiichi with the goals of venturing into areas that were unsafe for humans and performing needed tasks. However, the state of robotics technologies at that time was far from sufficient to support effective teleoperation to complete such tasks [Nagatani et al., 2013]. In response to these events, the Defense Advanced Research Projects Agency (DARPA) launched a research and development initiative in the form of a challenge in which roboticists from academia, industry, and research institutions would compete to develop human-supervised robots, mostly humanoids, capable of executing a variety of tasks relevant to disaster response and USAR. The DARPA Robotics Challenge (DRC) consisted of three events: a Virtual Robotics Challenge (VRC), the DRC Trials, and the DRC Finals. This paper presents the findings of a study of human-robot interaction (HRI) conducted at the DRC Finals in June 2015. Given the competition format, the tasks and the conditions under which they are performed is the same across all teams. Teams were responsible for developing their own interaction methods to perform these tasks, of which varied from one another, but many of the same core HRI techniques were implemented. This analysis uses each team’s performance at the DRC Finals to determine which of these HRI techniques were most effective. During the competition, our evaluation team observed operators in the control room and robots on the field, recording performance on a minute-by-minute basis by visual means. After the competition, each pair of observations was combined and validated by watching recorded video. The DRC Finals tasks were broken down into subtasks by the evaluation team and assigned a category based on the robotic mobility and manipulation activities needed to complete them (subtask functions). Each team’s interaction method was distilled into categories of HRI characteristics they exhibited based on the type of data displays, input techniques, and operator roles utilized. The performance of each team when attempting actions of each subtask function (including critical incidents and completion time) was then correlated to the HRI techniques exhibited during competition performance. Comparisons of resulting performance between differing HRI techniques were calculated to determine those that were most effective. The findings suggest that factors like control methods, sensor fusion, and operator layout strategies had significant impact on the competition. Lessons learned and guidelines for designing HRI with remote humanoid robots, as informed by this study, are presented at the end of this article.
2. Background and Related Work In addition to supporting the development of enabling technologies that will allow future robots to help humans respond to natural and man-made disasters, the DRC sought to advance the state of the science in robotics and artificial intelligence (AI) in two ways: by increasing the functionality of supervised autonomy, and by increasing the capability of hardware/software platforms to adapt to task and environmental variations. Such advances in robotics would enable those responding to such events to be better prepared and more successful than in past events. During the DRC Trials and Finals, DARPA simulated environmental variations in order to challenge functional characteristics of autonomy, including periods of low bandwidth, high latency, and intermittent communication. Robots with higher

3
levels of autonomy could continue to perform effectively at times during which command and control from a human operator were functionally reduced due to degraded communications. A secondary outcome of the DRC was to further the design of human-robot interaction (HRI) by emphasizing supervisory control methodologies, which were deliberately designed by many teams during the DRC Trials (e.g., [DeDonato et al., 2015; Fallon et al., 2015; Johnson et al., 2015; Kohlbrecher et al., 2015; Radford et al., 2015; Stentz et al., 2015; Zucker et al., 2015]). These methodologies are designed to leverage the strengths of the human decision-maker by seamlessly integrating human and machine capabilities to complete tasks that, owing to conditions characteristic of disaster environments, could not be directly performed by a human. Such progressions in the field of HRI have the potential to not only further the capabilities of interface design, but they have the potential to both better identify requirements for the robot systems to be controlled, and render a better understanding of the contexts in which such interaction technologies are utilized. Ultimately, such contributions have inherent implications for both operator training and field operating procedures. One of the most critical issues encountered in task-oriented HRI is achieving the right balance of human control/supervision and robot autonomy. Effective interaction methodologies must be centered on optimizing this balance by tasking the robot in ways that leverage its strengths while utilizing the skills, affordances, and capabilities that are superior in humans such as decision-making, strategic thinking, perceptual capabilities, and overall task awareness [Settimi et al., 2014]. For example, current semi-autonomous control paradigms dictate that the robot focuses on low-level tasks such as terrain transversal while the human maintains high-level control and supervision such as designating the direction of motion or an end point to be reached. A critical aspect of this control architecture is the interface design. Specifically, Settimi et al. [2014] assert that an effective semi-autonomous framework for humanoid robot control in disaster scenarios must enable the operator to 1) issue symbolic commands to the robot, 2) select the level of autonomy with which the robot performs each task, and 3) receive visual and status feedback from the robot. They also specify that the interface must be designed to be modular and reconfigurable in order to support interaction with multiple types of robots and to account for variations in tasks and environmental conditions. An initial study of HRI was conducted at the DRC Trials [Yanco et al., 2015]. A total of 16 teams participated in the DRC Trials in December 2013; 8 of the competing teams participated in the study. Teams that agreed to participate in the HRI study were interviewed and observed during the DRC Trials, and their performance was correlated to their interaction techniques with the goal of identifying areas for improvement that would lead to better HRI design and overall robot performance in the DRC Finals. Participating teams’ robots were observed from the field as well as in their control rooms (with the operators), with observers noting a variety of performance metrics based on critical incidents and utterances. These data were used to categorize the various interaction methods according to number of operators, control methods, and amount of interaction. Detailed HRI data were collected at the Trials, the results of which were culled, analyzed, and used to identify guidelines for improving HRI within the context of the task conditions presented by the DRC Trials and Finals events. The resulting guidelines included 1) increase sensor fusion, 2) decrease number of operators, 3) decrease the amount of operator input needed to control the robot, 4) don’t separate the robot into legs and arms, 5) plan for low bandwidth, and 6) design for the intended users. Other studies of robotic competitions have used combinations of directly observable measures of task performance for more holistic systems evaluation [Pellenz et al., 2014] and subsystem evaluation using an automated process made possible with access to team software and code [Amigoni et al., 2015]. However, many of these methodologies focus on ranking, as did the DRC Finals, where the best run per
4
team was used for scoring. The analysis presented in this article focuses on metrics including task completion, duration, and errors, to investigate the impact of HRI on performance. Similar studies of HRI have been performed on robotic competitions such as at the AAAI/RoboCup Robot Rescue Competition [Yanco and Drury, 2007] and of real world disaster response events [Murphy and Burke, 2005].
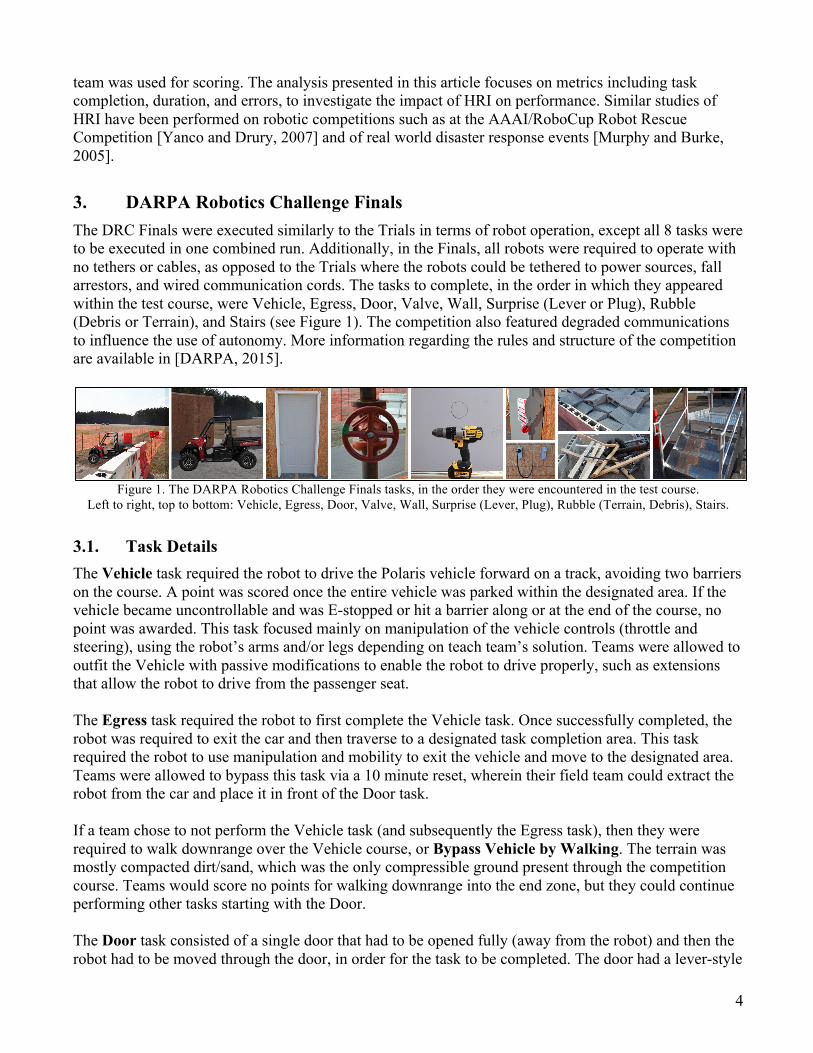
3. DARPA Robotics Challenge Finals The DRC Finals were executed similarly to the Trials in terms of robot operation, except all 8 tasks were to be executed in one combined run. Additionally, in the Finals, all robots were required to operate with no tethers or cables, as opposed to the Trials where the robots could be tethered to power sources, fall arrestors, and wired communication cords. The tasks to complete, in the order in which they appeared within the test course, were Vehicle, Egress, Door, Valve, Wall, Surprise (Lever or Plug), Rubble (Debris or Terrain), and Stairs (see Figure 1). The competition also featured degraded communications to influence the use of autonomy. More information regarding the rules and structure of the competition are available in [DARPA, 2015].
Figure 1. The DARPA Robotics Challenge Finals tasks, in the order they were encountered in the test course.
Left to right, top to bottom: Vehicle, Egress, Door, Valve, Wall, Surprise (Lever, Plug), Rubble (Terrain, Debris), Stairs.
3.1. Task Details The Vehicle task required the robot to drive the Polaris vehicle forward on a track, avoiding two barriers on the course. A point was scored once the entire vehicle was parked within the designated area. If the vehicle became uncontrollable and was E-stopped or hit a barrier along or at the end of the course, no point was awarded. This task focused mainly on manipulation of the vehicle controls (throttle and steering), using the robot’s arms and/or legs depending on teach team’s solution. Teams were allowed to outfit the Vehicle with passive modifications to enable the robot to drive properly, such as extensions that allow the robot to drive from the passenger seat. The Egress task required the robot to first complete the Vehicle task. Once successfully completed, the robot was required to exit the car and then traverse to a designated task completion area. This task required the robot to use manipulation and mobility to exit the vehicle and move to the designated area. Teams were allowed to bypass this task via a 10 minute reset, wherein their field team could extract the robot from the car and place it in front of the Door task. If a team chose to not perform the Vehicle task (and subsequently the Egress task), then they were required to walk downrange over the Vehicle course, or Bypass Vehicle by Walking. The terrain was mostly compacted dirt/sand, which was the only compressible ground present through the competition course. Teams would score no points for walking downrange into the end zone, but they could continue performing other tasks starting with the Door. The Door task consisted of a single door that had to be opened fully (away from the robot) and then the robot had to be moved through the door, in order for the task to be completed. The door had a lever-style

5
handle that could be actuated in either direction to open the door. The door was not weighted; however, wind could cause resistance in either direction. Manipulation was used to actuate the lever and push the door open. Once the door was fully opened, it was held in place by a magnet to prevent it from swinging back and damaging the robot. Mobility was used to move through the door frame. Some robots were too wide to walk through the door normally and as a result had to sidestep through the door. The Valve task consisted of a single wheel valve with four spokes that needed to be rotated 360° counter clockwise. The focus of this task was manipulation, but mobility was used to walk to position the robot in front of the valve. The majority of teams used a single gripper to rotate the valve, but the robots used different methods for performing the actual rotation. The Wall task consisted of a circular wall segment that had to be cut and removed. The robot had to first traverse to where two shelves were mounted on a wall. One shelf, 0.8m above the ground, held one of each type of drill. The other shelf, 1.1m above the ground, also held one of each type of drill. One drill was a standard perpendicular drill with a side handle; the other drill was a rotary cut tool. The perpendicular drill required the robot to depress the button for the entire time it was used to cut, whereas the rotary cut out tool was activated by depressing an on switch once (after 5 minutes the drill shut off and had to be retriggered). This task focused on manipulation, but required mobility to position the robot in front of the shelves and wall. The Surprise task consisted of three possible tasks: pull a lever down, remove a plug from a socket and plug it into another socket, or open a box and push a button. On the first day of the competition, the Surprise task was the lever (Surprise-Lever) and on the second day it was the plug and socket (Surprise-Plug). Each of the surprise tasks focused on manipulation and only required mobility to position the robot in front of the task. The Rubble task consisted of either a debris field (Rubble-Debris) or a terrain field (Rubble-Terrain); each required the robot to successfully traverse the field in order to score a point. The debris field was focused mainly on mobility, but could include manipulation if the robot were to actively remove debris (many robots that chose debris just drove right through, pushing the debris out of the way). The terrain field was made up of cinder blocks at varying orientations to induce pitch/roll challenges for planning footfalls, thus was entirely focused on mobility. The Stairs task consisted of a staircase with four steps and a railing only on the left side. The robot was required to ascend the stairs to the top platform in order to receive a point. This task was focused on mobility, but there was an opportunity to use manipulation to grasp the railing as the robot ascended.
3.2. Communications Two communication settings were implemented during the competition: one for outdoor tasks (Vehicle, Egress, Door, Stairs) and another for indoor tasks (Valve, Wall, Surprise, Rubble). Teams had a high and low bandwidth line to communicate from their control room to the robot. The high bandwidth line was limited to ≤300 Mbit/sec (which included data to the robot and data from the robot) whereas the low bandwidth line was limited to a data rate of 9600 bit/sec. The teams had the option to send data on either line at their discretion. When executing outdoor tasks, both communication lines were fully available for teams to use, but during indoor tasks the high bandwidth line was degraded. It experienced blackout periods spanning from 1 to 30 seconds, which became progressively shorter as the run time increased. The limitation in communications was used as a method to reward teams with effective autonomous processes while also reflecting realism of a disaster response scenario. The low bandwidth line was

6
constant, and allowed for smaller pieces of data (such as joint encoder values) to be transmitted independent of location/time on the course.
3.3. Scoring Teams performed two runs, one per competition day, which were scored individually. For each completed task, teams received one point, with the exception of Bypass by Walking for which no point was awarded upon completion. The highest scoring run, based on total points scored, was used for the final ranking. Teams with equivalent scores were ranked by shortest task completion time over longer times. Task time was cumulative and was recorded until the last point that was scored for a run. For example, if a team completed the first three tasks in 9 minutes and spent 51 minutes trying unsuccessfully to complete the remaining tasks, then their score was 3 and task time was 9 minutes. If a reset was called, the team was required to take a minimum time penalty of 10 minutes. Teams had 60 minutes to complete a run.
4. Methodology The methodology used is very similar to that of our study of the DRC Trials [Yanco et al., 2015]. Additions and changes to the methodology for the DRC Finals were pre-competition team visits (for those teams who opted to participate in them), more in-depth and targeted interviews on-site at the DRC Finals, and fewer teams performing simultaneously allowed for a more detailed analysis of the Finals. For example, the schedule of the DRC Finals allowed our team to observe all of the public robot runs on the field, and all runs were observed from the control room for teams who consented. This study was approved by the Institutional Review Board (IRB) at the University of Massachusetts Lowell. For anonymization purposes, no teams who consented to participate in this study are referenced by name throughout this paper. It should be noted that this study was of a competition and not a controlled experiment. While the evaluation team had access to many of the DRC Finals competing teams, our data streams are limited to in-person interviews, observable actions on the field and in the control room, and reviewing video footage. The metrics considered in this analysis are primarily those that can be directly observed. Our goal was to not interfere with task execution by the teams who consented to participate in the study. As such, some metrics for HRI with respect to autonomous operations or shared autonomy [Steinfeld et al., 2006; Murphy and Schreckenghost, 2013] are not applicable as explicit measures, given the limitation of collecting data in a competition setting. The same limitations would hold for a real field deployment (see, for example, [Burke, 2004]).
4.1. Team Interviews Approximately two months prior to the competition, the DRC Finals teams were invited to participate in this study via email and offered either a pre-competition visit to their home site for a more comprehensive interview and/or an on-site interview at the competition venue. Both interview types allowed for better insight into how each team’s interaction method functioned, and improved the accuracy of control room observations during the competition. Seven teams consented to pre-competition visits, each lasting 3-6 hours. The aim of these visits was to understand the team’s strategy for performing in the competition and to get a preview of the state of their robot’s performance and interaction methods. Each team was observed practicing task execution

7
while members of the evaluation team recorded photos, videos, and notes on many aspects of their HRI, such as:
• Robot: type, modifications from base platform, additional cameras/sensors, balancing, gripper types, preventative behaviors (e.g., falls, overheating)
• Operators: number, roles, coordination, task-specific operators, preparation • Interface: control methods, output modalities, use of simulation, autonomy levels, sensor fusion
displays, support of simultaneous operators, task-specific configurations • Communications: outdoor vs. indoor bandwidth techniques, compensatory autonomy • Tasks: most and least confident to perform, strategies for each, Surprise/Rubble preferences • Progress: implementation of HRI, practice time, operator training and procedures
Additional recruiting was performed over e-mail and on-site at the competition venue, resulting in a total of 20 of the 23 competing teams electing to participate in our study. Similar interviews were performed on-site, albeit in a compressed time period, for newly recruited teams and to update the previously interviewed teams. All of this information was used to generate a set of documents outlining each team’s interaction method. These documents were studied by the evaluation team before observing each run on the field or in the control room, enabling a better understanding of what the teams were doing while operating their robots. Observers in the control room also had an opportunity to question team members just after their run was over to provide additional context or explanation for any actions observed.
4.2. Data Collection Data collection sheets to be used for recording handwritten field and control room observations were designed and given to all observers. During each run, the field observer recorded robot movements, critical incidents, and points scored during task execution on a minute-by-minute basis. The same was done by the observer in the control room, but was focused on control methods used by each operator during task execution, input devices, data displays visible, and task-relevant dialog between operators. Four different teams ran simultaneously during the DRC Finals. The evaluation team consisted of nine observers operating in pairs between the field and control room, with one additional observer for control rooms that used more complex interaction methods. Three members of the evaluation team were dedicated to observing control rooms and six alternated between field and control room observations. The evaluation team exercised the recording of data during the team rehearsal and practice runs conducted prior to the competition days. During this exercise, multiple observers recorded the actions in one team’s control room while another set of observers did the same for that team’s robot on the field. Afterwards, the observations were compared to ensure each observer was taking notes in a similar level of detail and to calibrate how to properly classify critical incidents (see section 5.4) and describe the HRI techniques exhibited. During the competition, a total of 49 runs (2 runs per team, plus 3 re-runs) were observed from the field, and 43 from the control room.
5. Analysis Methods The analysis of performance metrics relied primarily on the data collected by the field and control room observers and the team interaction method outline documents. Additionally, video recordings of the field (all teams) and control rooms (consented teams only), made available by DARPA, were used to verify team HRI characteristics, task success/failure, and critical incidents.

8
A single person combined the field and control room data sheets, then used the video to review any conflicting observations. A second person was used to verify that all of our team members conducting field observations coded according to the definitions, using Cohen’s Kappa for inter-coder reliability, as described in section 5.6. The interaction method characteristics and their categories outlined in section 5.5 were determined based on the pre-competition team interviews and observations from the control rooms. The characteristics were then used to classify each interaction between the operator and robot when performing tasks.
5.1. Task and Subtask Breakdown The point structure for the DRC Finals was simplified compared to the Trials, in that only 1 point could be earned for completing each task, rather than awarding points for completing subtasks. The robot had to perform a series of mobility and manipulation actions to complete each task; many of the tasks required similar motions to that of other tasks. It was also observed that performing teams were using similar interaction techniques across multiple tasks. To better determine effective HRI methods across more broad robotic actions performed to accomplish tasks, we increased the granularity of observable robot performance: each task was broken down into subtasks, which are completion milestones that needed to be performed to achieve their parent task (e.g., Task: Door; Subtasks: Traverse to door, Open door, Traverse through doorway) and subtask actions, which are individual robot motions performed to complete some subtasks (e.g., Subtask: Open door; Actions: Align with door, Grasp/unlatch handle, Push door open). All possible actions needed to complete a subtask were defined even though some teams did not perform them (e.g., some teams did not have to push the door open if it swung open on its own due to wind). If a team did perform a particular subtask action on a task, but another team did not, the former team simply provided an additional observable data point to be evaluated (e.g., the more actions performed to complete a task, the more opportunities for failure). The Finals tasks were divided into 11 tasks, 25 subtasks, and 37 subtask actions. Note that some subtasks did not have defined subtask actions if there were not directly observable and discernable steps taken to complete them (mostly for subtasks that involved traversing from one task to another). See Table 1 for the full task breakdown. Each task, subtask, and subtask action was then categorized by the type of manipulation and mobility activities that it required to be completed, referring to the type of robot motion (i.e., mobility for locomoting the entire body of the robot through the task space, or manipulation for maneuvering the robot’s arms and grippers to interact with the task apparatus) required to perform it with respect to the robots surroundings (e.g., obstructions to be avoided) and objects being manipulated (e.g., tool operations). Similar breakdowns/taxonomies have been developed for bipedal locomotion [Torricelli et al., 2015] and hand-centric manipulation [Bullock, Ma, and Dollar, 2013], but are primarily focused on primitive motions only. The breakdown used in this study does not consider elements or types of robot perception needed to complete each of the tasks, as this level of information was not available for all competing teams, particularly during task execution. Many of the tasks in the DRC overlap with respect to the type of robot capability required to complete them in this regard. By categorizing each action, it allows for a richer set of data points to be drawn from the competition performance, and enables this analysis method to be used for robot manipulation or mobility in other venues/activities. Six subtask functions were defined:
• Unobstructed Traverse (UT): Mobility over flat, open ground (e.g., walking from the Valve to the Wall)

9
• Obstructed Traverse - Foot (OTF): Mobility over ground with obstructions that pose challenges to the robot's lower extremities (e.g., walking over the blocks in Rubble-Terrain)
• Obstructed Traverse - Robot (OTR): Mobility over ground with obstructions that pose challenges to the robot's entire body (e.g., walking through the Door)
• First Order Manipulation (FOM): Fine or coarse manipulation and use of the end effector (e.g., rotating the Valve wheel)
• Second Order Manipulation (SOM): Interacting with a non-affixed object, guiding the end effector of the object (e.g., moving the drill to cut the Wall)
• Third Order Manipulator (TOM): Manipulating a system with its own control loop (e.g., driving the Vehicle)
By coding each as one or more of these functions, broader conclusions about HRI when performing certain types of activities with humanoid robots (rather than just specific tasks) can be determined by using performance metrics that correspond to subtasks of each function. Of the 25 subtasks, there are 16 mobility subtasks (9 UT, 4 OTF, and 5 OTR) and 9 manipulation subtasks (7 FOM, 2 SOM, and 1 TOM). The full subtask breakdown can be found in Table 1.
5.2. Attempts Each task/subtask could be attempted multiple times during a run, as needed. One metric for attempts is the ultimate success or failure of attempts. If a task or subtask was marked as failed, then it was either consciously abandoned by the team, left incomplete due to time expiration, or a fall and/or reset caused it to be unable to be completed. A second or third attempt at the task/subtask could be performed if it was consciously abandoned or left incomplete due to a fall and/or reset. Success is defined as completion that allows for another task/subtask to be attempted, outside of time constraints. This metric differs from the DRC's official ruling for completing tasks towards scoring points. For example, the criteria for scoring a point on Rubble-Terrain is that the entire body of the robot must be beyond a line on the ground after the terrain pile. If the robot were to fall over the line, it could earn the point, but most instances like this were followed by a reset, whereby members of the field team intervened and stood the robot back up. For our analysis, a situation like this would be considered a failed attempt, regardless of whether or not a point was scored. A more detailed metric for attempts is the percentage of failed attempts, or the amount of failure/errors that occurred while performing the task/subtask, regardless of whether or not it was ultimately successful or not. This metric is calculated as follows:
• Subtasks: Total failed attempts for all child subtask actions / total attempts for all child subtask actions (if a subtask does not have child subtask actions, then the ultimate success/failure metric is used)
• Tasks: Total failed attempts for all child subtasks / total attempts for all child subtasks without child subtask actions and those for all grandchild subtask actions
This metric best represents each team's particular control method and strategy for performing each task/subtask. For example, a team that uses multiple actions to perform a subtask (e.g., grasp the Valve wheel, rotate 90 degrees, release, repeat three more times) has more attempts that have the possibility of failing versus a team that uses one action to perform a subtask (e.g., grasp the Valve wheel, rotate 360 degrees, release) has fewer attempts that can fail. It should be noted that this metric weighs all subtasks and subtask actions equally.

10
T/S/A Task/Subtask Name
UT OTF OTR FOM SOM TOM T/S/A Task/Subtask Name UT OTF OTR FOM SOM TOM
T Vehicle ✔ T Surprise-Lever ✔ ✔
S Drive through course ✔ S Traverse to Lever ✔
A Steer vehicle to avoid barriers ✔ S Pull lever down completely ✔
A Depress and release pedal ✔ A Contact/grasp lever ✔
T Bypass Vehicle by Walking ✔ A Pull lever down ✔
S Traverse beyond finish line avoiding Jersey barriers ✔ A Release grasp on switch ✔
T Egress ✔ ✔ T Surprise-Plug ✔ ✔ ✔
S Prepare robot for egress ✔ S Traverse to Plug ✔
S Extract robot entirely from vehicle ✔ S Remove plug from left
receptacle ✔
S Transit to the 'reset box' ✔ A Contact/grasp plug in left receptacle ✔
T Door ✔ ✔ ✔ ✔ A Pull plug out of left receptacle ✔
S Traverse to Door ✔ S Insert plug in right receptacle ✔ ✔
S Open door ✔ A Insert plug in right receptacle ✔
A Align with door ✔ A Release grasp on plug ✔
A Grasp/unlatch handle ✔ T Rubble-Debris ✔ ✔ ✔
A Push Door Open ✔ S Traverse to Rubble Pile ✔
S Traverse through doorway ✔ ✔ S Bull rush through ✔ ✔
A Align with passageway ✔
T Valve ✔ ✔ A Move debris out of way ✔ ✔
S Traverse to valve ✔ T Rubble-Terrain ✔ ✔
S Complete valve rotation ✔ S Traverse to Terrain Pile ✔
A Align with valve ✔ S Traverse over terrain pile ✔
A Grasp/Contact valve ✔ A Ascend first tier ✔
A Rotate valve ✔ A Ascend second tier ✔
A Release valve ✔ A Ascend third tier ✔
T Wall ✔ ✔ ✔ A Descend to fourth tier ✔
S Traverse to shelf ✔ A Descend to fifth tier ✔
S Grasp and activate drill ✔ A Descend to ground ✔
A Grasp drill ✔ T Stairs ✔ ✔
A Power drill on ✔ S Traverse to Stair Entrance ✔
S Traverse to wall (with drill in hand) ✔ S Ascend stairs ✔
S Cut opening in wall ✔ A Align with stairs ✔
A Align with wall ✔ A Ascend first stair ✔
A Position arm ✔ A Ascend second stair ✔
A Cut profile ✔ A Ascend third stair ✔
A Remove wall piece ✔ A Ascend fourth stair ✔
A Extract arm and drill ✔ A Ascend fifth stair (top of platform) ✔
Table 1. Breakdown of each task (T) into subtasks (S) and subtask actions (A) and their corresponding functions. Note: all tasks are assigned functions based on their subtasks’ functions.

11
5.3. Duration Each subtask was marked with a start and end time, which was derived from the data collection sheets used at the competition. The end time of one subtask was used as the start time for the next subtask that was attempted. If a subtask started and ended within the same minute, it was given a value of 30 seconds. The duration for a task was the sum of its subtask durations. Subtask actions were not given durations as each action could have occurred multiple times. For analysis purposes, the duration for a specific task/subtask to be completed is expressed as a percentage of the average duration for that task/subtask to be completed across all runs for all teams, referred to as relative duration. For example, the average aggregate duration for the Surprise-Plug task is 11.42 minutes. If a team’s actual duration to complete that task is 7 minutes, then the relative duration is expressed as 7 / 11.42 = 61.3%. Any values below 100% are faster than the aggregate and any above 100% are slower. The same is done for subtasks.
5.4. Critical Incidents A total of 9 possible critical incidents were identified as possible occurrences during task execution that are indications of potential failures and/or a lack of situation awareness. They are defined as:
• Tip (T): The robot begins to lean noticeably to one side unintentionally. • Hit (H): Part of the robot makes contact with the environment unintentionally. • Trip (Tr): The robot's foot/leg snags part of the environment causing it to tip or fall to one side. • Miss (M): The robot attempts to grasp something or place a footfall and misses. • Stuck (St): Part of the robot is stuck on or in the environment, potentially causing a trip or fall. • Slip (S): The robot's limb slips off of part of the environment. • Drop (D): An object the robot was carrying is dropped unintentionally. • Fall (F): The robot falls over and makes contact with the environment, which may be followed
by a reset. • Reset (R): A team calls for a reset to intervene and fix something about the robot.
The occurrence of a critical incident was noted if it was visually observed being performed by the robot, according to the definitions above, on the field and/or by observations of the operators in the control room. All critical incidents noted during the competition were confirmed using video footage afterwards. A total of 87 critical incidents were observed, of which 31 were falls, 14 were resets not prompted by falls, and the remaining 42 were other critical incidents. Every task or subtask attempt presents another opportunity for a critical incident to occur; as such, multiple critical incidents can occur within the same attempt. For analysis purposes, critical incidents are expressed as an average number of critical incidents per attempt. This allows for comparisons of critical incidents (or lack thereof) between teams on the same task, subtask, and/or subtask function. Values below 100% mean that at least 1 other attempt was successful at that task/subtask, but any values greater than or equal to 100% means that every attempt resulted in at least one critical incident. Table 2 outlines all observed critical incidents.

12
Vehicle Bypass
Vehicle by Walking
Egress Door Valve Wall Surprise- Lever
Surprise- Plug
Rubble- Debris
Rubble- Terrain Stairs
Number of teams to attempt 19 4 9 22 17 12 10 11 6 6 8
Percentage of all teams to attempt 82.6% 17.4% 39.1% 95.7% 73.9% 52.2% 43.5% 47.8% 26.1% 26.1% 34.8%
Total falls 0 4 3 12 2 3 1 1 1 3 1 Total resets (not caused by falls) 4 3 2 2 1 2 0 0 0 0 0
Total other critical incidents
1 2 1 9 0 15 3 8 2 1 0 Hit: 1 Stuck: 2 Stuck: 1 Miss: 5
Stuck: 4 n/a Tip: 1 Hit: 7
Miss: 6 Drop: 1 Miss: 2 Stuck: 1
Hit: 2 Miss: 4 Drop: 2
Trip: 1 Stuck: 1
Tip: 1 n/a
Table 2. Number of teams (out of 23) that attempted each task and the total critical incidents on each task
Critical incidents have the potential to provide insight into relative task difficulty (discussed further in section 6.1) and can highlight issues that would be the most detrimental in a real world disaster scenario. Using the failure taxonomy developed by Carlson and Murphy [2005], critical incidents can be classified as “terminal failures” (those that result in termination of a mission or run) or “non-terminal failures” (those that may reduce the capability of the robot, but do not terminate the mission). All of the observed falls but one, and all other critical incidents resulting in a reset, would be classified as terminal failures. All other critical incidents can be classified as non-terminal failures. All critical incidents appeared to be due to a loss of awareness of robot state, often resulting from communication limitation issues; in one case, a fall occurred due to a low battery. For example, one fall was due to a loss of communication with the robot’s left knee, causing the robot to collapse. Critical incidents resulting in a reset were always detrimental to team performance due to the imposed minimum 10 minute time penalty; in many cases, resets required more than 10 minutes. Hits, misses, slips, and drops have the potential to cause significant time delays as well, particularly in cases in which a task has to be started again from the beginning or if the incident requires the task to be completed in a different way than planned (e.g., dropping the drill). Falls and incidents leading to falls (i.e., tip, trip, or stuck) have the potential to be extremely detrimental as the fall itself may cause damage to the robot, requiring additional time for repairs or rendering the robot unable to continue.
5.5. Team Interaction Method Characteristics All teams were responsible for creating their own interaction method to compete in the DRC Finals. The interaction methods of each of the 20 teams participating in this study were distilled into a series of characteristics to determine trends between similar approaches, including the number of display screens, types and number of input devices, sensor display instances, sensor fusion, active operators, and control methods to perform tasks. Some characteristics were tracked per subtask, some by tasks, and others as overall qualities. Most characteristics are expressed in terms of an average amount of usage (e.g., average number of input devices used per tasks attempted) and some are categorized into higher level groups (e.g., type of sensor fusion display used). Many of the analyses presented in section 6 are an evaluation of team performances across both competition days, using both runs as separate data points. While many of the same techniques were used from one day to the next, it was not always the case. The discussion in this section primarily addresses the interaction characteristics exhibited by the teams in general and does not differentiate between the two competition days.

13
5.5.1. Input Devices, Operators, and Data Displays Each team’s interaction method consisted of a series of stations (a combination of display screens, input devices, and at least one active or passive operator). All stations used at least one display screen, keyboard, and mouse; some included other input devices such as game controllers (handheld device with joysticks, directional pads, and buttons), switch boards (tabletop device with buttons, knobs, and dials), and steering wheels with gas pedals (used only for the Vehicle task). Input devices other than keyboards and mice were only used for certain tasks; for instance, one team used the game controller only during the Wall and Surprise tasks. An active operator is defined as someone using an input device for robot control or actively manipulating sensor data to aid other active operators. Many teams used one or more operators who were consistently at a control station during task execution (a fixed operator layout). Some teams changed the number of these operators, as well as the individuals acting as operators, to perform certain tasks, some changing only once during a run (most commonly using a specific operator to perform only the Vehicle task; for analysis purposes, still considered a fixed operator layout) and some changed between many of the tasks (a rotating operator layout). A passive operator is someone in the control room that was watching over the shoulders of active operators, offering strategic advice. Data displays in each interface take the form of output streams from sensors and input elements that are used within the output streams. These include camera views, point clouds (generated from LIDAR), 3D robot avatars (generated from joint encoder values), object models or templates (3D rendering of an object or 2D shape, representing many points in space), and interaction markers (a single waypoint or end goal for the robot’s limb or body positioning). Some data displays were used by each team only for certain tasks, such as one team using six additional camera views fused with the robot avatar only during the Vehicle and Egress tasks. Additional strategies were observed using these data displays, such as simulating a robot movement with the 3D robot avatar before executing it (providing a preview of the intended action to the operator [Johnson et al., 2015], dubbed “simulation before execution” for this study). See Table 3 and Table 4 for a summation of these characteristics across all teams.
Input Devices Operator Characteristics
Keyboard and
mouse
Game controller
Steering wheel
Gas pedal
Switch board
Active operators
Changes in number or
uniqueness of active operators
Passive operators
Fixed operator
layout
Rotating operator
layout
Number and percentage of teams observed in the control room with this characteristic
20 100%
6 30%
4 20%
2 10%
3 15%
20 100%
12 60%
20 100%
14 70%
6 30%
Average amount per team 2.2 0.6 0.2 0.3 0.7 1.6 0.3 2.8 n/a Stdev amount per team 0.9 0.4 0.1 0.2 0.5 0.7 0.3 1.3
Range across teams 1 – 4 0 – 2 0 – 1 0 – 1 0 – 1 1 – 4 0 – 14 1 – 5 Table 3. Input devices and operator interaction method characteristics across all teams observed in the control room.
Averages and standard deviations calculated per tasks attempted with that characteristic.
14
Display screens
Data Display Instances Simulation before
execution Camera views
Point cloud
3D robot avatar
Object models or templates
Interaction markers Total
Number and percentage of teams observed in the control room with
this characteristic
20 100%
20 100%
19 95%
18 90%
15 75%
18 90% n/a 10
Average amount per team 5.1 6.2 2.5 2.7 3.2 2.9 15.9 n/a Stdev amount per team 3.2 4.9 1.3 1.4 1.7 1.7 9.5
Range across teams 2 – 12 2 – 23 0 – 6 0 – 8 0 – 8 0 – 8 2 – 36 Table 4. Data display and simulation before execution technique interaction method characteristics across all teams observed
in the control room. Averages and standard deviations calculated per tasks attempted with that characteristic.
5.5.2. Sensor Fusion
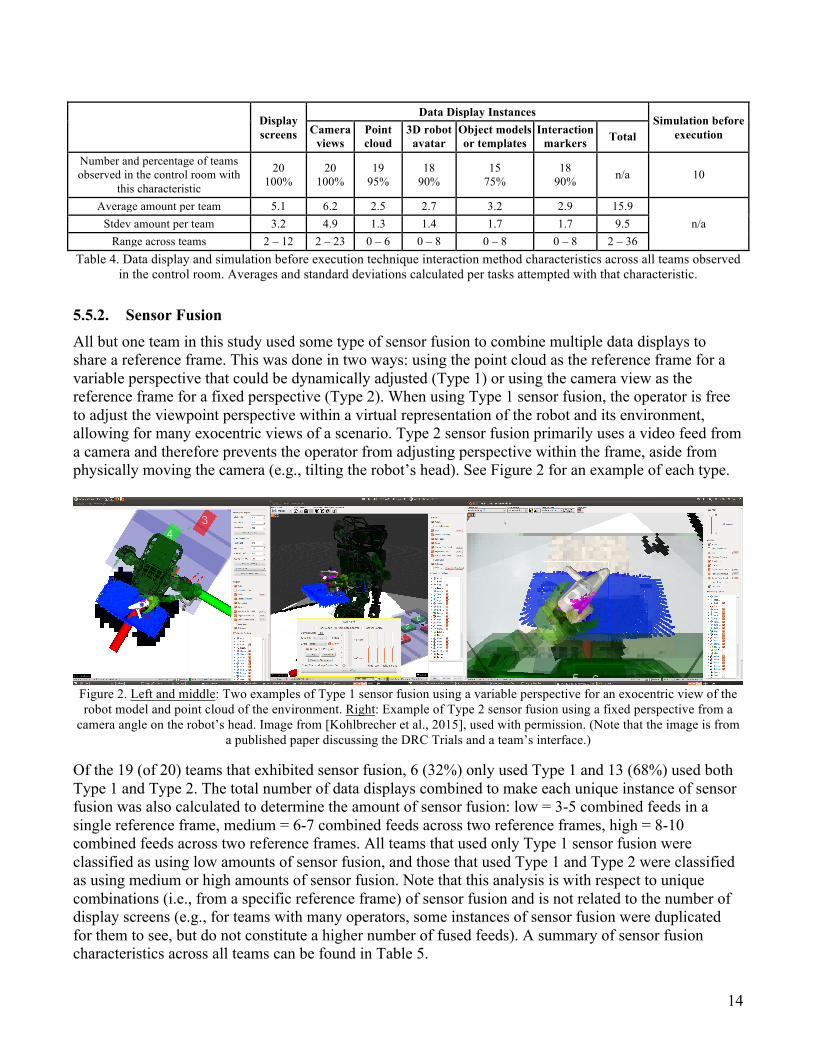
All but one team in this study used some type of sensor fusion to combine multiple data displays to share a reference frame. This was done in two ways: using the point cloud as the reference frame for a variable perspective that could be dynamically adjusted (Type 1) or using the camera view as the reference frame for a fixed perspective (Type 2). When using Type 1 sensor fusion, the operator is free to adjust the viewpoint perspective within a virtual representation of the robot and its environment, allowing for many exocentric views of a scenario. Type 2 sensor fusion primarily uses a video feed from a camera and therefore prevents the operator from adjusting perspective within the frame, aside from physically moving the camera (e.g., tilting the robot’s head). See Figure 2 for an example of each type.
Figure 2. Left and middle: Two examples of Type 1 sensor fusion using a variable perspective for an exocentric view of the robot model and point cloud of the environment. Right: Example of Type 2 sensor fusion using a fixed perspective from a
camera angle on the robot’s head. Image from [Kohlbrecher et al., 2015], used with permission. (Note that the image is from a published paper discussing the DRC Trials and a team’s interface.)
Of the 19 (of 20) teams that exhibited sensor fusion, 6 (32%) only used Type 1 and 13 (68%) used both Type 1 and Type 2. The total number of data displays combined to make each unique instance of sensor fusion was also calculated to determine the amount of sensor fusion: low = 3-5 combined feeds in a single reference frame, medium = 6-7 combined feeds across two reference frames, high = 8-10 combined feeds across two reference frames. All teams that used only Type 1 sensor fusion were classified as using low amounts of sensor fusion, and those that used Type 1 and Type 2 were classified as using medium or high amounts of sensor fusion. Note that this analysis is with respect to unique combinations (i.e., from a specific reference frame) of sensor fusion and is not related to the number of display screens (e.g., for teams with many operators, some instances of sensor fusion were duplicated for them to see, but do not constitute a higher number of fused feeds). A summary of sensor fusion characteristics across all teams can be found in Table 5.

15
5.5.3. Control Methods Levels of Effort Each team’s interaction method was used to convey commands from the operator(s) to the robot to perform tasks. Control methods for each type of task vary based on the type of information that must be conveyed to the robot from the operator, each of which results in the robot moving its arm and hand (manipulation) or legs, feet, and body (mobility). Some control methods use higher level commands (e.g., waypoint navigation) while others use lower level commands (e.g., individual joint angles), each which requires a certain amount of manual performance from the operator (e.g., more mouse clicks or keystrokes) as compared to the work by the robot to assist in performance autonomously (i.e., less interaction produces more action towards task progression, and vice versa). From this, a set of “levels of effort” for each control method has been distilled to allow for comparison between the core of each team’s interaction methods, rather than merely qualitatively comparing each team’s implementation of what could otherwise be categorized as the same technique. Many of these control methods are enabled by using tools as part of the Robot Operating System [ROS, 2016], such as “MoveIt!” and “GraspIt!”. “Level of effort” is most closely related to the metric of interaction effort [Goodrich and Olsen, 2003], although the interaction between the robot and operators at the DRC was much more fluid in terms of autonomous operations, making measures of robot attention demand, neglect time, and free time difficult to track. It also is similar to HRI metrics for time comparison of manual to autonomous operations [Schreckenghost and Milam, 2010], in that an amount of work by both agents towards task execution is evaluated, but still difficult to explicitly measure in this case. Rather, the level of effort categories primarily rely on the control methods used (as they were directly observable), and is used to group together similar methods together for comparison purposes. While an explicit level or amount of autonomy is difficult to discern, the amount of automation needed by the robot/interface to assist the operator in performing a task increases with lower levels of effort due to the control method(s) used. Every observable command from the control room to the robot was marked for each run as one of these levels of effort per each subtask performed. For manipulation, the levels of effort are defined as:
• Manipulation Level of Effort 1: Pre-defined action or script based on contextual information, such as the use of an object model or template, that generates manipulator trajectories; usually a single click or button press per action, sometimes the entire execution of a task is performed with a single action (e.g., turning the valve with a single wrist rotation).
• Manipulation Level of Effort 2: Maneuvering an end effector (or interaction marker) using a keyboard, mouse, or game controller (generally visualized through an avatar of the robot using a Cartesian transform tool) which uses inverse kinematics and generates manipulator trajectories; if an object model or template is used it may provide contextual information (e.g., where to place fingers when grasping an object).
• Manipulation Level of Effort 3: Sending individual joint angles using a keyboard, mouse, or game controller (sometimes using a Cartesian transform tool); does not use any contextual information.
For mobility, the levels of effort are defined as:
• Mobility Level of Effort 1: Placing a waypoint or “ghost” avatar for the robot to walk to and the footsteps are automatically generated.
• Mobility Level of Effort 2: Pre-defined action or script to step in a specified direction a number of steps; two-dimensional directional control for traversing in a direction either continuously or incrementally (similar to that of wheeled robot teleoperation).

16
• Mobility Level of Effort 3: Manual placement and adjustment of individual footsteps; generally only used for tasks that involve changing elevations, such as Rubble-Terrain or Stairs.
Another common technique was the placement of object models or templates into a camera view or point cloud display. These models and templates were used to add context to an autonomous action, such as guiding the robot toward exactly where the drill is or what shape to cut out for the Wall task. This technique has been used by teams at previous DRC events, sometimes referred to as “manipulables” [Johnson et al., 2014], “fixtures” [Stentz et al., 2015], or “affordances” [Fallon et al., 2015]. Unlike the manipulation and mobility levels of effort, some teams did not use this technique at all. The levels of effort for model or template placement are defined as:
• Model/Template Placement Level of Effort 1: Clicking a camera view or point cloud display to place the model or template; can be a few clicks, drawing a box, “scribbling,” etc.; includes defining an area for the robot to scan such that it can automatically place it.
• Model/Template Placement Level of Effort 2: Manual placement and adjustment of a model or template using a keyboard, mouse, or game controller; sometimes using a Cartesian transform tool.
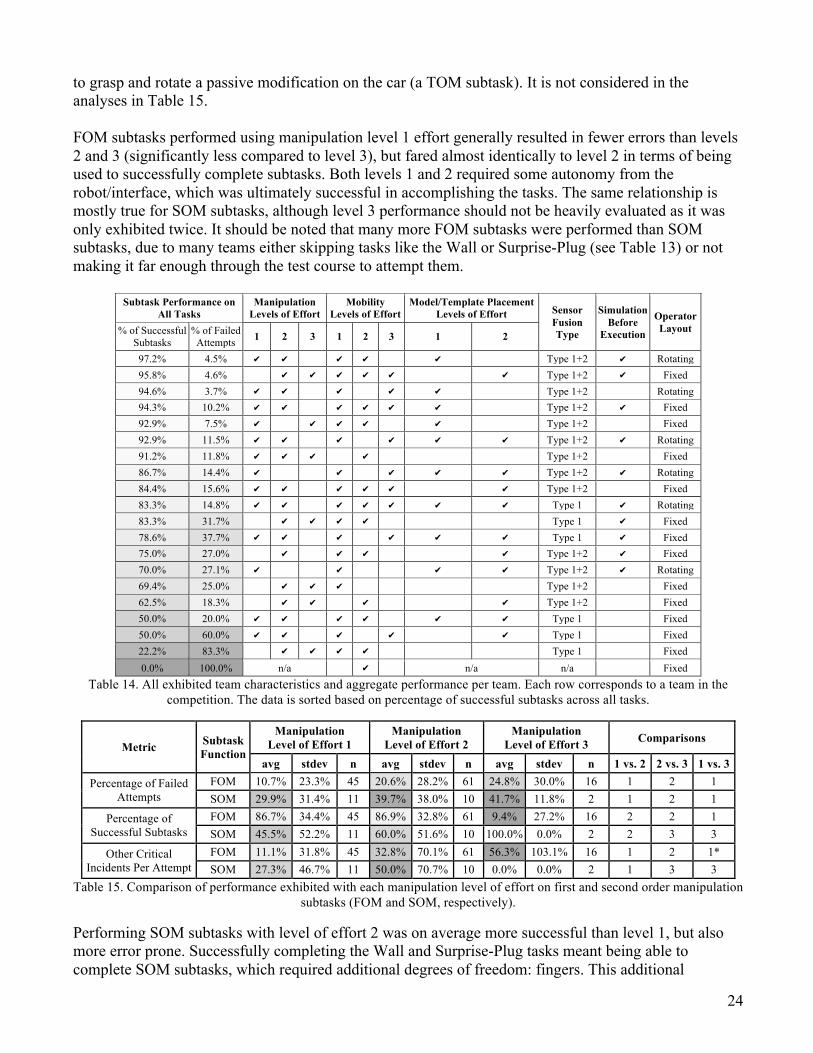
In theory, better performance using a lower level of effort implies properly implemented and executed automation and supervisory control as part of that team’s HRI, while worse performance implies either poorly implemented autonomy, poor feedback techniques conveyed to the operator, or both. Conversely, better performance using a higher level of effort implies a very cognizant, well-trained operator or set of operators, capable of maintaining larger cognitive workloads, while worse performance could imply an overburdened or undertrained operator. A similar evaluation technique was performed in the HRI analysis of the DRC Trials [Yanco et al., 2015], referred to then as “Amount of Interaction”. All consented teams in this study except one were observed using at least two different levels of effort for manipulation and mobility (the bottom team in Table 14 did not make it far enough through the test course to attempt any manipulation tasks). For this reason, all metrics in later sections regarding the performance of a specific control method level of effort are correlated only to the subtask performance where they were exhibited. See Table 6 for the number of teams that used each level of effort.
Type 1 Sensor Fusion (Variable Perspective)
Type 2 Sensor Fusion (Fixed Perspective)
Total amount of sensor fusion High Medium Low
Number of teams 19 13 9 4 6 Percentage of teams observed in the control room with this characteristic 95% 65% 45% 20% 30%
Average amount of combined data displays per team 4.3 3.9 9.1 6.5 3.8
Stdev amount per team 0.8 1.1 0.9 0.6 0.8 Range across teams 3 – 5 2 – 5 8 – 10 6 – 7 3 – 5
Table 5. Sensor fusion interaction method characteristics across all teams observed in the control room, noting the number of combined data displays that comprise each sensor fusion type. Averages and standard deviations calculated per tasks
attempted with those data displays active.

17
Manipulation Levels of Effort
Mobility Levels of Effort
Model/Template Placement Levels of Effort
Level 1 Level 2 Level 3 Level 1 Level 2 Level 3 None Level 1 Level 2 Number of teams 13 16 7 17 13 9 5 10 11
Percentage of teams observed in the control room with this
characteristic 65% 80% 35% 85% 65% 45% 25% 50% 55%
Table 6. Control methods levels of effort across all teams observed in the control room.
5.6. Data Aggregation To measure the validity of our field coding system for tasks and critical incidents, a Cohen’s Kappa coefficient was calculated by having a single observer code one field run from each of the evaluation team members who coded field runs. The single observer coded observations from the field videos. This validity test was performed to measure the reliability and consistency between multiple observers when categorizing robot actions in the field during the competition, also taking chance into account. A Kappa value between 0.61 and 0.80 indicates that the coders were in “substantial agreement” [Landis and Koch, 1977]; Fleiss [1981] also suggests that a Kappa value above 0.75 indicates “strong agreement” above chance between coders. For each of the pairwise comparisons of the single observer and the field observation teams, Cohen’s Kappa for task coding was κ=0.81 excluding chance (κ=0.84 if chance was not factored in), κ=0.79 (κ=0.83), κ=0.82 (κ=0.86), κ=0.71 (κ=0.75), and κ=0.69 (κ=0.78). For critical incidents coding, κ=0.83 excluding chance (κ=0.90 if chance was not factored in), κ=0.83 (κ=0.90), κ=0.67 (κ=0.75), κ=0.47 (κ=0.88), and κ=0.81 (κ=0.88). For each of the field observations, many more task codings were made (average: 33.5, stdev: 16.2) compared to critical incident codings (average: 6.1, stdev: 2.7). The control room observations did not involve coding of interaction methods by many observers; this was performed later by a single team member, coding exhibited levels of effort, number of operators, and number of operator changes for each recorded observation note, all of which was verified through video of the control rooms provided by DARPA. To pull all of these data streams together, each pair of field and control room observations were merged into a singular form such that each set of observations could provide context for the other. For example, if the robot was observed dropping the drill during the Wall task from the field and it was marked as a “Drop” critical incident, but the observations in the control room show that the operators commanded the robot to do so, then it would not be a critical incident. Critical incidents and task attempts were also verified by reviewing video of each run. The merged observations were then used to generate a datasheet for each run that contained definitive task performance measures and HRI characteristics exhibited during task execution. An example datasheet can be seen in Table 7. From these datasheets, comparisons of performance between groups of teams that share similar characteristics (e.g., teams that used sensor fusion type 1 vs. those that used type 1 and type 2) or that of individual task/subtask performance using similar HRI characteristics (e.g., all task attempts using manipulation level of effort 1 vs. 2 vs. 3) have been performed, and are discussed in section 6. To retain anonymity, the teams that fall into each group are not given.

18
T/S/A Task/Subtask
Name Start Time
End Time Duration
# of Successful Attempts
# of Failed
Attempts
Total # of
Attempts
% of Failed
Attempts Critical
Incidents
Manipulation Level of Effort
Mobility Level of Effort
# of Active
Operators
Changes in Active
Operators 1 2 3 1 2 3 T Valve 5:12 5:15 3 1 0 1 0 ✔ ✔ ✔ 2
S Traverse to valve 5:12 5:14 2 1 0 1 0 ✔ 2
S Complete valve rotation 5:14 5:15 1 1 0 1 0 ✔ ✔ 2
A Align with valve
n/a
1 0 1 0 ✔ 2
A Grasp/Contact valve 1 0 1 0 ✔ 2
A Rotate valve 1 0 1 0 ✔ 2
A Release valve 1 0 1 0 ✔ 2
T Wall 5:16 n/a n/a 0 1 1 14% Drop ✔ ✔ 2 2
S Traverse to shelf 5:16 5:18 2 1 0 1 0 ✔ 2
S Grasp and activate drill 5:18 5:22 4 1 0 1 0 ✔ 2
A Grasp drill n/a
1 0 1 0 ✔ 2
A Power drill on 1 0 1 0 ✔ 2
S Traverse to wall (with drill in hand)
5:22 5:25 3 1 0 1 0 ✔ 2
S Cut opening in wall 5:25 n/a n/a 0 1 1 33% Drop ✔ 2 1
A Align with wall n/a
2 0 2 0 ✔ 2
A Position arm 0 1 1 1 Drop ✔ 2
Table 7. Example datasheet for a run, showing only the Valve and Wall task. Note that for size constraints some data streams are not depicted. In this example, the team used levels of effort 1 and 2 for manipulation, and only level 1 for mobility. When
performing the Valve task there were 2 active operators, and there were also 2 when performing the Wall task, but not the same 2. There was a single operator change when cutting the opening in the wall.
5.7. Performance Predictions After the assessment of the DRC Trials was completed in 2014, the evaluation team determined that it might be possible to estimate the scores of competing DRC Finals based on their HRI design. A simple prediction of the team ranks would not appropriately reflect the level of investigation into the HRI developed for the event, so the prediction was made in the form of an expected number of points scored in the competition. The prediction comprised of two main parts that were generated independently of one another: a model-based HRI evaluation (representing potential performance) and an additional team strategy component (representing deviations from that potential). Figure 3 depicts the method used to generate the predictions. A detailed discussion on the results of this prediction is presented in section 6.4.

19
Figure 3. A flowchart of the prediction development method.
5.7.1. Strategic Components
The strategy component was based on an evaluation of several aspects of each team’s capabilities generated from data gathered during interviews prior to the competition. These aspects were identified during the DRC Trials evaluation as having an apparent significant impact on performance outside of HRI. The components are:
• Training: The amount of practice the teams had with their robots and, more specifically, completing individual tasks, the transition between the tasks, and doing so end-to-end prior to the competition.
• Robot Stability: Shown to have a large impact on performance during the Trials, the Finals teams were more differentiated in this category, with some bipedal robot teams developing techniques to prevent falling in the first place and even to get up after falling. Additionally, several teams employed robots that were inherently stable (e.g., quadruped, ability to leverage additional balancing features, etc.).
• Task Strategy: Novel approaches to specific tasks that would improve the likelihood of success over other teams. An example of this is the “plow” technique some teams used to get through the Rubble-Debris task (i.e., do not manipulate any debris pieces out of the way, just drive through and push them out of the way).
• Bandwidth Adaptability: During the Trials, there was a fairly large impact on performance for teams that did not address the low-bandwidth condition. Therefore, teams that had exceptional methods for addressing this (e.g., able to perform throughout high and low bandwidth comms periods) and teams that relied purely on high bandwidth communications were noted as such.

20
Metrics were generated for each of these components (see Table 8). The value of these metrics were developed to be comparable to points gained or lost, again based on an estimate from the DRC Trials evaluation. However, it is important to state that the values attributed to these metrics are a rough estimate of their intrinsic effect on performance and not as a method to compare the relative impacts on performance. Additionally, Robot Stability, Task Strategy, and Bandwidth Adaptability were combined into a single metric for the team overall strategy, termed “Technique.” A high or low category was generated for these and was compared to the high or low categories assigned to the teams’ interaction techniques when evaluating the predicted impact on performance.
Metric Range Description
Training High Mixed task and mission practice greater than 1 month Low Less than 1 month of practice, limited practice or negligible practice
Technique
Robot Stability High Dynamically stable robots or strategy to achieve dynamic stability Low Dynamically unstable robots
Task Strategy High Exceptional strategy for specific task(s) (e.g. drive thru debris) Low Common strategy across teams
Bandwidth Adaptability High Operation in high or low bandwidth Low Operation in high-bandwidth only
Table 8. Metrics, value ranges, and their corresponding descriptions used for the predictions analysis.
5.7.2. HRI Model Components The second part of the prediction was the HRI model, which was generated exclusively from the results of the DRC Trials evaluation, considering correlations between the varying interaction techniques and performance. Team data collected prior to the Finals event allowed us to characterize each team in terms of what had been learned at the DRC Trials. The interaction techniques were generalized to interaction augmentation, interaction automation, and operator interaction for the different subtasks, key characteristics identified during the Trials evaluations. The teams were characterized by the level of effectiveness in these areas per the Trials evaluations (see Table 9). Effectiveness/ Confidence Level Interaction Automation Operator Interaction Interaction Augmentation
High Trajectory planning based on desired end-point - essentially closed-loop automated path planning # Active Operators < 3 Lidar, camera, and simulated
robot and object fusion
Medium Pre-made scripts for actions and tasks - essentially open-looped control 3 <= # Active Operators < 6 Multiple feedback modalities
for visual and/or range data
Low Manual input into coordinated joint control for 2-axis motion # Active Operators >=6 Simple, unfused camera(s)
Table 9: Critical interaction techniques per Trial evaluations
Team Subtask Function Interaction Automation
Operator Interaction
Interaction Augmentation
X
Obstructed Traverse 1 3 2 Unobstructed Traverse 1 3 2
First Order Manipulation 2 3 2 Second Order Manipulation 2 3 2
Table 10: Example HRI prediction model team characterization
The connection between the Trials and the Finals was through the subtask function analysis; effective interaction techniques were identified during the Trials per these subtask functions, which were then compared to the subtask functions identified in the Finals task breakdown (see Table 1). Confidence

21
levels were generated for each team and each subtask based upon how their HRI techniques matched up with those identified from the Trials analysis. If a team had all the required effective interaction techniques for a given task (consisting of one or more subtasks), then the prediction included a point for that team and task. These were then built into a comprehensive model of the tasks for each team, combining the subtask functions required for each task (and their predicted performance on those subtasks) to come up with an expected confidence level for completion of the tasks as a whole. The fact that some tasks are more heavily weighted towards a subset of subtask functions (e.g., the bypass was almost entirely unobstructed traverse) was included in this analysis. Table 11 describes the components of the HRI model. Note that because this model was based on results from the Trials analysis, there were not always situations where the inclusion or lack of an interaction technique would result in a respective high and low confidence in completion of the task. For example, there was a strong correlation between low amounts of interaction for manipulation control methods and a high success rate, but a very weak correlation between the inverse. Therefore, in these situations only the strong correlations were considered. Refer to the analysis of HRI at the DRC Trials [Yanco et al., 2015] for more details on the definitions of the techniques shown here.
Subtask Function Range Approach Required First Order Manipulation (FOM) High Confidence Low levels of effort for manipulation
Second Order Manipulation (SOM) High Confidence High levels of sensor fusion, use of object models or templates, or low amounts of effort for manipulation
Unobstructed Traverse (UT) High Confidence High levels of sensor fusion, use of object models or templates, and
control methods with low levels of effort Low Confidence Low levels of sensor fusion and high levels of effort for mobility
Obstructed Traverse (OT) High Confidence High levels of sensor fusion and use of object models or templates,
and control methods with low levels of effort
Low Confidence Control methods with high levels of effort, or low levels of sensor fusion and high levels of effort for mobility
Table 11. Components of the HRI model using subtask functions from the DRC Trials analysis.
6. Results and Discussion Trends between many of the metrics for performance and interaction method characteristics have been found, with some statistically significant findings. Given the amount of data collected, there are many possible ways to evaluate team performance. Only the most pertinent findings are presented and discussed in the following analyses. In many of the tables in this section, the group with better performance is noted in the “Comparisons” columns. In these columns, statistical significance from performing unpaired t-tests are indicated by * (p < 0.05) or ** (p < 0.01). The tables are shaded to assist with visual data analysis and interpretation. Cells representing the best values in a column are white, with the cells progressively shaded darker as the values get worse for that metric.
6.1. Task Difficulty Using all data points gathered from all runs on the field by all teams, aggregate performance metrics indicate general trends in performance for each task and subtask function. These measures are used to determine which subtask types (Table 12) and overall tasks (Table 13) were the most difficult.

22
In terms of mobility, unobstructed traverse (UT) exhibited the least amount of difficulty across all metrics. In contrast, obstructed traverse – foot (OTF) and obstructed traverse – robot (OTR) subtasks exhibited very high amounts of errors and the most falls. Second order manipulation (SOM) was by far the most difficult subtask function to perform in terms of manipulation, but also compared to all other subtask functions. The performance of SOM subtasks exhibited the highest number of errors, had the lowest number of completed subtasks, took the longest to complete, prompted the most resets (not caused by falls), and had the most other critical incidents. These findings follow the inherent increase in complexity between UT to OTR/OTF subtasks, or from FOM to SOM subtasks.
Subtask Function
Percentage of Failed Attempts
Percentage of Successful Subtasks
Duration to Complete Subtasks (Minutes)
Falls Per Attempt
Resets (Not Prompted by
Falls) Per Attempt
Other Critical Incidents Per
Attempt
avg stdev avg stdev avg stdev avg stdev avg stdev avg stdev UT 4.5% 20.8% 95.5% 20.8% 2.1 2.5 1.5% 12.2% 0.0% 0.0% 0.0% 0.0%
OTF 16.3% 33.5% 80.5% 38.5% 2.9 3.5 16.7% 36.6% 0.8% 6.2% 4.6% 21.1% OTR 23.1% 41.1% 78.0% 40.7% 3.3 4.4 14.7% 34.4% 2.8% 13.6% 4.2% 19.3%
All Mobility 11.4% 30.6% 87.8% 32.2% 2.6 3.2 7.5% 25.6% 1.0% 8.2% 1.9% 13.3% FOM 17.7% 27.4% 88.9% 30.9% 3.7 2.7 6.0% 23.8% 0.4% 4.6% 25.2% 58.6% SOM 37.0% 34.6% 56.3% 49.6% 5.0 3.2 8.3% 28.2% 6.3% 22.4% 41.7% 65.4% TOM 3.9% 10.4% 94.9% 19.2% 3.8 4.2 0.00% 0.0% 6.4% 20.5% 2.6% 16.0%
All Manipulation 15.2% 25.4% 86.8% 32.8% 3.8 3.1 4.7% 21.2% 2.6% 13.6% 19.0% 50.9% Table 12. Aggregate performance across all runs per subtask function.
Task
Percentage of Failed
Attempts
Percentage of Successful Subtasks
Duration to Complete
Tasks (Minutes)
Falls Per Attempt
Resets (Not Prompted by
Falls) Per Attempt
Other Critical Incidents Per
Attempt
Percentage of Runs Where That Task
Was Skipped avg stdev avg stdev avg stdev avg stdev avg stdev avg stdev avg
Vehicle 3.9% 10.4% 94.9% 19.2% 3.8 4.2 0.0% 0.0% 6.4% 20.5% 2.6% 16.0% 17.0% Bypass Vehicle
by Walking 81.3% 37.2% 20.8% 39.6% 20.0 2.8 25.0% 37.8% 25.0% 37.8% 12.5% 35.4% n/a
Egress 19.4% 38.9% 89.5% 31.1% 6.5 3.0 16.7% 38.3% 5.6% 23.6% 1.3% 8.1% 57.1% Door 21.6% 26.8% 84.9% 35.0% 5.9 3.7 24.4% 42.0% 2.4% 10.9% 9.3% 32.5% n/a
Valve 7.4% 21.1% 95.4% 20.1% 4.9 3.4 6.9% 25.8% 3.5% 18.6% 0.0% 0.0% 3.3% Wall 25.0% 23.6% 83.1% 37.3% 14.3 5.6 16.7% 38.3% 8.3% 25.7% 18.6% 58.8% 30.8%
Surprise-Lever 22.6% 31.1% 90.5% 30.1% 5.6 2.4 9.1% 30.2% 0.0% 0.0% 14.3% 35.9% 0.0% Surprise-Plug 34.1% 24.8% 85.2% 36.2% 11.4 4.6 10.0% 31.6% 0.0% 0.0% 29.6% 60.9% 23.1%
Rubble-Debris 11.0% 23.3% 95.0% 22.4% 4.8 7.4 10.0% 31.6% 0.0% 0.0% 10.0% 30.8% 50.0% Rubble-Terrain 7.8% 12.3% 84.4% 35.2% 7.7 3.5 31.3% 45.8% 0.0% 0.0% 6.3% 25.0% 57.9%
Stairs 4.9% 11.5% 92.3% 27.2% 4.8 1.8 8.3% 28.9% 0.0% 0.0% 0.0% 0.0% n/a Table 13. Aggregate performance across all runs per task.
The most difficult task appears to be the only one not worth any points: Bypass Vehicle by Walking. It should be noted, however, that only 4 of 23 teams attempted this task. Aside from walking downrange, the Wall task was the most difficult in terms of failures for those that attempted it, followed by the Surprise-Plug and Rubble-Terrain tasks. Performance of the Wall and the Surprise-Plug tasks was largely dependent on SOM subtasks, whose difficulty is further evidenced here as both of these tasks have the two highest percentages for critical incidents and relative duration (apart from Bypassing the Vehicle). However, the Egress task was skipped the most by teams, which may be indicative of the task’s difficulty. Teams were given a choice between the Rubble tasks, and of the two, Debris was selected by more teams than Terrain. Terrain also saw less success than Debris, implying that it was

23
more difficult. The least difficult tasks were the Valve and the Surprise-Lever, both in terms of failures and the tasks being skipped (Lever was never skipped by teams who made it far enough to attempt it). Many of the teams interviewed on-site at the Finals indicated strategies for performing the Rubble tasks, but did not get the chance to execute these strategies, ending their runs before reaching that point within the course (either due to damage from falls or time expiration). Similar to the Trials, Rubble-Terrain task was the most difficult mobility task. This finding implies that little progress has been made in terms of semi-autonomous humanoids performing such tasks, but this is most likely skewed by low number of teams (5) that were able to attempt it during the Finals. The alternative Rubble-Debris task functioned very differently than it did in the Trials where it focused on manipulation. For the Finals, it was treated as a mobility task, with the debris pieces were light enough such that robots with wheeled, statically stable modes could drive through and push them out of the way. In general, the higher complexity subtask functions (OTF, OTR, and SOM) appeared to be more difficult than their less complex counterparts (UT and FOM, respectively). This is similar to the performance exhibited in the Trials [DARPA, 2014]. However, the structure of the Finals competition did not allow for a more equal distribution of data points like the Trials.
6.2. Interaction Method Techniques Many of the characteristics outlined in section 5.5 played a major role in teams’ performance. Table 14 culls together many of the team interaction method characteristics correlated with subtask performance across all tasks. By this ordering, most of the top 10 performing teams (of the 20 in this study) used level 1 effort for manipulation (90%), mobility (90%), and model/template placement (70%), in addition to other control methods. Most also used both types of sensor fusion (90%), some used simulation before execution (60%) and the choice of operator layout strategy was evenly split (50% rotating, 50% fixed). The remainder of this section uses specific sets of performance for more detailed comparisons. When comparing the performance metrics in this paper to the official DRC Finals competition scoring, the top 10 performing teams in our study using the metric for percentage of successful subtasks (see Table 14) ranked higher in the competition than the bottom 10 performing teams by that metric. However, the ordering between the official competition results and our findings are different due to two factors: 1) our analysis uses the performance from runs on both days while the official competition scoring only considered each team’s best run; 2) not all competing teams consented to participate in this study. Many teams used similar lower levels of effort for all manipulation and mobility performance: of the 20 teams, 14 (70.0%) used level 1 for both, 13 (65.0%) used level 2 for both, while only 6 (30.0%) used level 3 for both. To evaluate control methods levels of effort, each metric comparison uses individual subtask performance, as every subtask attempted was marked as having used one or more levels of effort. For this reason, the analyses in sections 6.2.1, 6.2.2, and 6.2.3 are comparisons of groups of attempts, not strictly groups of disparate teams. Due to subtask attempts commonly using more than one level of effort, many comparisons share data points. All other analyses use groups of team performance.
6.2.1. Manipulation
Manipulation control methods were only used for manipulation subtasks (FOM and SOM) and manipulation-heavy tasks (Door, Valve, Wall, and Surprise tasks). Only a single instance of using one of the manipulation control methods outlined in section 5.5.3 was observed on the Vehicle, which was used
24
to grasp and rotate a passive modification on the car (a TOM subtask). It is not considered in the analyses in Table 15. FOM subtasks performed using manipulation level 1 effort generally resulted in fewer errors than levels 2 and 3 (significantly less compared to level 3), but fared almost identically to level 2 in terms of being used to successfully complete subtasks. Both levels 1 and 2 required some autonomy from the robot/interface, which was ultimately successful in accomplishing the tasks. The same relationship is mostly true for SOM subtasks, although level 3 performance should not be heavily evaluated as it was only exhibited twice. It should be noted that many more FOM subtasks were performed than SOM subtasks, due to many teams either skipping tasks like the Wall or Surprise-Plug (see Table 13) or not making it far enough through the test course to attempt them.
Subtask Performance on All Tasks
Manipulation Levels of Effort
Mobility Levels of Effort
Model/Template Placement Levels of Effort Sensor
Fusion Type
Simulation Before
Execution
Operator Layout % of Successful
Subtasks % of Failed
Attempts 1 2 3 1 2 3 1 2
97.2% 4.5% ✔ ✔ ✔ ✔ ✔ Type 1+2 ✔ Rotating 95.8% 4.6% ✔ ✔ ✔ ✔ ✔ ✔ Type 1+2 ✔ Fixed 94.6% 3.7% ✔ ✔ ✔ ✔ ✔ Type 1+2 Rotating 94.3% 10.2% ✔ ✔ ✔ ✔ ✔ ✔ Type 1+2 ✔ Fixed 92.9% 7.5% ✔ ✔ ✔ ✔ ✔ Type 1+2 Fixed 92.9% 11.5% ✔ ✔ ✔ ✔ ✔ ✔ Type 1+2 ✔ Rotating 91.2% 11.8% ✔ ✔ ✔ ✔ Type 1+2 Fixed 86.7% 14.4% ✔ ✔ ✔ ✔ ✔ Type 1+2 ✔ Rotating 84.4% 15.6% ✔ ✔ ✔ ✔ ✔ ✔ Type 1+2 Fixed 83.3% 14.8% ✔ ✔ ✔ ✔ ✔ ✔ ✔ Type 1 ✔ Rotating 83.3% 31.7% ✔ ✔ ✔ ✔ Type 1 ✔ Fixed 78.6% 37.7% ✔ ✔ ✔ ✔ ✔ ✔ Type 1 ✔ Fixed 75.0% 27.0% ✔ ✔ ✔ ✔ Type 1+2 ✔ Fixed 70.0% 27.1% ✔ ✔ ✔ ✔ Type 1+2 ✔ Rotating 69.4% 25.0% ✔ ✔ ✔ Type 1+2 Fixed 62.5% 18.3% ✔ ✔ ✔ ✔ Type 1+2 Fixed 50.0% 20.0% ✔ ✔ ✔ ✔ ✔ ✔ Type 1 Fixed 50.0% 60.0% ✔ ✔ ✔ ✔ ✔ Type 1 Fixed 22.2% 83.3% ✔ ✔ ✔ ✔ Type 1 Fixed 0.0% 100.0% n/a ✔ n/a n/a Fixed
Table 14. All exhibited team characteristics and aggregate performance per team. Each row corresponds to a team in the competition. The data is sorted based on percentage of successful subtasks across all tasks.
Metric Subtask Function
Manipulation Level of Effort 1
Manipulation Level of Effort 2
Manipulation Level of Effort 3 Comparisons
avg stdev n avg stdev n avg stdev n 1 vs. 2 2 vs. 3 1 vs. 3 Percentage of Failed
Attempts FOM 10.7% 23.3% 45 20.6% 28.2% 61 24.8% 30.0% 16 1 2 1 SOM 29.9% 31.4% 11 39.7% 38.0% 10 41.7% 11.8% 2 1 2 1
Percentage of Successful Subtasks
FOM 86.7% 34.4% 45 86.9% 32.8% 61 9.4% 27.2% 16 2 2 1 SOM 45.5% 52.2% 11 60.0% 51.6% 10 100.0% 0.0% 2 2 3 3
Other Critical Incidents Per Attempt
FOM 11.1% 31.8% 45 32.8% 70.1% 61 56.3% 103.1% 16 1 2 1* SOM 27.3% 46.7% 11 50.0% 70.7% 10 0.0% 0.0% 2 1 3 3
Table 15. Comparison of performance exhibited with each manipulation level of effort on first and second order manipulation subtasks (FOM and SOM, respectively).
Performing SOM subtasks with level of effort 2 was on average more successful than level 1, but also more error prone. Successfully completing the Wall and Surprise-Plug tasks meant being able to complete SOM subtasks, which required additional degrees of freedom: fingers. This additional

25
complexity introduced more failed attempts and critical incidents observed when using level 2, but did not appear to ultimately affect task success. This is an important distinction because the Wall and Surprise-Plug tasks involved objects that if dropped could greatly hinder task progress. Only a single team was observed using manipulation level of effort 1 without any others to successfully complete the Surprise-Plug task; all others used a combination of levels. One of the top teams in the competition did not use manipulation level of effort 1 at all; they used mostly level 2 in combination with manually placed object models or templates (also level 2). This is an example of both agents working together to balance the workload needed to complete the task; e.g., the operator manually places a 3D model of the drill and the robot/interface uses contextual information of the 3D model to aid in proper inverse kinematic control to grasp the drill when the operator maneuvers an end effector on the robot avatar towards the model. Many of the manipulation control methods that make up each level of effort (see section 5.5.3) involve the operator maneuvering the robot avatar’s arms and hands to plan and send commands/trajectories to the robot. Even though there were degraded communications between the robot and the operator during indoor tasks, many teams noted during their pre-competition interviews that the low bandwidth line provided enough data for the robot avatar on the interface to remain up to date in real time using joint encoder values (even in “blackout” periods), but generally not enough for higher resolution real time camera images or point clouds. Using the levels of situation awareness (SA) defined by Endsley [1995], the low bandwidth line enabled level 1 SA in terms of robot status to be maintained through the robot avatar. The same type of understanding of the environment, also with respect to task progress for level 2 and 3 SA, was not necessarily maintained in real time. A true blackout with absolutely no communication between the robot and operator (such as in a real world disaster scenario) would not allow for such techniques.
6.2.2. Mobility
The mobility control methods levels of effort were used for mobility subtasks (UT, OTF, and OTR) and mobility-heavy tasks (Bypass Vehicle By Walking, Door, Rubble, Stairs). This analysis is shown in Table 16.
Metric Subtask Function
Mobility Level of Effort 1
Mobility Level of Effort 2
Mobility Level of Effort 3 Comparisons
avg stdev n avg stdev n avg stdev n 1 vs. 2 2 vs. 3 1 vs. 3
Percentage of Failed
Attempts
UT 2.4% 15.3% 85 5.0% 22.4% 20 n/a n/a 0 1 n/a n/a OTF 9.6% 26.6% 35 21.4% 40.5% 21 13.1% 19.5% 13 1 3 1 OTR 16.3% 35.9% 44 19.6% 39.3% 28 0.0% 0.0% 3 1 3 3
Percentage of Successful Subtasks
UT 97.7% 15.3% 85 95.0% 22.4% 20 n/a n/a 0 1 n/a n/a OTF 86.7% 33.5% 35 78.6% 40.5% 21 34.6% 47.4% 13 1 2 1 OTR 84.1% 35.6% 44 80.4% 39.3% 28 0.0% 0.0% 3 1 2 1
Falls Per Attempt
UT 1.2% 10.9% 85 5.0% 22.4% 20 n/a n/a 0 1 n/a n/a OTF 12.4% 32.4% 35 19.1% 40.2% 21 26.9% 43.9% 13 1 2 1 OTR 13.3% 32.7% 44 17.9% 39.0% 28 0.0% 0.0% 3 1 3 3
Table 16. Comparison of performance exhibited with each mobility level of effort on unobstructed traverse (UT), obstructed traverse - foot (OTF), and obstructed traverse - robot subtasks (OTR).
Performance on UT subtasks did not vary much between when mobility levels of effort 1 or 2 were used, and level 3 was never exhibited performing these subtasks as it was used to manually place footsteps at varying elevations (i.e., not UT subtasks). All UT subtasks were performed on flat ground

26
with no obstructions, so the difference in HRI between levels 1 and 2 on UT is largely about the number of actions required by the operator to command the robot, and much less about balance or center of gravity (at least compared to the other mobility subtask functions). OTF did involve varying elevations and obstructions to the path; attempts on these subtasks using levels 1 or 3 resulted in fewer errors than those using level 2. Attempts using level 1 were also more successful and resulted in fewer falls than level 3. The difference between levels 1 and 3 on OTF and OTR is not only with respect to the number of actions required by the operator to command the robot, but also the need for the robot to autonomously maintain balance and center of gravity (more so than any UT subtasks). Thus, in general, the automation required by the robot/interface for level of effort 1 control methods was more effective at planning footfalls (e.g., placing a waypoint on the other end of the Rubble-Terrain blocks, generating a stepping plan) than putting the responsibility on the operator to do so manually (e.g., plan each individual step). Half of the teams in this study used both levels of effort 1 and 2 to perform mobility subtasks, with large variances in their performance (see Table 14). 9 teams (45%) used level 3, with 7 in the top half of performing teams, and 2 in the bottom half. Two teams in this study used only level 1 when performing the Stairs and/or Rubble-Terrain tasks, meaning they did not adjust footsteps manually (level 3) at all, and completed the tasks. One of those teams was a top performer in the competition. Seven teams used robots with statically stable modes; for much of their mobility performance, they would not be as concerned with falling as other teams. Of the teams in the top five official competition rankings that used robots with wheeled, statically stable modes and consented to be in this study, all used both mobility levels of effort 1 and 2 for UT and OTR. When their robots are in statically stable modes they essentially functioned like wheeled ground robots, where using control methods like waypoints (level 1) and directional teleoperated control (level 2) has already proven to be effective. Their performance in this regard does not aid in evaluating the effectiveness of a control method for humanoid walking.
6.2.3. Model/Template Placement The use of object models or templates to interact with the environment was observed on many of the tasks in different forms; Door (frame, door, handle), Valve (wheel), Wall (drills, wall, shape to cut), Surprise (switch box, plug, cable), Rubble-Terrain (cinder blocks), and Stairs (each step). An analysis of the subtask functions where models/templates were used is presented in Table 17 (FOM, SOM, and all manipulation subtasks) and Table 18 (OTF, OTR, and all mobility subtasks). For model/template placement level 1 to be effective, the system must be able to match the proposed model/template placement with the robot’s sensor data (i.e., camera and point cloud), based on the operator’s ability to place it using only a few gestures (e.g., a mouse click). For level 2 to be effective, the operator is responsible for placing the model/template to aid with task. For all FOM subtasks, level 1 resulted in fewer errors and more successful subtasks than level 2, and the inverse is true for SOM subtasks (level 2 was significantly more successful than level 1). These findings suggest that the robot/interface automation required to fit models/templates using sensor data was most effective for teams when performing FOM subtasks (e.g., pushing the door handle down), but that more complex SOM tasks (e.g., using the drill to cut the wall; those that require fingers) benefit from finer-tuned placement of models by the operator.

27
Metric Subtask Function
Model/Template Placement Level of Effort 1
Model/Template Placement Level of Effort 2
Model/Template Placement None Comparisons
avg stdev n avg stdev n avg stdev n 1 vs. 2 2 vs. None
1 vs. None
Percentage of Failed
Attempts
FOM 15.0% 25.7% 47 19.4% 28.9% 36 21.5% 29.2% 32 1 2 1 SOM 42.8% 35.4% 10 0.0% 0.0% 3 45.3% 37.2% 5 2 2 1
All Manipulation 18.4% 27.5% 56 18.4% 28.5% 38 11.9% 23.0% 68 n/a None None
Percentage of Successful Subtasks
FOM 87.2% 33.7% 47 79.2% 40.3% 36 10.9% 30.4% 32 1 2 1 SOM 30.0% 48.3% 10 100.0% 0.0% 3 20.0% 44.7% 5 2* 2 1
All Manipulation 78.6% 41.4% 56 80.3% 39.5% 38 8.1% 25.4% 68 2 2 1*
Other Critical Incidents Per
Attempt
FOM 21.3% 50.8% 47 25.0% 64.9% 36 25.0% 62.2% 32 1 n/a 1 SOM 40.0% 69.9% 10 33.3% 57.7% 3 40.0% 54.8% 5 2 2 n/a
All Manipulation 21.4% 49.4% 56 23.7% 63.4% 38 11.8% 44.2% 68 1 None None Table 17. Comparison of performance using each model/template placement level of effort across all first and second order
manipulation (FOM and SOM) subtasks.
When comparing all manipulation subtasks as a whole, not using models/templates appears to be the least error prone, evidence by fewer failed attempts and critical incidents. However, successfully completing subtasks was higher for levels 1 (significantly) or 2. This suggests that using models/templates at all was more effective than not for completing manipulation tasks. For mobility subtasks, use of model/template placement level of effort 2 generally resulted in fewer errors, more successful subtasks, and less falls than level 1. As such, manual placement by the operator (level 2) may have increased success by making up for the robot/interface’s lack of properly implemented automation. Also, not using models/templates at all resulted in less falls than levels 1 and 2 when comparing OTR subtasks and all mobility subtasks. This may imply that the use of models/templates was not precise enough in some cases, either due to the robot/interface’s automation or the operator’s improper placement. Some teams’ HRI did not have to rely on the use of models/templates (5 of 20 teams, 25%); however, most of those teams (4) were in the bottom 10 performance rankings (see Table 14).
Metric Subtask Function
Model/Template Placement Level of Effort 1
Model/Template Placement Level of Effort 2
Model/Template Placement None Comparisons
avg stdev n avg stdev n avg stdev n 1 vs. 2 2 vs. None
1 vs. None
Percentage of Failed
Attempts
OTF 17.0% 33.4% 10 14.3% 36.3% 14 15.4% 32.6% 40 2 2 None OTR 25.0% 50.0% 4 20.0% 42.2% 10 22.2% 40.4% 57 2 2 None
All Mobility 7.4% 23.0% 23 8.0% 27.7% 25 12.0% 31.3% 164 1 2 1
Percentage of Successful Subtasks
OTF 70.0% 48.3% 10 85.7% 36.3% 14 19.2% 37.5% 40 2 2 1 OTR 75.0% 50.0% 4 80.0% 42.2% 10 21.9% 40.2% 57 2 2 1
All Mobility 87.0% 34.4% 23 92.0% 27.7% 25 12.8% 32.6% 164 2 2 1
Falls Per Attempt
OTF 20.0% 42.2% 10 14.3% 36.3% 14 14.6% 34.0% 40 2 2 None OTR 25.0% 50.0% 4 20.0% 42.2% 10 13.7% 33.5% 57 2 None None
All Mobility 8.7% 28.8% 23 8.0% 27.7% 25 7.5% 25.6% 164 2 None None Table 18. Comparison of performance using each model/template placement level of effort across all obstructed traverse -
foot and robot (OTF and OTR, respectively).

28
6.2.4. Sensor Fusion Using the data in section 5.5.2, each team was classified as using either Type 1 sensor fusion (variable perspective) or both Type 1 and 2 sensor fusion (variable perspective and fixed perspective). Table 19 shows a comparison of these two groups across all mobility and all manipulation subtasks. Overall, teams that used Type 1 and Type 2 sensor fusion (“Type 1+2 teams”) generally performed better than teams that used only Type 1 sensor fusion (“Type 1 teams”). More specifically, Type 1+2 teams made significantly fewer errors, completed more subtasks, and fell less when comparing all mobility subtasks than Type 1 teams. When comparing all manipulation subtasks, Type 1+2 teams performed significantly faster than Type 1 teams.
Metric Subtasks Type 1 Sensor Fusion Type 1+2 Sensor Fusion Comparison avg stdev n avg stdev n 1 vs. 1+2
Percentage of Failed Attempts
All Mobility 35.9% 47.3% 27 6.3% 22.8% 168 1+2** All Manipulation 21.1% 28.3% 26 14.0% 25.3% 118 1+2
Percentage of Successful Subtasks
All Mobility 61.7% 48.7% 27 92.5% 25.7% 168 1+2** All Manipulation 80.8% 37.6% 26 87.3% 32.8% 118 1+2
Relative Duration to Complete Subtasks
All Mobility 111.7% 68.8% 18 98.4% 80.1% 159 1+2 All Manipulation 154.3% 94.5% 22 92.7% 74.7% 105 1+2**
Falls Per Attempt All Mobility 31.5% 46.3% 27 4.1% 19.1% 168 1+2**
All Manipulation 7.7% 27.2% 26 5.1% 22.1% 118 1+2 Table 19. Comparison of performance between teams that used Type 1 (variable perspective) sensor fusion and those that
used Type 1 and Type 2 (fixed perspective) sensor fusion across all mobility (UT, OTF, OTR) and all manipulation (FOM, SOM) subtasks.
Interestingly, teams that employed both types of sensor fusion were using redundant sensor streams and presenting them using two different reference frames: Type 1 is 3D with an adjustable perspective using the point cloud as the reference frame, and Type 2 is 2D with a fixed perspective using the camera view as the reference frame. Nielsen, Goodrich, and Ricks [2007] concluded that sensor fusion displays with an adjustable perspective and common 3D reference frame were more effective than that of 2D fixed displays. Additionally, Okura et al. [2013] suggest that a display using a variable perspective with combined 3D robot avatar resulted in better surroundings recognition by the operator than that of a fixed perspective. The use of just Type 1 sensor fusion meant that the operator was provided with a very exocentric view of task progression, whereas Type 2 sensor fusion gave a much more first-person point of view. There were no teams that used only Type 2 sensor fusion, the findings from this analysis could suggest that if two separate displays are used, with two different reference frames (not necessarily a variable and a fixed perspective; could be two variable perspectives) of the same data streams may actually aid an operator rather than increase his/her workload in these types of scenarios, possibly to reduce the amount of perspective adjustment needed if only one display is used.
6.2.5. Operators A comparison of performance between teams using fixed and rotating operator layouts can be found in Table 20. Many teams used a specific operator who only was active for the Vehicle task and then was no longer present at a station. For analysis purposes, if a team exhibited this behavior and did not swap out operators after completing the Vehicle task, they were classified as using a fixed operator layout (see section 5.5.1).

29
Teams with rotating operator layouts made significantly fewer errors, completed significantly more subtasks, and fell less than those with fixed operator layouts when comparing all mobility subtasks and when comparing across all tasks. Teams with fixed operator completed more manipulation subtasks and fell less across all mobility subtasks than teams with rotating layouts, but only by 1 or 2 percent. All of these findings are evidence of the complexity required to control the humanoid robots used by each team. Each of the operators used to perform each task are specialists in terms of what they feel most comfortable doing with the robot when they are in control. It was observed for some teams that specific tasks prompted these changes, while some were more particular to specific actions (e.g., one team swapped to a different person every time the robot needed to traverse between tasks, and to a different person each time teleoperated manipulation was being performed). While all of these operators were acting independently of one another, they had to maintain a shared understanding of the robot status. Prior research in HRI for disaster response or urban search and rescue suggests that more than one operator make an effective human-robot team [Murphy and Burke, 2005], supporting this finding.
Metric Subtasks or Tasks
Teams That Used Rotating Operator Layouts
Teams That Used Fixed Operator Layouts Comparison
avg stdev n avg stdev n Rotating vs. Fixed
Percentage of Failed
Attempts
All Mobility 3.9% 18.9% 83 16.8% 35.7% 114 Rotating** All Manipulation 13.0% 24.2% 55 16.6% 27.0% 89 Rotating
All Tasks 10.5% 22.9% 69 21.1% 30.4% 103 Rotating*
Percentage of Successful Subtasks
All Mobility 95.2% 21.6% 83 81.6% 37.9% 114 Rotating** All Manipulation 85.5% 35.6% 55 86.5% 32.7% 89 Fixed
All Tasks 91.3% 28.3% 138 83.7% 35.7% 203 Rotating*
Falls Per Attempt
All Mobility 2.4% 15.4% 83 11.7% 31.3% 114 Rotating* All Manipulation 9.1% 29.0% 55 3.4% 18.2% 89 Fixed
All Tasks 10.1% 30.4% 69 16.5% 36.0% 103 Rotating
Other Critical Incidents Per
Attempt
All Mobility 1.2% 11.0% 83 0.0% 0.0% 114 Fixed All Manipulation 14.6% 40.5% 55 20.2% 56.8% 89 Rotating
All Tasks 6.5% 27.6% 138 8.9% 38.8% 203 Rotating Table 20. Comparison of performance between teams that used rotating operator layouts vs. those that used fixed operator
layouts across all mobility (UT, OTF, OTR) and all manipulation (FOM, SOM) subtasks, and all task performance.
6.3. Communications Strategy Teams’ communication links between their control station and the robot were limited when the robot was in the first 45 minutes of operation and was “inside” the simulated disaster scenario (marked between the frame of the Door task and the exit after the Rubble tasks). The amount of communication degradation (i.e., the number of discarded packets) was slowly decreased as the run approached the 45 minute cutoff, enabling less capable teams to make increased progress over the course of a run. See Figure 4 for an example plot of the average data from the robot to the control station for one team’s run. Communications related to HRI at the DRC Finals can be evaluated in the context of information sent to the robot, or as information sent to the operator. These similar yet distinctly different quantities can loosely suggest different items: 1. Reduced information sent from the operator to the robot could imply the increasing amount of autonomy used by the robot (suggesting that there is minimal information required to be sent; potentially a simple “go” command); and 2. Reduced information sent from the robot to the operator could suggest increased decision making capability within the robot (thus presenting simpler, context rich, data/decisions to the operator; e.g., an indicator of where an object is
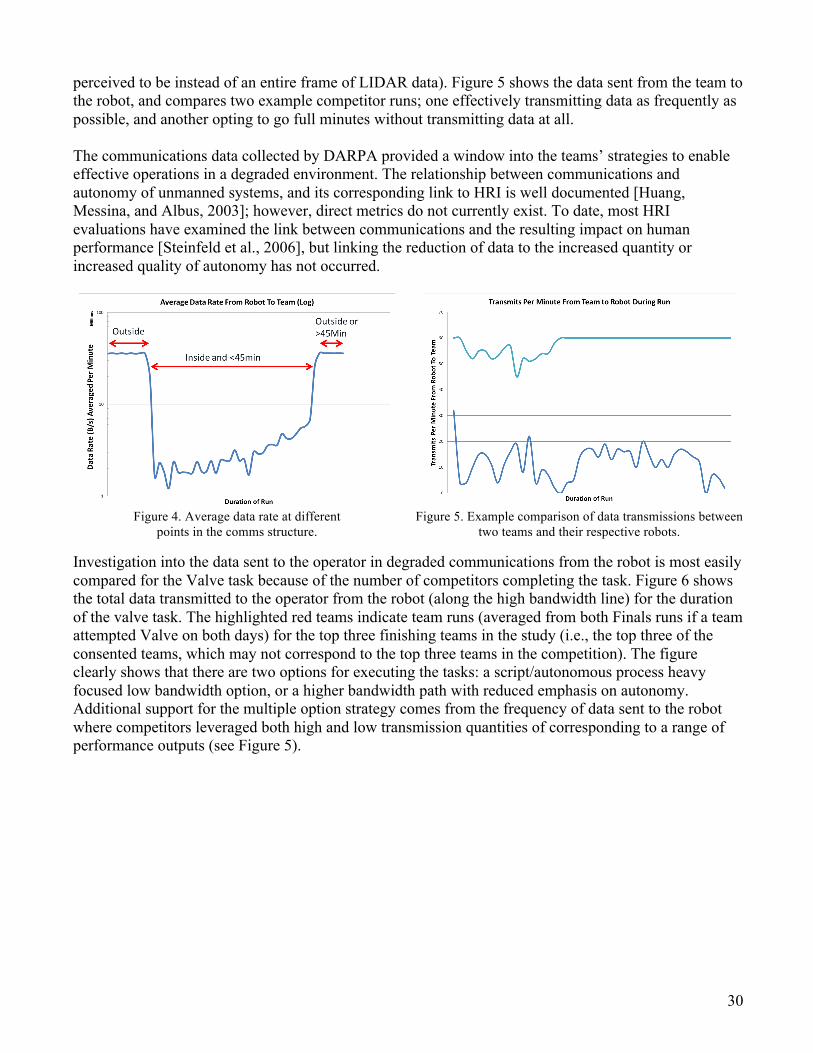
30
perceived to be instead of an entire frame of LIDAR data). Figure 5 shows the data sent from the team to the robot, and compares two example competitor runs; one effectively transmitting data as frequently as possible, and another opting to go full minutes without transmitting data at all. The communications data collected by DARPA provided a window into the teams’ strategies to enable effective operations in a degraded environment. The relationship between communications and autonomy of unmanned systems, and its corresponding link to HRI is well documented [Huang, Messina, and Albus, 2003]; however, direct metrics do not currently exist. To date, most HRI evaluations have examined the link between communications and the resulting impact on human performance [Steinfeld et al., 2006], but linking the reduction of data to the increased quantity or increased quality of autonomy has not occurred.
Figure 4. Average data rate at different
points in the comms structure. Figure 5. Example comparison of data transmissions between
two teams and their respective robots.
Investigation into the data sent to the operator in degraded communications from the robot is most easily compared for the Valve task because of the number of competitors completing the task. Figure 6 shows the total data transmitted to the operator from the robot (along the high bandwidth line) for the duration of the valve task. The highlighted red teams indicate team runs (averaged from both Finals runs if a team attempted Valve on both days) for the top three finishing teams in the study (i.e., the top three of the consented teams, which may not correspond to the top three teams in the competition). The figure clearly shows that there are two options for executing the tasks: a script/autonomous process heavy focused low bandwidth option, or a higher bandwidth path with reduced emphasis on autonomy. Additional support for the multiple option strategy comes from the frequency of data sent to the robot where competitors leveraged both high and low transmission quantities of corresponding to a range of performance outputs (see Figure 5).
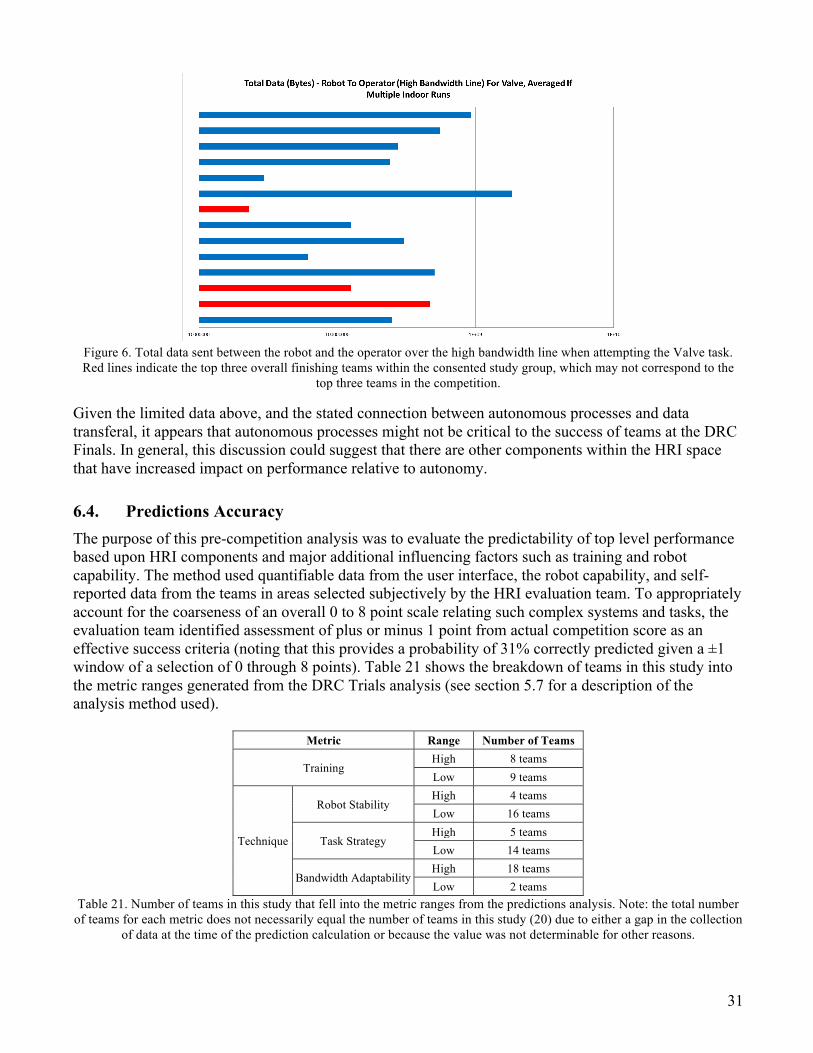
31
Figure 6. Total data sent between the robot and the operator over the high bandwidth line when attempting the Valve task. Red lines indicate the top three overall finishing teams within the consented study group, which may not correspond to the
top three teams in the competition.
Given the limited data above, and the stated connection between autonomous processes and data transferal, it appears that autonomous processes might not be critical to the success of teams at the DRC Finals. In general, this discussion could suggest that there are other components within the HRI space that have increased impact on performance relative to autonomy.
6.4. Predictions Accuracy The purpose of this pre-competition analysis was to evaluate the predictability of top level performance based upon HRI components and major additional influencing factors such as training and robot capability. The method used quantifiable data from the user interface, the robot capability, and self-reported data from the teams in areas selected subjectively by the HRI evaluation team. To appropriately account for the coarseness of an overall 0 to 8 point scale relating such complex systems and tasks, the evaluation team identified assessment of plus or minus 1 point from actual competition score as an effective success criteria (noting that this provides a probability of 31% correctly predicted given a ±1 window of a selection of 0 through 8 points). Table 21 shows the breakdown of teams in this study into the metric ranges generated from the DRC Trials analysis (see section 5.7 for a description of the analysis method used).
Metric Range Number of Teams
Training High 8 teams Low 9 teams
Technique
Robot Stability High 4 teams Low 16 teams
Task Strategy High 5 teams Low 14 teams
Bandwidth Adaptability High 18 teams Low 2 teams
Table 21. Number of teams in this study that fell into the metric ranges from the predictions analysis. Note: the total number of teams for each metric does not necessarily equal the number of teams in this study (20) due to either a gap in the collection
of data at the time of the prediction calculation or because the value was not determinable for other reasons.

32
Given that these methods leveraged quantifiable data, an update was made to the initial values during the event based on information that was not provided during pre-event interviews, and included changes in self-reported data or observed robot and team operation that conflicted with self-reported data. To more appropriately reflect the performance of the predictions, teams that were unable to complete the tasks due to extenuating circumstances (e.g. servo firmware issues) that drastically altered their performance within the rules of the event were removed. Ultimately, this analysis produced 71% correct predictions (see Table 22).
Evaluation Number of Teams
Number of Correct Predictions
Percentage of Correct Predictions
Random n/a n/a 31% Competitor Self-Predicted (Without Extenuating Circumstance Teams) 17 7 45%
Updated Team Characteristics At Event 20 12 60% Model Without Extenuating Circumstance Teams 17 12 71%
Table 22. The results of the prediction analysis at each level of evaluation.
In future studies, the evaluation team will develop and update the model to address the teams that it inaccurately predicted (only 3 of the 20) and also to apply it beyond the DRC events.
6.5. The Value of HRI The team measurement of “Technique” captures additional aspects of team strategies, including robot stability, task strategy, and bandwidth adaptation (as discussed in section 6.4). To determine statistical significance, the top vs. bottom teams in each category were compared using the same performance metrics in addition to an average of the successful task completions (akin to points scored in the competition). Table 23 shows the results of this statistical comparison, revealing a strong correlation between these two aspects of team strategy and performance.
Performance Metric Technique
High Low T-test Comparison Average Number of Successful Task Attempts 4.5 1.7 High**
Average Speed to Complete Tasks 62% 40% High ** Average Percentage of Successful Task Attempts 83% 48% High ** Average Critical incidents per Subtask Attempts 8% 24% High *
Table 23. Comparisons of non-HRI related aspects of performance.
Additional higher-level groupings of the team interaction method characteristics in section 5.5 were determined, breaking down teams into two groups for the following HRI-related aspects of performance:
• Average number of operators: fewer than 2 vs. 2 or more • Sensor fusion: high (“High” and “Medium” amounts) vs. low (“Low” amounts and “None”) • Simulation before execution: used this technique vs. did not
This analysis is shown in Table 24. One could make the argument that “Training” is a good representation of additional HRI factors, considering the development of these robots and interactions for the DRC. The training in this situation effectively replaces interface factors such as intuitiveness and ease-of-use, though in the example of the DRC Finals it is also a good indication of overall team progress. Additionally, the “Bandwidth Adaptability” aspect of the teams’ “Technique” evaluation could also be considered to have some aspect of HRI included; some teams included methods for improving situation awareness during low-

33
bandwidth operation as opposed to software and other tactics for reducing the need for bandwidth. However, this is a relatively small part of the “Technique” metric overall.
Metric Training Sensor Fusion Simulation Before
Execution Average Number of Active
Operators
High Low Comparison High Low Comparison Used Not Used Comparison Less
Than 2 2 or
More Comparison
Average Number of Successful Task Attempts 3.9 1.1 High** 3.0 0.6 High** 3.2 1.5 Used* 2.8 1.5 Less Than 2
Average Speed to Complete Tasks 63% 37% High** 49% 43% High 49% 47% Used 52% 41% Less Than 2
Average Percentage of Successful Attempts 67% 41% High* 62% 27% High** 59% 42% Used 59% 33% Less Than 2*
Average Critical Incidents Per Subtask Attempts 14% 23% High 19% 29% High 19% 24% Used 21% 23% Less Than 2
Table 24. Comparisons of HRI related aspects of performance.
Finally, in an effort to explore causality between the specific interface techniques (sensor fusion, simulation before execution, and the number of operators), teams within the high “Training” and high “Technique” groups were evaluated (see Table 25). These groups were broken down into two more groups of teams – those who exhibited higher levels of sensor fusion, use of simulation before execution, and lower number of operators vs. those who did not. Across all of these comparisons, only correlations between those using simulation before execution and those that did not were statistically significant. Through this analysis, other comparisons were revealed including: 1. All teams within the high “Training” group also exhibited higher levels of sensor fusion, and 2. Only one team within the high “Technique” group did not have sensor fusion.
Metric With High Level Training High Level Technique
Used Sim Before Execution
Did Not Use Sim Before Execution Comparison Used Sim Before
Execution Did Not Use Sim Before Execution Comparison
Team Count 8 9 n/a 6 6 n/a Average Critical
Incidents Per Subtask Attempts
0.1 0.1 n/a 0.1 0.0 Did Not Use Sim
Before Execution**
Average Successful Number of Attempts 5.9 2.2 Used Sim Before
Execution** 5.7 3.3 Used Sim Before Execution
Table 25. Comparisons of high level of training and high level of technique with or without the use of simulation before execution.
The key finding from these analyses comes from consideration of the number of successful task attempts. The high “Technique” group has a strong connection to increased performance – a difference of 2.8 successful attempts on average (see Table 23). The “Training” aspect also has an equally strong connection to performance – again a difference of 2.8 successful attempts on average (see Table 24). At the next level, consider teams that used simulation before execution. As shown in Table 25, for teams with the highest level of “Technique” there appears to be a correlation with success – a difference of 2.4 successful attempts on average. An even stronger correlation shows a difference of 3.7 for teams with high levels of “Training.” Based on these observations and those in previous sections, it can be suggested that in order for a team to perform well against their competitors they needed high levels of “Technique” and “Training,” in addition to using simulation before execution and high sensor fusion.
34
7. Lessons Learned From this study, two sets of lessons learned can be gleaned: effective HRI characteristics exhibited by successful teams at the DRC and recommendations for conducting large-scale studies of robot competitions or field deployments similar to the DRC.
7.1. Effective HRI at the DRC The DRC Finals added difficulty not present in the Trials by requiring tasks to be completed in succession during a run with harsher degraded communications, with the requirement that the robots be completely untethered throughout task performance, and with surprise tasks that changed between competition days. These updates to the structure of the competition were aimed at influencing teams to implement more autonomy in their systems and robust control methods. In general, both of these characteristics have been observed, albeit in different ways and with variable impacts on performance. The lessons learned presented in this section are summarized into HRI design guidelines in section 8. From the analysis and results presented in section 6, teams competing in the DRC Finals exhibited one or more of the following HRI characteristics to achieve success:
1. More autonomy from the robot/interface to perform simpler manipulation tasks (e.g., FOM: Door, Valve, Surprise-Lever) (see Table 15).
2. More interaction from the operator to perform complex manipulation tasks (e.g., SOM: Wall, Surprise-Plug) (see Table 15).
3. Use of input and output methods that can operate in both degraded and full communications, evidenced by interaction methods relying on the robot avatar that remained up to date from joint encoder values sent over the low bandwidth line (see Table 4 and Table 6).
4. More autonomy from the robot/interface to perform simple mobility tasks (e.g., UT; traversing over flat ground) (see Table 16).
5. More interaction from the operator to augment robot/interface autonomy when performing mobility tasks that required changing elevations (e.g., OTF: Rubble-Terrain, Stairs) (see Table 16).
6. More interaction from the operator to manually place models/templates to assist the robot/interface autonomy in performing manipulation and mobility tasks (see Table 17 and Table 18).
7. Use two instances of sensor fusion with the same data streams, but from different reference frames (see Table 19).
8. More than one operator, either simultaneously and/or rotating, to split responsibilities in task execution (see Table 20).
9. Operators that are well trained and had ample practice ahead of the competition (see Table 24 and Table 25).
Table 26 shows how each of these HRI characteristics apply to each team in this study. Of the top 10 performing teams, all but one exhibited 6 or more of the characteristics. Of the bottom 10 performing teams, all but one exhibited 5 or less of the characteristics. These characteristics can be representative of the current state of the art with respect to HRI for remote operation of a humanoid robot. Humanoid autonomy was observed to assist with manipulation tasks, but a human operator was still needed to aid in identifying parts of the tasks to the robot (evidenced by the use of models/templates). For instance, the Wall and Surprise-Plug tasks involved the robot manipulating a free-moving object and ultimately maneuvering the object’s end effector (i.e., the drill bit and the plug end) to a specified location and/or in a certain motion. Most operators were responsible

35
for guiding the objects properly with their control methods (e.g., by using manipulation level of effort 2), remaining active in the execution of the task. Balancing and shifting center of gravity for performing simple mobility tasks on flat ground was observed to be largely handled by the robot. For tasks like the Rubble-Terrain and Stairs, some teams did use interface modalities to indicate the robot’s center of gravity or had audible indicators of the center of mass shifting to an unstable position. These are all good examples of operators avoiding the out-of-the-loop problem [Endsley, 1996] and splitting responsibilities between robot and operator, as suggested by many supervised autonomy design approaches, such as coactive design [Johnson et al., 2014].
Subtask Performance on All Tasks
HRI Characteristics Suggesting Positive Impact on Performance (see list in section 7) 1 2 3 4 5 6 7 8 9
Total number
exhibited % of
Successful Subtasks
% of Failed
Attempts
Manipulation Level of Effort
1 on FOM Subtasks
Manipulation Level of Effort 2 or 3 on SOM
Subtasks
Robot Avatar in Degraded Comms
Mobility Level of Effort 1 or 2 on UT
Subtasks
Mobility Level of Effort
3 on OTF Subtasks
Model/ Template Placement
Level 2
Type 1+2 Sensor Fusion
Multiple Operators
Reported High
Training Time
97.2% 4.5% ✔ ✔ ✔ ✔ ✔ ✔ 6 95.8% 4.6% ✔ ✔ ✔ ✔ ✔ ✔ 6 94.6% 3.7% ✔ ✔ ✔ ✔ ✔ ✔ ✔ ✔ ✔ 9 94.3% 10.2% ✔ ✔ ✔ ✔ ✔ ✔ ✔ 7 92.9% 7.5% ✔ ✔ ✔ ✔ ✔ 5 92.9% 11.5% ✔ ✔ ✔ ✔ ✔ ✔ ✔ ✔ ✔ 9 91.2% 11.8% ✔ ✔ ✔ ✔ ✔ ✔ 6 86.7% 14.4% ✔ ✔ ✔ ✔ ✔ ✔ 6 84.4% 15.6% ✔ ✔ ✔ ✔ ✔ ✔ 6 83.3% 14.8% ✔ ✔ ✔ ✔ ✔ ✔ 6
Top 10 performing teams above this row; bottom 10 performing teams below this row. 83.3% 31.7% ✔ ✔ ✔ 3 78.6% 37.7% ✔ ✔ ✔ 3 75.0% 27.0% ✔ ✔ ✔ ✔ ✔ 5 70.0% 27.1% ✔ ✔ ✔ ✔ ✔ ✔ 6 69.4% 25.0% ✔ ✔ ✔ ✔ 4 62.5% 18.3% ✔ ✔ ✔ ✔ ✔ 5 50.0% 20.0% ✔ ✔ ✔ ✔ ✔ 5 50.0% 60.0% ✔ ✔ ✔ ✔ ✔ 5 22.2% 83.3% ✔ ✔ ✔ 3 0.0% 100.0% ✔ ✔ 2
Table 26. Specific HRI characteristics exhibited by each team that are suggested to have positively impacted performance at the DRC Finals. Each row corresponds to a team in the competition. The data is sorted based on percentage of successful
subtasks across all tasks.
Given the complexity of both the robot and the interaction methods, it is no surprise that team members would specialize and increase the number of operators. It should be noted, though, that one of the top performing teams in the competition consisted of a single operator who performed all tasks. This operator spent significant time training with the robot (making them the exception to characteristic 8 in the list above), and that team’s interaction method used mostly level of effort 2 control. Conversely, another of the top performing teams in the competition used a rotating operator layout that changed very frequently, and mostly used level of effort 1 control methods. Both of these teams used type 1 and type 2 sensor fusion, which is suggested to have increased team performance (see Table 19), and both noted they had significant training time. The causality analysis discussed previously (see Table 20) considers the aspect of training time as having a very large impact on team performance, in conjunction with their interaction method characteristics. The predictions analysis (see section 6.4) is further evidence of the correlation between these factors in both the DRC Trials and Finals.

36
Some of the findings in this article should be taken within the perspective of the DRC Finals tasks and the surrounding environment that impacted the mission space: development. Progress of the team development efforts likely had large impact on the amount of training executed. It should be noted that in most cases, the interfaces were designed by and for the developers of the system. This fact may have contributed to the need for specialization or, in the instances of a single operator, for large amounts of training. Therefore, time or development issues that impacted the quantity of training time showed an impact on performance. Generally, this corresponds to data regarding the importance of training at the DRC Finals (see section 6.5), where competitors with minimal training time would not have been able to develop the nuance and detail required to effectively control the complex robots.
7.2. Conducting Large-Scale HRI Evaluations Robot competitions can be very rich displays of combinations of robotic capabilities and varying approaches, making them great venues for research and analysis. With experience performing HRI analyses of both the DRC Trials [Yanco et al., 2015] and the DRC Finals, important lessons learned with respect to conducting large-scale HRI evaluations are:
• For events with high-risk consequences based on robot performance, limit interaction with participants to before or after the action being evaluated, not during.
• Conduct pre-event interviews to gather all information needed to accurately observe performance, particularly in the control room.
• Develop data collection techniques and planned analyses of collected data to operate within limitations of event structure.
• For events with varying robots and interfaces to be observed, generate a taxonomy of HRI characteristics to compare performance using a common language.
• Only correlate exhibited HRI characteristics with their resulting robot performance on the field, not overall characteristics with overall performance.
There are limitations for any HRI study, whether occurring in a controlled lab setting or as part of a competition or field deployment. For the latter, not disturbing or obstructing the participant’s performance is paramount [Yanco and Drury, 2007], even more so if it could result in poor competition standing, the loss of funding, and/or real world disaster. Control room observers in this study only interacted with robot operators before and after competition runs, if warranted, although even that level of interaction was kept to a bare minimum. Even though teams consented to participate in the study, we did not want to introduce additional performance pressures. By conducting pre-competition interviews to generate documents outlining each team’s approach (see section 4.1), all evaluation team members were able to study the teams they were going to observe ahead of time. This method enabled each observer to have a proper understanding of teams’ control room actions for accurate data collection and limited post-run questioning to pertain only to resulting run performance. If the experiment and associated robot tasks are designed by the same team studying HRI, mechanisms can be put in place to allow for certain data collection methods, such as automated analysis of robot performance logs [Schreckenghost and Milam, 2010]. Techniques like this are made possible due to the standardization of experiment components, such as fixing the robot platform or specifying that robot commands be sent using a certain programming language, neither of which were enforced for the DRC. Also, this study was of a competition that we did not design, so much like a real world scenario our data collection methods adapted to the event restrictions. The point structure of the DRC Finals relied purely on actions that were directly observable by the human eye; so too were our data collection means. The task and subtask breakdown (see section 5.1) only addresses robot motions for this reason, limiting some possible avenues for analysis (e.g., no explicit and quantifiable method of determining the amount of

37
autonomy vs. teleoperation), but it also made the validation of data recorded in-situ very simple by reviewing video footage, which DARPA recorded extensively and informed us ahead of time that would be provided after the competition. For HRI studies involving a variety of robotic platforms and interfaces (like the DRC Finals), it is important to distill interaction characteristics into higher-level categories with a focus on the level of information provided to or from the operator. Doing so in this manner results in findings that can be more broadly applied to field of HRI, rather than the intricacies of a particular interaction method technique. Each technique and its associated features could be the subject of its own study entirely. Large-scale studies where an entire system is developed to accomplish a common set of tasks, like that of the DRC, need a common language to describe the HRI characteristics across many different approaches, like categories of sensor fusion (see section 5.5.2) and control methods (see section 5.5.3). In order to apply these categories properly while taking notes in the control room, a deeper understanding of each team’s interaction method was needed, further aided by conducting pre-competition interviews. Given the many different tasks performed at the DRC, team interaction methods varied throughout the course of each run, particularly with respect to control method levels of effort. Due to this variation of control methods, correlating overall interface characteristics with overall performance would not be accurate, even more so for teams that planned to use certain techniques for tasks that they ultimately were not able to attempt. Rather, only HRI characteristics exhibited in the control room should be correlated with the robot actions that were performed on the field as a result of their usage. With only directly observable actions available for analysis, correlating observations from the control room and the field on a minute-by-minute basis is one option (see section 4.2). Our previous study of the DRC Trials [Yanco et al., 2015] was unable to track HRI techniques per minute action as most team information was gathered on-site at the competition and during task runs, resulting in less detailed findings.
8. Design Guidelines Based upon the analyses presented in this paper, the following set of design guidelines for HRI with remote, semi-autonomous humanoid robots is proposed. The guidelines below are generated based on the successful HRI characteristics outlined in section 7.1. Balance the capabilities of the operator and the system to effectively perform the task. Allow the human operator to provide assistance to the robot in terms of operation of an independent tool (e.g., maneuvering the robot’s arm/hand to position the grasped tool’s end effector using manipulation level of effort 2; see section 6.2.1), modifying footsteps planned by the robot/interface when changing ground elevations (i.e., mobility level of effort 3; see section 6.2.2), and identification of objects (e.g., placement of models/templates; see section 6.2.3). Enable the robot/interface to automate processes like inverse kinematics for manipulation tasks and balance on flat ground for mobility tasks. Keep the operator in the loop. Design HRI that requires steady interaction from the operator that supports and benefits from the autonomy of the robot. Use methods like the placement of models/templates to supply task-relevant object information such that the operator and the system are “speaking the same language” and both interacting more directly with the task (see section 6.2.3). Maintain operator awareness of robot state and use consistent control methods that function regardless of bandwidth. Implement HRI that functions on minimal data streams regardless of communications strength, such as joint encoder values to display a 3D robot avatar on the interface to
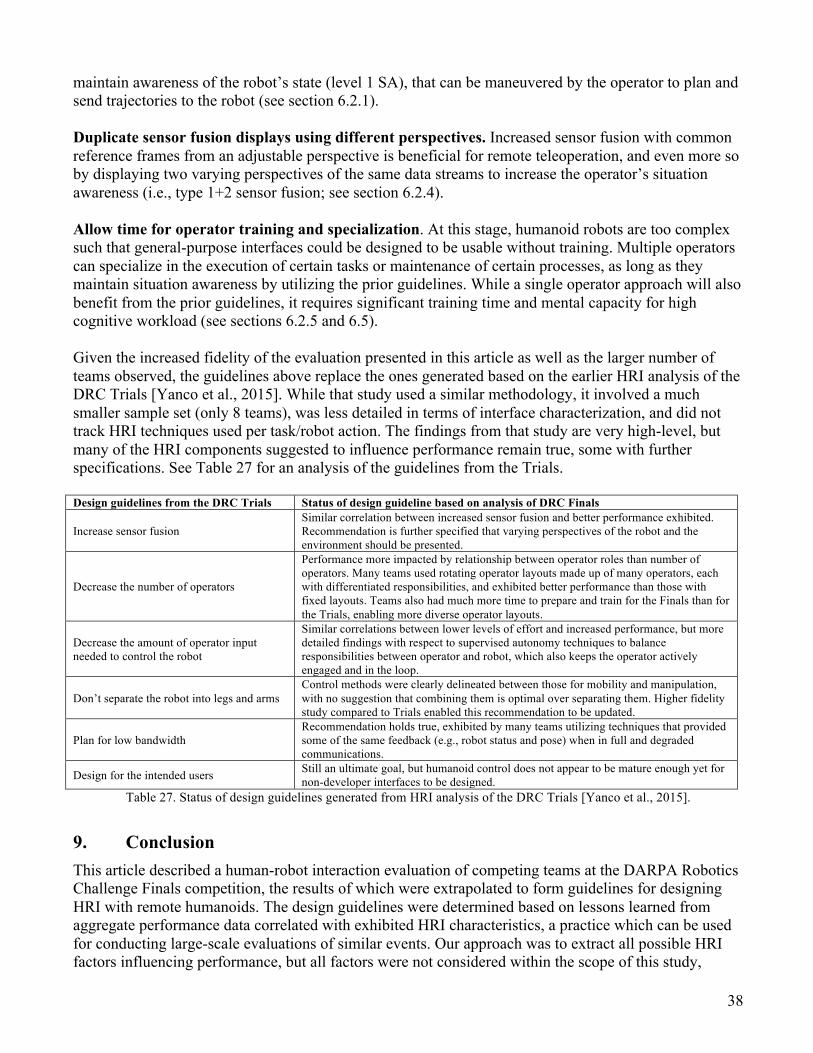
38
maintain awareness of the robot’s state (level 1 SA), that can be maneuvered by the operator to plan and send trajectories to the robot (see section 6.2.1). Duplicate sensor fusion displays using different perspectives. Increased sensor fusion with common reference frames from an adjustable perspective is beneficial for remote teleoperation, and even more so by displaying two varying perspectives of the same data streams to increase the operator’s situation awareness (i.e., type 1+2 sensor fusion; see section 6.2.4). Allow time for operator training and specialization. At this stage, humanoid robots are too complex such that general-purpose interfaces could be designed to be usable without training. Multiple operators can specialize in the execution of certain tasks or maintenance of certain processes, as long as they maintain situation awareness by utilizing the prior guidelines. While a single operator approach will also benefit from the prior guidelines, it requires significant training time and mental capacity for high cognitive workload (see sections 6.2.5 and 6.5). Given the increased fidelity of the evaluation presented in this article as well as the larger number of teams observed, the guidelines above replace the ones generated based on the earlier HRI analysis of the DRC Trials [Yanco et al., 2015]. While that study used a similar methodology, it involved a much smaller sample set (only 8 teams), was less detailed in terms of interface characterization, and did not track HRI techniques used per task/robot action. The findings from that study are very high-level, but many of the HRI components suggested to influence performance remain true, some with further specifications. See Table 27 for an analysis of the guidelines from the Trials. Design guidelines from the DRC Trials Status of design guideline based on analysis of DRC Finals
Increase sensor fusion Similar correlation between increased sensor fusion and better performance exhibited. Recommendation is further specified that varying perspectives of the robot and the environment should be presented.
Decrease the number of operators
Performance more impacted by relationship between operator roles than number of operators. Many teams used rotating operator layouts made up of many operators, each with differentiated responsibilities, and exhibited better performance than those with fixed layouts. Teams also had much more time to prepare and train for the Finals than for the Trials, enabling more diverse operator layouts.
Decrease the amount of operator input needed to control the robot
Similar correlations between lower levels of effort and increased performance, but more detailed findings with respect to supervised autonomy techniques to balance responsibilities between operator and robot, which also keeps the operator actively engaged and in the loop.
Don’t separate the robot into legs and arms Control methods were clearly delineated between those for mobility and manipulation, with no suggestion that combining them is optimal over separating them. Higher fidelity study compared to Trials enabled this recommendation to be updated.
Plan for low bandwidth Recommendation holds true, exhibited by many teams utilizing techniques that provided some of the same feedback (e.g., robot status and pose) when in full and degraded communications.
Design for the intended users Still an ultimate goal, but humanoid control does not appear to be mature enough yet for non-developer interfaces to be designed.
Table 27. Status of design guidelines generated from HRI analysis of the DRC Trials [Yanco et al., 2015].
9. Conclusion This article described a human-robot interaction evaluation of competing teams at the DARPA Robotics Challenge Finals competition, the results of which were extrapolated to form guidelines for designing HRI with remote humanoids. The design guidelines were determined based on lessons learned from aggregate performance data correlated with exhibited HRI characteristics, a practice which can be used for conducting large-scale evaluations of similar events. Our approach was to extract all possible HRI factors influencing performance, but all factors were not considered within the scope of this study,

39
including robot locomotion methods (e.g., biped, quadruped, and wheeled), camera placement (e.g., video feedback from the robot’s hands vs. head), and manipulation gripper type (e.g., two vs. three fingers). Each of the proposed design guidelines should then be investigated further in targeted experiments to explore the complexities of each that are not covered in this article. Continued research is needed to further the improvement of an operator’s ability to interact with and control remote humanoid robots. HRI design for much simpler wheeled (or tracked) ground robot systems is still lacking in terms of giving equal consideration to the capabilities of the human, the robot, the interface, and the relationships between them, despite two decades of development. As the development of HRI for remote humanoids continues to grow, we have the opportunity to take lessons learned from the DRC, as well as from other types of robots, to move forward more quickly. As robot hardware and its use cases continue to evolve, so too must the way that we design HRI. While point cloud representations are on many interfaces now, they were not ten years ago. As new sensors and better autonomy becomes available, the way we interact with robots will need to change. We can learn lessons from past designs, but we need to think beyond them as well.
Acknowledgements This research has been supported in part by DARPA under W31P4Q-13-C-0136. The views, opinions, and/or findings expressed are those of the authors and should not be interpreted as representing the official views or policies of the Department of Defense or the U.S. Government. Approved for Public Release, Distribution Unlimited. Gill Pratt, Mark Micire, Eric Krotkov, and Jim Pippine at DARPA have greatly assisted the evaluation team in many ways, providing guidance and aiding in organization, ultimately enabling the execution of this study. Chris Wellens and Karl Auerbach from IWL facilitated access to the team communications data, and Adam Watson of Mechanismo provided recorded video of the competition for our review. Clementina Russo at AnthroTronix aided with background research. Wendell Sykes at Context Systems provided continued insight and direction throughout this entire program. Many thanks to all of the staff members of the DARPA Robotics Challenge for their assistance on-site. Finally, thank you to all of the teams that consented to participate in this study for hosting us at your home sites, providing information and walkthroughs of your interfaces and robots, and for allowing us to observe during the competition.

40
References F. Amigoni, E. Bastianelli, J. Berghofer, A. Bonarini, G. Fontana, N. Hochgeschwender, L. Iocchi, G. Kraetzschmar, P. Lima, M. Matteucci, and P. Miraldo (2015). “Competitions for Benchmarking: Task and Functionality Scoring Complete Performance Assessment.” Robotics & Automation Magazine, 22(3): 53-61. I. M. Bullock, R. R. Ma, and A. M. Dollar (2013). “A hand-centric classification of human and robot dexterous manipulation.” IEEE Transactions on Haptics, 6(2): 129-144. J. L. Burke (2004). “Moonlight in Miami: A field study of human-robot interaction in the context of an urban search and rescue disaster response training exercise.” Master’s Thesis, University of South Florida, http://scholarcommons.usf.edu/etd/973. J. Carlson, and R. R. Murphy (2005). “How UGVs physically fail in the field.” IEEE Transactions on Robotics, 21(3): 423-437. DARPA (2014). “DRC Trials Score Analysis, Anonymous.” http://www.theroboticschallenge.org/dashboard/scoreboard/DRCTrialsScoresAnalysisAnonymousv11DISTAR22423.pdf, accessed March 2014. DARPA (2015). “DRC Finals Rule Book.” http://darparoboticschallenge.com/sites/default/files/docs/2015_04_09_DRC_Finals_Rule_Book_DISTAR_24388.pdf, accessed February 2016. M. DeDonato, V. Dimitrov, R. Du, R. Giovacchini, K. Knoedler, X. Long, F. Polido, M. A. Gennert, T. Padır, S. Feng, H. Moriguchi, E. Whitman, X. Xinjilefu, and C. G. Atkeson (2015). “Human‐in‐the‐loop control of a humanoid robot for disaster response: A report from the DARPA Robotics Challenge Trials.” Journal of Field Robotics, 32(2): 275-292, March. M. R. Endsley (1995). “Toward a theory of situation awareness in dynamic systems.” Human Factors: The Journal of the Human Factors and Ergonomics Society, 37(1): 32-64. M. R. Endsley (1996). “Automation and situation awareness.” Automation and Human Performance: Theory and Applications, pp. 163-181. M. Fallon, S. Kuindersma, S. Karumanchi, M. Antone, T. Schneider, H. Dai, C. P. D'Arpino, R. Deits, M. DiCicco, D. Fourie, and T. Koolen (2015). “An Architecture for Online Affordance‐based Perception and Whole‐body Planning.” Journal of Field Robotics, 32(2): 229-254. J. L. Fleiss (1981). “Statistical Methods for Rates and Proportions.” New York: John Wiley & Sons. H.-M. Huang, E. Messina, and J. Albus (2003). “Autonomy level specification for intelligent autonomous vehicles: Interim Progress Report.” Proceedings of the Performance Metrics for Intelligent Systems (PerMIS) Workshop, Gaithersburg, MD, August. M. Johnson, J. M. Bradshaw, P. J. Feltovich, C. M. Jonker, M. B. Van Riemsdijk, and M. Sierhuis (2014). “Coactive Design: Designing Support for Interdependence in Joint Activity.” Journal of Human-Robot Interaction, 3(1).

41
M. Johnson, B. Shrewsbury, S. Bertrand, T. Wu, D. Duran, M. Floyd, P. Abeles, D. Stephen, N. Mertins, A. Lesman, and J. Carff (2015). “Team IHMC's Lessons Learned from the DARPA Robotics Challenge Trials.” Journal of Field Robotics, 32(2): 192-208. S. Kohlbrecher, A. Romay, A. Stumpf, A. Gupta, O. von Stryk, F. Bacim, D. A. Bowman, A. Goins, R. Balasubramanian, and D. C. Conner (2015). “Human‐robot Teaming for Rescue Missions: Team ViGIR's Approach to the 2013 DARPA Robotics Challenge Trials.” Journal of Field Robotics, 32(3), pp. 352-377. H. Kitano (2000). “RoboCup Rescue: A grand challenge for multi-agent systems.” Proceedings of the International Conference on Multi-Agent Systems (ICMAS-2000), Boston, MA, July.
J. Landis and G. G. Koch (1977). “The measurement of observer agreement for categorical data.” Biometrics, (33): 159-174.
M. J. Micire (2002). Analysis of Robotic Platforms Used at the World Trade Center Disaster. MS Thesis, Department of Computer Science and Engineering, University of South Florida. R. R. Murphy and J. L. Burke (2005). “Up from the rubble: Lessons learned about HRI from search and rescue.” In Proceedings of the Human Factors and Ergonomics Society Annual Meeting, 49(3): 437-441, September. R. R. Murphy, and D. Schreckenghost (2013). "Survey of metrics for human-robot interaction." In 8th ACM/IEEE International Conference on Human-Robot Interaction (HRI), pp. 197-198. K. Nagatani, S. Kiribayashi, Y. Okada, K. Otake, K. Yoshida, S. Tadokoro, T. Nishimura, T. Yoshida, E. Koyanagi, M. Fukushima, and S. Kawatsuma (2013). “Emergency response to the nuclear accident at the Fukushima Daiichi Nuclear Power Plants using mobile rescue robots.” Journal of Field Robotics, 30(1): 44–63, January/February. C. W. Nielsen, M. Goodrich, and R. W. Ricks (2007). “Ecological interfaces for improving mobile robot teleoperation.” IEEE Transactions on Robotics, 23(5): 927-941. ROS (2016). “ROS.org | Powering the world’s robots.” http://www.ros.org/, accessed July 2016. F. Okura, Y. Ueda, T. Sato, and N. Yokoya (2013). “Teleoperation of mobile robots by generating augmented free-viewpoint images.” In 2013 IEEE/RSJ International Conference on Intelligent Robots and Systems (IROS), pp. 665-671, November. D. R. Olsen, and M. A. Goodrich (2003). "Metrics for evaluating human-robot interactions." In Proceedings of PERMIS 2003. J. Pellenz, A. Jacoff, T. Kimura, E. Mihankhah, R. Sheh, and J. Suthakorn (2014). “RoboCup Rescue Robot League.” In RoboCup 2014: Robot World Cup XVIII, 673-685. N. A. Radford, P. Strawser, K. Hambuchen, J. S. Mehling, W. K. Verdeyen, A. S. Donnan, J. Holley, J. Sanchez, V. Nguyen, L. Bridgwater, and R. Berka (2015). “Valkyrie: NASA's First Bipedal Humanoid Robot.” Journal of Field Robotics, 32(3): 397-419.
42
A. Settimi, C. Pavan, V. Varricchio, E. M. Hoffman, A. Rocchi, K. Melo, N. G. Tsagarakis, and A. Bicchi (2014). “A modular approach for remote operation of humanoid robots in search and rescue scenarios.” Proceedings of Modeling and Simulation for Autonomous Systems: First International Workshop, MESAS 2014, Rome, Italy, May. A. Steinfeld, T. Fong, D. Kaber, M. Lewis, J. Scholtz, A. Schultz, and M. Goodrich (2006). “Common metrics for human-robot interaction.” Proceedings of the 1st ACM SIGCHI/SIGART Conference on Human-Robot Interaction, Salt Lake City, Utah, March. A. Stentz, H. Herman, A. Kelly, E. Meyhofer, G. C. Haynes, D. Stager, B. Zajac, J. A. Bagnell, J. Brindza, C. Dellin, and M. George (2015). “Chimp, the CMU Highly Intelligent Mobile Platform.” Journal of Field Robotics, 32(2): 209-228. D. Torricelli, J. Gonzalez-Vargas, J. F.Veneman, K. Mombaur, N. Tsagarakis, A. J. del Ama, A. Gil-Agudo, J. C. Moreno, and J. L. Pons (2015). “Benchmarking Bipedal Locomotion: A Unified Scheme for Humanoids, Wearable Robots, and Humans.” Robotics & Automation Magazine, 22(3): 103-115. H. A. Yanco and J. L. Drury (2007). “Rescuing interfaces: a multi-year study of human-robot interaction at the AAAI Robot Rescue Competition.” Autonomous Robots, 22(4): 333-352. H. A. Yanco, A. Norton, W. Ober, D. Shane, A. Skinner, and J. Vice (2015). “Analysis of human-robot interaction at the DARPA Robotics Challenge Trials.” Journal of Field Robotics, 32(3): 420-444, May. M. Zucker, S. Joo, M. X. Grey, C. Rasmussen, E. Huang, M. Stilman, and A. Bobick (2015). “A General-purpose System for Teleoperation of the DRC-HUBO Humanoid Robot.” Journal of Field Robotics, 32(3): 336-351.