Embed Size (px)
Citation preview

ORIGINAL ARTICLE
Analysis of energy intensity trend as a tool for long-termforecasting of energy consumption
Leontiy Eder & Irina Provornaya
Received: 4 April 2016 /Accepted: 27 March 2018# The Author(s) 2018
Abstract The paper presents retrospective develop-ments of energy intensity of the world economy differ-entiated by regions and their levels of economic devel-opment. The analysis has revealed the persistent de-creasing trend in energy intensity across all the macro-regions and most countries, showing diversity of itscourse regarding both the starting point and rate ofenergy intensity reduction. Based on the time series, ithas been shown that energy intensity of an economy isbest described by an exponential trend, indicating afairly uniform decline in energy efficiency in the econ-omies. A power index of the exponential equation is oneof the critical parameters characterizing reduction rate ofenergy intensity—the index of energy intensity reduc-tion (IEIR). The authors have proposed an approach tomeasuring beta-convergence in time series of energyintensity, substantiating thereby convergence of econo-mies. A comprehensive analysis of the time series andtrend model served as a basis for prediction of variationin energy intensity of economies of the macro-regionsfor the period until 2040, which also included its quality
and rationale verification. It has been shown that thetrend method can be successfully applied to forecastingenergy intensity developments to economically devel-oped regions, whereas for developing countries such aforecast is less reliable. In these conditions, a compre-hensive use of the trend model and the convergencemodel is necessary. The forecast of changes in energyintensity of the world economies grouped into macro-regions until 2040 has shown that the economicallydeveloped countries of Europe will remain to be theenergy efficiency leaders until the mid-twenty-first cen-tury. The energy intensity indicators for less developedregions will gradually converge in their domain; yet,they are not expected to reach the level of the econom-ically developed countries by 2040.
Keywords Energy intensity . Forecasting .Macro-regions . Convergence . Industrially developedcountries . Developing countries
Introduction
The novelty of the study consists in the following.Based on a large amount of econometric data, it hasbeen shown that reduction of energy intensity takesplace not linearly in the regions but is described by anexponential function; therefore, reduction in the energyintensity occurs uniformly in time. At the same time,regions have different initial levels of energy intensityand different energy intensity reduction rates. The au-thors have proposed an approach to determining
Energy Efficiencyhttps://doi.org/10.1007/s12053-018-9656-2
L. Eder (*)Institute of petroleum Geology and Geophysics of the Siberianbranch of the Russian Academy of Sciences, Novosibirsk StateUniversity, Economics Department, 3 Koptyg Av.,Novosibirsk 630090, Russiae-mail: [email protected]
I. ProvornayaInstitute of Petroleum Geology and Geophysics of the Siberianbranch of the Russian Academy of Sciences, Novosibirsk StateUniversity, 3 Koptyg Av., Novosibirsk 630090, Russiae-mail: [email protected]

convergence of the series of energy intensity in aneconomy. The specific nature of the proposed approachis checking convergence of the series not for equal timelapses but considering the starting point of energy in-tensity reduction. The presence of convergence waschecked for 108 countries of the world grouped bymacro-regions. The authors have demonstrated that thetrend method may be successfully applied to forecastingenergy consumption in economically developed re-gions, whereas the use of additional forecasting toolsis required for assessing the energy intensity of devel-oping economies.
Analysis of the current state and forecasting the fu-ture state of the energy sector are some of the keycomponents of forming a long-term policy of sustain-able economic development (Pirlogea and Cicea 2012).The nexus of energy consumption, economic growth,and environmental protection is an important factor inthis respect (Omri 2013).
The approaches to simulation and forecasting ofthe world energy sector essentially differ. Pfenningeret al. (2014) have analyzed the existing models ofenergy consumption for different families of models.The authors identify four main groups of models: (1)optimization models, (2) imitation models, (3)models of the electric energy market, and (4) quali-tative and aggregate models. There are other types ofmodels, as well, but these four are the key groupsrelated to the modern energy policy. In the first groupof methods, imitation and forecasts are important; inthe second group, optimization and scenarios areessential. In reality, these distinctions may be blurred,and models may have features of both approaches,depending on the context of the studies conductedand the degree of particularization of different as-pects of economic analysis.
The objective of this study is to investigate the pos-sibility of forecasting the energy intensity of an econo-my based on analysis of time series (on the top-downprinciple), with differentiation by micro regions. In ac-cordance with the objective set, we stated the followingtasks which determined the structure of work as a whole:
(1) Trend analysis of the energy intensity of the econ-omy, with differentiation by macro-regions,
(2) Studying sustainability of the time series of energyintensity in the economy by regions,
(3) Checking for convergence of energy intensity indifferent regions,
(4) Forecasting energy intensity, as a basis for deter-mining the development prospects of energy con-sumption as a whole,
(5) Determining the quality of forecast evaluation.
The above approaches to forecasting development ofthe global energy consumption in general and for certaingroups of countries and macro-regions may be appliedbased on the top-down and bottom-up principle(Böhringer and Rutherford 2005). Originally, the optimi-zation models were formed using the bottom-up princi-ple, based on detailed consideration of consumption ofindividual energy carriers with a high degree of particular-ization. Aggregation of such estimates allows calculationof total energy consumption and assessment of changes inthe structure of the fuel-and-energy balance. Best knownare the models of MARKAL/TIMES (Fishbone andAbilock 1981; Loulou and Labriet 2008; Hourcade et al.2006; Messner and Schrattenholzer 2000; Strachan andKannan 2008), MESSAGE (Schrattenholzer 1981), andOSeMOSYS (Howells et al. 2011). As a rule, such fore-casts are detailed enough; they take into account the sea-sonal component and are characterized by a short forecast-ing period.
The forecasts made using the imitation modelingprinciple are also based on the bottom-up approachand include retrospective analysis of energy consump-tion. Such imitation models consist of several unitsforming a single integrated unity. The degree of calcu-lation particularization may vary in the units, up toconsideration of specific technologies, taking the useof optimization models into account. Here, the modelsNEMS (Gabriel et al. 2001), PRIMES (E3Mlab 2008;European Commission 2011), and LEAP (SEI 2012)stand out.
When forecasting energy consumption in the frame-work of the top-down approach, one can analyze direct-ly the energy consumption trends and their relation todifferent factors, primarily the economic growth rates,the population growth rates, etc. (Frei et al. 2003). At thesame time, it is possible to consider specific parameters,for example, the energy intensity of an economy, as aratio of energy consumption and the GDP growth(Chang 2014). Another widespread parameter is theenergy consumption per capita, as a ratio between ener-gy consumption and the population size (IAEA 2005). Itis to be noted that a sufficiently complete system offactors influencing the behavior of energy intensity hasbeen formed over the recent years (Ang and Liu 2003).
Energy Efficiency

There are numerous studies dedicated to analysis oftrends for both energy consumption as a whole and itsspecific characteristics. Messner and Strubegger (1987)proposed an approach to forecasting energy consump-tion trends considering the economic growth anddevelopment rates and development of technologies.Harel and Baguant (1991) investigated the ratios be-tween the electric energy consumption trends and GDPand elasticity coefficients. Ang (1992) modeled thedynamics of energy consumption using growth curvemodels. Heffington and Brasovan (1994) developedmathematical models of growth curves to forecast thelevel of oil reserves in the USA. Mackey and Probert(1994) proposed modified logistical functions for fore-casting the demand for crude oil and natural gas basedon saturation curves, to extrapolate the respective ener-gy intensity values. Multi-logistical models of energyconsumption in the household sector were developed byReddy (1995). Rao and Parikh (1996) analyzed thedemand for petroleum products in India, using atranslog econometric model based on the trends in timeseries. Using a univariate Box-Jenkins time series andthe ARIMAmodels, Gonzales et al. (1999) proposed anapproach to forecasting production and energyconsumption in Spain. Kadoshin et al. (2000) analyzedthe time series of energy consumption considering thepopulation growth and economic development.
In modern literature devoted to energy consumption,a special place is occupied by the studies aimed atsubstantiating the key parameters and factors in theforecasting model.
Modern researchers place special emphasis on an-alyzing the inter-relation between the GDP and eco-nomic activity, eventually affecting the developmentsof energy intensity in an economy (Dergiades et al.2013; Fuinhas and Marques 2012; Yuan et al. 2008;Baranzini et al. 2013). It is noted that energy con-sumption in economically developed countries ismuch more resilient to drastic changes in the eco-nomic situation than in developing countries. A re-ciprocal process of changes in energy consumption,which exerts essential influence on the economicgrowth, is possible, too (Chiou-Wei et al. 2008).
A number of studies indicate the existing sustainabletrend for reducing the energy intensity in differentgroups of countries. In these studies, most authors focuson analyzing the degree of technologies’ influence onreduction of energy intensity in practically all the eco-nomic sectors (Voigt et al. 2014). They demonstrate that
reduction of energy intensity in economically developedcountries is primarily related to improvement of tech-nologies in the industries and, to a lesser degree, tostructural changes in the economy. In developing coun-tries, structural changes in the economy are more im-portant, or both processes are equally significant.
An important aspect of the retrospective analysis ofenergy intensity of an economy is differentiation ofcountries by their level of economic development intoindustrially developed and developing countries(Miketa and Mulder 2005; Duro et al. 2010).
Convergence of energy intensity has been investigat-ed most thoroughly in literature. However, the conclu-sions of the studies conducted differ regarding conver-gence of energy intensity. Most authors indicate that thenumber of countries with sustained energy intensity islimited (Pen and Sévi 2010) and reject the hypothesisregarding convergence of energy intensity in a numberof countries of the Middle East, Organization for Eco-nomic Cooperation and Development, and Europe (Penand Sévi 2008).
Special attention is paid to substantiating the startingpoint of energy intensity reduction. It is shown inMulder and Groot (2012) that certain countries startedto reduce their energy intensity beginning with mid-1990s. Reduction of energy intensity in developingcountries and the convergence process are related bothto structural changes in the economy and to develop-ment of energy-saving technologies, including their dif-fusion from the developed countries. Therefore, a num-ber of studies are dedicated not only to energy intensityof an economy as a whole but also to energy intensityfor individual fossil fuels and alternative and renewableenergy sources for developed and developing countries(Herrerias 2012).
In most cases, it is not specified in which prices theGDP is analyzed as one of the characteristics of energyintensity of an economy. However, the use of the GDPcalculated by the purchasing-power parity, not by thecurrent exchange rate, is of primary importance fordeveloping countries, especially for such countries asChina and India (Liddle 2010).
An important element of analyzing energy inten-sity is structuring and differentiation of countriesbased on a geographical principle. Countries withclose levels of economic development and situatedwithin one region often have similar models of ener-gy consumption and similar energy intensity behav-iors (Markandya et al. 2006).
Energy Efficiency

Convergence is one of the parameters of trend anal-ysis. The issue of convergence of economies of differentlevels emerged in 1960–1970s, which is related to emer-gence of the Solow model of economic growth (Solow1956). The term of Bβ-convergence^ was introduced byX. Sala-i-Martin (1996).
Over the recent years, there have appeared manystudies dedicated to convergence in the energy sector.
As a rule, the results reported in the existingliterature either reject convergence or mention es-sential limitations in the concept of energy intensityconvergence. Mulder and De Groot (2007) reject thehypothesis of global convergence, demonstrating thepresence of convergence at the local regional levels.Miketa and Mulder (2005) investigated the β-convergence of energy intensity by differentindustries and regions of the world and came to asimilar conclusion. Markandya et al. (2006) investi-gated the energy intensity in the transitional econo-mies of Eastern Europe and established the signs ofconvergence to the values of energy intensity in thecountries of EU-15. At the same time, differences inthe rates of β-convergence are noted. Based on σ-and β-convergence, Ortiz et al. (2009) demonstratedonly partial convergence in the energy intensities ofthe economies of the EU members. Quah (1993,1996) stressed inconsistency of the σ- and β-convergence criteria for analyzing convergence oftime series. He maintained that those criteria werenot sufficient and could lead to erroneous conclu-sions in favor of convergence of energy intensity, forexample, in the case of bidirectional convergence ofthe time series trends of energy intensity.
Data description
The of energy intensity may be calculated by severalmain methods depending on how the GDP is calcu-lated: (1) by the current exchange rate, (2) by thepurchasing power parity (PPP), (3) in fixed prices,and (4) in the current year’s prices. As a result, thelevel of energy intensity of the economies will beessentially different in different countries and re-gions. It is assumed in the study that the GDP willbe considered by the purchasing power parity, whichis significant. Converting GDP using PPP, ratherthan using foreign exchange rates, does have impor-tant implications for developing country data. In
addition, energy intensity of economies was consid-ered both in current and fixed prices.
In addition, depending on the type of energy, it ispossible to calculate the consumption of primary andfinal energy. Primary energy represents the sum of allproduced energy sources. Final energy, as a rule, is theconsumed electric energy. The paper discusses the en-ergy intensity (primary energy intensity) and final ener-gy intensity (electricity intensity). Methodological ap-proaches to analyzing energy intensity and final energyintensity will be identical.
Statistical data from the Energy Information Admin-istration, the International Energy Agency, the Organi-zation of Petroleum Exporting Countries, the WorldBank, and the International Monetary Fund were usedas a database for the study.
We calculated the energy intensity of economiesby countries and regions as a ratio of energy con-sumption and the GDP. This allowed grouping ofcountries according to the objectives set. We soughtfor sustainable trends and mechanisms of changes inthe energy intensity of economies, aggregating thecountries according to two main characteristics: thegeographic location and the level of economic de-velopment. In terms of the geographic location, sev-en macro-regions were identified: North America,Central and South America, Europe, Africa, APR,the former Soviet countries, and the Middle East. Inaddition, the macro-regions were differentiated bytheir level of economic development and were di-vided into two groups: countries-members of theOrganization for Economic Cooperation and Devel-opment (industrially developed countries) and coun-tries not incorporated into this organization (devel-oping countries). All the countries of North Americawere included into the group of developed countries.The countries of Latin America, Africa, and theformer Soviet countries were included into the groupof developing countries. The European countries andthe countries of the Asian-Pacific region were divid-ed between both groups: developed and developingcountries. Considering the role and influence ofChina on the world energy sector, this country wasassigned an individual position. Such a breakdownis caused by several factors. Firstly, development ofthe world energy sector is discussed here in the lightof world markets’ functioning and of forming therespective supply and demand of the energy re-sources on them. Secondly, developed and
Energy Efficiency

developing countries are characterized by differentenergy consumption models. Thirdly, in the frame-work of the indicated regions, countries close interms of their economic development level havesimilar behaviors of their energy intensities, whichallows them to be grouped into respective groups.
Consumption of primary energy resources was ana-lyzed by the data from the British Petroleum Statistic(BP), and data from the International Energy Agencywere examined for a number of countries.
In evaluating the energy intensity, the behavior of theGDP was considered both in current and fixed prices.The GDP data in current prices were taken from theInternational Monetary Fund. To rule out the influenceof the price component on the behavior of energy inten-sity, the GDP values were recalculated into the fixedprices of 2012 using the GDP deflator. The GDP defla-tor was taken in accordance with the World Bank data.In both cases, the GDP was considered by the РРР.
All the data were examined for the time period of1980–2015: this period was optimal for consideringthe behavior of the energy intensity of the econo-mies, based on the available data on the regions.However, given that global energy crises occurredin the considered time interval having an appreciableimpact on the level and dynamics of energy con-sumption, this paper focuses on a shorter period oftime spanning from 1990 to 2015. Making forecastfrom the econometric standpoint requires analysis oflonger periods of time in order to obtain valid re-sults. To this end, further shortening of the reviewedtime period would be inappropriate.
Theory and methodology
This research consists of five major parts: (1) time seriesanalysis of the world economies and regions with dif-ferentiation by their level of development and geograph-ic features; (2) identification of stable trends in the timeseries of the economy-wide energy intensity with thefocus on the onset of decline and the period of energyintensity index (EEI) reduction; (3) trend approximationand selection from time series of the energy intensity ofthe economy; (4) construction of a convergence modelin accordance with the period marked as the onset ofdecline in energy intensity; and (5) on the basis ofselected trends and convergence model, making forecast
for the economy’s energy intensity development acrossthe world regions until 2040 (Fig. 1).
Time series analysis of country- and region-specificenergy intensity in terms of their level of economicdevelopment and geographic features
This section deals with construction and analysis of timeseries of energy intensities across countries with furtherdifferentiation in terms of their level of economic devel-opment (developed and developing) and geographicfeatures (the world’s macro-regions).
Identification of persistent trends in time seriesof energy intensity across countries and the world’sregions—the onset of decline and the period of energyintensity index reduction
This section analyzes early stages of decline in energyintensity (EI) of the economy, along with the period ofEI reduction (i.e., low or negative energy use). Theworld’s developed countries have a longer period ofreduction of this indicator. While energy intensity ofthe developing countries have recently shown a gener-ally declining trend (with the exception of the MiddleEast, where economic growth continues to be high), theyear of its onset and the period of EI reduction for thedeveloping differ across these economies, which indi-cates the need for a detailed analysis of thisphenomenon.
Approximation and selection of the best trend from timeseries of energy intensity of the economy
In the econometric analysis, it is customary to examine atime series for determinacy and stochasticity in order toreveal regularities to make a forecast. Retrospectivetrend analysis of the energy intensity of an economyhas shown that reduction of the energy intensity of aneconomy proceeds in accordance with a determinedmodel, i.e., allows application of a trend model to fore-casting the future behavior of a subject.
In making a forecast of the energy intensity of aneconomy, an important step is to reveal the optimal trenddescribing a change. Selection of the best trend is basedon the test-criteria: the determination coefficient, theFisher criterion, the mean approximation error, and theStudent’s t test.
Energy Efficiency

In accordance with the period when the energy intensitybegan to decrease, the constructionof the β-convergence model
The notion of beta-convergence has earned recognitionthrough its use in the literature for more than 25 years,meaning the time-dependent growth (decrease) rate ofthe indicator, according to its initial level. This accountsfor the fact that with time, the values of time seriesconverge.
Using classical approaches, we offer a number ofsolutions with which good results may be obtained,allowing demonstration of the presence of convergence.
Traditionally, the rate of absolute β-convergence isevaluated as (X. Sala-i-Martin 1996; Ang 1992):
lnyi;T−lnyi;0T
¼ δ þ b*lnyi;0 þ εi ð1Þ
where yi, T and yi, 0 are the values of the yield per capitaat the terminal and original moments of time; δ is aconstant; ε is a random deviation; b is the coefficient
characterizing the process of β-convergence; i is a re-gion or country; T is the duration of the examined timeseries. If b < 0, convergence is observed, if b > 0, diver-gence takes place.
Using the model of β-convergence, we can deter-mine its characteristics: the annual rate of β-convergence (β) and the time (τ) of covering half thedistance required for reducing the inter-regional (inter-country) inequality for the parameter in question.
β ¼ −ln 1þ T*bð Þ
Tð2Þ
τ ¼ ln 2ð Þβ
ð3Þ
In effect, β-convergence is understood as depen-dence of the growth rates (reduction rates) of a param-eter in time, depending on its original level. This meansthat, as time goes, convergence of the values of timeseries takes place.
y = 0.5945e-0.046xR² = 0.9852
0.00
0.10
0.20
0.30
0.40
0.50
0.60
0.70
1980 1985 1990 1995 2000 2005 2010 2015
Energy
intensity
ofGD
P,t.o
.e
Period of energy intensity reduc�on Exponen�al trend
A
0.00
0.05
0.10
0.15
0.20
0.25
0.30
1980 1985 1990 1995 2000 2005 2010 2015
En
erg
y i
nte
nsi
ty o
f G
DP
, t.
o.e
/
tho
u.U
SD
(2
01
5)
Period of energy intensity reduc�on
Exponen�al trend
B
Fig. 1 Energy intensity of GDP(from PPP) across the world in thecurrent (a) and constant prices(2015) (b)
Energy Efficiency

It is proposed in the study to consider several param-eters characterizing the rate of changes in time, which isrelated to the following factors.
As shown above, there are numerous studiesproving the absence of β-convergence of energyintensity of an economy by regions. It is proven thatthe initial level of energy intensity is poorly relatedto the dynamics of its reduction. The current studiesapply the principle of calculating convergence con-sidering an equal number years in the energy inten-sity trends.
In our opinion, convergence of energy intensitycan be described as the rate of energy intensityreduction depending on the initial value, which hasto be considered not during equal spans of time butfrom the moment of the start of respective reductionin the specific region or country. Such a principlewas implemented previously in analyzing economicparameters; however, such an approach has beenapplied to analysis of energy intensity for the firsttime.
The paper considers two variants of beta-convergence calculation—the rate of energy intensityreduction by objects in time. The first option is classic,when the energy intensity of the economy is taken at thesame time interval, and the second option is author’s,when the energy intensity of the economy for eachregion is taken from the moment the energy intensitybegins to decrease.
Classical approach
The values of energy intensity for regions and coun-tries are taken within equal time spans; in the equa-tion, the ratio of the initial (1980) and current energyintensity levels is taken to be a dependent variable,and the level of energy intensity in 1980 is taken tobe an independent variable. The parameters arelogged:
v ¼ lnyi;2015−lnyi;1980T i
ð4Þ
where v is the rate of reduction of energy intensityby objects and time.
Authored approach
The values of energy intensity of an economy foreach region are taken from the moment of the startof the energy intensity (ti0) reduction; in the equa-tion, the ratio of the initial (the year of the start ofreduction) and of the current levels of energy inten-sity is taken to be a dependent variable, and the levelof energy intensity at the moment of the start of itsreduction is taken to be an independent variable.The parameters are logged:
v ¼ lnyi;2015−lnyi;ti0T i
ð5Þ
Calculation of β-convergence was made for 10macro-regions and 108 countries. Originally, analysiswas essentially based on the regions’ specific features;and, as only 10 macro-regions were identified, individ-ual analysis was made for the countries of the world tocorroborate the established ties.
According to the selected trend and convergence model,the forecasts of energy intensity dynamicsfor the world’s economies have been projecteduntil 2040
This section is devoted to forecasting of energy intensityof regional economies across the world made on thebasis of selected trends and convergence model and theconstruction of confidence intervals, with the confi-dence level factor to monitor the forecast estimatequality.
The proposal in BIn accordance with the periodwhen the energy intensity began to decrease, theconstruction of the β-convergence model,^ author’sapproach, allows to more closely evaluate the targetperiod of the convergence model. In this context, theconvergence model can be appropriate for forecast-ing the energy demand, given that the relevant peri-od of energy intensity reduction is allocated for allthe time series under consideration. Thus, on theworld’s macro-region scale, the onset of long-termreduction of energy consumption in Central andSouth Americas and Africa was reported in 1999.A retrospective period from 1999 through 2015 wastherefore selected for the forecast of energy intensityof the economy of all the considered macro-regions.
Energy Efficiency

Given that the both starting level (yi, 0) and the time
period for energy intensity analysis (lnyi;T−lnyi;0
T ) are sub-ject to changes, the convergence model is time-depen-dent. Moreover, the rate of convergence and its deter-mining parameters: coefficients b and δ.
Therefore, it is critical to:
1) To construct annual convergence models andto determine the values and long-term trendsin changes of the variables under consideration(b and δ).
2) Estimate their long-term forecast values, with dueconsideration of the retrospective analysis of thevariables.
Concurrently, a forecast for the energy intensityof the economy is to be made on the basis of trendmodels. Their results allow to integrate trend modelsand convergence models in forecasting of energyintensity of the economy, which is particular impor-tance for the time series with periods of energyintensity reduction being not lengthy. Moreover, inthis case, the convergence model allows a more
substantiated approach to forecasting the levels ofenergy intensity in a long-term perspective.
When selecting the best trend for energy intensity ofthe economy (energy efficiency trends), it is critical toestablish an interval (regional) estimate, allowing tomore effectively determine the potential intervals forthis indicator in the long term.
A confidence interval for a general trend is deter-mined by the formula (Damodar 2004):
~yt � tαsy∼ ð6Þ
where ~yt is the calculated value yt, tα is the value of tstatistics of Student, and s~y is the mean square error ofthe trend. With the time t = T + L, a confidence intervalis determined for a trend extended for L units of time.
The relation may be rewritten as:
~yt � tαsyK*: ð7Þ
Thus, we obtain an expression for the confidenceintervals of a forecast of an exponential trend model:
The ratio between the value of the trend and theupper bound of the confidence interval may serveas a key parameter reflecting the accuracy of theforecast:
D ¼ ui;TþL
yi;TþL−1
!*100; ð9Þ
where ui;TþL is the upper bound of the level of theenergy intensity of an economy for i country orregion at the last moment of the forecast L, yi, T + L
is the trend model for i country or region at thelast moment of the forecast L.
We have thus obtained a trend data-driven consoli-dated forecast of energy intensity of a given economytaking into account the convergence model.
Empirical results
Characterization of persistent trends in time seriesof national and global energy intensities
The energy intensity of the regions has been char-acterized in considerations of a number of param-eters: the starting time of energy intensity reduc-tion for i region (ti0), the level of the energyintensity at the beginning of reduction (yi;ti0 ), the
level of the energy intensity in 2015 (yi, 2015), theenergy intensity reduction level from the startingpoint of the reduction ðΔy ¼ yi;ti0−yi;2015), the re-
duction rate of the energy intensity of an economy(v1 = Δy/T, where T is the number of years), and ti,1/10—how many years the level of intensity reachesone-tenth of the initial value at the starting point(Table 1).
Energy Efficiency
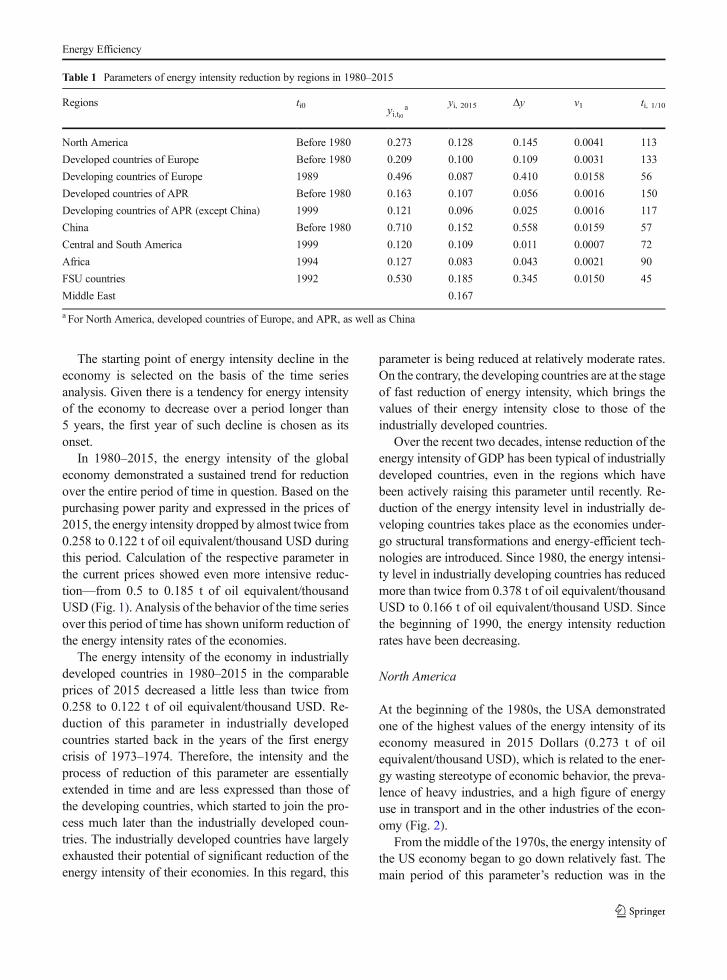
The starting point of energy intensity decline in theeconomy is selected on the basis of the time seriesanalysis. Given there is a tendency for energy intensityof the economy to decrease over a period longer than5 years, the first year of such decline is chosen as itsonset.
In 1980–2015, the energy intensity of the globaleconomy demonstrated a sustained trend for reductionover the entire period of time in question. Based on thepurchasing power parity and expressed in the prices of2015, the energy intensity dropped by almost twice from0.258 to 0.122 t of oil equivalent/thousand USD duringthis period. Calculation of the respective parameter inthe current prices showed even more intensive reduc-tion—from 0.5 to 0.185 t of oil equivalent/thousandUSD (Fig. 1). Analysis of the behavior of the time seriesover this period of time has shown uniform reduction ofthe energy intensity rates of the economies.
The energy intensity of the economy in industriallydeveloped countries in 1980–2015 in the comparableprices of 2015 decreased a little less than twice from0.258 to 0.122 t of oil equivalent/thousand USD. Re-duction of this parameter in industrially developedcountries started back in the years of the first energycrisis of 1973–1974. Therefore, the intensity and theprocess of reduction of this parameter are essentiallyextended in time and are less expressed than those ofthe developing countries, which started to join the pro-cess much later than the industrially developed coun-tries. The industrially developed countries have largelyexhausted their potential of significant reduction of theenergy intensity of their economies. In this regard, this
parameter is being reduced at relatively moderate rates.On the contrary, the developing countries are at the stageof fast reduction of energy intensity, which brings thevalues of their energy intensity close to those of theindustrially developed countries.
Over the recent two decades, intense reduction of theenergy intensity of GDP has been typical of industriallydeveloped countries, even in the regions which havebeen actively raising this parameter until recently. Re-duction of the energy intensity level in industrially de-veloping countries takes place as the economies under-go structural transformations and energy-efficient tech-nologies are introduced. Since 1980, the energy intensi-ty level in industrially developing countries has reducedmore than twice from 0.378 t of oil equivalent/thousandUSD to 0.166 t of oil equivalent/thousand USD. Sincethe beginning of 1990, the energy intensity reductionrates have been decreasing.
North America
At the beginning of the 1980s, the USA demonstratedone of the highest values of the energy intensity of itseconomy measured in 2015 Dollars (0.273 t of oilequivalent/thousand USD), which is related to the ener-gy wasting stereotype of economic behavior, the preva-lence of heavy industries, and a high figure of energyuse in transport and in the other industries of the econ-omy (Fig. 2).
From the middle of the 1970s, the energy intensity ofthe US economy began to go down relatively fast. Themain period of this parameter’s reduction was in the
Table 1 Parameters of energy intensity reduction by regions in 1980–2015
Regions ti0 yi;ti0a yi, 2015 Δy v1 ti, 1/10
North America Before 1980 0.273 0.128 0.145 0.0041 113
Developed countries of Europe Before 1980 0.209 0.100 0.109 0.0031 133
Developing countries of Europe 1989 0.496 0.087 0.410 0.0158 56
Developed countries of APR Before 1980 0.163 0.107 0.056 0.0016 150
Developing countries of APR (except China) 1999 0.121 0.096 0.025 0.0016 117
China Before 1980 0.710 0.152 0.558 0.0159 57
Central and South America 1999 0.120 0.109 0.011 0.0007 72
Africa 1994 0.127 0.083 0.043 0.0021 90
FSU countries 1992 0.530 0.185 0.345 0.0150 45
Middle East 0.167
a For North America, developed countries of Europe, and APR, as well as China
Energy Efficiency

middle of the 1980s. Under conditions of a signifi-cant fall of the oil prices, the energy intensity of theeconomy began to decrease less fast. Over the recent30 years, the energy intensity in North America hasdecreased slightly less than by 50% from 0.273 to0.128 t of oil equivalent/thousand USD. Over therecent decades, the countries of North America havebeen taking certain efforts to reduce the energyintensity of their economies. The trend for reducingthe energy intensity is sustained and does not dem-onstrate any significant deviations.
The current figures describing the energy intensity ofthe economies of North America are still much higherthan those for Europe, as well as for Central and SouthAmerica, and are approximately equal to the level of theformer Soviet countries (approximately 0.128 t oilequivalent/thousand USD). Since the beginning of2000s, the trajectory of energy intensity reduction hasbeen close to the average global figure. This is largelyexplained by a higher level of the average annual
temperatures, the structure of the economy, and a num-ber of other factors.
Europe. Industrially developed countries
Currently, the energy intensity level in the industriallydeveloped countries of Europe is the lowest among theregions of the world, including both developed anddeveloping economies (Fig. 3).
Reduction in the energy intensity in the industriallydeveloped countries of Europe started before the begin-ning of the 1980s; as a result, by this time, the developedEuropean countries have one of the lowest energy inten-sity figures, compared to the other regions of the world—0.209 t of oil equivalent/thousand USD. The Europeancountries are traditional leaders in conducting the policyof raising the energy efficiency of their economies.
In the period of 1980–2015, the energy intensity ofthe European economy decreased by 52% to 0.107 t ofoil equivalent/thousand USD. Europe demonstrates the
y = 0.5738e-0.043xR² = 0.9857
0.00
0.10
0.20
0.30
0.40
0.50
0.60
0.70
0.80
1980 1985 1990 1995 2000 2005 2010 2015
Ener
gy in
tens
ity o
f GD
P, t.
o.e A
Period of energy intensity reduc�on Exponen�al trend
y = 0.2585e-0.02xR² = 0.9815
0.00
0.05
0.10
0.15
0.20
0.25
0.30
1980 1985 1990 1995 2000 2005 2010 2015
En
erg
y i
nte
nsi
ty o
f G
DP
, t.
o.e
/
tho
u.U
SD
(2
01
5)
B
Period of energy intensity reduc�on
Exponen�al trend
Fig. 2 Energy intensity of GDP(from PPP) in the countries ofNorth America in 1980–2015, inthe current (a) and constant prices(b)
Energy Efficiency

most sustainable trend for reducing the energy intensityof its GDP, compared to the other regions of the world.This suggests that there is high elasticity between energyconsumption and GDP. Fluctuations in the economicsituation of the developed economies of Europe lead tosymmetrical changes in energy consumption, and thisrelation in time has a sustainable trend for reduction.Small fluctuations in the energy intensity are related tothe specific economic situation, the prices of energyresources, and a number of other parameters.
Under conditions of a limited resource base of thefossil fuels and of conducting environmental policiesrestricting the CO2 emissions, the industrially developedcountries of Europe became one of the first to pursue apolicy of energy-saving and of active reduction of ener-gy consumption in their economies.
Europe. Developing countries
Reduction of the energy intensity in the developingeconomies of Europe started in 1990s from the highest
level in the world (0.496 t of oil equivalent/thousandUSD). In the period of 1980–2015, the energy intensityof these economies reduced by 79%.
The Asian-Pacific region. Developed countries
At the beginning of the 1980s, the developed countriesof the APR had one of the lowest levels of the energyintensity of GDP among the industrially developed re-gions of the world (Europe and North America)—0.163 t of oil equivalent/thousand USD, caused by thefast technological development of Japan, Australia, andthe other countries of the OECD.
Over the recent 30 years, the level of the energyintensity decreased and had unstable (sinusoid) behav-ior, which is related to the impact of the economic crisesof the second half of 1990s, which struck the economiesof the developed countries of the APR, primarily ofJapan. Plunging of the economic parameters broughtabout certain growth of the energy intensity, however,
y = 0.4887e-0.045xR² = 0.9943
0.00
0.10
0.20
0.30
0.40
0.50
0.60
1980 1985 1990 1995 2000 2005 2010 2015
En
erg
y i
nte
nsi
ty o
f G
DP
, t.
o.e A
Period of energy intensity reduc�on Exponen�al trend
y = 0.2202e-0.021xR² = 0.9902
0.00
0.05
0.10
0.15
0.20
0.25
1980 1985 1990 1995 2000 2005 2010 2015
En
erg
y i
nte
nsi
ty o
f G
DP
, t.
o.e
/
tho
u.U
SD
(2
01
5)
B
Period of energy intensity reduc�on Exponen�al trend
Fig. 3 Energy intensity of GDP(from PPP) in developedcountries of Europe in in 1980–2015, in the current (a) andconstant prices (b)
Energy Efficiency

after 2000s, time series of the energy intensity returnedto the trajectory of 1980s.
The Asian-Pacific region. Developing countries(without China)
The energy intensity of the developing countries of theAPR (without China) has a slightly higher level thanthat of the developed countries of the APR. The exten-sive growth of the economies and economic industrial-ization of the developing countries of the APR contrib-uted to the increase of the energy intensity to the averageworld level. Total reduction of this parameter in theregion was recorded only in late 1990s–early 2000s.
At the time of reduction, the energy intensity level inthe developing countries of the APR (without China)was about 0.121 t of oil equivalent/thousand USD.Currently, this parameter is about 0.096 t of oilequivalent/thousand USD, while the average value ofthe reduction rate is about 0.0031 t of oil equivalent/thousand USD, which is a rather fast reduction rate. Thedeveloping economies of the APR (without China)demonstrate a steady rate of energy intensity reductionin the period of time considered.
The Asian-Pacific region. China
Over the entire period of time considered, China wasactively reducing the energy intensity of its economy. In1980–2015, the energy intensity of China steadily re-duced. Over this period, this parameter decreased by0.56 t of oil equivalent/thousand USD—from 0.710 to0.152 t of oil equivalent/thousand USD. This is the mostsignificant reduction of the energy intensity of the econ-omy among all the regions of the world. In terms ofannual rate of energy intensity reduction, only develop-ing countries of Europe (0.0158 t.o.e./thousand dollars)and the FSU countries (0.0150) can approach China(0.0159 t.o.e./thousand dollars).
The former Soviet countries
At the beginning of 1990s, the countries of the formerSoviet Union had the highest level of the energy inten-sity of their economies. The structural social and eco-nomic crisis of 1990s and the low efficiency of theeconomy in general essentially influenced the efficiencyof energy consumption, too (Korzhubaev et al. 2009,Kontorovich et al. 2012).
However, completion of a stage of certain institution-al transformations in the economies of the former Sovietcountries and the growth of prices for oil and gasallowed those countries significantly to raise theirGDP without noticeable increase in the energy con-sumption level, which positively influenced the valueof energy intensity of GDP, which has decreased bymore than 2.5 times over recent 20 years. Another factorof reducing the energy intensity of the former Sovieteconomies is decrease of the share of energy-intensiveindustries in the economies, primarily machine-build-ing, in the general production.
In addition, programs for reduction of energy inten-sity were adopted in the economies, which allowed theeffectiveness of energy consumption to be raised(Kontorovich et al. 2008, 2013, 2016).
Central and South America
In Central and South America, the energy intensity ofthe economy in the current prices was reducing over theentire period of 1980–2015, whereas in fixed prices thisparameter increased until the late 1990s. Over the recentdecade, the trajectory of the energy intensity reductionin the economies of Central and South America coin-cided with the respective trend of the industrially devel-oped countries. Currently, the energy intensity of thecountries of Central and South America is rather low(about 0.109 t of oil equivalent/thousand USD).
Africa
In Africa, just like in Latin America, reduction of theenergy intensity in current prices has continued for therecent 30 years. However, in the fixed prices, this pro-cess started only from the middle of the 1990s.
In the early 1980s, Africa had a relatively low indus-trial level of development. The energy intensity of theAfrican economy was nearly two times lower than therespective value for North America and nearly 1.5 timeslower than that of the APR. However, the growth of theindustrial sector in the structure of the GDP boosted theincrease in the energy intensity. This process continuedtill the beginning of the 1990s, followed by stabilization,and from the end of the 1990s, steady reduction of theenergy intensity began to be observed. The behavior ofthe energy intensity reduction over the considered peri-od is very close to that of Latin America and the coun-tries of OECD.
Energy Efficiency

Middle East
Among other considered regions, only the Middle Eastthus far has shown no decreasing trend in energy inten-sity of the economy. In the countries with a supernormallevel of the oil and gas production sector, where themain income of the state is formed by the export ofenergy carriers, the changes in the energy intensity ofthe economy are largely related to changes in the energyprices on the world market.
As a result, considering essential volatility of theworld oil prices, it is practically impossible to speakabout stabilization of the existing trends regarding theenergy intensity changes in the countries of the MiddleEast.
Approximation and selection of the best trendfor describing retrospective analysis of energy intensity
In this work, selection of the trend most suitable fordescribing the energy intensity of an economy wasbased on complex comparative analysis of such param-eters as R2, the coefficient of determination, A, theaverage approximation error, S, the mean-square devia-tion from the trend, t statistics, and F criterion. It wasestablished based on the statistics calculated that thebehavior of the energy intensity reduction of the econ-omy in the entire world, in individual macro-regions andin most countries, both in the current prices and in theprices of 2015, is described by an exponential function.Verification of the results and conduct test data (for thelast 25–30 years) for energy intensity and final energyintensity are presented in Appendix Tables 7 and 8.
Formalization of an exponential trend record
Considering the basic factors being part of the exponen-tial function responsible for the energy intensity reduc-tion dynamics in the economy:
y ¼ b0 þ b1*e−γt ð10Þwhere b0—asymptote, b1—index determining initialenergy intensity of the starting year, γ—energy intensityreduction index (EIRI), and t—the current year.
Introduction of the asymptote b0 to the exponentialmodel requires a special rationale for the level to whichthe energy intensity of the economy will strive. Theabscissa designates the actual level. Exponential trend
of energy consumption will tend to zero throughout thetime, never reaching it, though. To this end, it is as-sumed that еb0 = 0.
Industrially developed regions
Reduction in the energy intensity of the economies ofEurope and North America has a long history, and overthe entire period, the trend is well approximated by anexponential function. The time series of these countriesmay be taken as samples with which the time series of thedeveloping countries of the world will be further compared.
In accordance with statistical analysis, the exponen-tial trend for the developed countries of Europe bestdescribes the behavior of the energy intensity of theeconomies. The statistical parameters for North Americahave close values.
Analysis of the behavior of the energy intensity of thedeveloped countries over 35 years (1980–2015) hasshown that reduction of this characteristic in time occursnon-linearly. Uniform decrease of the reduction rates ofthe energy intensity in an economy took place, withsmall fluctuations of this parameter, related to changesin the economic situation, changes in the world energycarrier prices, and a number of other parameters.
At the early stage, when respective programs areconducted for energy-saving and gradual change in thestructure of the economy (the growth of the servicessegment), intense reduction of the energy intensity takesplace. Then the energy intensity reduction rates for theindustrially developed countries become more moder-ate. As the energy-saving technologies are introduced,essential reduction in the total potential of saving fueland energy takes place, given the existing technologies.At the final stage (2000s), the reduction rates of theenergy intensity in the economy are characterized byrelatively low values. This is related to the fact that thelarger part of the energy-saving potential has alreadybeen exhausted for the existing level of technologicaldevelopment. Each subsequent reduction of energy in-tensity is possible due to significant investments and useof the newest technologies.
The conducted econometric analysis has shown thatfor the majority of the world’s regions, the time series ofthe energy intensity of the economy can be best de-scribed by an exponential trend. In case of the developedcountries, the exponent describes well the time series ofthe energy intensity of the economy over the entire1980–2015 period.
Energy Efficiency

Additionally, a shorter period of time spanning from1990 through 2015 was considered for the world’s de-veloped economies. The analysis showed that theexisting trends in energy intensity of the economy aredescribed well also by an exponential trend.
When forecasting the energy intensity of the econo-my, the use of the linear trend will lead to a virtually zerolevel of energy consumption in the next decade.
Developing regions
Analysis of the econometric characteristics of the develop-ing countries shows that, apart from the exponential func-tion, time series are well described also by linear trends.This is related to the fact that the developing regions(Africa, Central and South America, and Asian-Pacificregion without China) have a rather short-term tendencyof energy intensity reduction. In fact, these regions are atthe initial stage of energy intensity reduction; therefore, inaddition to the exponential function, this process is alsowell described by a linear dependence. However, in thecourse of time, the reduction rates of energy intensityreduction will begin to decrease, and in this case, the linearfunction will give way to the exponential function.
Besides the exponential function, the energy intensityof China is also well described by a logarithmic rela-tionship. This is related to a more intense period ofenergy intensity reduction at the first stage, comparedto the subsequent dynamics of this parameter’sreduction.
Developing countries have a shorter period of time ofenergy intensity reduction versus the developed coun-tries. Given a shorter period of time, the linear trend alsoshows good econometric indicators. However, over alonger period of time, the uneven behavior of energyintensity reduction is manifested more expressly.
The trends in energy intensity of the economy and theIEIR values differ for developed and developing econ-omies due to their specific features related to several keycharacteristics:
& Developed countries, primarily those of Europe,have relatively low starting levels of the energyintensity reduction and, accordingly, moderatelylow rates of energy intensity reduction (IEIR forthe developed countries of Europe is 0.021 that forthe countries of North America is 0.020) (Table 2).These countries launched the policy of reducing theenergy intensity of their economies earlier than the
developing countries; therefore, the process of re-ducing the energy intensity was rather uniform andlong-lasting. In addition, this reduction was accom-panied by respective gradual development of theenergy-saving technologies.
& During the 30 years considered, the reduction rate ofthe energy intensity of GDP of developing countrieswas much higher than that of the developed countries(the former Soviet countries—0.058, developing coun-tries of the APR without China—0.016, China—0.044, Africa—0.022). This is related to the fact that,given the existing technologies, developing countriesaccomplish the distance as far as the low level ofenergy intensity within a shorter time. In literature,such a phenomenon was called the Bthe catching-updevelopment.^
As it will be shown below, the reduction rate of theenergy intensity in the countries and regions is largelyrelated to the starting level of the energy intensity. Thisphenomenon is called Bconvergence.^
Similar data were obtained in final energy intensity inboth current and constant prices. At current prices, thesituation is most determined due to the effect of inflation(Appendix Table 8). In this regard, statistical verificationwas carried out in constant prices. However, even inconstant prices, the trends are best described by theexponential trend since the start of the sustained declineof final energy intensity.
Similar results were obtained in the analysis of ener-gy consumption in the transport sector (Eder andNemov 2017; Eder et al. 2017).
Table 2 IEIR of the large macro-regions of the world
Region IEIR
North America − 0.020Developed countries of Europe − 0.021Developed countries of APR − 0.006Developing countries of Europe − 0.063Developing countries of APR without China − 0.016Central and South America − 0.013Africa − 0.022FSU countries − 0.058China − 0.044Middle East
Energy Efficiency

Construction of a convergence model in accordancewith the starting period of decline in the energy intensityof the economy
As shown earlier, there exist numerous studies showingthe absence of β-convergence of the energy intensity ofeconomies by the regions. It was shown that the startinglevel of the energy intensity of an economy is weaklyrelated to the rate of its further reduction. In calculatingconvergence, the preceding literature has used the prin-ciple of considering the energy intensity trends withinequal periods of time (years).
At the same time, in the authors’ opinion, conver-gence of energy intensity which is the reduction rate ofthe energy intensity depending on the initial value of acountry or a region should be considered not duringequal periods of time but from the moment of the startof respective reduction in the specific region or country.In this case, there is a close tie between the starting valueand the rate of the current reduction of the energyintensity.
This paper discusses two approaches (classical andauthored) for calculating beta-convergence values:
1. Classical variant. Energy intensities of the regionsare taken on the same time interval (ti1980 − ti2015),while the ratio of the energy intensity of the econo-my as of 1980 to the current level of energy inten-sity takes the logarithm, i.e., it is reduced to a lineartrend;
2. Authors’ variant. The values of the energy intensityof the economy for each region are taken from themoment when energy intensity begins to decrease(ti0 − ti2015), while the ratio of the initial to the
current energy intensity levels take the logarithm,i.e., they are reduced to a linear trend.
β-Convergence with differentiation by the regions
Analysis of the calculations made has shown that thereis β-convergence by the regions. However, traditionalapproaches to β-convergence demonstrate not verygood results—classical variant (Table 3). For the bestvariant (authored), the annual convergence rate wasdetermined, which constituted 3.9%, as well as the timerequired for halving inter-regional inequality of the en-ergy intensities of the economies, which amounted to13.9 years.
β-Convergence with differentiation by the countries
Analysis of the presence of β-convergence uses thecountries which have entered the stage of reducing theirenergy intensity, i.e., they are moving towards reduc-tion, and not the countries which demonstrate a trend forthe growth of this parameter. This is related to the factthat a hypothesis is tested that the rate of reducing theenergy intensity is related to the initial level of thisparameter and the principle of the catching-up develop-ment in the economy. To check the existence of β-convergence, 96 countries were analyzed, in which thereduction of the energy intensity was observed for morethan 5 years.
In accordance with the evaluations of the conver-gence of the energy intensity of the countries’ econo-mies by two variants, it was demonstrated that theauthors’ approach to evaluation of convergence of the
Table 3 Assessment of the unconditional convergence model for the economies of ten (10) regions of the world (significance level 0.05)
Variable Coefficient Standard error t statistics P value
Classical approach
Constant b − 0.0577 0.003042 −18.9692631 4E−09Logarithm for energy intensity of economy in 1980
lnyi:;2015−lnyi;1980T
− 0.0247 0.003621 −6.820378638 5E−05
Coefficient of determination: 0.6231
Authored approach
Constant b − 0.048 0.012 − 3.992 0.003
Logarithm for energy intensity of economy in the starting yearof energy intensity reduction
lnyi;2015−lnyi:ti0T i
− 0.028 0.008 − 3.478 0.006
Coefficient of determination: 0.9105
Energy Efficiency

energy intensity shows the best results (Table 4). Theannual convergence rate determined according to theauthored variant accounted for 3%, and the time re-quired for halving the inter-country inequality of theenergy intensities of their economies amounted to22 years.
Thus, establishing the presence of β-convergenceamong countries and regions is a rather important aspectof forecasting the behavior of energy intensity for along-term perspective, as it allows analysis of the degreeof energy intensity reduction depending on the startinglevel of the respective process. However, this regularityis manifested for a number of countries which haveentered the phase of active reduction of the energyintensity. If a country continues increasing this charac-teristic, it is sufficient to determine the time of the startof its reduction, in order to understand how fast thecountry or the region will implement the strategy ofthe catching-up development.
Forecasting the energy intensity
Based on the analyzed time series, a forecast was madefor changes in the energy intensity of an economy for along-term perspective till 2040.
All the regions (except for the Middle East) consid-ered have entered a steady phase of energy intensityreduction of their economies. However, only the devel-oped countries (Europe, North America, and the Asian-Pacific region), as well as China, are characterized byreduction of energy intensity throughout the entire peri-od of time considered—1980–2015. At the same time,developing countries have a relatively short period of
time (11–21 years) for building satisfactory forecastingmodels. Industrially developed countries (Europe andNorth America) have a sufficiently high value of thecoefficient of determination and a low mean-squaredeviation value. In addition, the time series of energyintensity is well described for the developing countriesof the APR, China, Africa, the countries of the formerUSSR, and South America.
Divergence of the confidence limits from the trendvalue is a significant parameter characterizing the qual-ity of thee forecast estimates made. For the developedcountries of Europe and North America, the width of theconfidence interval is within 5–1%, which is a very lowfigure, characterizing the quality of the model selectedand the adequate forecasting value of the trend (Fig. 4).Parameter D for the developing countries of the APR,Africa, and South America is below 30%, indicatingcertain divergence of the confidence interval from thetrend values. The distance from the trend to the confi-dence limits for the countries of the former USSR andthe developing countries of Europe exceeds 100%.
Calculation of the respective statistics for the consid-ered macro-regions has shown that a relatively satisfac-tory forecast of energy intensity on the basis of a trendmay be made only for the developed regions of theworld. Developing a reliable forecast of energy intensityfor the developing regions of the world on the basis ofretrospective analysis of the behavior of this parameterdoes not provide satisfactory evaluations.
Whenmaking forecasts for the energy intensity of theeconomy with the use of convergence model, we ana-lyzed δ—constant and b—coefficient from 1999 (theyear in which energy intensities were decreasing acrossall regions) to 2015. It was found that within a relatively
Table 4 Assessment of the unconditional convergence model for the economies of 96 countries of the world (significance level 0.05)
Variable Coefficient Standard error t statistics P value
Classical approach
Constant b − 0.029 0.003 − 9.652 0.000
Logarithm for energy intensity of economy in 1980lnyi;2015−lnyi;1980
T
− 0.010 0.001 − 6.571 0.000
Coefficient of determination: 0.3194
Authored approach
Constant b − 0.0635 0.0034 − 18.8226 0.0000
Logarithm for energy intensity of economy in the startingyear of energy intensity reduction
lnyi;2015−lnyi;ti0T i
− 0.019 0.002 − 9.908 0.000
Coefficient of determination: 0.6507
Energy Efficiency

stable period from 1999 to 2007, there was a fairly highconvergence of energy intensities of the economies ofthe world’s regions and the relationship between theinitial level and the rate of subsequent reductions.
At a time of unstable situation of the global energymarket, such a bond tends to be lost, though. With thestabilization of world prices for energy raw materials,convergence parameters rebound to the pre-crisisvalues. Generally, we note an increase in the rate of
convergence of the regions in energy intensity of theeconomies (δ and b). As a result, it was accepted in thiswork that this trend will continue until 2040, intermit-tent with some fluctuation periods, and the values of δare projected to be 0.13 and b to be 0.05 (Table 5).
The value of the forecast energy intensity of theeconomy can be affected by fluctuations. However, asshown by statistics over the past 30 years, developedregions show stable dynamics of reduction of energy
Table 5 Parameters of unconditional convergence for energy intensities of the economies of ten (10) regions of the world from 1999through 2040
1999 2001 2005 2007 2008 2009 2013 2014 2040
b − 0.032 − 0.033 − 0.034 − 0.028 − 0.016 − 0.024 − 0.041 − 0.035 − 0.050δ − 0.08 − 0.08 − 0.09 − 0.08 − 0.05 − 0.07 − 0.10 − 0.09 − 0.13Determination coefficient 0.69 0.60 0.59 0.58 0.13 0.20 0.24 0.61
0.00
0.05
0.10
0.15
0.20
0.25
1980
1985
1990
1995
2000
2005
2010
2015
2020
2025
2030
2035
2040
t.o
.e/
tho
u.U
SD
Developed countries of Europe
Factual dataConfidence boundsProjected values
0.00
0.05
0.10
0.15
0.20
0.25
0.30
1980
1985
1990
1995
2000
2005
2010
2015
2020
2025
2030
2035
2040
t.o.e
/ th
ou.U
SD
.
North America
Factual dataConfidence boundsProjected values
0.00
0.05
0.10
0.15
0.20
1980
1985
1990
1995
2000
2005
2010
2015
2020
2025
2030
2035
2040
t.o.e/tho
u.US
D.
Developed countries of APR
Factual dataConfidence boundsProjected values
0.000.100.200.300.400.500.600.700.80
1980
1986
1992
1998
2004
2010
2016
2022
2028
2034
2040
t.o.e/tho
u.US
D.
China
Factual dataConfidence boundsProjected values
Fig. 4 Calculation of confidence intervals and projected estimates for energy intensity until 2040
Energy Efficiency

intensity of the economy with relatively minor fluctua-tions (Europe, North America). Therefore, in the longterm, the value of the intensity may slightly vary fromthe established trend. In developing regions, which havenot a long period of reduction of intensity, fluctuationsbecome stronger. Possible fluctuations are taken intoaccount in the confidence intervals.
The value of the forecast of energy intensity caninfluence the possible fluctuations of the energy inten-sity of the economy. However, as shown by statisticsover the last 30 years, the developed countries showstable dynamics of reduction of energy intensity of theeconomy with relatively minor fluctuations. Therefore,in the long term, the energy intensity of the economycan vary slightly within the established trend. Develop-ing regions, which have a relatively long period ofreduction of energy intensity at the moment, they aremore prone to fluctuations. Actually, possible fluctua-tions are taken into account when constructing forecastsusing confidence intervals.
Thus, the values obtained on the basis of trend andconvergence models are found to be identical in thisresearch.
The forecasts made have shown that the developedcountries of Europe will remain leaders for the level ofthe energy intensity of their economies at least till themiddle of the twenty-first century (Fig. 5). The otherregions will gradually converge, but they will not beable to reach the level of the developed countries. To alarge degree, reduction of the energy intensity will bedetermined by the level of technological development,primarily, by the level of energy-saving technologies
and the shifts in the structure of the economy. Accordingto the authors’ estimates, in 2040, the energy intensity(yi, T + L) of the developed countries of Europe willdecrease to 0.057 t of oil equivalent /thousand USD,that of the APR will reduce to 0.095 t of oil equivalent/thousand USD, and that of North America will drop to0.072 t of oil equivalent /thousand USD. China is alsoexpected to reduce its energy intensity of (at about0.059 t.o.e/thousand USD) in 2040. Besides, the coun-tries of Africa (0.068 t of oil equivalent/thousand USD)and of Central and South America (0.075 t of oilequivalent/thousand USD) will retain the relativelylow levels of the energy intensity. Despite the acceler-ated reduction of the energy intensity in developingcountries, these regions will be characterized by rela-tively low values of effectiveness of energy consump-tion in 2040, too. The value of the energy intensity in thedeveloping countries of Europe may reduce to 0.069 t ofoil equivalent/thousand USD, that in the countries of theformer Soviet Union may drop to 0.094 t of oil equiv-alent /thousand USD, that in the developing countries ofthe APR (without China) may amount to 0.109 t of oilequivalent/thousand USD (Table 6).
Changes in the energy intensity of the economies ofthe regions considered for a long-term perspective maybe analyzed by comparing such parameters as (1) theratio between the energy intensity of the economy at the
current moment and that at the start of its reduction (yi;Tyi;ti0
)
and (2) the ratio between the energy intensity of theeconomy in 2040 and that at the current moment
(yi;TþL
yi;T). As a result, within the nearest 25 years, reduction
0.0
0.1
0.2
0.3
0.4
0.5
0.6
0.7
1980
1982
1984
1986
1988
1990
1992
1994
1996
1998
2000
2002
2004
2006
2008
2010
2012
2014
2016
2018
2020
2022
2024
2026
2028
2030
2032
2034
2036
2038
2040
2042
t.o
.e/
tho
u.U
SD
.
Год
North America
Developed countries of Europe
Developing countries of Europe
Developed countries of APR
Central and South America
Africa
China
FSU countries
developing countries of APR (except China)
Fig. 5 A trend-based aggregateforecast of energy intensity withconvergence model taken intoaccount until 2040 (1980–2015—factual data)
Energy Efficiency

of the energy intensity in the developed countries will benot as fast as over the preceding 30 years. On thecontrary, the developing countries may essentially re-duce the energy intensity of their economies: the coun-tries of the former Soviet Union may reduce the value ofthis parameter from 0.53 to 0.33 t of oil equivalent/thousand USD, those of the APR may reduce it from0.77 to 0.58 t of oil equivalent/thousand USD, thecountries of Africa may reduce it from 0.66 to 0.57 tof oil equivalent/thousand USD, and the countries ofCentral and South America may reduce the energyintensity of their economies from 0.91 to 0.61 t of oilequivalent/thousand USD. This is related to the fact thatduration of the period of reduction of the energy inten-sity for developed economies is 10–20 years, and there-fore, the main phase of reduction of this parameter maybe observed in the nearest 25 years For regions whoselower boundary hits values lower than zero with time,this boundary is assumed to be zero lower boundary.
In the Persian Gulf countries, consumption of energyresources displays poor elasticity for the behavior ofeconomic parameters and is characterized by relativelylow effectiveness. In the perspective, the energy inten-sity of the economy will be largely determined by thebehavior of the GDP and hence by the oil and gas prices.
Conclusion
The retrospective analysis of the behavior of the energyintensity by the regions allows a number (except for the
Middle East) of conclusions to be made: all the largestmacro-regions of the world have started the process ofreducing the energy intensity of their economies; thestarting point and the degree of intensity of these pro-cesses essentially differ. In 1980–2015, practically allthe regions, except for the economies of the MiddleEast, cut down the energy intensity of their economiesin current prices. However, in fixed prices, this trajecto-ry is primarily typical, in fixed prices, of the developedeconomies of North America, Europe, and the APR. Infixed prices, the energy intensity of the economies ofCentral and South America, Africa, and the formerSoviet Union entered the trajectory of steady reductionof this parameter in 1990–2000.
Based on the comparative analysis of the existingeconometric characteristics, it has been shown that theexponential trend is the best trend describing the energyintensity of an economy in permanent and variableprices both for developed and developing regions ofthe world. The figures shown serve as qualitative de-scription of time series by an exponential trend, espe-cially of the developed regions. At the same time, thetime series of the developing regions of the world dem-onstrate volatility in relation to this trend.
The presence of the exponential trend in the energyintensity reduction indicates that the rates of enhancing theefficiency of energy consumption reduce uniformly intime. The retrospective analysis of exponential reductionof the energy intensity of the developed countries andregions may be arbitrarily divided into several stages. Atthe first stage, when respective programs of energy-saving
Table 6 Basic quality parameters of the long-term energy intensity forecasts
Regions yi;2015yi;ti0
yi;2015þL
yi;2015
2040
u*i;2015þL
yi, 2015 + Lu*
i;2015þL
D
Developed countries of Europe 0.478 0.574 0.067 0.057 0.048 16.971
Developing countries of Europe 0.199 0.417 0.122 0.069 0.016 76.812
FSU countries 0.532 0.335 0.210 0.094 0 123.032
Developing countries of APR without China 0.778 0.578 0.126 0.109 0.092 20.783
China 0.214 0.344 0.129 0.059 0 118.644
Developed countries of APR 0.707 0.826 0.115 0.095 0.076 20.588
Central and South America 0.908 0.607 0.095 0.075 0.054 27.608
Africa 0.657 0.567 0.084 0.068 0.052 23.966
North America 0.469 0.560 0.089 0.072 0.055 23.416
Source: the author’s calculations
Energy Efficiency

are conducted and gradual changes in the structure of theeconomy take place (the growth of the services sector), themost drastic reduction of the energy intensity occurs. Then,as the energy-saving technologies are introduced, the totalpotential of saving fuel and energy diminishes, given theexisting technologies. Over the recent 35 years, the devel-oped countries of Europe and North America may beviewed as exemplary regions with which the developingregions will be further compared. The developing regionsare primarily at the first stage of energy intensity reduction;therefore, apart from the exponential trend, these regionsare well described by a linear trend.
The exponent of a power in an exponential equa-tion is one of the most important parameters charac-terizing the reduction rate of energy intensity of theeconomy in the countries and regions. In this work,this parameter is named the index of energy intensityreduction—IEIR. This index indicates the reductionrate of energy intensity of the economy in the coun-tries and regions.
The issue of convergence of the energy intensityof the economy of the countries and regions iswidely discussed in the modern literature. Over therecent 35 years, the spread of values of the energyintensity of the economy has reduced by more than1.5 times, with the exception of the Middle East.Countries and regions are drifting together for thelevel of their energy intensity. In the existing ap-proaches, one of the principles of calculating the β-convergence is analysis of the time series at equalintervals of time. At the same time, it is proposed inthis work to consider β-convergence for countriesand regions not at equal intervals of time but fromthe moment of the start of reduction for each spe-cific region. In this work, a close relationship isdemonstrated for countries and macro-regions be-tween the rate of energy intensity reduction and theinitial value of the energy intensity considered.
Whenmaking forecasts for the energy intensity of theeconomy with the use of convergence model, we ana-lyzed δ—constant and b—coefficient from 1999 (theyear in which energy intensities were decreasing acrossall regions) to 2015. It was found that within a relativelystable period from 1999 to 2007, there was a fairly highconvergence of energy intensities of the economies ofthe world’s regions and the relationship between theinitial level and the rate of subsequent reductions.
At a time of unstable situation of the global energymarket, such a bond tends to be lost, though. With the
stabilization of world prices for energy raw materials,convergence parameters rebound to the pre-crisisvalues. Generally, we note an increase in the rate ofconvergence of the regions in energy intensity of theeconomies (δ and b). As a result, it was accepted in thiswork that this trend will continue until 2040 intermittentwith some fluctuation periods.
Based on the time series analysis, forecast of thechange in the energy intensity of the economywasmadefor a long-term perspective till 2040. The resultingforecasts have shown that the level of energy intensityof developing economies will gradually converge tocatch up with the level of energy intensity of the devel-oped economies.
To a large degree, reduction of the energy inten-sity will be determined by the level of technologicaldevelopment, primarily, by the level of energy-saving technologies and the shifts in the structureof the economy.
The study of the quality of the forecasting esti-mates is an important aspect in this respect. Thequality of the forecast made will be determined bythe duration of the retrospective analysis and thenumber of the points observed, the coefficient ofdetermination, the mean square deviation of theactual values from the trend, and the ratio betweenthe trend value and the upper confidence limit(2040). Calculation of the respective statistics forthe considered macro-regions has shown that a rel-atively satisfactory forecast of energy intensity onthe basis of a trend may be made only for thedeveloped regions of the world. Making a forecastof energy intensity for the developing countries ismuch less reliable, and here, too, essential varia-tions may be observed. To forecast development ofthe world energy sector for developing countries, itis necessary to analyze a large number of factors.
Thus, the values obtained on the basis of trend andconvergence models are found to be identical in thisresearch.
Funding information The authors are grateful for financial sup-port to the Russian Foundation for Basic Research № 17-0600537, The Grant Of The President № 6476.2018.6.
Compliance with ethical standards
Conflict of interest The authors declare that they have no con-flict of interest.
Energy Efficiency

Tab
le7
Statisticalparametersof
differenttypes
ofthemodel;the
dependentv
ariableisenergy
intensity,2015
Trend
model
Coefficientsand
evaluatio
nsCoefficients
tcriterion,confidencelevel
0.05
Fcriterion,confidencelevel
0.05
R2
Mean-square
deviation
Approximation
error
DW
Actualv
alue
Tablevalue
Actualv
alue
Tablevalue
Actualv
alue
Тablevalue
Developed
countriesof
Europe,35
observations
Logarith
mic
Y-crossing
0.19
44.89
2.021
205
4.08
0.869
0.0830
4.48
0.19
1.38;1
.51
X−0.05
14.32
Exponential
Y-crossing
−0.76
348.99
3890
0.992
0.0019
1.12
1.54
X−0.01
62.39
Linear
Y-crossing
0.00
21.5
2247
0.986
0.0025
1.54
0.60
X0.17
193.9
Pow
erY-crossing
−0.69
44.2
480.833
0.0095
5.20
0.17
X−0.17
12.5
Developingcountriesof
Europe,35
observations
Logarith
mic
Y-crossing
0.34
16.49
2.021
474.08
0.600
0.0364
12.37
1.01
1.38;1
.51
X−0.05
6.82
Exponential
Y-crossing
−0.56
23.86
520.627
0.0398
11.80
1.56
X−0.01
7.21
Linear
Y-crossing
0.28
19.36
330.519
0.0400
12.40
1.07
X0.00
5.78
Pow
erY-crossing
−0.46
12.16
480.606
0.0409
12.60
0.64
X−0.22
6.90
North
America,35
observations
Logarith
mic
Y-crossing
0.30
55.78
2.021
404
4,08
0.929
0.1449
4.21
0.26
1.38;1
.51
X−0.09
20.09
Exponential
Y-crossing
−0.58
117.31
948
0.968
0.0075
2.15
1.61
X−0.01
30.79
Linear
Y-crossing
0.26
84.35
516
0.943
0.0085
2.68
0.29
X0.00
22.71
Pow
erY-crossing
−0.38
16.95
650.670
0.0127
5.06
0.81
X−0.29
15.00
Countries
oftheform
erUSS
R,23observations
Logarith
mic
Y-crossing
0.65
18.21
2.093
444.38
0.700
0.3304
.11.7
0.25
1.22;1
.42
X−0.24
6.66
Exponential
Y-crossing
−0.45
15.19
266
0.933
0.0324
5.18
1.47
App
endix1
Energy Efficiency
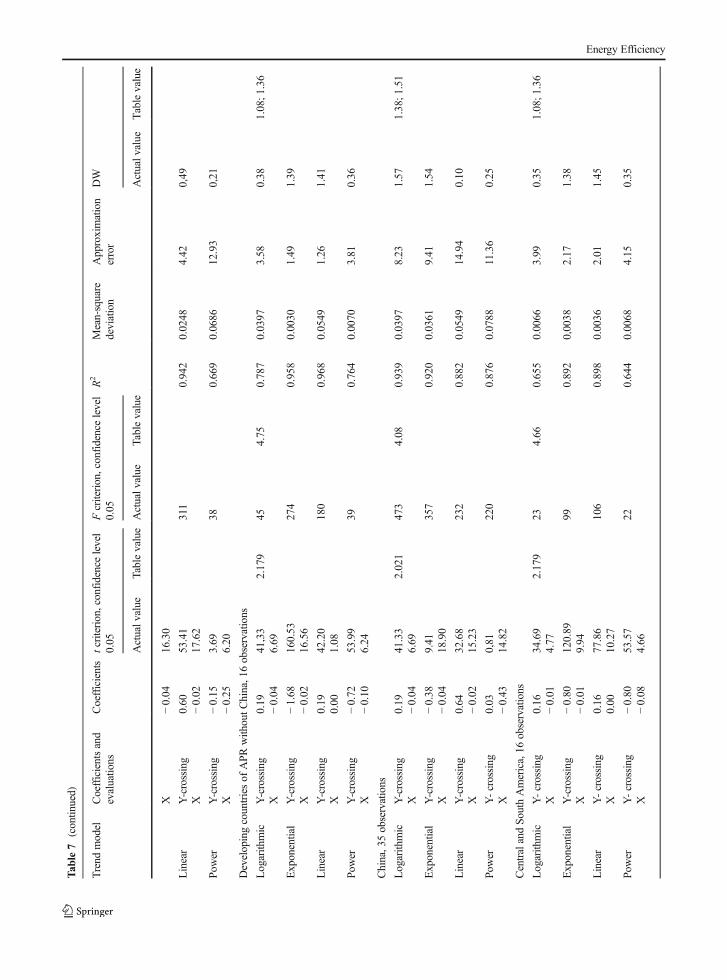
Tab
le7
(contin
ued)
Trend
model
Coefficientsand
evaluatio
nsCoefficients
tcriterion,confidencelevel
0.05
Fcriterion,confidencelevel
0.05
R2
Mean-square
deviation
Approximation
error
DW
Actualv
alue
Tablevalue
Actualv
alue
Tablevalue
Actualv
alue
Тablevalue
X−0.04
16.30
Linear
Y-crossing
0.60
53.41
311
0.942
0.0248
4.42
0,49
X−0.02
17.62
Pow
erY-crossing
−0.15
3.69
380.669
0.0686
12.93
0,21
X−0.25
6.20
Developingcountriesof
APR
with
outC
hina,16observations
Logarith
mic
Y-crossing
0.19
41,33
2.179
454.75
0.787
0.0397
3.58
0.38
1.08;1
.36
X−0.04
6.69
Exponential
Y-crossing
−1.68
160.53
274
0.958
0.0030
1.49
1.39
X−0.02
16.56
Linear
Y-crossing
0.19
42.20
180
0.968
0.0549
1.26
1.41
X0.00
1.08
Pow
erY-crossing
−0.72
53.99
390.764
0.0070
3.81
0.36
X−0.10
6.24
China,35observations
Logarith
mic
Y-crossing
0.19
41.33
2.021
473
4.08
0.939
0.0397
8.23
1.57
1.38;1
.51
X−0.04
6.69
Exponential
Y-crossing
−0.38
9.41
357
0.920
0.0361
9.41
1.54
X−0.04
18.90
Linear
Y-crossing
0.64
32.68
232
0.882
0.0549
14.94
0.10
X−0.02
15.23
Power
Y-crossing
0.03
0,81
220
0.876
0.0788
11.36
0.25
X−0.43
14.82
CentralandSo
uthAmerica,16
observations
Logarith
mic
Y-crossing
0.16
34.69
2.179
234.66
0.655
0.0066
3.99
0.35
1.08;1
.36
X−0.01
4.77
Exponential
Y-crossing
−0.80
120.89
990.892
0,0038
2.17
1.38
X−0.01
9.94
Linear
Y-crossing
0.16
77.86
106
0.898
0.0036
2.01
1.45
X0.00
10.27
Power
Y-crossing
−0.80
53.57
220.644
0.0068
4.15
0.35
X−0.08
4.66
Energy Efficiency

Tab
le7
(contin
ued)
Trend
model
Coefficientsand
evaluatio
nsCoefficients
tcriterion,confidencelevel
0.05
Fcriterion,confidencelevel
0.05
R2
Mean-square
deviation
Approximation
error
DW
Actualv
alue
Tablevalue
Actualv
alue
Tablevalue
Actualv
alue
Тablevalue
Africa,21
observations
Logarith
mic
Y-crossing
0.19
33.32
2.11
564.45
0.767
0.0591
4.84
0.36
1.18;1
.40
X−0.04
7.49
Exponential
Y-crossing
−1.70
122.11
299
0.946
0.0042
2.37
1.41
X−0.02
17.30
Linear
Y-crossing
0.18
107.29
438
0.963
0.0035
1.91
1.51
X0.00
20.93
Power
Y-crossing
−0.71
38.93
460.7302
0.0097
5.28
0.32
X−0.13
6.78
Developed
countriesof
APR
,35observations
Logarith
mic
Y-crossing
0.16
47.75
2.021
494.08
0.613
0.0302
3.77
1.51
1.38;1
.51
X−0.02
7.01
Exponential
Y-crossing
−0.83
105.37
230.421
0.0074
4.1
0.14
X0.00
4.75
Linear
Y-crossing
0.15
56.47
220.414
0.1101
4.05
0.15
X0.00
4.68
Pow
erY-crossing
−0.80
77.21
460.597
0.0058
3.74
1.56
X−0.06
6.77
Source:calculated
bytheauthors
Energy Efficiency

App
endix2
Tab
le8
Statisticalparametersof
differenttypes
ofthemodel;the
dependentv
ariableisfinalenergyintensity
2015
Trend
model
Coefficientsandevaluatio
nsCoefficients
tcriterion,confidencelevel0
.05
Fcriterion,confidencelevel0
.05
R2
Approximationerror
DW
Actualv
alue
Tablevalue
Actualv
alue
Tablevalue
Actualv
alue
Tablevalue
Developed
countriesof
Europe,32
observations
Logarith
mic
Y-crossing
−0.07
44.77
2042
128
4.17
0.81
4.49
0.22
1.37;1
.50
X0.33
11.33
Exponential
Y-crossing
−0.51
154.86
979
0.98
1.14
1.29
−0.01
31.28
Linear
Y-crossing
0.00
31.18
1422
0.98
1.27
1.41
X0.30
193.11
Power
Y-crossing
−1.18
632.3
985
0.97
1.61
0.72
X−0.01
126.4
Developingcountriesof
Europe.32
observations
Logarith
mic
Y-crossing
1.05
16.87
2042
111
4.17
0.787
15.64
0.60
1.37;1
.50
X−0.24
10.52
Exponential
Y-crossing
−0.06
2.12
225
0.881
28.10
1.40
X−0.02
14.87
Linear
Y-crossing
0.80
20.90
121
0.805
25.36
0.80
X−0.02
11.12
Power
Y-crossing
0.17
1.62
220.424
21.04
0.79
X−0.53
6.09
North
America.32
observations
Logarith
mic
Y-crossing
0.37
35.34
2042
554.17
0.65
5.01
1.16
1.37;1
.50
X−0.03
7.42
Exponential
Y-crossing
−1.06
315.19
304
0.91
2.21
1.39
X−0.01
61.44
Linear
Y-crossing
0.34
114.48
384
0.93
1.95
0.76
X0.00
19.64
Power
Y-crossing
−0.43
26.53
510.63
4.28
1.16
X−0.10
7.15
Countries
oftheform
erUSS
R.20observations
Logarith
mic
Y-crossing
0.77
26.12
2101
157
4.41
0.898
7.69
0.55
1.20;1
.41
X−0.16
12.62
Exponential
Y-crossing
−0.15
10.49
376
0.954
6.71
1.38
X−0.02
19.29
Energy Efficiency

Tab
le8
(contin
ued)
Trend
model
Coefficientsandevaluatio
nsCoefficients
tcriterion,confidencelevel0
.05
Fcriterion,confidencelevel0
.05
R2
Approximationerror
DW
Actualv
alue
Tablevalue
Actualv
alue
Tablevalue
Actualv
alue
Tablevalue
Linear
Y-crossing
0.66
36.99
233
0.929
8.81
1.03
X−0.02
15.37
Pow
erY-crossing
−0.06
1.04
330.665
12.52
0.50
X−0.37
6.91
CentralandSo
uthAmerica.12
observations
Logarith
mic
Y-crossing
0.19
151.26
2228
234.96
0.860
1.97
1.87
1.08;1
.36
X0.00
7.86
Exponential
Y-crossing
−0.72
199.87
250.716
0.64
1.09
X0.00
5.02
Linear
Y-crossing
0.19
122.92
106
0.715
1.1
1.06
X0.00
5.00
Pow
erY-crossing
−0.80
53.57
220.644
0.00
0.35
X−0.08
4.66
Africa.19
observations
Logarith
mic
Y-crossing
0.17
104.30
2201
564.84
0.9115
1.16
1.09
1.08;1
.36
X−0.01
10.65
Exponential
Y-crossing
−0.77
140.69
470.811
0.88
0.53
X0.00
6.88
Linear
Y-crossing
0.17
83.40
460.8079
1.69
0.51
X0.00
6.80
Pow
erY-crossing
−0.76
162.27
105
0.906
0.64
0.98
X−0.06
10.27
Energy Efficiency

Open Access This article is distributed under the terms of theCreative Commons Attribution 4.0 International License (http://creativecommons.org/licenses/by/4.0/), which permits unrestrict-ed use, distribution, and reproduction in any medium, providedyou give appropriate credit to the original author(s) and the source,provide a link to the Creative Commons license, and indicate ifchanges were made.
References
Ang, B. (1992). The use of growth curves in energy studies.Energy, 17(1), 25–36.
Ang, B. W., & Liu, F. L. (2003). Eight methods for decomposingthe aggregate energy-intensity of industry. Applied Energy,76, 15–23.
Baranzini, A., Weber, S., Bareit, M., & Mathys, N. A. (2013). Thecausal relationship between energy use and economic growthin Switzerland. Energy Economics, 36, 464–470.
Böhringer, C. & Rutherford, T. (2005). Combining top-down andbottom-up in energy policy analysis: a decomposition ap-proach. Centre for European Economic Research. DiscussionPaper No. 06–007.
Chang, M. (2014). Energy intensity, target level of energy inten-sity, and room for improvement in energy intensity: an appli-cation to the study of regions in the EU. Energy Policy, 67,648–655.
Chiou-Wei, S. Z., Chen, C. F., & Zhen, Z. (2008). Economicgrowth and energy consumption revisited—evidence fromlinear and nonlinear Granger causality. Energy Economics,30, 3063–3076.
Damodar, N. (2004).Gujarati: Basic econometrics, fourth edition.New York: The McGraw−Hill Companies.
Dergiades, T., Martinopoulos, G., & Tsoulfidis, L. (2013). Energyconsumption and economic growth: parametric and non-parametric causality testing for the case of Greece. EnergyEconomics, 36, 686–697.
Duro, J. A., Alcántara, V., & Padilla, E. (2010). Internationalinequality in energy intensity levels and the role of produc-tion composition and energy efficiency: An analysis ofOECD countries. Ecological Economics, 69(12), 2468–2474.
E3Mlab. (2008). PRIMES model.Eder, L. V., & Nemov, V. Y. (2017). Document forecast of energy
consumption of vehicles. Studies on Russian EconomicDevelopment., 28(4), 423–430.
Eder, L. V., Filimonova, I. V., Nemov, V. Y., & Provornaya, I. V.(2017). Forecasting of energy and petroleum consumption bymotor transport in the regions of the Russian Federation.Economy of Region, 13(3), 859–870.
European Commission. (2011). Energy roadmap 2050. InTechnical Report COM/2011/0885 final. Brussels: EC.
Fishbone, L. G., & Abilock, H. (1981). MARKAL, a linear-programming model for energy systems analysis: technicaldescription of the BNL version. International Journal ofEnergy Research, 5, 353–375.
Frei, C., Hadi, P., & Sarlos, G. (2003). Dynamic formulation of atop-down and bottom-up merging energy policy model.Energy Policy, 31(10), 1017–1031.
Fuinhas, J. A., &Marques, A. C. (2012). Energy consumption andeconomic growth nexus in Portugal, Italy, Greece, Spain andTurkey: an ARDL bounds test approach (1965–2009).Energy Economics, 34, 511–517.
Gabriel, S. A., Kydes, A. S., & Whitman, P. (2001). The nationalenergy modeling system: a large-scale energy-economicequilibrium model. Operations Research, 49, 14–25.
Gonzales, C. S., Xiberta, B. J., & Coalla, L. H. (1999). Forecastingof energy production and consumption in Asturias (northernSpain). Energy, 24, 183–198.
Harel, P., & Baguant, J. (1991). A growth prediction for electricalenergy consumption in Mauritius. Energy, 16, 707–711.
Heffington, W. M., & Brasovan, M. W. (1994). Prediction ofUS crude oil-production using growth curves. Energy,19, 813–815.
Herrerias, M. J. (2012). World energy intensity convergencerevisited: a weighted distribution dynamics approach.Energy Policy, 49, 383–399.
Hourcade, J. C., Jaccard, M., Bataille, C., & Ghersi, F. (2006).Hybrid modeling: new answers to old challenges. The EnergyJournal, 2, 1–12.
Howells, M., Rogner, H., Strachan, N., Heaps, C., Huntington, H.,Kypreos, S., Hughes, A., Silveira, S., DeCarolis, J., Bazillian,M., & Roehrl, A. (2011). OSeMOSYS: the open sourceenergy modeling system: an introduction to its ethos, struc-ture and development. Energy Policy, 39, 5850–5870.
IAEA. (2005). Energy indicators for sustainable development:Guidelines and methodologies. Vienna: IAEA.
Kadoshin, S., Nishiyama, T., & Toshihide, I. (2000). The trend incurrent and near future energy consumption from a statisticalperspective. Applied Energy, 67, 407–417.
Kontorovich, A. E., Korzhubaev, A. G., Filimonova, I. V., Eder, L.V. (2008). Development of hydrocarbon raw material deepprocessing in Russia. Neftyanoe khozyaystvo - Oil Industry,(5), 24–27.
Kontorovich, A. E., Eder, L. V., Nemov, V. Yu. (2012). Balance ofthe work of Russia oil industry in 2011. Neftyanoekhozyaystvo - Oil Industry, (7), 66–70.
Kontorovich, A. E., Eder, L. V., Nemov, V. Yu. (2013). Oil and gasin the Russian economics. Neftyanoe khozyaystvo—OilIndustry, (1), 4–8.
Kontorovich, A. E., Eder, L. V., Filimonova, I. V., Mishenin, M.V., & Nemov, V. Y. (2016). Oil industry of major historicalcenters of the Volga-Ural petroleum province: past, currentstate, and long-run prospects. Russian Geology andGeophysics, 57(12), 1653–1667.
Korzhubaev, A. G., Filimonova, I. V., Eder, L. V., Sokolova, I. A.(2009). Strategy of development of an oil-and-gas complexSiberia. Neftyanoe khozyaystvo - Oil Industry, (3), 14–17.
Liddle, B. (2010). Revisiting world energy intensity convergencefor regional differences. Applied Energy, 87, 3218–3225.
Loulou, R., & Labriet, M. (2008). ETSAP-TIAM: the TIMESintegrated assessment model. Part I: model structure.Computational Management Science, 5, 7–40.
Mackey, R. M., & Probert, S. D. (1995). Energy and environmen-tal policies of the developed and developing countries withinthe evolving Oceania and south-east Asian trading block.Applied Energy, 51, 369–406.
Markandya, A., Pedroso-Galinato, S., & Streimikiene, D. (2006).Energy intensity in transition economies: is there
Energy Efficiency

convergence towards the EU average? Energy Economics,28, 121–145.
Messner, S., & Schrattenholzer, L. (2000). MESSAGE-MACRO:linking an energy supply model with a macroeconomic mod-ule and solving it iteratively. New Horiz Environ Econ, 25,267–282.
Messner, S., & Strubegger, M. (1987). A framework to analyze theconsumption of energy. Proceedings of the Workshop ofEconomics, Modeling, Planning and Management ofEnergy, Trieste, Italy. 315–28.
Miketa, A., & Mulder, P. (2005). Energy productivity acrossdeveloped and developing countries in 10 manufacturingsectors: patterns of growth and convergence. EnergyEconomics, 27, 429–453.
Mulder, P., & De Groot, H. L. F. (2007). Sectoral energy- andlabour-productivity convergence. Environmental andResource Economics, 36, 85–112.
Mulder, P., & Groot, H. L. F. (2012). Structural change andconvergence of energy intensity across OECD countries,1970–2005. Energy Economics, 34, 1910–1921.
Omri, A. (2013). CO2 emissions, energy consumption and eco-nomic growth nexus in MENA countries: evidence fromsimultaneous equations models. Energy Economics, 40,657–664.
Ortiz, R. A., Bastianin, A., Bigano, A., Cattaneo, C., Lanza, A.,Manera, M., Markandya, A., Plotegher, M., Sferra, F. (2009).Energy efficiency in Europe: trends, Convergence and PolicyEffectiveness. MPRA no. 15763.
Pen, Y. L., & Sévi, B. (2008). On the non-convergence of energyintensities: evidence from a pair-wise econometric approach.Centre de Recherche en Economie et Droit de l'EnergieCreden.
Pen, Y. L., & Sévi, B. (2010). What trends in energy efficien-cies? Evidence from a robust test. Energy Economics, 32,702–708.
Pfenninger, S., Hawkes, A., & Keirstead, J. (2014). Energy sys-tems modeling for twenty-first century energy challenges.Renewable and Sustainable Energy Reviews, 10, 281–311.
Pirlogea, С., & Cicea, С. (2012). Econometric perspective of theenergy consumption and economic growth relation inEuropean Union. Renewable and Sustainable EnergyReviews, 16, 5718–5726.
Quah, D. T. (1993). Empirical cross-section dynamics in economicgrowth. European Economic Review, 37, 426–434.
Quah, D. T. (1996). Empirics for economic growth and conver-gence. European Economic Review, 40(6), 1353–1375.
Rao, R. D., & Parikh, J. K. (1996). Forecast and analysis ofdemand for petroleum products in India. Energy Policy, 24,583–592.
Reddy, S. (1995). An econometric analysis of energy use in urbanhouseholds. Energy Sources, 17, 359–372.
Sala-i-Martin, X. X. (1996). The classical approach to conver-gence analysis. Economic Journal, 106, 1019–1036.
Schrattenholzer, L. (1981). The energy supply model MESSAGE.Laxenburg: IIASA.
SEI. (2012). LEAP documentation.Solow R. M. (1956) A contribution to the theory of economic
growth. Quarterly Journal of Economics, (70), 65–94.Strachan, N., & Kannan, R. (2008). Hybrid modelling of long-
term carbon reduction scenarios for the UK. EnergyEconomics, 30, 2947–2963.
Voigt, S., Cian, E. D., Schymura, M., & Verdolini, E. (2014).Energy intensity developments in 40major economies: struc-tural change or technology improvement? EnergyEconomics, 41, 47–62.
Yuan, J. H., Kang, J. G., Zhao, C. H., & Hu, Z. G. (2008). Energyconsumption and economic growth: evidence from China atboth aggregated and disaggregated levels. EnergyEconomics, 30, 3077–3094.
Energy Efficiency


![Lessons from Reducing Emissions from Deforestation and ... › giee › pubpdfs › Negra_2011_Carbon... · Under the UN Framework Convention on Climate Change (UNFCCC) [101], coun-tries](https://img.dokumen.tips/doc/110x75/5f03bdec7e708231d40a8b55/lessons-from-reducing-emissions-from-deforestation-and-a-giee-a-pubpdfs.jpg)