Embed Size (px)
Citation preview
Published Ahead of Print 17 January 2012. 2012, 80(4):1467. DOI: 10.1128/IAI.06332-11. Infect. Immun.
Rivera, Teresa Gonçalves and Arturo CasadevallCarolina Coelho, Lydia Tesfa, Jinghang Zhang, Johanna Using Laser Scanning Cytometry
Cryptococcus neoformans InfectionVitroIn and In VivoMouse Macrophages after
Analysis of Cell Cycle and Replication of
http://iai.asm.org/content/80/4/1467Updated information and services can be found at:
These include:
SUPPLEMENTAL MATERIAL Supplemental material
REFERENCEShttp://iai.asm.org/content/80/4/1467#ref-list-1at:
This article cites 41 articles, 19 of which can be accessed free
CONTENT ALERTS more»articles cite this article),
Receive: RSS Feeds, eTOCs, free email alerts (when new
http://journals.asm.org/site/misc/reprints.xhtmlInformation about commercial reprint orders: http://journals.asm.org/site/subscriptions/To subscribe to to another ASM Journal go to:
on March 26, 2013 by A
LBE
RT
EIN
ST
EIN
CO
LL OF
ME
Dhttp://iai.asm
.org/D
ownloaded from

Analysis of Cell Cycle and Replication of Mouse Macrophages afterIn Vivo and In Vitro Cryptococcus neoformans Infection UsingLaser Scanning Cytometry
Carolina Coelho,a,b Lydia Tesfa,c Jinghang Zhang,c Johanna Rivera,a Teresa Gonçalves,b and Arturo Casadevalla
Department of Microbiology and Immunology, Albert Einstein College of Medicine of Yeshiva University, Bronx, New York, USAa; Ph.D. Programme in ExperimentalBiology and Biomedicine, Centre for Neuroscience and Cell Biology of Coimbra and Institute of Microbiology, Faculty of Medicine, University of Coimbra, Coimbra,Portugalb; and Flow Cytometry Core Facility, Albert Einstein College of Medicine of Yeshiva University, Bronx, New York, USAc
We investigated the outcome of the interaction of Cryptococcus neoformans with murine macrophages using laser scanning cy-tometry (LSC). Previous results in our lab had shown that phagocytosis of C. neoformans promoted cell cycle progression. LSCallowed us to simultaneously measure the phagocytic index, macrophage DNA content, and 5-ethynyl-2=-deoxyuridine (EdU)incorporation such that it was possible to study host cell division as a function of phagocytosis. LSC proved to be a robust, reli-able, and high-throughput method for quantifying phagocytosis. Phagocytosis of C. neoformans promoted cell cycle progres-sion, but infected macrophages were significantly less likely to complete mitosis. Hence, we report a new cytotoxic effect associ-ated with intracellular C. neoformans residence that manifested itself in impaired cell cycle completion as a consequence of ablock in the G2/M stage of the mitotic cell cycle. Cell cycle arrest was not due to increased cell membrane permeability or DNAdamage. We investigated alveolar macrophage replication in vivo and demonstrated that these cells are capable of low levels ofcell division in the presence or absence of C. neoformans infection. In summary, we simultaneously studied phagocytosis, thecell cycle state of the host cell and pathogen-mediated cytotoxicity, and our results demonstrate a new cytotoxic effect of C. neo-formans infection on murine macrophages: fungus-induced cell cycle arrest. Finally, we provide evidence for alveolar macro-phage proliferation in vivo.
The interaction of the human pathogenic fungus Cryptococcusneoformans with macrophages is thought to be a key event in
the outcome of cryptococcal infection (10, 13, 17, 28, 29). C. neo-formans is a facultative intracellular pathogen and, once within amacrophage, C. neoformans can replicate intracellularly with out-comes that range from host cell lysis to nonlytic exocytosis (2, 3,23). Previous work in our laboratory has established that phago-cytosis of C. neoformans by murine macrophages could lead mac-rophages into cell cycle progression, namely, into the S phase ofthe cell cycle (21). Later work established that Fc� Receptor(Fc�R) cross-linking triggered cell cycle progression resulting inincreased proliferation of murine macrophages (20). However,while Fc�R cross-linking (20) or ingestion of antibody-coatedbeads led to cyclin D1 activation, phagocytosis of live yeasts sup-pressed cyclin D1 activation (18), possibly reflecting fungal-me-diated host cell damage. Cyclin D1 is a major checkpoint in thepassage from G1 to S phase. Hence fungus-macrophage interac-tion could influence host cell cycle machinery. Consequently,there is considerable interest in the relationship between macro-phage cell cycle and phagocytic function.
Macrophages are derived from monocytes that migrate intotissues, where they acquire tissue-specific characteristics and canlive as resident tissue cells for years (25, 26). Evidence for residentmacrophage proliferation has been available for some time (30),but this phenomenon plays an unknown role in the maintenanceof tissue specific macrophages. In the lung, specifically, the site ofthe initial infection in human cryptococcosis, there is evidence forin vivo alveolar macrophages (AM) proliferation (4, 31, 32). AMrecovered from mice exposed to cigarette smoke manifested in-creased proliferation in vitro, suggesting that cell division could beincreased in response to a damaging stimuli (12). Nevertheless,
many questions still remain as to the relative contribution of localmacrophage proliferation versus influx of blood monocytes inresponse to infection. In recent months, several studies have ap-peared in the literature investigating this phenomenon and howmacrophage life, replication and death are balanced at the onsetand resolution of tissue insult and damage (1, 9, 14, 15). Thesestudies suggest that macrophage proliferation contributes to nor-mal tissue homeostasis and that macrophages can replicate at thesite of inflammation. In the present study we show that laser scan-ning cytometry (LSC) can be adapted to study phagocytosis andhave used this technique to explore how phagocytosis of yeast cellsinfluenced macrophage cell cycle progression and mitosis. LSCwas developed to scan, analyze, and compare images from micro-scopic preparations in a fully automated form. It enables users toperform analysis similar to flow cytometry using various quanti-tative parameters extracted from the scanned images (11). Theability of LSC to perform microscopic correlations of cellular andsubcellular events in a large population of cells makes it a highlyattractive technique for studying intracellular processes. LSC isroutinely used in several applications, such as microarray analysis,
Received 16 December 2011 Returned for modification 4 January 2012Accepted 5 January 2012
Published ahead of print 17 January 2012
Editor: G. S. Deepe, Jr.
Address correspondence to Carolina Coelho, [email protected].
Supplemental material for this article may be found at http://iai.asm.org/.
Copyright © 2012, American Society for Microbiology. All Rights Reserved.
doi:10.1128/IAI.06332-11
0019-9567/12/$12.00 Infection and Immunity p. 1467–1478 iai.asm.org 1467
on March 26, 2013 by A
LBE
RT
EIN
ST
EIN
CO
LL OF
ME
Dhttp://iai.asm
.org/D
ownloaded from

tissue section analysis, and immunophenotyping, and in cell cycleor mitosis analysis (16, 42). It is generally accepted that the resultsof LSC are equivalent to flow cytometry and that for certain assaysit can be more sensitive than flow cytometry, such as detectingcells in transition between mitotic phases or in very early apopto-sis (33, 42). Hence, LSC can be a powerful tool for studying patho-gen interactions with macrophages.
(The data in the present study are from a thesis to be submittedby Carolina Coelho in partial fulfillment of the requirements for aPh.D. degree from the Faculty of Medicine, University of Coim-bra, Coimbra, Portugal.)
MATERIALS AND METHODSYeast strains, cell lines, and reagents. C. neoformans var. grubii strainH99 (serotype A) was obtained from John Perfect (Durham, NC), and C.neoformans var. neoformans strain 24067 (serotype D) was obtained fromthe American Type Tissue Collection (Rockville, MD). Strain H99 wasused for all in vitro studies. Both strains were cultured in Sabouraud dex-trose broth (Difco, Carlsbad, CA) for 2 days at 37°C with agitation (150 to180 rpm). Yeast cells were washed three times with sterile phosphate-buffered saline (PBS), counted on a hemocytometer, and suspended at theappropriate cell density in cell culture media.
The IgG1 monoclonal antibody (MAb) 18B7 was described previously(5) and was used as an opsonin at 10 �g/ml, unless otherwise noted. Themacrophage-like murine cell line J774.16, which was originally derivedfrom a reticulum sarcoma, was used for most experiments. Macrophageswere grown in media consisting of Dulbecco minimal essential medium(DMEM; CellGro; Mediatech, Manassas, VA), 10% NCTC-109 Gibcomedium (Invitrogen, Carlsbad, CA), 10% heat-inactivated fetal calf se-rum (FCS; Atlanta Biologicals, Lawrenceville, GA), and 1% nonessentialamino acids (CellGro).
Bone marrow-derived macrophages (BMDM) were obtained fromwild-type 6- to 8-week-old BALB/c female mice (National Cancer Insti-tute, Bethesda, MD). Briefly, mice were killed by CO2 asphyxiation, andbone marrow cells were harvested from the hind leg bones by flushingthem with DMEM. The harvested cells were cultured at 37°C with 5% CO2
in DMEM with 20% L-929 cell conditioned medium, 10% fetal bovineserum (FBS), 2 mM L-glutamine (CellGro), 1% nonessential amino acids(CellGro), 1% HEPES buffer (CellGro), and �-mercaptoethanol (Gibco,Carlsbad, CA). Macrophages were allowed to grow for 6 to 8 days beforeplating at the desired density for the experiments.
All animal experiments were conducted according to ethical guide-lines, with the approval of the Institutional Animal Care and Use Com-mittee of Albert Einstein College of Medicine.
In vitro phagocytosis assays. For LSC experiments, J774.16 andBMDM cells were seeded in a 96-well glass bottom plate with dark edges(MGB096-1-2-HG-L; Matrical Biosciences, Spokane, WA). The macro-phages were plated at a density of 2.4 � 104 cells/well and used for phago-cytosis studies after adhering to the microtiter plate for either 2 h orovernight. Yeasts were added at a multiplicity of infection (MOI) of 1:2and the opsonic MAb was added at 10 �g/ml in a final volume of 200 �lper well. When necessary, C. neoformans was heat killed (HK C. neofor-mans) by incubation at 56°C for 60 min. Phagocytosis was allowed toproceed for 2 h at 37°C under a 5% CO2 atmosphere.
After phagocytosis, the wells were washed twice with 200 �l of PBS,fixed in ice-cold methanol for 30 min at �20°C, and washed again. Wheatgerm agglutinin (WGA) conjugated to Alexa 633 (Invitrogen) was used at10 �g/ml and incubated overnight at 4°C. We found no instances of C.neoformans staining with WGA in our experimental conditions. Uvitex 2B(Polysciences, Inc., Warrington, PA) was added at a 0.1 �g/ml and al-lowed to stain for 1 min. Propidium iodide (PI; Sigma-Aldrich, St. Louis,MO) was added at a concentration of 5 �g/ml in a total volume of 400 �lper well. The cells were analyzed in PI solution.
Alternative protocols were designed according to experimental con-
veniences. When using antibodies for detection, preparations wereblocked for 30 min at room temperature with 2% FCS in PBS. In oneprotocol, detection of yeasts was done by detecting the opsonizing anti-body bound to the capsule with an Alexa 488-conjugated goat antibody tomurine IgG (Invitrogen) at a 1:50 dilution. The macrophage contourcould also be successfully detected using Alexa 633-conjugated antibodyto mouse F4/80 (Invitrogen) at a dilution of 1:25.
Confirmation of successful internalization can be achieved by immu-nostaining extracellular C. neoformans previous to permeabilization, fol-lowed by Uvitex staining of the total C. neoformans. Staining of C. neofor-mans nuclei with PI occurred but, given the smaller size of C. neoformansnuclei and the dimmer fluorescent signal, it was not enough to interferewith DNA quantification. Irrespective of this, we established an indepen-dent nucleus contour, such that the staining of the C. neoformans nuclei isautomatically excluded from the macrophage nuclei contour, to assurethat it did not interfere with our determination of macrophage nuclei andDNA quantification. In addition, cell cycle plots were prepared with thenucleus contour that corresponded only to the macrophage nuclei.
Images were acquired in LSC by imaging 35 to 60 fields in each wellwith the �40 objective lens at a 0.5-�m resolution, allowing a field size of500 �m by 192 �m. For phagocytosis assays, at least 1,000 cells wereimaged for each experimental replicate.
After the acquisition of fluorescent images in LSC, the preparationswere stained by incubation with Giemsa dye solution for 2 h at roomtemperature and then washed with PBS to remove the excess stain. Thephagocytic index was quantified by direct observation using an invertedmicroscope for a total of three fields per well, with at least 100 cells/field.Macrophages with internalized C. neoformans were readily distinguish-able from cells that had not ingested C. neoformans or from cells where C.neoformans was simply attached to the outside, due to the visible vacuolecontaining engulfed C. neoformans.
In vitro replication studies. A protocol to study replication in vitrowas adapted from the work of Darzynkiewicz et al. (8). Briefly, J774.16macrophages were plated at 2.4 � 104 cells/well and allowed to adhere for2 h. In all conditions, a 10 �M solution of 5-ethynyl-2=-deoxyuridine(EdU) in cell medium was added for 2 h, unless otherwise noted, and thenremoved by washing with warm media. For prelabeling studies, the cellswere labeled with EdU and then allowed to ingest C. neoformans for 15min at an MOI of 1:5; afterward, the extracellular C. neoformans wasremoved by two washes with warm media. For postlabeling studies, C.neoformans phagocytosis was performed in the same manner, but EdUwas added after the C. neoformans was removed. After 2 h, the cell mediumwas replaced with fresh medium, and the cells were allowed to cycle for anadditional 2 h. Coincubation studies consisted of phagocytosis of C. neo-formans at an MOI of 1:2 in the presence of EdU for 2 h. The cells werefixed in methanol, and nonspecific signal was blocked with 2% FBS inPBS. EdU labeling was performed according to the manufacturer’s in-structions. Briefly, this labeling strategy coupled the thymidine analogueEdU with an azide-conjugated Alexa 488 for detection, via the Click-itChemistry reaction (Invitrogen). Macrophages were counterstained withWGA-Alexa 633 and PI, and yeast were detected with Uvitex. LSC imageswere obtained with a �40 objective lens at a 0.5-�m resolution, allowinga field size of 500 �m by 192 �m. For cell cycle analysis, 49 to 100 fieldswere imaged to information from at least 2,000 cells in each experimentalreplicate.
Experiments with BMDM were performed alike, except that the timefor EdU incubation was extended to 6 h due to the slower replication rateof these cells relative to J774.16 cells. When indicated, BMDM were incu-bated with gamma interferon (IFN-�) at 400 U/ml or lipopolysaccharide(LPS) at 1 ng/ml for 18 h before phagocytosis, and the stimuli were reno-vated after each medium change. Taxol (Tocris Bioscience, Ellisville, MO)was added at 250 nM for 18 h.
DNA fragmentation and permeability assays. Phagocytic experi-ments were carried out as described above for 2, 6, and 18 h. Valinomycin(Tocris Bioscience) was added at a concentration of 400 nM for 18 h to
Coelho et al.
1468 iai.asm.org Infection and Immunity
on March 26, 2013 by A
LBE
RT
EIN
ST
EIN
CO
LL OF
ME
Dhttp://iai.asm
.org/D
ownloaded from

induce apoptosis through DNA damage, serving as a positive control forboth experiments. Cell membrane permeability was measured by adding100 nM Image-iT DEAD Green (Invitrogen) to cells 30 min before fixa-tion with 4% paraformaldehyde. Cells were counterstained with Alexa633-conjugated WGA and DAPI (4=,6=-diamidino-2-phenylindole). Theexperiment was performed twice for J774.16 cells and once for BMDM intriplicate wells.
TUNEL (terminal deoxynucleotidyltransferase-mediated dUTP-bio-tin nick end labeling) staining (Invitrogen) was performed according tothe manufacturer’s instructions. Briefly, the wells were fixed with 4%paraformaldehyde, and 100 �l of TdT reaction cocktail was added for 1 hat 37°C; the samples were then washed and developed by incubation witha Click-iT reaction cocktail that couples TdT to Alexa 647, allowing fluo-rescence detection. The cells were counterstained with PI, and yeast cellswere labeled with Uvitex. This experiment was performed twice forJ774.16 cells and once for BMDM with a single experimental replicate.LSC images were obtained with a �40 objective lens at a 0.5-�m resolu-tion, allowing a field size of 500 �m by 192 �m. At least 1,000 cells wereimaged for each experimental replicate.
In vivo replication studies. AM labeling was performed as describedpreviously (17, 19). Briefly, 100 �l of 40 mM PKH26 (PKH) was dissolvedinto 300 �l of diluent B (Sigma-Aldrich) in order to label phagocytic cellsand injected into the tail vein of BALB/c mice. After 2 days, mice wereinfected with the virulent strain 24067. In vivo studies were performedwith strain 24067 because this strain is better characterized in our lab inthe context of the mouse model of intratracheal infection (41). Mice wereanesthetized with ketamine (10 mg/kg) and xylazine (125 mg/kg) intra-peritoneally (i.p.) in PBS, a midline incision over the trachea was per-formed, and an inoculum of 106 C. neoformans in 50 to 100 �l was injectedinto the trachea. The incision was closed with VetBOND (3M, St. Paul,MN). At 4 days postinfection, mice were injected i.p. with 100 �g of EdUin PBS–20% dimethyl sulfoxide or vehicle alone, as described previously(24). Mice were sacrificed 6 h after EdU administration by CO2 asphyxi-ation, and bronchoalveolar lavage (BAL) was performed to extract theAM. Briefly, the trachea was exposed, and the lungs were lavaged 10 timeswith 0.8 ml of sterile calcium and magnesium-free HBSS (Life Technolo-gies, Grand Island, NY) supplemented with 1 mM EGTA (Sigma-Al-drich). The BAL was spun, resuspended in cell culture medium, and al-lowed to adhere for 2 h at 37°C in 5% CO2. The cells were treated with ahypotonic solution of NH4Cl for 10 min on ice to remove red blood cellsand subsequently fixed for 30 min at �20°C. The preparations were thenblocked with 2% FCS in PBS, and EdU staining was developed accordingto the manufacturer’s instructions (Invitrogen). Nuclei were counter-stained with DAPI. Images were acquired in LSC studies by imaging 156fields/well with a �60 objective lens that allowed 0.15-�m resolution.Additional confirmation was performed by inspecting the entire area ofthe negative control wells in an inverted epifluorescence microscope at�20 magnification. No positive events were ever found in the negativecontrol samples.
Data collection and analysis. An iCys research imaging cytometer(CompuCyte Corp., Westwood, MA) was used for these experiments.Instrument control, data acquisition, and analysis were performed usingthe iCys cytometric analysis software provided with the instrument. Theinstrument was calibrated using an empty 96-well plate to allow use of theautofocus feature.
For image analysis, three different type of events were defined: the“Cell” event was the combined image of the nuclear PI signal plus the cellmembrane WGA, the nuclear signal generated the “Nucleus” event, andthe “Uvitex” event was used for the Uvitex-stained yeasts (Fig. 1).
The creation of these channels was the first step in analyzing cell fluo-rescence so cells could be recognized and contoured by the software andtranslated into events. The “Cell” channel contoured macrophages usinga merged PI and WGA image. Clusters of positive pixels were delimited,creating the threshold contour, which allowed the software to identify asingle macrophage cell as one “event.” Association of separate events such
as “Cell,” “Nucleus,” or “Yeast” was the last step, allowing quantificationof the number of “Yeast” events localized within the contour of the “Cell”event, i.e., the number of phagocytosed particles inside each macrophage.
Events are represented in a scatter plot or histograms, where differentregions could be defined. The statistics of the number of events occurringin each of the regions of interest were obtained and used to calculate thephagocytic index and fungal burden.
Statistical analysis and plotting. Graphs and statistical analysis wereperformed in Prism, version 5.00, for Mac OS X (GraphPad Software, SanDiego, CA).
RESULTSDevelopment of the LSC detection protocol. The first objectiveof the present study was to establish whether LSC could beadapted to study the phagocytosis of C. neoformans by macro-phages. The irregular shape of a macrophage cell was successfullydetected by merging PI nuclear staining with WGA (Fig. 1). Yeastcells were successfully detected with either the fungal cell wall stainUvitex or specific capsule-binding antibody staining. The methodwas first established in the macrophage-like immortalized cell lineJ774.16 and then adapted to primary cells, including BMDM andAM, and subsequently to in vivo phagocytosis after intratrachealinstillation of C. neoformans (data not shown).
We ascertained LSC accuracy by inspecting the images createdby the instrument (see Fig. S1 in the supplemental material). LSCcorrectly identified more than 90% of the macrophages. In addi-tion to detecting number of phagocytic macrophages, LSC quan-tified the number of yeasts that each macrophage ingested with85% accuracy and distinguished up to 10 yeasts inside each cell.LSC could analyze more than 1,000 cells within the time frame inwhich a human operator would only be able to analyze 100 to 300cells, while greatly reducing operator time investment.
Cell cycle analysis was performed by two measurements: DNAcontent quantification after PI staining and new DNA synthesisthrough nucleoside analogue EdU incorporation, as recently pub-lished (4) and as illustrated in Fig. 1B. Hence, we concluded thatLSC quantification was a fast, versatile, and reliable method forstudying the cell cycle in phagocytic macrophages.
LSC measurements using different C. neoformans stainingprotocols. To ensure that LSC was compatible with a wide rangeof fluorescent tools, we established and compared two separate C.neoformans staining protocols. The cell wall-specific stain Uvitexis available in only one fluorescent color. Since a capsular antibodywas used as an opsonin to mediate phagocytosis, we investigatedwhether the same antibody could also be used for C. neoformansdetection. The advantage of antibody detection is that it wouldallow us to choose a wide range of commercially available fluoro-phores. Consequently, we compared immunostaining to Uvitexstaining and compared both to human operator visual quantifica-tion after Giemsa staining (Fig. 2A) over a range of opsonizingMAb concentrations. Uvitex staining was effective independentlyof the concentration of opsonizing antibody used. In contrast,immunostaining was effective only when opsonizing MAb con-centrations of �10 �g/ml were used. Concentrations of opsoniz-ing antibody of �10 �g/ml promoted effective phagocytosis, butthe phagocytic index determined by antibody staining was half thevalue detected by other stains, since this method is dependent on acertain amount of antibody bound to fungal cells. Concerns thatadhered yeasts could be mistakenly measured as internalizedyeasts were addressed by combining both C. neoformans detectiontechniques, where one of the stains was applied before methanol
In Vivo and In Vitro Macrophage Replication
April 2012 Volume 80 Number 4 iai.asm.org 1469
on March 26, 2013 by A
LBE
RT
EIN
ST
EIN
CO
LL OF
ME
Dhttp://iai.asm
.org/D
ownloaded from

permeabilization and the other was applied after permeabiliza-tion. We determined that at 2 h the measurement of total yeasts(single staining) or differentiation of bound and internalized yeast(double staining) produced similar results (for example, bothmethods quantified 19% of nonphagocytic macrophages) (seeFig. S2 in the supplemental material), thus eliminating the need touse differential staining when performing phagocytic measure-ments for 2 h or longer. However, when shorter time intervalswere used or when internalization of C. neoformans was blocked(incubation of cells at 4°C promotes binding without internaliza-tion), measurement of total yeasts had a higher phagocytic ratethan when double staining was performed. Hence, only insome conditions was it necessary to perform double staining todifferentiate adherent C. neoformans and avoid biasing phago-cytic index.
We inquired whether LSC quantification correlated with micro-scopic counting performed by a human operator, which is currentlythe standard in the field. Furthermore, we investigated human-to-human variation in phagocytic index determinations given the samepreparation to quantify. A comparison of the LSC count to that ob-tained by five human operators was done using in the same triplicatewells of one phagocytic assay (Fig. 2B). The phagocytic rate for trip-licate wells obtained by LSC protocol (31%) was comparable to thatmeasured by different human operators (from 15 to 30%), as was thestandard deviation obtained. Curiously, there was no statistical dif-ference between the counts between operators, as assessed by one-way analysis of variance (P � 0.4). These results show that LSC wasadaptable to a wide variety of phagocytic indexes and experimentalconditions and that operator bias should not be a concern in fungalphagocytic determinations.
FIG 1 Quantification of phagocytosis and cell cycle phase in macrophages by LSC. (A) Phagocytic quantification. Fluorescence images of Uvitex-stained C.neoformans (Cn) (a), PI-stained nuclei (b), WGA-stained cytoplasm (c), and merged Uvitex, PI, and WGA (d) are shown. (e and f) Contours encirclingfluorescent areas (light green line) define the macrophage area, and contours encircling Uvitex signal define the C. neoformans area (cyan line) (e); the C.neoformans yeast (C. neoformans) subcontours inside each macrophage are also quantified (f). Categories were created and translated into color-coded box-es—no C. neoformans, green; 1 to 2 C. neoformans, yellow; and �3 C. neoformans, magenta—allowing verification of the software identification. Scale bar, 20 �m.(B) Cell cycle status and correlation with phagocytosis. The association of different fluorescent markers allowed the identification of macrophages and study ofintracellular events within each macrophage. Macrophages were classified according to the number of yeasts that they had ingested and then subclassifiedaccording to their cell cycle phases. (a) Cytoplasmic signal and nuclear signals were merged to delineate the macrophage and define the macrophage population(white box). (b) PI staining quantifies the amount of DNA, producing a histogram with three regions that reflected the cell cycle stage, i.e., the G1, S, and G2/Mphase. (c) EdU labeling (Red) identifies cells actively synthesizing DNA (S phase). (d) The number of C. neoformans events inside each macrophage was plottedand divided into three categories: no C. neoformans, green; 1 to 2 C. neoformans, yellow; and �3 C. neoformans, magenta. The experiment was performed withprimary macrophages infected with C. neoformans strain H99 at an MOI of 1:2.
Coelho et al.
1470 iai.asm.org Infection and Immunity
on March 26, 2013 by A
LBE
RT
EIN
ST
EIN
CO
LL OF
ME
Dhttp://iai.asm
.org/D
ownloaded from

Cell cycle correlation with ingestion of yeast cells. Previouswork in our lab had established that phagocytosis of C. neoformansor inert latex beads drives macrophage cells into S phase (15). Weinvestigated this result further by studying cell cycle progression asa function of intracellular fungal burden. In concordance with ourprior study, ingestion of heat-killed (HK) or live C. neoformanscells was associated with a decrease in the proportion of G1-phasecells (56% in cells with no C. neoformans versus 33% in cells with1 to 2 yeasts and 42% when cells contained �3 yeasts) and aconcomitant increase in the proportion of cells in the S and G2/Mphases for live C. neoformans (15% in cells with no C. neoformansversus 17% in 1 to 2 yeasts and 20% when �3 yeasts were ingested)(Fig. 3A and B). Note that cell cycle progression increased as fun-gal burden increased, suggesting that a higher fungal burden had astronger effect in driving the macrophage into S phase.
To expand and confirm our findings, we used EdU incorpora-tion as an alternative to DNA quantification. In contrast to PIstaining, which reflects the total DNA content, EdU incorporationlabels cells with active DNA synthesis, i.e., cells in the S phase ofthe cell cycle (Fig. 3C). When J774.16 macrophages ingested C.neoformans, the rate of EdU incorporation was equal to that ofmacrophages that did not phagocytose C. neoformans. In otherexperiments, macrophages were allowed to ingest more C. neofor-mans at an MOI of 1:10 (macrophage/yeast ratio), and still therewas no significant increase in Edu� cells relative to cells with no C.neoformans. Furthermore, when phagocytosis was allowed to pro-ceed for 4 h, there was still no increase in the rate of EdU� cells(results not shown).
In vitro J774.16 macrophage proliferation after ingestion ofyeast cells. To investigate the apparent discordance between DNAquantification and EdU incorporation, we carried out pulse-label-ing experiments to track cycling macrophages. Macrophages werelabeled with EdU for 2 h, EdU was removed, and the cells were leftto complete the cell cycle, such that EdU-labeled macrophageswould now be in the G1 phase of the cell cycle. Some macrophageswere prelabeled with EdU for 2 h, allowed to phagocytose C. neo-formans for 15 min, and left for an additional 4 h to complete cellcycle. Postlabeled cells were allowed to phagocytose first for 2 h
and then incubated with EdU for 2 h and given an additional 2 h toprogress through the cycle. Both pre- and postlabeled cells thatphagocytosed C. neoformans had a percentage of Edu� cells thatwas similar to that of uninfected macrophages (44% in cells withno C. neoformans versus 43% in live C. neoformans and 44% forHK C. neoformans) (Fig. 4A), findings similar to the results in Fig.3C. In uninfected macrophages, 27% of the prelabeled macro-phages were now in the G1 gate of the DNA histogram, but whenlive C. neoformans was present, only 12% of the Edu� macro-phages had reached the G1 phase (Fig. 4B). These results wereconsistent with an increase in Edu� cells located in the G2/Mphase (Fig. 4C), when macrophages ingest C. neoformans, suchthat 22% of the macrophages that ingested live C. neoformans werestill in the G2/M phase, while uninfected macrophages had only11%. Both results combined reflect an accumulation of macro-phages at the G2/M phase and a decreased rate of successful mito-sis. To validate our experimental approach, we treated J774.16cells with taxol, which is known to arrest cells at the G2/M phase.We observed that taxol treatment does not affect overall EdU in-corporation but does result in a marked increase in the number ofEdu� cells in G2/M phase (data not shown). Hence, the apparentdiscordance between PI and EdU was caused by cell cycle block atG2/M phase, such that cells are able to proceed through the S phaseand stop in the G2/M phase. Our experimental data implied thatantibody-opsonized C. neoformans ingestion caused macrophagecell cycle arrest at the G2/M phase.
BMDM proliferation after ingestion of yeast cells. To inves-tigate the relevance of our results in primary cells, our experimentswere adapted to BMDM, which have a much slower rate of pro-liferation than the J774.16 macrophage-like cell line. Some ofthese BMDM were stimulated with IFN-�, which is known toarrest macrophages in the G1 phase (38). After 6 h of phagocytosis,there was a decrease in the G1 phase accompanied by an increase inthe G2/M phase (Fig. 5A). This difference, however, was not sta-tistically significant (P � 0.3), possibly because the slower rate ofreplication of primary macrophages resulted in far fewer events.We studied macrophages treated with IFN-�, which is known tosuppress cell cycle, and in these cells phagocytosis of C. neofor-
FIG 2 Comparison of LSC staining strategies with reference methods. LSC quantification correlated with human operator quantification of a Giemsa-stainedpreparation. (A) The BMDM phagocytic rate was detected by LSC by staining with a fluorescence-labeled antibody against the opsonizing antibody andsimultaneously by Uvitex cell wall staining. The same preparations were subsequently stained with Giemsa stain and quantified by a human operator. Theexperiment was performed twice counting triplicate wells. Means � the standard deviations (SD) of triplicate wells of a representative experiment are shown.Two-tailed t test with a 95% confidence interval (*, P � 0.01; n.s., not significant). (B) Human operator quantification was compared to LSC in J774.16macrophages. Triplicate wells were analyzed by LSC and subsequently stained by Giemsa and quantified by five independent human operators. The operatorswere blind to the conditions of the assay. The pperators were instructed to choose 50% confluent fields but were left free to define their fields of analysis. Means �the SD of triplicate wells are shown. Groups were compared using one-way analysis of variance. P � 0.04 with a 95% confidence interval.
In Vivo and In Vitro Macrophage Replication
April 2012 Volume 80 Number 4 iai.asm.org 1471
on March 26, 2013 by A
LBE
RT
EIN
ST
EIN
CO
LL OF
ME
Dhttp://iai.asm
.org/D
ownloaded from

mans overcame IFN-�-induced cell cycle arrest such that macro-phages to progress into the S phase, resulting in a statistically sig-nificant difference (P � 0.0078). EdU was added to BMDM underthe same conditions, and for these cells we measured increasedEdU incorporation when macrophages ingested C. neoformans(10% versus 21% for cells with no C. neoformans versus live C.neoformans conditions). In IFN-�-stimulated macrophages therewas a higher fold increase in the percentage of Edu� cells (4%versus 12% in cells with no C. neoformans versus live C. neofor-mans) (Fig. 5B). Next, we allowed C. neoformans infection to pro-ceed for 24 h (Fig. 5C) and labeled new DNA synthesis for the last6 h of infection (Fig. 5D). The percentage of macrophages in theG1 phase was reduced when macrophages ingested C. neoformanscompared to control conditions (P � 0.02). In addition, in the
presence of IFN-�, there was a decrease in the percentage of mac-rophages in the G1 phase and a significant increase in the percent-age of macrophages in the G2/M phase (P � 0.0001), suggestingthat cell cycle arrest occurred in BMDM 24 h after phagocytosis.Similarly, EdU incorporation was increased at 24 h when macro-phages had ingested live C. neoformans or HK C. neoformans(10.1% in noninfected macrophages versus 50.5% in macro-phages with live C. neoformans). In IFN-�-treated wells the foldincrease in EdU incorporation was more drastic (1.19% versus13.9%). We repeated these experiments for LPS-activated macro-phages. C. neoformans phagocytosis was able to override the cellcycle arrest provoked by LPS (data not shown). In the absence ofgrowth factors, there was always a complete cell cycle arrest and noEdU incorporation (data not shown). We conclude that C. neo-formans infection provokes a sustained proliferative response in
FIG 3 Association of cell cycle state in J774.16 macrophages with fungal bur-den. Macrophage progression to the G2/M phase of cell cycle correlated withfungal burden within the macrophage. Macrophages were grouped accordingto the number of yeasts ingested and their cell cycle phases. (A and B) Percent-age of macrophages in the G1 phase (A) and G2/M phase (B). Experiments wereperformed three times, with six replicate wells. The data points and averagesare shown. (C) Percentage of EdU� macrophages during phagocytosis. Mac-rophages were allowed to incorporate EdU for 2 h at an MOI (macrophage/yeast ratio) of 0 (no yeasts), 1:2, or 1:10. The experiment was repeated twice induplicate wells with similar results. Shown are means � the SD of duplicatewells of a representative experiment.
FIG 4 EdU incorporation and J774.16 macrophage completion of cycle. In-gestion of C. neoformans decreased the number of macrophages that success-fully divided and returned to the G1 phase. These macrophages were retainedat the G2/M phase. Macrophages that had not ingested C. neoformans (No Cn)after 2 h of C. neoformans phagocytosis were allowed to incorporate EdU for 6h. (A) Percentage of total macrophages that incorporated EdU. (B) Percentageof macrophages that incorporated EdU, underwent mitotic division and sub-sequently reached the G1 phase. (C) Percentage of macrophages that incorpo-rated EdU and reached the G2/M phase. Experiments were performed threetimes. Shown are means � the SD of triplicate wells of a representative exper-iment. Groups were compared using a two-tailed t test with a 95% confidenceinterval (*, P � 0.05; n.s., not significant).
Coelho et al.
1472 iai.asm.org Infection and Immunity
on March 26, 2013 by A
LBE
RT
EIN
ST
EIN
CO
LL OF
ME
Dhttp://iai.asm
.org/D
ownloaded from

BMDM, as measured by the incorporation of labeled DNA nucle-otides. However, at 24 h postphagocytosis, IFN-�-treated BMDMare arrested at the G2/M phase, as measured in cell cycle plots,implying that the proliferative response was arrested and replica-tion was not successful. Unlike the J774.16 cells, in BMDM there isan increase in the rate of EdU incorporation, mainly becauseBMDM have a much slower replication rate that might be subjectto modulation. In contrast, J774.16 cells replicate more rapidly.However, for both J774.16 and BMDM, our results indicate cellcycle arrest in the G2/M phase after C. neoformans phagocytosis.
Alteration of nuclear morphology. Cyclomodulins are bacte-rial products that interfere with host cell cycle by mechanisms thatusually involve direct effects to cell cycle machinery or indirectlyby disturbing the cytoskeletal organization. Cyclomodulin usuallyresults in host cell endonucleation (multiple nuclei inside thesame cell), enlargement of the nuclei or of the cell, or inhibition ofcytokinesis that ultimately leads to cell death (27). Hence, we in-spected LSC images for altered nuclear morphology. We observedseveral events of nuclear enlargement, binucleate cells, and cellsthat seemed to result from fusion of several macrophages (see Fig.S3 in the supplemental material) in both uninfected and infectedwells. Cell cycle plots did not show an increase in ploidy over �4n(data not shown) for any of the conditions studied. Hence, the cell
cycle arrest observed for C. neoformans does not appear to becomparable to that observed with cyclomodulins.
Causes of cell cycle arrest. Cell cycle arrest could be caused byinterference directly in the cell cycle or by C. neoformans indirecttoxic effects. To investigate the cause of the cell cycle arrest, westained macrophages with the nuclear stain Image-iT green, whichis impermeable for intact membranes. Bright Image-iT fluores-cence indicates a permeable cellular membrane, characteristic ofeither late apoptosis or necrosis (Fig. 6A). In both J774.16 andBMDM there was an increase in the number of membrane-per-meable macrophages when C. neoformans was ingested. However,very few macrophages were membrane permeable, suggesting thatcell damage involving cell membrane integrity does not explaincell cycle arrest.
Next, we measured DNA fragmentation by the TUNEL assay.DNA damage will activate cell cycle checkpoints and prevent cellcycle progression and, if the DNA damage is extensive enough, itcan trigger apoptosis. We observed an increase in TUNEL� cellsfor macrophages with ingested C. neoformans relative to controlmacrophages: 0% in uninfected macrophages versus 1.4% in liveC. neoformans versus 3.2% in HK C. neoformans (Fig. 6B). Mostfrequently, we found TUNEL� nuclei already ingested by a neigh-boring macrophage (Fig. 6C, note arrows), suggesting that, in our
FIG 5 Progression in cell cycle and new DNA synthesis in BMDM. BMDM progressed into S phase, as demonstrated by cell cycle analysis and EdU incorpo-ration, when C. neoformans was ingested. (A) Cell cycle plot after 6 h of phagocytosis. (B) Incorporation of EdU after 6 h of phagocytosis. (C) Cell cycle plot after24 h of phagocytosis. (D) Incorporation of EdU 24 h after phagocytosis. Macrophages were infected with live and HK C. neoformans (indicated as Live Cn andHK Cn, respectively) for 6 or 24 h, and EdU was added in the last 6 h of the experiment. Phagocytosis occurred in the presence of growth factors, with or withoutIFN-� (to induce cell cycle arrest in G1 phase). The experiment was repeated four times using triplicate wells. Shown are means � the SD of triplicate wells of twoexperiments. Groups were compared using a two-tailed t test with a 95% confidence interval (***, P � 0.001; **, P � 0.01; *, P � 0.05; n.s., not significant).
In Vivo and In Vitro Macrophage Replication
April 2012 Volume 80 Number 4 iai.asm.org 1473
on March 26, 2013 by A
LBE
RT
EIN
ST
EIN
CO
LL OF
ME
Dhttp://iai.asm
.org/D
ownloaded from
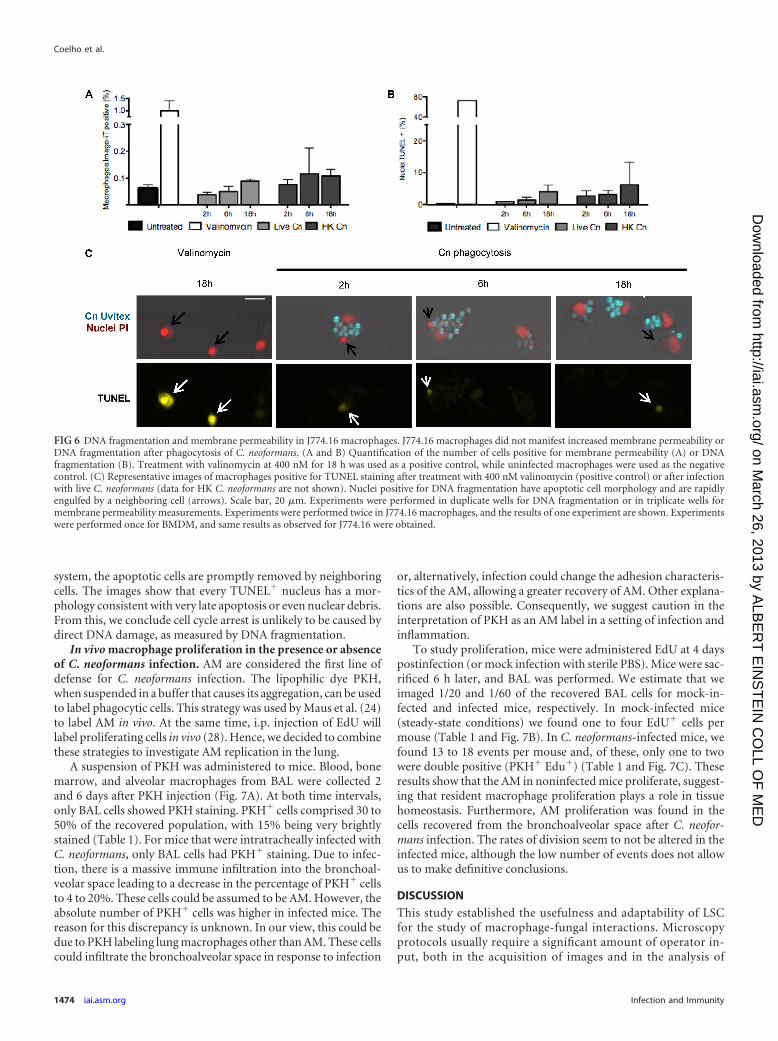
system, the apoptotic cells are promptly removed by neighboringcells. The images show that every TUNEL� nucleus has a mor-phology consistent with very late apoptosis or even nuclear debris.From this, we conclude cell cycle arrest is unlikely to be caused bydirect DNA damage, as measured by DNA fragmentation.
In vivo macrophage proliferation in the presence or absenceof C. neoformans infection. AM are considered the first line ofdefense for C. neoformans infection. The lipophilic dye PKH,when suspended in a buffer that causes its aggregation, can be usedto label phagocytic cells. This strategy was used by Maus et al. (24)to label AM in vivo. At the same time, i.p. injection of EdU willlabel proliferating cells in vivo (28). Hence, we decided to combinethese strategies to investigate AM replication in the lung.
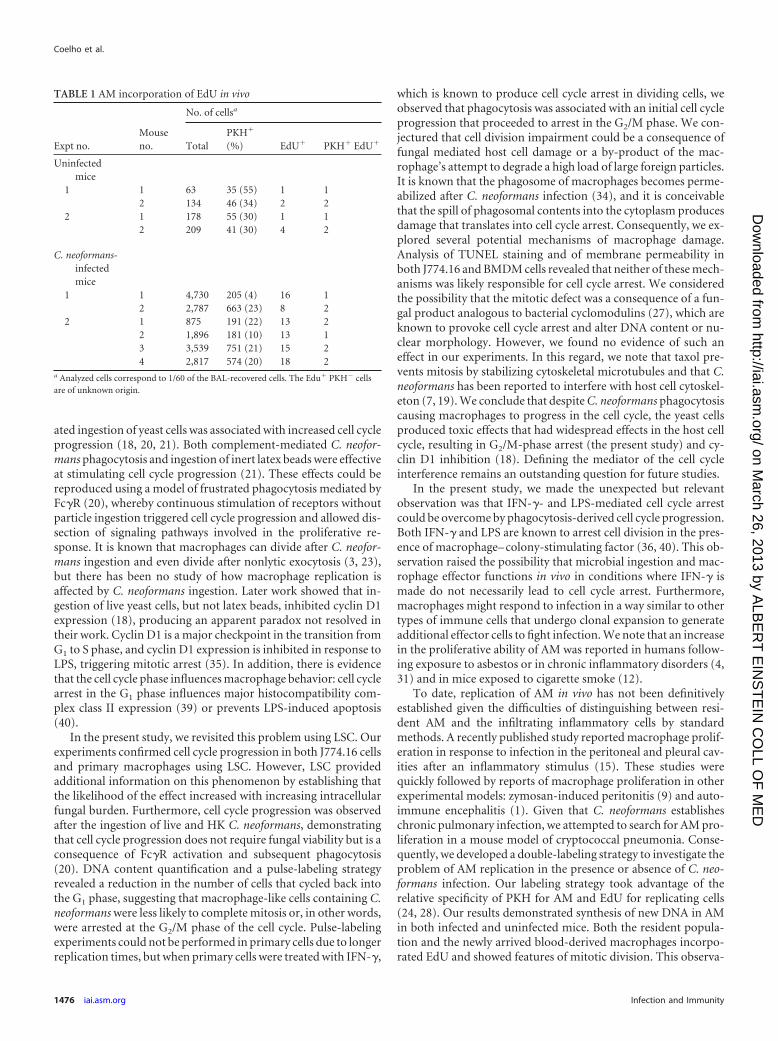
A suspension of PKH was administered to mice. Blood, bonemarrow, and alveolar macrophages from BAL were collected 2and 6 days after PKH injection (Fig. 7A). At both time intervals,only BAL cells showed PKH staining. PKH� cells comprised 30 to50% of the recovered population, with 15% being very brightlystained (Table 1). For mice that were intratracheally infected withC. neoformans, only BAL cells had PKH� staining. Due to infec-tion, there is a massive immune infiltration into the bronchoal-veolar space leading to a decrease in the percentage of PKH� cellsto 4 to 20%. These cells could be assumed to be AM. However, theabsolute number of PKH� cells was higher in infected mice. Thereason for this discrepancy is unknown. In our view, this could bedue to PKH labeling lung macrophages other than AM. These cellscould infiltrate the bronchoalveolar space in response to infection
or, alternatively, infection could change the adhesion characteris-tics of the AM, allowing a greater recovery of AM. Other explana-tions are also possible. Consequently, we suggest caution in theinterpretation of PKH as an AM label in a setting of infection andinflammation.
To study proliferation, mice were administered EdU at 4 dayspostinfection (or mock infection with sterile PBS). Mice were sac-rificed 6 h later, and BAL was performed. We estimate that weimaged 1/20 and 1/60 of the recovered BAL cells for mock-in-fected and infected mice, respectively. In mock-infected mice(steady-state conditions) we found one to four EdU� cells permouse (Table 1 and Fig. 7B). In C. neoformans-infected mice, wefound 13 to 18 events per mouse and, of these, only one to twowere double positive (PKH� Edu�) (Table 1 and Fig. 7C). Theseresults show that the AM in noninfected mice proliferate, suggest-ing that resident macrophage proliferation plays a role in tissuehomeostasis. Furthermore, AM proliferation was found in thecells recovered from the bronchoalveolar space after C. neofor-mans infection. The rates of division seem to not be altered in theinfected mice, although the low number of events does not allowus to make definitive conclusions.
DISCUSSION
This study established the usefulness and adaptability of LSCfor the study of macrophage-fungal interactions. Microscopyprotocols usually require a significant amount of operator in-put, both in the acquisition of images and in the analysis of
FIG 6 DNA fragmentation and membrane permeability in J774.16 macrophages. J774.16 macrophages did not manifest increased membrane permeability orDNA fragmentation after phagocytosis of C. neoformans. (A and B) Quantification of the number of cells positive for membrane permeability (A) or DNAfragmentation (B). Treatment with valinomycin at 400 nM for 18 h was used as a positive control, while uninfected macrophages were used as the negativecontrol. (C) Representative images of macrophages positive for TUNEL staining after treatment with 400 nM valinomycin (positive control) or after infectionwith live C. neoformans (data for HK C. neoformans are not shown). Nuclei positive for DNA fragmentation have apoptotic cell morphology and are rapidlyengulfed by a neighboring cell (arrows). Scale bar, 20 �m. Experiments were performed in duplicate wells for DNA fragmentation or in triplicate wells formembrane permeability measurements. Experiments were performed twice in J774.16 macrophages, and the results of one experiment are shown. Experimentswere performed once for BMDM, and same results as observed for J774.16 were obtained.
Coelho et al.
1474 iai.asm.org Infection and Immunity
on March 26, 2013 by A
LBE
RT
EIN
ST
EIN
CO
LL OF
ME
Dhttp://iai.asm
.org/D
ownloaded from

these images. LSC automates data acquisition but, more im-portantly, it allows for automated and quantitative data analy-sis (11, 33, 37). LSC was shown to be comparable to humancounting for measuring phagocytosis and provides significantadvantages that were exploited for the study of the relationship
of phagocytosis and cell cycle progression. LSC allowed the useof images to quantify DNA content, in other words, and thus tostudy the cell cycle in adherent cells and correlate it with intra-cellular processes (6, 22).
Previous results from our laboratory showed that Fc�R-medi-
FIG 7 AM proliferation in vivo. Macrophages in the bronchoalveolar space replicated both in steady state and in the context of intratracheal C. neoformansinfection. (A) Timeline of the experiment. PKH was administered to mice to label AM macrophages, 2 days before mice were infected with C. neoformans strain24067 intratracheally. Mock-infected mice (sterile PBS) and infected mice were administered EdU to label cells in S phase at day 4, and 6 h later the mice weresacrificed, and BAL was performed. (B) Representative image of AM replication recovered in a mock-infected mouse. (C) Representative images of BALrecovered cells from C. neoformans-infected mice. The first column displays cells from nonlabeled mouse. The following columns show cells from labeled mice.AM (PKH�) can incorporate EdU (arrows). Cells with macrophage morphology but PKH� can also incorporate EdU (open arrows). Note that one of themacrophages initiating replication has ingested C. neoformans (arrowheads) and adjacent positive cells, an observation suggestive of recently completed mitosis(*). See Table 1 for the frequency of events. Scale bars, 20 �m. The experiment was repeated three times with two to four mice per group, and representativeimages are shown.
In Vivo and In Vitro Macrophage Replication
April 2012 Volume 80 Number 4 iai.asm.org 1475
on March 26, 2013 by A
LBE
RT
EIN
ST
EIN
CO
LL OF
ME
Dhttp://iai.asm
.org/D
ownloaded from
ated ingestion of yeast cells was associated with increased cell cycleprogression (18, 20, 21). Both complement-mediated C. neofor-mans phagocytosis and ingestion of inert latex beads were effectiveat stimulating cell cycle progression (21). These effects could bereproduced using a model of frustrated phagocytosis mediated byFc�R (20), whereby continuous stimulation of receptors withoutparticle ingestion triggered cell cycle progression and allowed dis-section of signaling pathways involved in the proliferative re-sponse. It is known that macrophages can divide after C. neofor-mans ingestion and even divide after nonlytic exocytosis (3, 23),but there has been no study of how macrophage replication isaffected by C. neoformans ingestion. Later work showed that in-gestion of live yeast cells, but not latex beads, inhibited cyclin D1expression (18), producing an apparent paradox not resolved intheir work. Cyclin D1 is a major checkpoint in the transition fromG1 to S phase, and cyclin D1 expression is inhibited in response toLPS, triggering mitotic arrest (35). In addition, there is evidencethat the cell cycle phase influences macrophage behavior: cell cyclearrest in the G1 phase influences major histocompatibility com-plex class II expression (39) or prevents LPS-induced apoptosis(40).
In the present study, we revisited this problem using LSC. Ourexperiments confirmed cell cycle progression in both J774.16 cellsand primary macrophages using LSC. However, LSC providedadditional information on this phenomenon by establishing thatthe likelihood of the effect increased with increasing intracellularfungal burden. Furthermore, cell cycle progression was observedafter the ingestion of live and HK C. neoformans, demonstratingthat cell cycle progression does not require fungal viability but is aconsequence of Fc�R activation and subsequent phagocytosis(20). DNA content quantification and a pulse-labeling strategyrevealed a reduction in the number of cells that cycled back intothe G1 phase, suggesting that macrophage-like cells containing C.neoformans were less likely to complete mitosis or, in other words,were arrested at the G2/M phase of the cell cycle. Pulse-labelingexperiments could not be performed in primary cells due to longerreplication times, but when primary cells were treated with IFN-�,
which is known to produce cell cycle arrest in dividing cells, weobserved that phagocytosis was associated with an initial cell cycleprogression that proceeded to arrest in the G2/M phase. We con-jectured that cell division impairment could be a consequence offungal mediated host cell damage or a by-product of the mac-rophage’s attempt to degrade a high load of large foreign particles.It is known that the phagosome of macrophages becomes perme-abilized after C. neoformans infection (34), and it is conceivablethat the spill of phagosomal contents into the cytoplasm producesdamage that translates into cell cycle arrest. Consequently, we ex-plored several potential mechanisms of macrophage damage.Analysis of TUNEL staining and of membrane permeability inboth J774.16 and BMDM cells revealed that neither of these mech-anisms was likely responsible for cell cycle arrest. We consideredthe possibility that the mitotic defect was a consequence of a fun-gal product analogous to bacterial cyclomodulins (27), which areknown to provoke cell cycle arrest and alter DNA content or nu-clear morphology. However, we found no evidence of such aneffect in our experiments. In this regard, we note that taxol pre-vents mitosis by stabilizing cytoskeletal microtubules and that C.neoformans has been reported to interfere with host cell cytoskel-eton (7, 19). We conclude that despite C. neoformans phagocytosiscausing macrophages to progress in the cell cycle, the yeast cellsproduced toxic effects that had widespread effects in the host cellcycle, resulting in G2/M-phase arrest (the present study) and cy-clin D1 inhibition (18). Defining the mediator of the cell cycleinterference remains an outstanding question for future studies.
In the present study, we made the unexpected but relevantobservation was that IFN-�- and LPS-mediated cell cycle arrestcould be overcome by phagocytosis-derived cell cycle progression.Both IFN-� and LPS are known to arrest cell division in the pres-ence of macrophage– colony-stimulating factor (36, 40). This ob-servation raised the possibility that microbial ingestion and mac-rophage effector functions in vivo in conditions where IFN-� ismade do not necessarily lead to cell cycle arrest. Furthermore,macrophages might respond to infection in a way similar to othertypes of immune cells that undergo clonal expansion to generateadditional effector cells to fight infection. We note that an increasein the proliferative ability of AM was reported in humans follow-ing exposure to asbestos or in chronic inflammatory disorders (4,31) and in mice exposed to cigarette smoke (12).
To date, replication of AM in vivo has not been definitivelyestablished given the difficulties of distinguishing between resi-dent AM and the infiltrating inflammatory cells by standardmethods. A recently published study reported macrophage prolif-eration in response to infection in the peritoneal and pleural cav-ities after an inflammatory stimulus (15). These studies werequickly followed by reports of macrophage proliferation in otherexperimental models: zymosan-induced peritonitis (9) and auto-immune encephalitis (1). Given that C. neoformans establisheschronic pulmonary infection, we attempted to search for AM pro-liferation in a mouse model of cryptococcal pneumonia. Conse-quently, we developed a double-labeling strategy to investigate theproblem of AM replication in the presence or absence of C. neo-formans infection. Our labeling strategy took advantage of therelative specificity of PKH for AM and EdU for replicating cells(24, 28). Our results demonstrated synthesis of new DNA in AMin both infected and uninfected mice. Both the resident popula-tion and the newly arrived blood-derived macrophages incorpo-rated EdU and showed features of mitotic division. This observa-
TABLE 1 AM incorporation of EdU in vivo
Expt no.Mouseno.
No. of cellsa
TotalPKH�
(%) EdU� PKH� EdU�
Uninfectedmice
1 1 63 35 (55) 1 12 134 46 (34) 2 2
2 1 178 55 (30) 1 12 209 41 (30) 4 2
C. neoformans-infectedmice
1 1 4,730 205 (4) 16 12 2,787 663 (23) 8 2
2 1 875 191 (22) 13 22 1,896 181 (10) 13 13 3,539 751 (21) 15 24 2,817 574 (20) 18 2
a Analyzed cells correspond to 1/60 of the BAL-recovered cells. The Edu� PKH� cellsare of unknown origin.
Coelho et al.
1476 iai.asm.org Infection and Immunity
on March 26, 2013 by A
LBE
RT
EIN
ST
EIN
CO
LL OF
ME
Dhttp://iai.asm
.org/D
ownloaded from

tion provides an important confirmation of the findings of Jenkinset al. (15). Our results, albeit in a different model, suggest thatmacrophage proliferation occurs in the bronchoalveolar space af-ter C. neoformans infection, as reported in macrophages fromother tissues (1, 9, 15). Furthermore, we show that the residentAM population is capable of proliferation as part of normal tissuehomeostasis, meaning in the absence of any infection. We wereunable to demonstrate an increased rate of AM replication in vivoas a consequence of C. neoformans infection. One explanation forthe low rate of replication in vivo could be the impairment ofmitosis completion, meaning that what we observed in vitro for C.neoformans-containing macrophages also occurs in vivo. Hence, itis conceivable that the rate of lung macrophage proliferationwould be higher in other inflammatory conditions where there isno mitotic arrest, such as the presence of inert particles in thelungs (4, 31) or the inhalation of cigarette smoke (12). The prolif-eration of AM occurred at a low rate in the presence or absence ofinfection but is likely to make only a small contribution to inflam-matory cell numbers during pulmonary cryptococcosis. Our ob-servations can also be integrated with the recent report that uponresolution of lung infection newly recruited cells die by apoptosiswhile leaving PKH-labeled resident AM untouched (14). Inter-pretation of our data in conjunction with the aforementionedreports (1, 9, 15) suggests that resident macrophage numbers aresupported by both local proliferation and the infiltration of newcells. In the event of an injury or inflammation, the equilibriumbetween these processes is changed until a new equilibrium isestablished.
In summary, LSC confirmed that macrophage-like cells pro-gressed in cell cycle after phagocytosis, as reported earlier (21),and allowed us to explore this process in significantly greater de-tail. We now report that despite increased cell cycle progressionthere completion of mitosis is less efficient, possibly as a result ofphagocytosis-dependent toxicity after the ingestion of large mi-crobial particles. Furthermore, we observed that phagocytosis ofC. neoformans is sufficient to suppress IFN-� and LPS cell cyclearrest. Lastly, we established a protocol to study proliferation ofresident phagocytic cells in vivo that allowed us to demonstratethat resident AM are capable of proliferation, both as part of tissuehomeostasis and as part of the inflammatory process. These find-ings enhance our understanding of macrophage biology in thesetting of phagocytosis and C. neoformans infection.
ACKNOWLEDGMENTS
This study was supported by Ph.D. grant SFRH/BD/33471/2008 fromFundação Ciência e Tecnologia (C.C.), NIH awards 5R01HL059842,5R01AI033774, 5R37AI033142, and 5R01AI052733 (A.C.), and the Cen-ter for AIDS Research at Einstein.
We acknowledge the Analytical Imaging Facility and, in particular,Vera DesMarais and Peng Guo for their technical assistance.
REFERENCES1. Ajami B, Bennett JL, Krieger C, McNagny KM, Rossi FM. 2011. Infil-
trating monocytes trigger EAE progression, but do not contribute to theresident microglia pool. Nat. Neurosci. 14:1142–1149.
2. Alvarez M, Burn T, Luo Y, Pirofski LA, Casadevall A. 2009. Theoutcome of Cryptococcus neoformans intracellular pathogenesis in humanmonocytes. BMC Microbiol. 9:51.
3. Alvarez M, Casadevall A. 2006. Phagosome extrusion and host-cell sur-vival after Cryptococcus neoformans phagocytosis by macrophages. Curr.Biol. 16:2161–2165.
4. Bitterman PB, Saltzman LE, Adelberg S, Ferrans VJ, Crystal RG. 1984.
Alveolar macrophage replication: one mechanism for the expansion of themononuclear phagocyte population in the chronically inflamed lung. J.Clin. Invest. 74:460 – 469.
5. Casadevall A, et al. 1998. Characterization of a murine monoclonal an-tibody to Cryptococcus neoformans polysaccharide that is a candidate forhuman therapeutic studies. Antimicrob. Agents Chemother. 42:1437–1446.
6. Chakraborty AA, Tansey WP. 2009. Inference of cell cycle-dependentproteolysis by laser scanning cytometry. Exp. Cell Res. 315:1772–1778.
7. Chen SH, et al. 2003. Cryptococcus neoformans induces alterations in thecytoskeleton of human brain microvascular endothelial cells. J. Med. Mi-crobiol. 52:961–970.
8. Darzynkiewicz Z, Traganos F, Zhao H, Halicka HD, Li J. 2011. Cytom-etry of DNA replication and RNA synthesis: historical perspective andrecent advances based on “click chemistry.” Cytometry A 79:328 –337.
9. Davies LC, et al. 2011. A quantifiable proliferative burst of tissue macro-phages restores homeostatic macrophage populations after acute inflam-mation. Eur. J. Immunol. 41:2155–2164.
10. Feldmesser M, Kress Y, Novikoff P, Casadevall A. 2000. Cryptococcusneoformans is a facultative intracellular pathogen in murine pulmonaryinfection. Infect. Immun. 68:4225– 4237.
11. Henriksen M, Miller B, Newmark J, Al-Kofahi Y, Holden E. 2011. Laserscanning cytometry and its applications: a pioneering technology in thefield of quantitative imaging cytometry. Methods Cell Biol. 102:161–205.
12. Hornby SB, Kellington JP. 1990. DNA synthesis in alveolar macrophagesand other changes in lavaged cells following exposure of CBA/H mice tocigarette smoke. Environ. Health Perspect. 85:107–112.
13. Ieong MH, Reardon CC, Levitz SM, Kornfeld H. 2000. Human immu-nodeficiency virus type 1 infection of alveolar macrophages impairs theirinnate fungicidal activity. Am. J. Respir. Crit. Care Med. 162:966 –970.
14. Janssen WJ, et al. 2011. Fas determines differential fates of resident andrecruited macrophages during resolution of acute lung injury. Am. J. Re-spir. Crit. Care Med. 184:547–560.
15. Jenkins SJ, et al. 2011. Local macrophage proliferation, rather than re-cruitment from the blood, is a signature of TH2 inflammation. Science332:1284 –1288.
16. Kamentsky L. 2001. Laser scanning cytometry. Methods Cell Biol.63:51– 87.
17. Kechichian TB, Shea J, Del Poeta M. 2007. Depletion of alveolar mac-rophages decreases the dissemination of a glucosylceramide-deficient mu-tant of Cryptococcus neoformans in immunodeficient mice. Infect. Immun.75:4792– 4798.
18. Luo Y, Casadevall A. 2010. Intracellular cryptococci suppress Fc-mediated cyclin D1 elevation. Commun. Integr. Biol. 3:390 –391.
19. Luo Y, Isaac BM, Casadevall A, Cox D. 2009. Phagocytosis inhibitsF-actin-enriched membrane protrusions stimulated by fractalkine(CX3CL1) and colony-stimulating factor 1. Infect. Immun. 77:4487–4495.
20. Luo Y, Pollard JW, Casadevall A. 2010. Fc� receptor cross-linking stim-ulates cell proliferation of macrophages via the ERK pathway. J. Biol.Chem. 285:4232– 4242.
21. Luo Y, Tucker SC, Casadevall A. 2005. Fc- and complement-receptoractivation stimulates cell cycle progression of macrophage cells from G1 toS. J. Immunol. 174:7226 –7233.
22. Luther E, Kamentsky LA. 1996. Resolution of mitotic cells using laserscanning cytometry. Cytometry 23:272–278.
23. Ma H, Croudace JE, Lammas DA, May RC. 2006. Expulsion of livepathogenic yeast by macrophages. Curr. Biol. 16:2156 –2160.
24. Maus U, et al. 2001. Monocytes recruited into the alveolar air space ofmice show a monocytic phenotype but upregulate CD14. Am. J. Physiol.Lung Cell. Mol. Physiol. 280:L58 –L68.
25. Mosser DM, Edwards JP. 2008. Exploring the full spectrum of macro-phage activation. Nat. Rev. Immunol. 8:958 –969.
26. Murphy J, Summer R, Wilson AA, Kotton DN, Fine A. 2008. Theprolonged life-span of alveolar macrophages. Am. J. Respir. Cell Mol. Biol.38:380 –385.
27. Nougayrede JP, Taieb F, De Rycke J, Oswald E. 2005. Cyclomodulins:bacterial effectors that modulate the eukaryotic cell cycle. Trends Micro-biol. 13:103–110.
28. Osterholzer JJ, et al. 2011. Chemokine receptor 2-mediated accumula-tion of fungicidal exudate macrophages in mice that clear cryptococcallung infection. Am. J. Pathol. 178:198 –211.
29. Osterholzer JJ, et al. 2009. Role of dendritic cells and alveolar macro-
In Vivo and In Vitro Macrophage Replication
April 2012 Volume 80 Number 4 iai.asm.org 1477
on March 26, 2013 by A
LBE
RT
EIN
ST
EIN
CO
LL OF
ME
Dhttp://iai.asm
.org/D
ownloaded from
phages in regulating early host defense against pulmonary infection withCryptococcus neoformans. Infect. Immun. 77:3749 –3758.
30. Spector WG, Wynne KM. 1976. Proliferation of macrophages in inflam-mation. Agents Actions 6:123–126.
31. Spurzem JR, Saltini C, Rom W, Winchester RJ, Crystal RG. 1987.Mechanisms of macrophage accumulation in the lungs of asbestos-exposed subjects. Am. Rev. Respir. Dis. 136:276 –280.
32. Tarling JD, Lin HS, Hsu S. 1987. Self-renewal of pulmonary alveolarmacrophages: evidence from radiation chimera studies. J. Leukoc. Biol.42:443– 446.
33. Telford WG, Komoriya A, Packard BZ. 2002. Detection of localizedcaspase activity in early apoptotic cells by laser scanning cytometry. Cy-tometry 47:81– 88.
34. Tucker SC, Casadevall A. 2002. Replication of Cryptococcus neoformansin macrophages is accompanied by phagosomal permeabilization and ac-cumulation of vesicles containing polysaccharide in the cytoplasm. Proc.Natl. Acad. Sci. U. S. A. 99:3165–3170.
35. Vadiveloo PK. 1999. Macrophages: proliferation, activation, and cell cycleproteins. J. Leukoc. Biol. 66:579 –582.
36. Vadiveloo PK, Keramidaris E, Morrison WA, Stewart AG. 2001. Li-
popolysaccharide-induced cell cycle arrest in macrophages occurs inde-pendently of nitric oxide synthase II induction. Biochim. Biophys. Acta1539:140 –146.
37. Wojcik E, Saraga S, Jin J, Hendricks J. 2001. Application of laser scan-ning cytometry for evaluation of DNA ploidy in routine cytologic speci-mens. Diagn. Cytopathol. 24:200 –205.
38. Xaus J, et al. 1999. Interferon gamma induces the expression of p21waf-1
and arrests macrophage cell cycle, preventing induction of apoptosis. Im-munity 11:103–113.
39. Xaus J, et al. 2000. The expression of MHC class II genes in macrophagesis cell cycle dependent. J. Immunol. 165:6364 – 6371.
40. Xaus J, et al. 2000. LPS induces apoptosis in macrophages mostly throughthe autocrine production of TNF-�. Blood 95:3823–3831.
41. Zaragoza O, Alvarez M, Telzak A, Rivera J, Casadevall A. 2007. Therelative susceptibility of mouse strains to pulmonary Cryptococcus neofor-mans infection is associated with pleiotropic differences in the immuneresponse. Infect. Immun. 75:2729 –2739.
42. Zbigniew D, Holden E, Orfao A, Telford W, Wlodkowic D (ed). 2011.Recent advances in cytometry. A. Instrumentation and methods, 5th ed,vol 102. Academic Press, London, United Kingdom.
Coelho et al.
1478 iai.asm.org Infection and Immunity
on March 26, 2013 by A
LBE
RT
EIN
ST
EIN
CO
LL OF
ME
Dhttp://iai.asm
.org/D
ownloaded from


![Cell cycle-coupled [Ca oscillations in mouse zygotes and ... · Cell cycle-coupled [Ca2+] i oscillations in mouse zygotes and function of the inositol 1,4,5-trisphosphate receptor-1](https://img.dokumen.tips/doc/110x75/5fb285c478c1117d6b731391/cell-cycle-coupled-ca-oscillations-in-mouse-zygotes-and-cell-cycle-coupled.jpg)