Embed Size (px)
Citation preview

Engineering Structures 72 (2014) 152–159
Contents lists available at ScienceDirect
Engineering Structures
journal homepage: www.elsevier .com/locate /engstruct
Analysis of bond stress distribution for prestressing strand by StandardTest for Strand Bond
http://dx.doi.org/10.1016/j.engstruct.2014.04.0400141-0296/� 2014 Elsevier Ltd. All rights reserved.
⇑ Corresponding author. Tel.: +1 479 575 6348.E-mail address: [email protected] (W. Micah Hale).
https://freepaper.me/t/366571 خودت ترجمه کن :
Canh N. Dang a, Cameron D. Murray a, Royce W. Floyd b, W. Micah Hale a,⇑, J.R. Martí-Vargas c
a University of Arkansas, Department of Civil Engineering, 4190 Bell Engineering Center, Fayetteville, AR 72701, USAb University of Oklahoma, School of Civil Engineering and Environmental Science, 202 W. Boyd St., Norman, OK 73019, USAc Institute of Concrete Science and Technology (ICITECH), Universitat Politècnica de València, 4G, Camino de Vera s/n, 46022 Valencia, Spain
a r t i c l e i n f o
Article history:Received 18 February 2014Revised 22 April 2014Accepted 22 April 2014Available online 13 May 2014
Keywords:Stress–slip relationshipBond stress distributionStrand bondPrestressed concrete
a b s t r a c t
Strand bond is the unique interaction between prestressing strand and adjacent concrete, and directlyaffects the performance of the strand in the anchor region. However, strand bond depends upon numer-ous factors, such as concrete properties and strand surface condition. The Standard Test for Strand Bond(STSB) has been developed to assess the bonding capacity of prestressing strands. Test data are used topropose a bond stress–slip model and investigate the bond stress distribution. The study outcomes areverified by STSB of 0.6 in. (15.2 mm) and 0.7 in. (17.8 mm) strand conducted at the University of Arkansasand collected in the literature. Experimental and analytical results show that the proposed model canpredict bond stress versus slippage of prestressing strand within a 2% error. The results also show thatthe bond stress distribution along the embedment length is not linear or uniform as was assumed by pre-vious researchers.
� 2014 Elsevier Ltd. All rights reserved.
1. Introduction
Strand bond can be defined as the shearing stress at the inter-face between prestressing strand and the surrounding concrete.The bond guarantees the transferring of prestress force from thestrand to the concrete. The bond ensures that the prestressingstrand and concrete can work as a composite material under exter-nal loading. When tension stress occurs in the strand, it tends tomove in the same direction with applied force. The relative strandmovement is prevented by the bond between the two materials. Ifthe bond is inadequate to prevent the movement, a bond failurewill occur because of excessive slippage of the prestressing strand.Research conducted by Janney [1] showed that the three mecha-nisms of bond between the prestressing strand and concrete areadhesion, Hoyer’s effect, and mechanical interlock. Adhesion is achemical mechanism between the strands and concrete. Oncestrand slip occurs, adhesion no longer contributes to bond. Hoyer’seffect is the lateral expansion due to tensioning and detensioningof the prestressing strands. Mechanical interlock is the resistanceprovided between the helical shaped prestressing strands and theconcrete.
Many pull-out tests have been developed to assess strand bond.The Moustafa Pull-out Test [2] was the earliest test; in this test,strands were pulled from a large concrete block. It was developedto quantify the bond capacity for lifting loops. Another strand bondtest is the Post Tensioning Institute (PTI) Bond Test [3]. In this test,a single strand is pulled from neat cement mortar. This test wasdeveloped to investigate the bond performance of strands usedas rock anchors. Another test, the North American Strand Produc-ers (NASP) Bond Test [4], was derived from PTI Bond Test. TheNASP Bond Test used mortar in order to reduce shrinkage andincrease dimensional stability when compared to the neat cementmortar used in the PTI Bond Test. The NASP Bond Test was modi-fied through four rounds of testing [4–7]. Data from these roundsshowed that the NASP Bond Test was a reproducible, repeatabletest for assessing and qualifying the bond properties of prestress-ing strand. The contemporary version of the NASP Bond Testmethod is known as the Standard Test for Strand Bond (STSB).The STSB has been adopted by American Society for Testing andMaterials (ASTM) and is known as the Standard Test Method forEvaluating Bond of Seven-Wire Steel Prestressing Strand [8]. TheSTSB was developed to evaluate the surface condition of prestress-ing strands. The STSB measures the pull-out force at the bottom ofthe prestressing strand corresponding to a slip of 0.1 in. (2.5 mm)at the top of the strand. The average value of a set of six strandspecimens is considered the STSB value. This value is used to vali-date bond quality of the strand. During STSB testing, researchers

Nomenclature
a exponential factor of bond stress–slip modeldb nominal strand diameterfs tensile stress of prestressing strandf 0c compressive strength of mortar at 1-dayfc compressive stress of mortark a constant of nonlinear ordinary deferential equationu(x) bond stress at location xu01 average bond stress at a slip of 0.1 in. (2.5 mm)u001 average bond stress at a slip of 0.01 in. (0.25 mm)u bond stress along the embedded lengths(x) strand slip at location xs01 slip corresponding with the STSB value, 0.1 in. (2.5 mm)s001 the first recorded slip during conducting STSB, 0.01 in.
(0.25 mm)
s slip along the embedded lengthx coordinateAc area of mortarAs cross-sectional area of strandCs perimeter of strandEc modulus of elasticity of mortarEs modulus of elasticity of strandL embedded length of STSB, 16 in. (410 mm)P01 pull-out force corresponding with a slip of 0.1 in.
(2.5 mm)P001 pull-out force corresponding with a slip of 0.01 in.
(0.25 mm)P pull-out force corresponding with a slip of s
C.N. Dang et al. / Engineering Structures 72 (2014) 152–159 153
may also measure the pull-out force at a slip of 0.01 in. (0.25 mm)[6,7,9,10]. This value is regarded as the first slip of the prestressingstrand. However, the ratios of pull-out forces and slips are not pro-portional. In other words, the average bond stresses calculatedfrom these forces are not linearly proportional with the measuredslips.
The bond stress–slip model is a nonlinear curve that is used tocalculate bond stress from a given slip. In concrete structures, mea-suring reinforcement slip is easier than measuring the bond stress.The slip is determined by measuring the movement of the rein-forcement or strands at the ends of prestressed beams or girders.Bond stresses act at the interface of the reinforcement and the con-crete, which makes direct measurement of bond stress compli-cated. However, the bond stress can be computed using themeasured slip and the bond stress–slip model. For non-prestressedreinforcement, the bond stress–slip model has been well estab-lished and is provided in the fib Model Code for Concrete Struc-tures 2010 [11]. For prestressing strands, a bond stress–slipmodel is not well established. This is due to the smooth surfaceof the prestressing strands and the complex interaction of thenumerous factors influencing the bond stress such Hoyer’s effectand mechanical interlock. However, there are limited experimentalstudies that investigated the bond stress–slip model of prestress-ing strand [12].
Bond distribution shows the variation of bond stress along anembedded length of prestressing strand. Quantifying the bond dis-tribution is critical to make a precise estimation of the transferlength in prestressed concrete. Bond stresses along the transferlength at the interface strand and concrete are not uniform. Like-wise, the tensile stress in the prestressing strand along the transferlength is not uniform either. The change of strand stress is propor-tional with the bond stress. Research conducted by Den Uijl [13]showed that the bond stress nonlinearly decreased within thetransfer zone of prestressed beams. In particular, the bond stressachieves its maximum value near the free-end of the beam. Thisis due to lateral expansion or Hoyer’s effect of the prestressingstrand as it is being released. The stress gradually decreases atthroughout the transfer zone. However, the distribution of bondstress is assumed linear to simplify computations. The linearassumption was used to establish the transfer length equationfound in the ACI 318 Building Code and Commentary [14]. In thisequation, the bond stress was assumed to be a constant alongthe length with a nominal value of 400 psi (2.76 MPa) [15]. Also,the prestressing strand stress is assumed to linearly increase fromzero to the effective stress within transfer length.
The bond between the prestressing strand and adjacent con-crete plays a critical role in the behavior of prestressed concrete
https://freepaper.me/t/36657
members. However, direct measurement of the bond is compli-cated. The quantification of bond at a specific location dependson the measured slip and bond stress–slip model. The distributionof bond along the prestressing strand constitutes the accuracy ofthe transfer length estimation. Accordingly, this research developsa bond stress–slip model for 0.6 in. (15.2 mm) and 0.7 in.(17.8 mm) strands from STSB. Also presented in the paper is ananalytical analysis to verify the distribution of bond stress alongthe prestressing strands in STSB. The proposed bond stress–slipmodel can accurately predict the performance of prestressingstrands in the STSB. Likewise, the STSB results have been shownto adequately assess the bonding capacity of prestressing strands.Therefore, the proposed model can be implemented for prestress-ing strands by incorporating a coefficient which calibrates the dif-ferent behaviors of tensioned strands and non-tensioned strands[16]. The use of bond stress–slip model to estimate the transferlength and validate the assumption ACI 318 equation is discussedin detail in the upcoming paper.
2. Experimental investigation
2.1. Material
Grade 270, low relaxation, 0.6 in. (15.2 mm) and 0.7 in.(17.8 mm) strands were used in this study. The properties of thesestrands are conformed to ASTM A416 [17]. Eighteen specimens of0.6 in. (15.2 mm) strand were cut from the prestressing strandcoils [9,18]. All specimens were stored inside Engineering ResearchCenter of the University of Arkansas (UARK) in order to preventsurface damages from weathering impacts or other environmenteffects. The strands were not cleaned or prepared in any waybefore performing the STSB. The rest STSB data, eighteen speci-mens of 0.6 in. (15.2 mm) and twelve specimens of 0.7 in.(17.8 mm), were collected from previous study [10].
2.2. STSB
The STSB, ASTM A1081, was used to investigate the bondingcapacity of the prestressing strands [8]. The STSB is a standard testwhich provides repeatable, reproducible, and reliable estimates ofthe bond capacity of prestressing strand [7]. A STSB specimen con-sisted of a 1/2 in. (12.5 mm) thick, 18 in. (450 mm) long, 5 in.(125 mm) diameter steel tube and a 1/2 in. (12.5 mm) thick, 6 in.(150 mm) by 6 in. (150 mm) steel plate. An 11/16 in. (17.2 mm)hole was placed in the plate for tests of 0.6 in. (15.2 mm) strand.The plate was welded to one end of the tube to seal the tube formortar placement and to provide a flat surface for loading. The
1 خودت ترجمه کن :
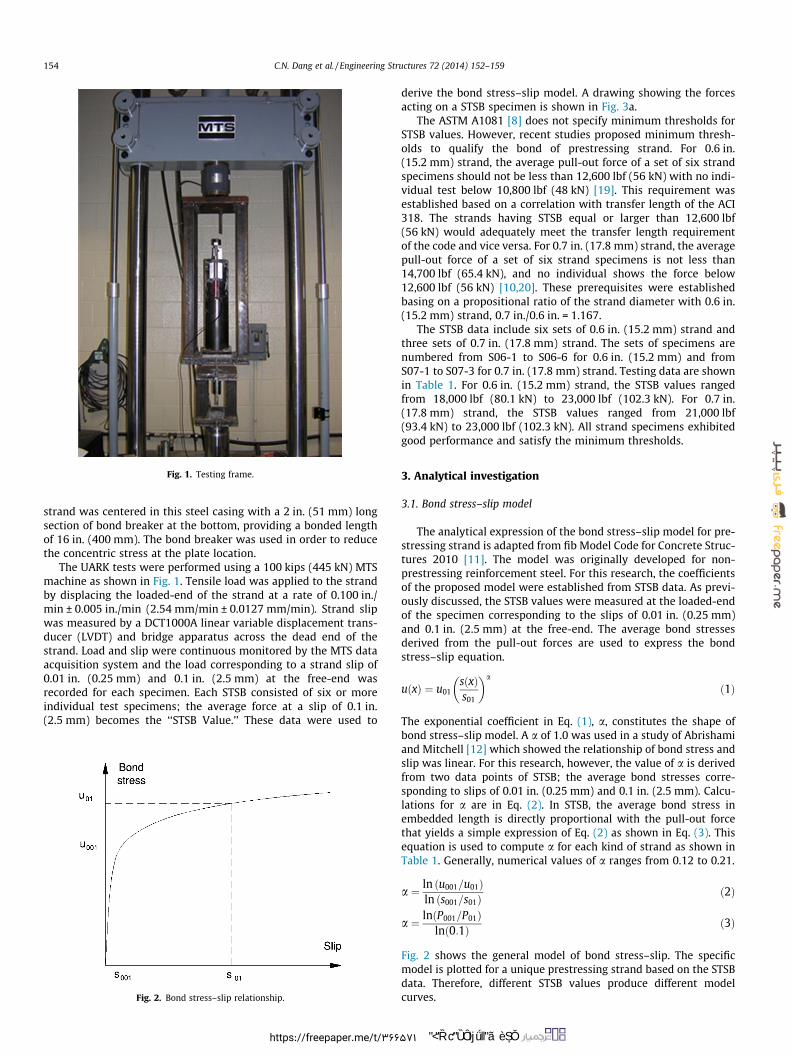
Fig. 1. Testing frame.
154 C.N. Dang et al. / Engineering Structures 72 (2014) 152–159
strand was centered in this steel casing with a 2 in. (51 mm) longsection of bond breaker at the bottom, providing a bonded lengthof 16 in. (400 mm). The bond breaker was used in order to reducethe concentric stress at the plate location.
The UARK tests were performed using a 100 kips (445 kN) MTSmachine as shown in Fig. 1. Tensile load was applied to the strandby displacing the loaded-end of the strand at a rate of 0.100 in./min ± 0.005 in./min (2.54 mm/min ± 0.0127 mm/min). Strand slipwas measured by a DCT1000A linear variable displacement trans-ducer (LVDT) and bridge apparatus across the dead end of thestrand. Load and slip were continuous monitored by the MTS dataacquisition system and the load corresponding to a strand slip of0.01 in. (0.25 mm) and 0.1 in. (2.5 mm) at the free-end wasrecorded for each specimen. Each STSB consisted of six or moreindividual test specimens; the average force at a slip of 0.1 in.(2.5 mm) becomes the ‘‘STSB Value.’’ These data were used to
Fig. 2. Bond stress–slip relationship.
https://freepaper.me/t/366
derive the bond stress–slip model. A drawing showing the forcesacting on a STSB specimen is shown in Fig. 3a.
The ASTM A1081 [8] does not specify minimum thresholds forSTSB values. However, recent studies proposed minimum thresh-olds to qualify the bond of prestressing strand. For 0.6 in.(15.2 mm) strand, the average pull-out force of a set of six strandspecimens should not be less than 12,600 lbf (56 kN) with no indi-vidual test below 10,800 lbf (48 kN) [19]. This requirement wasestablished based on a correlation with transfer length of the ACI318. The strands having STSB equal or larger than 12,600 lbf(56 kN) would adequately meet the transfer length requirementof the code and vice versa. For 0.7 in. (17.8 mm) strand, the averagepull-out force of a set of six strand specimens is not less than14,700 lbf (65.4 kN), and no individual shows the force below12,600 lbf (56 kN) [10,20]. These prerequisites were establishedbasing on a propositional ratio of the strand diameter with 0.6 in.(15.2 mm) strand, 0.7 in./0.6 in. = 1.167.
The STSB data include six sets of 0.6 in. (15.2 mm) strand andthree sets of 0.7 in. (17.8 mm) strand. The sets of specimens arenumbered from S06-1 to S06-6 for 0.6 in. (15.2 mm) and fromS07-1 to S07-3 for 0.7 in. (17.8 mm) strand. Testing data are shownin Table 1. For 0.6 in. (15.2 mm) strand, the STSB values rangedfrom 18,000 lbf (80.1 kN) to 23,000 lbf (102.3 kN). For 0.7 in.(17.8 mm) strand, the STSB values ranged from 21,000 lbf(93.4 kN) to 23,000 lbf (102.3 kN). All strand specimens exhibitedgood performance and satisfy the minimum thresholds.
3. Analytical investigation
3.1. Bond stress–slip model
The analytical expression of the bond stress–slip model for pre-stressing strand is adapted from fib Model Code for Concrete Struc-tures 2010 [11]. The model was originally developed for non-prestressing reinforcement steel. For this research, the coefficientsof the proposed model were established from STSB data. As previ-ously discussed, the STSB values were measured at the loaded-endof the specimen corresponding to the slips of 0.01 in. (0.25 mm)and 0.1 in. (2.5 mm) at the free-end. The average bond stressesderived from the pull-out forces are used to express the bondstress–slip equation.
uðxÞ ¼ u01sðxÞs01
� �a
ð1Þ
The exponential coefficient in Eq. (1), a, constitutes the shape ofbond stress–slip model. A a of 1.0 was used in a study of Abrishamiand Mitchell [12] which showed the relationship of bond stress andslip was linear. For this research, however, the value of a is derivedfrom two data points of STSB; the average bond stresses corre-sponding to slips of 0.01 in. (0.25 mm) and 0.1 in. (2.5 mm). Calcu-lations for a are in Eq. (2). In STSB, the average bond stress inembedded length is directly proportional with the pull-out forcethat yields a simple expression of Eq. (2) as shown in Eq. (3). Thisequation is used to compute a for each kind of strand as shown inTable 1. Generally, numerical values of a ranges from 0.12 to 0.21.
a ¼ ln u001=u01ð Þln s001=s01ð Þ ð2Þ
a ¼ lnðP001=P01Þlnð0:1Þ ð3Þ
Fig. 2 shows the general model of bond stress–slip. The specificmodel is plotted for a unique prestressing strand based on the STSBdata. Therefore, different STSB values produce different modelcurves.
571 خودت ترجمه کن :
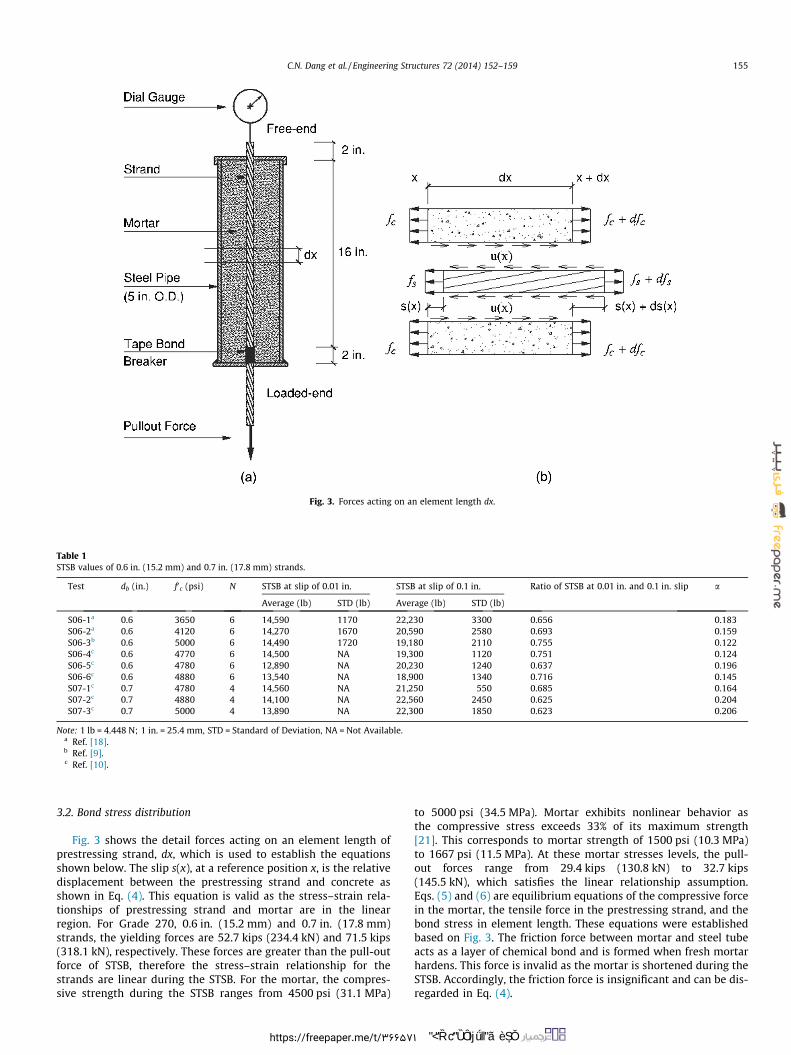
Fig. 3. Forces acting on an element length dx.
Table 1STSB values of 0.6 in. (15.2 mm) and 0.7 in. (17.8 mm) strands.
Test db (in.) f0c (psi) N STSB at slip of 0.01 in. STSB at slip of 0.1 in. Ratio of STSB at 0.01 in. and 0.1 in. slip a
Average (lb) STD (lb) Average (lb) STD (lb)
S06-1a 0.6 3650 6 14,590 1170 22,230 3300 0.656 0.183S06-2a 0.6 4120 6 14,270 1670 20,590 2580 0.693 0.159S06-3b 0.6 5000 6 14,490 1720 19,180 2110 0.755 0.122S06-4c 0.6 4770 6 14,500 NA 19,300 1120 0.751 0.124S06-5c 0.6 4780 6 12,890 NA 20,230 1240 0.637 0.196S06-6c 0.6 4880 6 13,540 NA 18,900 1340 0.716 0.145S07-1c 0.7 4780 4 14,560 NA 21,250 550 0.685 0.164S07-2c 0.7 4880 4 14,100 NA 22,560 2450 0.625 0.204S07-3c 0.7 5000 4 13,890 NA 22,300 1850 0.623 0.206
Note: 1 lb = 4.448 N; 1 in. = 25.4 mm, STD = Standard of Deviation, NA = Not Available.a Ref. [18].b Ref. [9].c Ref. [10].
C.N. Dang et al. / Engineering Structures 72 (2014) 152–159 155
3.2. Bond stress distribution
Fig. 3 shows the detail forces acting on an element length ofprestressing strand, dx, which is used to establish the equationsshown below. The slip s(x), at a reference position x, is the relativedisplacement between the prestressing strand and concrete asshown in Eq. (4). This equation is valid as the stress–strain rela-tionships of prestressing strand and mortar are in the linearregion. For Grade 270, 0.6 in. (15.2 mm) and 0.7 in. (17.8 mm)strands, the yielding forces are 52.7 kips (234.4 kN) and 71.5 kips(318.1 kN), respectively. These forces are greater than the pull-outforce of STSB, therefore the stress–strain relationship for thestrands are linear during the STSB. For the mortar, the compres-sive strength during the STSB ranges from 4500 psi (31.1 MPa)
https://freepaper.me/t/36657
to 5000 psi (34.5 MPa). Mortar exhibits nonlinear behavior asthe compressive stress exceeds 33% of its maximum strength[21]. This corresponds to mortar strength of 1500 psi (10.3 MPa)to 1667 psi (11.5 MPa). At these mortar stresses levels, the pull-out forces range from 29.4 kips (130.8 kN) to 32.7 kips(145.5 kN), which satisfies the linear relationship assumption.Eqs. (5) and (6) are equilibrium equations of the compressive forcein the mortar, the tensile force in the prestressing strand, and thebond stress in element length. These equations were establishedbased on Fig. 3. The friction force between mortar and steel tubeacts as a layer of chemical bond and is formed when fresh mortarhardens. This force is invalid as the mortar is shortened during theSTSB. Accordingly, the friction force is insignificant and can be dis-regarded in Eq. (4).
1 خودت ترجمه کن :

156 C.N. Dang et al. / Engineering Structures 72 (2014) 152–159
dsðxÞdx¼ dfs
Es� dfc
Ecð4Þ
uðxÞCsdxþ Acdfc ¼ 0 ð5Þ� uðxÞCsdxþ Asdfs ¼ 0 ð6Þ
Eq. (7) is obtained by differentiating Eq. (4) after substitutingEqs. (5) and (6). This equation shows the relationship of slip andbond stress at position x. As previously mentioned, the bond stressis a function of the slip, so Eq. (8) can be easily attained by substi-tuting Eq. (1) into Eq. (7), and it is simplified by separating into twoequations. Eq. (9) is the nonlinear second ordinary differentialequation for the slip along the embedded length, with a constantk as shown in Eq. (10).
d2sðxÞdx2 ¼ Cs
EsAsþ Cs
EcAc
� �uðxÞ ð7Þ
d2sðxÞdx2 �
Cs
EsAsþ Cs
EcAc
� �u01
sa01
� �saðxÞ ¼ 0 ð8Þ
d2sðxÞdx2 � ksaðxÞ ¼ 0 ð9Þ
k ¼ Cs
EsAsþ Cs
EcAc
� �u01
sa01
� �ð10Þ
The boundary conditions of Eq. (9) are determined based on theSTSB procedures. In the STSB, a pull-out force is the force at theloaded-end of the prestressing strand that corresponds to a slipof 0.1 in. (2.5 mm) at the free-end of the strand. Therefore, the firstboundary condition is the measured slip of 0.1 in. (2.5 mm). Thesecond boundary condition is derived from Eq. (1) at the loaded-end of the specimen. It is the compressive stress in the mortarand the tensile stress in prestressing strand at the pull-out forceP01. In mathematical terminology, they are referred as Dirichletand Neumann boundary conditions [22], respectively. The analyti-cal forms of boundary conditions are shown in the followingequation:
sð0Þ ¼ s01
s0ðLÞ ¼ P01EsAs� P01
EcAc
(ð11Þ
Eq. (9) is a nonlinear second ordinary differential equation withmixed boundary conditions, Dirichlet and Neumann, as shown inEq. (11). This is a highly complicated equation and determininganalytical solution is complicated. Therefore, a numerical methodis used in this study to determine a solution instead of the analyt-ical method. In particular, a combination of ‘‘Block Method’’ andModified Euler method, which was proposed by Majid et al. [22],was applied to determine an approximate solution. In order toincrease the solution’s accuracy, the Runge–Kutta method wasused instead of the Modified Euler, and iterative steps divided veryfine at 1/500. The detail procedures of determining the solutionsare shown in Appendix A.
The bond stress–slip model and bond stress distribution areanalyzed from STSB data by following steps:
� Step 1: calculate average bond stresses u001 and u01 from pull-out forces corresponding with the slips of 0.01 in. (0.25 mm)and 0.1 in. (2.5 mm), respectively.� Step 2: compute a in Eq. (1) by using Eq. (3) to determine the
bond stress–slip model.� Step 3: solve Eq. (9) to determine the slip of prestressing strand
along the embedded length.� Step 4: combine the solution of step Eq. (3) and Eq. (1) to inves-
tigate the bond stress distribution.� Step 5: compute analytical pull-out forces basing on the deter-
mined bond stress distribution in step 4 by using Eq. (6).
https://freepaper.me/t/366
� Step 6: verify the percentage error between the analytical exper-imental pull-out forces.
4. Experimental results and discussion
The slips along the embedded length of 0.6 in. (15.2 mm) and0.7 in. (17.8 mm) strands are shown as nonlinear curves inFigs. 4a and 5a, respectively. In the STSB, the embedded length ofprestressing strand in mortar is 18 in. (460 mm). However, the last2.0 in. (51 mm) is covered by the bond breaker to reduce the stressconcentration on the base plate, and the bond stress is neglected inthis region. Therefore, the actual embedded length is 16 in.(406 mm). As shown in these figures, slip gradually increased fromthe free-end toward the loaded-end. At the free-end, the slip isidentical to the measured slip by STSB of 0.1 in. (2.5 mm). At theloaded-end, the slip is varied depending on the pull-out force.The measured slip increased as the pull-out force increased. Thisrelationship is expressed in Eq. (4) which shows that the slipdepends on the elongation of prestressing strand that is linearlyproportional with the pull-out force. Generally, 0.6 in. (15.2 mm)and 0.7 in. (17.8 mm) strands exhibit a similar slip curve due toboth kinds of strands are Grade 270, seven-wire, and lowrelaxation.
Figs. 4b and 5b show that bond stress distribution is not uni-form along the embedded length. This is due to the variation ofthe slip and the nonlinear relationship between bond stress andslip. Along the embedded length, the slip varies as was previouslymentioned. At a particular point, the bond stress is derived fromthe slip by using Eq. (1). In the STSB, the minimum bond stress isat the free-end of prestressing strand, and the maximum bondstress is at loaded-end. Otherwise, improved estimates of anchorlength are achieved with a nonlinear bond stress distributioninstead of a linear distribution is assumed from the free-end tothe loaded end.
The pull-out force and prestressing strand stress are computedby integrating the bond stress on the embedded length using Eq.(6) as shown in Figs. 4c–d and 5c–d. These parameters are nonlin-ear along the embedded length, and their accuracy primarilydepends on the bond stress distribution. In this study, the steelstress is approximately 100 ksi (690 MPa) which is certainly belowthe yielding stress of Grade 270 strand. The pull-out forces arealmost identical to the experimental values as shown in Table 2.In particular, the pull-out forces corresponding with a slip of0.01 in. (0.25 mm) are identical with measured values in STSB.The pull-out forces corresponding with a slip of 0.1 in. (2.5 mm)are within 2% error of the measured values.
As expected, the bond stress–slip relationship varied with dif-ferent strand specimens depending on the STSB values which isshown in Fig. 6. This figure also shows the regions (labeled inves-tigating regions) where the analytical pull-out force correspondingwith slips of 0.01 in. (0.25 mm) and 0.1 in. (2.5 mm) was com-puted. The region begins with the slip at the free-end and endswith the slip at the loaded-end. For a particular STSB specimen,two investigating regions are plotted on the bond stress–slip curve.The first region presented slip along the prestressing strand as theslip at free-end of 0.01 in. (0.25 mm). As shown in the figure, thisregion exactly matched with the bond stress–slip curve. Therefore,the analytical pull-out force calculated by Step 5 is nearly identicalwith the measured pull-out force. The second region was similar tothe first region. It showed slip along the prestressing strand, butthis region corresponded to the slip at free-end of 0.1 in.(2.5 mm). The second region well matched with the bond stress–slip curve. Hence, the analytical pull-out force calculated by Step5 is nearly identical with the measured pull-out force with an errorof 2% as shown in Table 2.
571 خودت ترجمه کن :

2.54 3.05 3.56Slip, mm
3.45 3.79 4.14Bond stress, MPa
0 517 1034Steel stress, MPa
0 44 89 133Pull-out Force, kN
0
4
0
102
0
4
0
102
0
4
0
102
0
4
0
102
8
12E
203
305
8
12
203
305
8
12
203
305
8
12
203
305
E
0.1 0.12 0.1416
Slip, in.
Embe
dded
lenn
gth,
in.
406500 550 600
16
Bond stress, psi
4060 75 150
16
Steel stress, ksi
4060 10 20 30
16
Pull-out Force, kip
406
Embe
dded
lenn
gth,
mm
(a)S06-2
(b)S06-2
(c)S06-2
(d)S06-2
Embe
dded
lenn
gth,
in.
Embe
dded
lenn
gth,
in.
Embe
dded
lenn
gth,
in.
Embe
dded
lenn
gth,
mm
Embe
dded
lenn
gth,
mm
Embe
dded
lenn
gth,
mm
S06-1 S06-1 S06-1 S06-1
Fig. 4. The slip, bond stress, steel stress, and pull-out force along the embedded length of S06-1 and S06-2 specimens by analytical method.
0 2.54 3.560
3.05Slip, mm
0 3.1 3.45 3.790
Bond stress, MPa
0 0 345 6900
Steel stress, MPa
0 0 44 89 1330
Pull-out Force, kN
4 102 4 102 4 102 4 102
8
12
Embe
dded
leng
th, i
n.
203
305
8
12
203
305
8
12
203
305
8
12
203
305
0.1 0.12 0.1416
Slip, in.
406450 500 550
16
Bond stress, psi
4060 50 100
16
Steel stress, ksi
S07-1
4060 10 20 30
16
Pull-out Force, kip
406
(a)S07-2
(b)
S07-1S07-2
(c)S07-2
(d)S07-2
Embe
dded
leng
th, i
n.
Embe
dded
leng
th, i
n.
Embe
dded
leng
th, i
n.
Embe
dded
leng
th, m
m
Embe
dded
leng
th, m
m
Embe
dded
leng
th, m
m
S07-1S07-1
Embe
dded
leng
th, m
m
Fig. 5. The slip, bond stress, steel stress, and pull-out force along the embedded length of S07-1 and S07-2 specimens by analytical method.
Table 2Comparison of experimental and analytical STSB values of 0.6 in. (15.2 mm) and 0.7 in. (17.8 mm) strands.
Test STSB at slip of 0.01 in. STSB at slip of 0.1 in.
Experimental (lb) Analytical (lb) Percent error Experimental (lb) Analytical (lb) Percent error
S06-1 14,590 14,600 0.0 22,230 22,630 1.8S06-2 14,270 14,260 0.0 20,590 20,900 1.5S06-3 14,490 14,480 0.0 19,180 19,390 1.1S06-4 14,500 14,490 0.0 19,300 19,520 1.1S06-5 12,890 12,890 0.0 20,230 20,590 1.7S06-6 13,540 13,540 0.0 18,900 19,140 1.3S07-1 14,560 14,550 0.0 21,250 21,510 1.2S07-2 14,100 14,100 0.0 22,560 22,920 1.6S07-3 13,890 13,890 0.0 22,300 22,650 1.6
Note: 1 lb = 4.448 N; 1 in. = 25.4 mm.
C.N. Dang et al. / Engineering Structures 72 (2014) 152–159 157
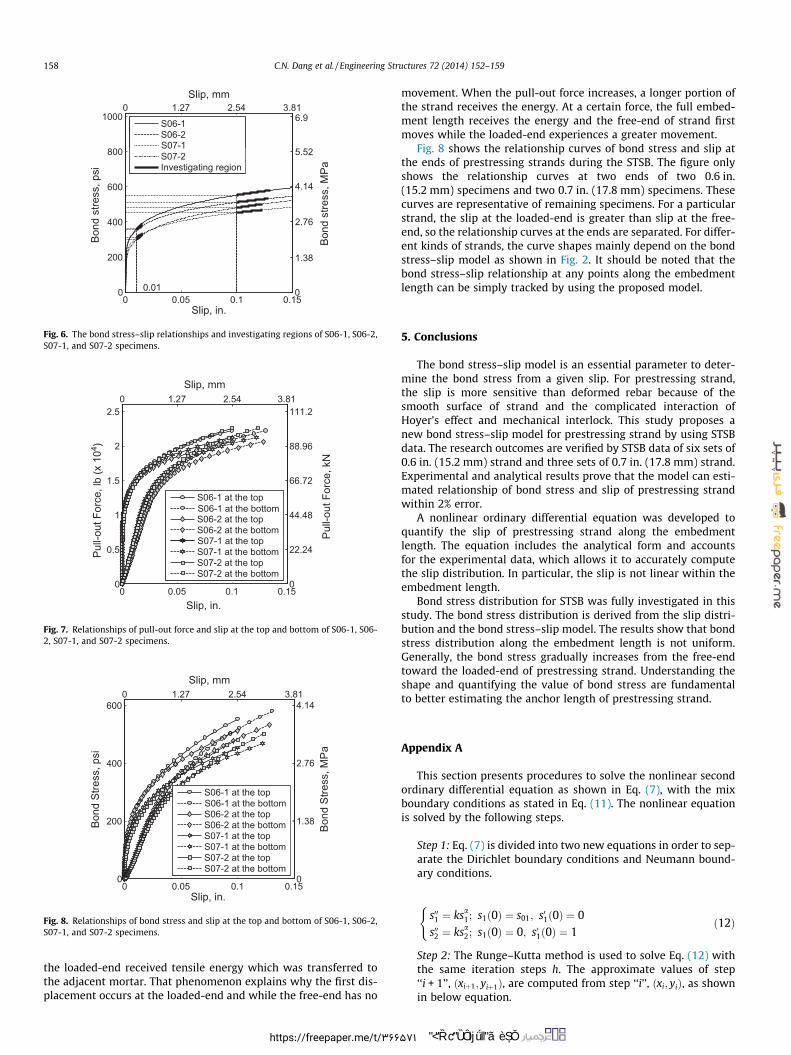
Relationship of pull-out force and slips of prestressing strand isshown in Fig. 7. The figure shows that the loaded-end is more sen-sitive to strand with slip than the free-end. At the loaded-end, slipoccurs as soon as the pull-out force is applied and increases line-arly to an approximate slip of 0.03 in. (0.75 mm). Beyond thatpoint, the slip increases more rapidly than what occurred duringthe first segment. The free end has zero displacement up to a
https://freepaper.me/t/36657
pull-out force of 10,000 lbs (44.5 kN). The first recorded movementof 0.01 in. (0.25 mm) at free-end occurs at a pull-out force of P001.Beyond that point, the slip increase more linear than the loaded-end slip to a slip of 0.1 in. (2.5 mm). Pozolo and Andrawes [16]examined the movement of prestressing strands during a pull-out test. They determined that as a pull-out force is applied tothe prestressing strand, only a short portion of the strand near
1 خودت ترجمه کن :
0 1.27 2.54 3.81Slip, mm
1000S06-1S06-2
800 S07-2Investigating region
600
400
Bond
stre
ss, p
si
Bond
stre
ss, M
Pa
200
0 0.05 0.1 0.150
Slip, in.
0
S07-1
1.38
2.76
4.14
5.52
6.9
0.01
Fig. 6. The bond stress–slip relationships and investigating regions of S06-1, S06-2,S07-1, and S07-2 specimens.
Slip, mm
2.50
111.2
2 88.96
1.5
S06-1 at the top
66.72
1 S06-2 at the topS06-2 at the bottom
44.48
Pull-
out F
orce
, kN
0.5Pull-
out F
orce
, lb
(x 1
04 )
S07-1 at the bottomS07-2 at the topS07-2 at the bottom
22.24
0 0.05 0.1 0.150
Slip, in.
0
1.27 2.54 3.81
S06-1 at the bottom
S07-1 at the top
Fig. 7. Relationships of pull-out force and slip at the top and bottom of S06-1, S06-2, S07-1, and S07-2 specimens.
0 1.27 2.54 3.81Slip, mm
600 4.14
400 2.76
S06-1 at the top
200Bond
Stre
ss, p
si
S06-2 at the topS06-2 at the bottomS07-1 at the top
1.38
S07-1 at the bottomS07-2 at the topS07-2 at the bottom
0 0.05 0.1 0.150
Slip, in.
0
Bond
Stre
ss, M
Pa
S06-1 at the bottom
Fig. 8. Relationships of bond stress and slip at the top and bottom of S06-1, S06-2,S07-1, and S07-2 specimens.
158 C.N. Dang et al. / Engineering Structures 72 (2014) 152–159
the loaded-end received tensile energy which was transferred tothe adjacent mortar. That phenomenon explains why the first dis-placement occurs at the loaded-end and while the free-end has no
https://freepaper.me/t/366
movement. When the pull-out force increases, a longer portion ofthe strand receives the energy. At a certain force, the full embed-ment length receives the energy and the free-end of strand firstmoves while the loaded-end experiences a greater movement.
Fig. 8 shows the relationship curves of bond stress and slip atthe ends of prestressing strands during the STSB. The figure onlyshows the relationship curves at two ends of two 0.6 in.(15.2 mm) specimens and two 0.7 in. (17.8 mm) specimens. Thesecurves are representative of remaining specimens. For a particularstrand, the slip at the loaded-end is greater than slip at the free-end, so the relationship curves at the ends are separated. For differ-ent kinds of strands, the curve shapes mainly depend on the bondstress–slip model as shown in Fig. 2. It should be noted that thebond stress–slip relationship at any points along the embedmentlength can be simply tracked by using the proposed model.
5. Conclusions
The bond stress–slip model is an essential parameter to deter-mine the bond stress from a given slip. For prestressing strand,the slip is more sensitive than deformed rebar because of thesmooth surface of strand and the complicated interaction ofHoyer’s effect and mechanical interlock. This study proposes anew bond stress–slip model for prestressing strand by using STSBdata. The research outcomes are verified by STSB data of six sets of0.6 in. (15.2 mm) strand and three sets of 0.7 in. (17.8 mm) strand.Experimental and analytical results prove that the model can esti-mated relationship of bond stress and slip of prestressing strandwithin 2% error.
A nonlinear ordinary differential equation was developed toquantify the slip of prestressing strand along the embedmentlength. The equation includes the analytical form and accountsfor the experimental data, which allows it to accurately computethe slip distribution. In particular, the slip is not linear within theembedment length.
Bond stress distribution for STSB was fully investigated in thisstudy. The bond stress distribution is derived from the slip distri-bution and the bond stress–slip model. The results show that bondstress distribution along the embedment length is not uniform.Generally, the bond stress gradually increases from the free-endtoward the loaded-end of prestressing strand. Understanding theshape and quantifying the value of bond stress are fundamentalto better estimating the anchor length of prestressing strand.
Appendix A
This section presents procedures to solve the nonlinear secondordinary differential equation as shown in Eq. (7), with the mixboundary conditions as stated in Eq. (11). The nonlinear equationis solved by the following steps.
Step 1: Eq. (7) is divided into two new equations in order to sep-arate the Dirichlet boundary conditions and Neumann bound-ary conditions.
s001 ¼ ksa1; s1ð0Þ ¼ s01; s01ð0Þ ¼ 0
s002 ¼ ksa2; s1ð0Þ ¼ 0; s01ð0Þ ¼ 1
(ð12Þ
Step 2: The Runge–Kutta method is used to solve Eq. (12) withthe same iteration steps h. The approximate values of step‘‘i + 1’’, ðxiþ1; yiþ1Þ, are computed from step ‘‘i’’, ðxi; yiÞ, as shownin below equation.
571 خودت ترجمه کن :

C.N. Dang et al. / Engineering Structures 72 (2014) 152–159 159
xiþ1 ¼ xi þ h
yiþ1 ¼ yi þ 16 ðk1 þ 2k2 þ 2k3 þ k4Þ
k1 ¼ hf ðxi þ yiÞk2 ¼ hf ðxi þ 0:5h; yi þ 0:5k1Þk3 ¼ hf ðxi þ 0:5h; yi þ 0:5k2Þk4 ¼ hf ðxi þ h; yi þ k3Þ
8>>>>>>>><>>>>>>>>:
ð13Þ
Step 3: The ‘‘linear shooting method’’ is implemented to com-bine to new solutions by the following expression.
sðxÞ ¼ s1ðxÞ þws2ðxÞ
w ¼P
EsAs� P
EbAb
� ��s01ðLÞ
s02ðLÞ
8><>: ð14Þ
References
[1] Janney JR. Nature of bond in pre-tensioned prestressed concrete. ACI 1954.[2] Moustafa SE. Pull-out strength of strand lifting loops. WA: Concrete
Technology Associates Tacoma; 1974.[3] Hyett AJ, Dube S, Bawden WF. Laboratory bond strength testing of 0.6, 7-wire
strand from 7 different manufacturers. Final report. Kingston, Ontario: Queen’sUniversity, Department of Mining Engineering; 1994.
[4] Russell BW, Paulsgrove GA. Assessing repeatability and reproducibility of theMoustafa test, the PTI bond test and the NASP bond test. Final report 99-04.Norman, OK: The University of Oklahoma, Fears Structural EngineeringLaboratory; 1999.
[5] Russell BW, Paulsgrove GA. NASP strand bond testing round one pull-out testsand friction bond tests of untensioned strand. Final report 99-03. Norman, OK:The University of Oklahoma, Fears Structural Engineering Laboratory; 1999.
[6] Russell BW, Brown MD. Evaluation of test methods in assessing bond quality ofprestressing strands. Final report. Stillwater, OK: Oklahoma State University;2004.
[7] Russell BW. NASP round IV strand bond testing. Final report. OK; 2006.
https://freepaper.me/t/36657
[8] ASTM A1081/A1081M. Standard test method for evaluating bond of seven-wire steel prestressing strand. West Conshohocken, PA: ASTM International;2012.
[9] Floyd RW. Investigating the bond of prestressing strands in lightweight self-consolidating concrete. AR: University of Arkansas; 2012.
[10] Hatami A, Morcous G, Hanna KE, Tadros MK. Evaluating the bond of 0.7-in.Diameter prestressing strands for concrete bridge girders. TRB 2011(11-2104);1–13.
[11] FIB 2010. fib Model code for concrete structures 2010. Wiley-VCH VerlagGmbH & Co. KGaA; 2013.
[12] Abrishami HG, Mitchell D. Bond characteristics of pretensioned strand. ACIMater J 1993;90(3):228–35.
[13] Den Uijl JA. Bond modelling of prestressing strand. ACI Spec Publ1998;180:145–70.
[14] American Concrete Institute (ACI) 318. Building code requirements forstructural concrete (ACI 318-11) and commentary (ACI 318R-11).Farmington Hills, MI: American Concrete Institute; 2011.
[15] Buckner CD. A review of strand development length for pretensioned concretemembers. PCI J 1995;40(2):84–99.
[16] Pozolo A, Andrawes B. Analytical prediction of transfer length in prestressedself-consolidating concrete girders using pull-out test results. Constr BuildMater 2011;25(2):1026–36.
[17] ASTM A416/A416M. Standard specification for steel strand, uncoated seven-wire for prestressed concrete. West Conshohocken, PA: ASTM International;2012.
[18] Staton BW, Do NH, Ruiz ED, Hale WM. Transfer lengths of prestressed beamscast with self-consolidating concrete. PCI J 2009;54(2):64–83.
[19] Ramirez JA, Russell BW. Transfer, development, and splice length for strand/reinforcement in high strength concrete, 12-60, Washington, DC; 2008.
[20] Morcous G, Hatami A, Maguire M, Hanna K, Tadros M. Mechanical and bondproperties of 18-mm- (0.7-in.-) diameter prestressing strands. J Mater Civ Eng2012;24(6):735–44.
[21] Kaushik H, Rai D, Jain S. Stress–strain characteristics of clay brick masonryunder uniaxial compression. J Mater Civ Eng 2007 09/01;2014/02;19(9):728–739.
[22] Majid ZA, Hasni MM, Senu N. Solving second order linear Dirichlet andNeumann boundary value problems by block method. Int J Appl Math2013;43(2):71–6.
1 خودت ترجمه کن :


![Ademoladij-[eCommerce Website for Your Comapny by SARV]](https://img.dokumen.tips/doc/110x75/577d20be1a28ab4e1e93a8b8/ademoladij-ecommerce-website-for-your-comapny-by-sarv.jpg)