Embed Size (px)
Citation preview

i
Analysis of Block Stability and Evaluating
Stiffness Properties
Syed Bahadur Shah
Master of Science Thesis 11/09
Division of Soil and Rock Mechanics
Department of Civil Architecture and the Built Environment
Stockholm 2011
ii
Syed Bahadur Shah, 2011
Master of Science Thesis 11/09
Division of Soil and Rock Mechanics
Royal Institute of Technology (KTH)
ISSN 1652-599

iii
Abstract;
Block stability is common and has to be studied in detail for designing tunnels.
Stability of block depends upon the shape and size of the blocks, stresses around the
block and factors such as clamping forces and the ratio between joint stiffness. These
factors are studied in detail and are the main objective of this thesis. In this thesis
influence of loading and unloading of blocks on joint stiffness and thus on ultimate
pullout force are analyzed.
Normal stress on the joint plane is linked with shear stiffness of the joint and
relaxation of forces. Changes of forces were considered to estimate joint stiffness and
ultimate pullout force using new methods in the present thesis. First method takes
into account changing clamping forces considering stiffness ratio constant (Crawford
and Bray). The second method was developed in which the ratio between normal and
shear stiffness was taken as a function of normal stress (Bagheri and Stille). In third
method, gradually pullout force is increased which changes the normal stress and
joint stiffness. The lower limit of joint stiffness gives a very conservative design. So a
stiffness value based on the average of lower and upper limit of normal force has also
been considered.
A comparison between the new methods and the previous method proposed by
Crawford and Bray which considers a constant ratio of normal and shear stiffness and
constant clamping forces shows that Crawford and Bray’s solution overestimates the
pullout forces hence the design is unsafe. It was observed that stiffness ratio is an
important factor for estimating required rock support and safety.
KEY WORDS: Block stability, Joint Stiffness, Stiffness ratio,
Clamping forces, Pullout forces
iv
List of symbols
R Ratio of normal to shear stiffness
N Normal force
S Shear force
C Clamping force
σn Normal stress
τ Shear stress
Ks Shear stiffness
Kn Normal stiffness
Ty Ultimate pullout force
h Wedge height
α Semi apical angle
υ Friction angle
P Pullout force
δ Block deformation

v
Contents
1. Introduction………………..……………………………………………………..1
1-1. Block stability and importance of joint stiffness in analyzing block stability…..1
1-2. Thesis objective………………………………………………………………....3
1-3. Assumptions and limitations……………………………………………………3
2. Mechanism of failure…………………………………………………………….4
2-1. Introduction……………………………………………………………………..5
2-2. Different stages for new method………………………………………………..5
2-2-1. Stage 1 (In-situ conditions)…………………………………………….6
2-2-2. Stage 2 (Excavation in continuous media)……………………………..7
2-2-3. Stage 3 (Relaxation of induced stresses in discontinuous media)……...9
2-2-4. Stage 4 (Weight effect)…………………………………………..……11
2-3. Conclusions……………………………………………………………………12
3. Methods to calculate ultimate pullout force…………………………………..15
3-1. Introduction……………………………………………………………………15
3-2. Crawford and Bray Solution…………………………………………………..16
3-3. New methods to calculate ultimate pullout force……………………………...19
3-3-1. Kn/Ks constant method………………………………………………..19
3-3-2. Kn/Ks function of σn method…………………………………………..20
3-3-2-1. Calculation for R…………………………………………….21
3-3-3. Kn/Ks function of σn and gradual increase of pullout force method…..23
3-4. Conclusions……………………………………………………………………24
4. Calculation for lower limit of normal stress……………………………….…26
4-1. Calculated models……………………………………………………………..27
4-2. Example showing different models……………………………………………30
4-3. Example model showing gradual increase of pullout force…………………...31
4-4. Conclusions…………………...…………………………………………….…32
5. Safety factor for lower limit of normal stress…………………………………34
5-1. Safety factor for Kn/Ks function of σn and Kn/Ks constant…………………….35
5-2. Safety factor for Kn/Ks function of σn and gradual increasing weight………...39
vi
5-3. Calculations for large tunnels………………………………………………….40
5-4. Safety factor for different tunnel dimensions………………………………….42
6. Calculation for average normal stress………………………………………...45
6.1 Introduction…………………………………………………………………….45
6.2 Safety factor calculation………………………………………………………..48
7. Summary and conclusions……………………………………………………..52
8. References……………………………………………………………………….56
vii
Chapter 1
Introduction
1
1. Introduction
1-1. Block stability and importance of
joint stiffness in analyzing block stability
Rock masses are divided into blocks of various shapes and sizes.
Discontinuities can be in the form of folds, faults or joints. Stability
of a block depends upon shape and size of the block and stresses
changing due to discontinuities.
Understanding of block failure mechanism and key parameters are
very important for stability calculations. The magnitude of stress
around the excavation is important and is the main factor in block
stability. Other important factors that can influence block stability are
joint stiffness, clamping forces, cohesion, friction angle and rock
weathering. Stability of blocks depends upon the shear strength
around the block. Analysis of blocks is essential as it gives the
knowledge of classifying blocks in safe and unsafe category.
Goodman and Shi [1] presented the key block theory. This theory
assumes joints in rock mass to be planar. Key block theory analyzes
blocks based on the stereographical projections. In this theory blocks
are divided into removable and non-removable blocks. Then they are
further divided into different classes. The removable blocks are those
which have potential to fail and cause disastrous conditions.
Goodman and Shi neglects clamping forces.

2
Miller [2] did extensive testing on stability of back walls and pillars
and found that in-situ stresses have a profound effect on the block
stability.
Crawford and Bray [3] used constant clamping forces from horizontal
stress and the height of the block. They proposed a two dimensional
plain strain analytical solution for stability analysis of blocks based
on joint relaxation which considers horizontal stresses and joint
stiffness.
All the studies carried out for analyzing block stability had
simplifications like taking constant clamping forces and ignoring the
changes of joint stiffness. These two factors are taken into
consideration and analyzed to show their influence on block stability.
Joint deformability can be described by stress-deformation curve
according to Bandis et al [4]. Goodman et al. [5] described the normal
stiffness Kn and shear stiffness Ks. The initial contact area, joint wall
roughness, strength of asperities, thickness and physical properties of
infilling material affect normal stiffness of joints.
Joint normal and shear stiffness (Kn and Ks) are the key parameters in
analyzing block stability and they control the joint behavior. Joint
shear stiffness Ks depends upon normal stress σn and it increases with
increasing σn according to Barton [6]. It is very important to
understand the importance of joint normal and shear stiffness (Kn and
Ks) in relation with different normal stress levels at different
conditions and how these stiffness’s could influence the block
stability and required rock support.
3
1-2. Thesis objective
The objective of this thesis is to study the influence of normal stress
on joint stiffness and ultimate pullout capacity estimation.
1-3. Assumptions and limitations
Friction angle υ is independent of normal stress σn.
Vertical and horizontal stresses are the principal stresses.
The solution is a two-dimensional solution.
Block stability analysis has been carried out by assuming simplified
conditions using two dimensional methods. The 2D method assumes
that the failure is dominated by plane-strain conditions. This
assumption emits the side forces and therefore reduces the analysis
time. In 2D methods it is assumed that the block is infinitely wide but
in reality it has a finite width, so the simplification can affect the
analysis by ignoring the width. In practice, two dimensional analyses
gives lower factor of safety by ignoring side effects and so is more
acceptable because it will give more conservative design Stark and
Eid [7].
On the other hand, more realistic analysis is recommended which can
be carried out using three dimensional methods. However such
analysis can be time and money consuming and the results could be
very hard to interpret.
4
Chapter 2
Mechanism of failure

5
2. Mechanism of failure
2-1. Introduction
Crawford and Bray [3] divided the mechanism of failure in two
stages. The first stage was to consider in situ conditions and
calculating clamping forces using horizontal forces. In the second
stage influence of vertical load of the wedge is considered and
limiting equilibrium ultimate pullout force Ty was calculated.
2-2. Different stages for new method
New method by Bagheri and Stille [8] divides mechanism of failure
into four stages which are as follows;
In-situ conditions
Excavation in continuous media
Relaxation of induced stresses in discontinuous media
Weight effect
The method proposed by Crawford and Bray [3] ignore the induced
stress and reduction of it due to joint relaxation, but the method
proposed by Bagheri and Stille [8] takes them into consideration and
adds up stage two and stage three.
6
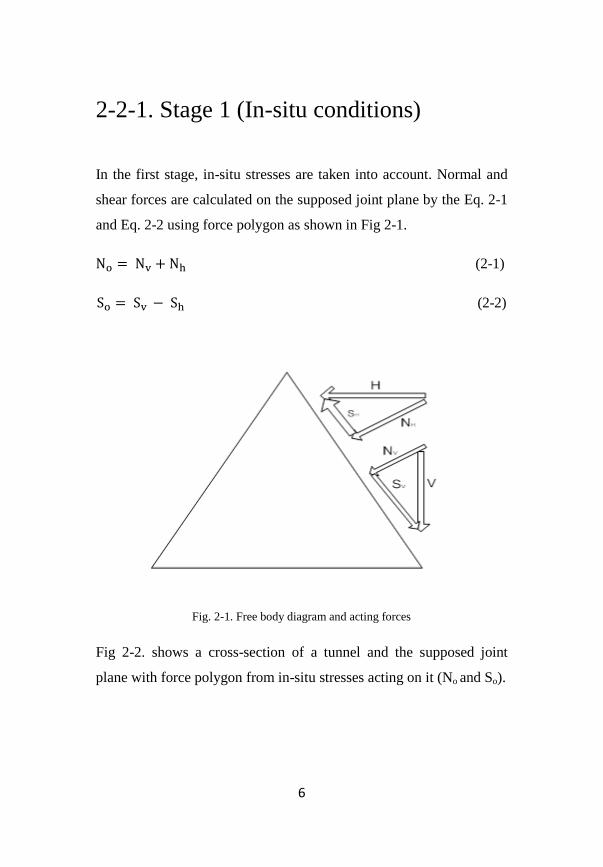
2-2-1. Stage 1 (In-situ conditions)
In the first stage, in-situ stresses are taken into account. Normal and
shear forces are calculated on the supposed joint plane by the Eq. 2-1
and Eq. 2-2 using force polygon as shown in Fig 2-1.
(2-1)
(2-2)
Fig. 2-1. Free body diagram and acting forces
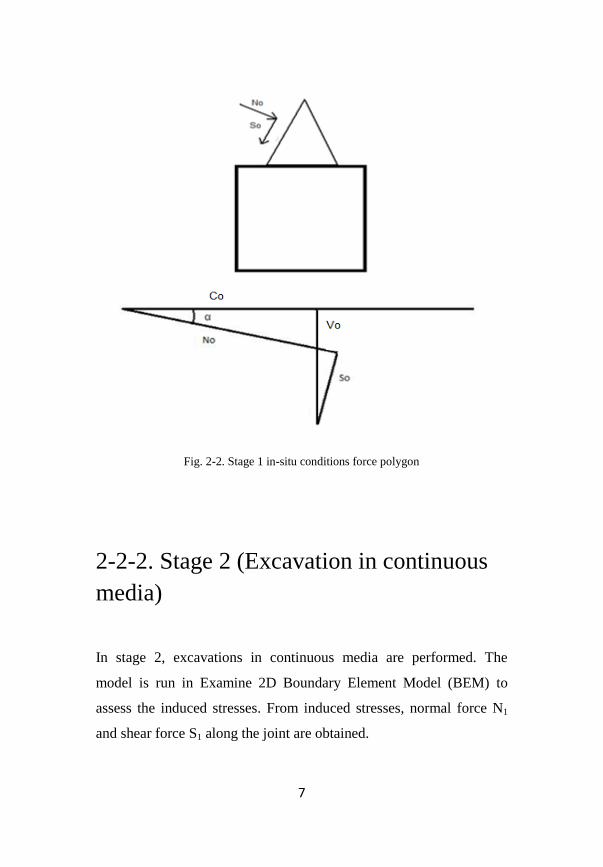
Fig 2-2. shows a cross-section of a tunnel and the supposed joint
plane with force polygon from in-situ stresses acting on it (No and So).
7
Fig. 2-2. Stage 1 in-situ conditions force polygon
2-2-2. Stage 2 (Excavation in continuous
media)
In stage 2, excavations in continuous media are performed. The
model is run in Examine 2D Boundary Element Model (BEM) to
assess the induced stresses. From induced stresses, normal force N1
and shear force S1 along the joint are obtained.
8
Examine 2D calculates σXX and σYY which is the normal stress in the
X and Y direction and also it calculates τXY which is the shear stress
in the XY plane along the supposed joint plane. Then stress
transformation is applied to assess the normal and shear stress on joint
plane. Fig. 2-3 shows the changes of forces due to excavation.
(2-3)
(2-4)
From and ', Normal and shear force can be calculated

9
Fig. 2-3. Stage 2 excavation in continuous conditions and force polygon
2-2-3. Stage 3 (Relaxation of induced
stresses in discontinuous media)
In stage 3, a joint exists and the relaxation of stresses is considered.
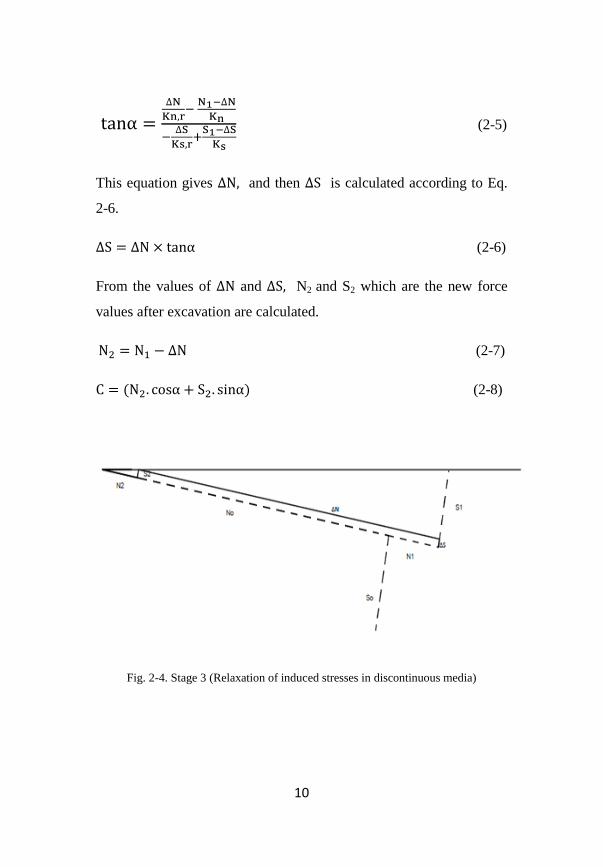
Normal and shear forces are reduced by ΔN and ΔS using Eq. 2-5.
10
(2-5)
This equation gives and then is calculated according to Eq.
2-6.
(2-6)
From the values of and N2 and S2 which are the new force
values after excavation are calculated.
(2-7)
(2-8)
Fig. 2-4. Stage 3 (Relaxation of induced stresses in discontinuous media)

11
2-2-4. Stage 4 (Weight effect)
In order to model the gradually moving of the block, the weight of
block is increased step by step.
Fig. 2-5. Stage 4 influence of weight
12
The ultimate pullout force of the block Ty is calculated at each step
according to Eq. 2-9.
(2-9)
2-3. Conclusions
In this chapter mechanism of failure has been studied. Crawford and
Bray divided the mechanism in two stages i.e. in situ stage and
ultimate pull out force. Bagheri and Stille [8] divide the solution into
four stages as and it considers excavation in continuous and
discontinuous media.
It can be observed that ultimate pullout force depends upon clamping
force C and joint normal and shear stiffness and also the ratio
between them. Joint normal and shear stiffness depends upon the
normal stress and it is described in the next chapter.

13
14
Chapter 3
Methods to calculate
ultimate pullout force

15
3. Methods to calculate ultimate
pullout force
3-1. Introduction
Chapter 2 described the mechanism of failure in different stages.
This chapter uses the mechanism of failure with different methods
developed to calculate ultimate pullout force. These methods are
applied to study the influence of clamping force and joint normal and
shear stiffness on ultimate pullout force. The difference between these
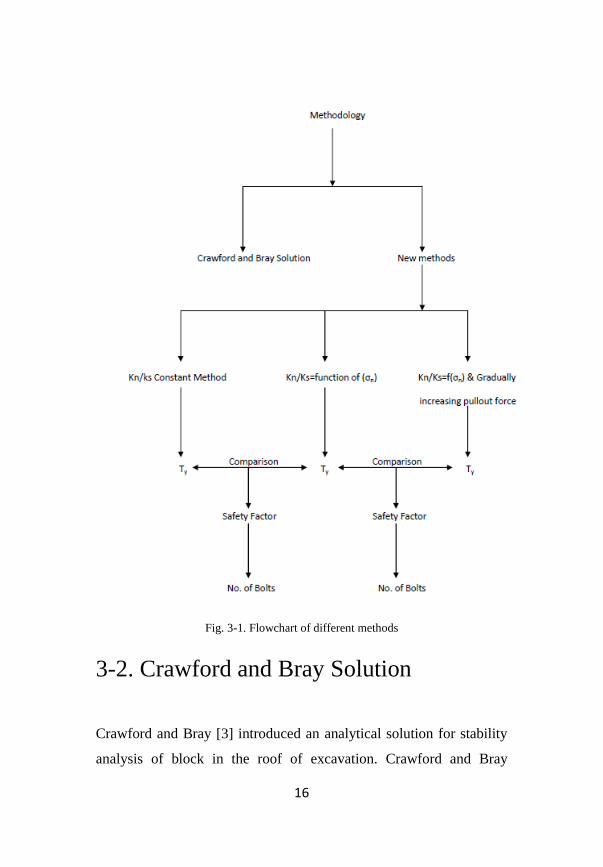
methods is summarized in Fig. 3-1.
Crawford-Bray solution.
Considering relaxation of induced stress (Kn/Ks is constant).
Considering relaxation of induced stress (Kn/Ks is a function
of σn).
Considering Kn/Ks function of σn and gradual increase of
pullout force.
16
Fig. 3-1. Flowchart of different methods
3-2. Crawford and Bray Solution
Crawford and Bray [3] introduced an analytical solution for stability
analysis of block in the roof of excavation. Crawford and Bray
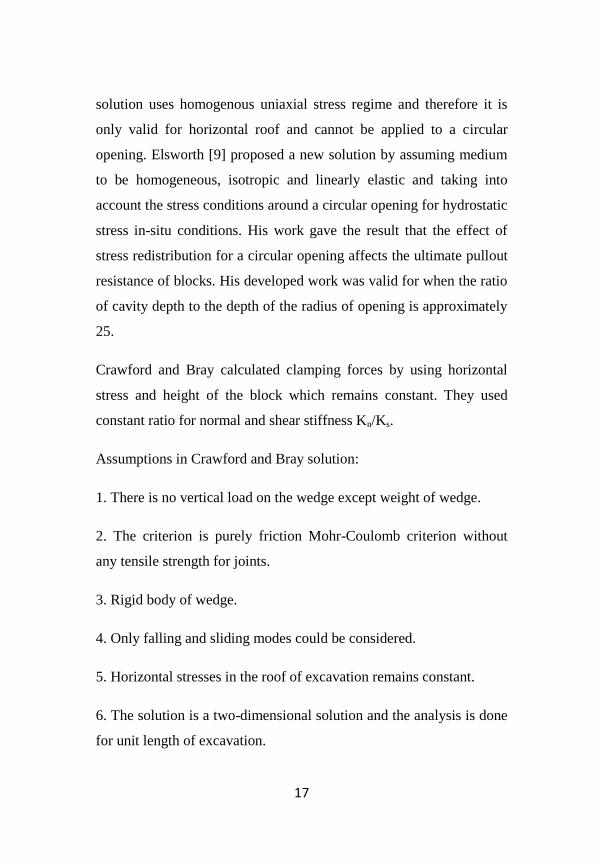
17
solution uses homogenous uniaxial stress regime and therefore it is
only valid for horizontal roof and cannot be applied to a circular
opening. Elsworth [9] proposed a new solution by assuming medium
to be homogeneous, isotropic and linearly elastic and taking into
account the stress conditions around a circular opening for hydrostatic
stress in-situ conditions. His work gave the result that the effect of
stress redistribution for a circular opening affects the ultimate pullout
resistance of blocks. His developed work was valid for when the ratio
of cavity depth to the depth of the radius of opening is approximately
25.
Crawford and Bray calculated clamping forces by using horizontal
stress and height of the block which remains constant. They used
constant ratio for normal and shear stiffness Kn/Ks.
Assumptions in Crawford and Bray solution:
1. There is no vertical load on the wedge except weight of wedge.
2. The criterion is purely friction Mohr-Coulomb criterion without
any tensile strength for joints.
3. Rigid body of wedge.
4. Only falling and sliding modes could be considered.
5. Horizontal stresses in the roof of excavation remains constant.
6. The solution is a two-dimensional solution and the analysis is done
for unit length of excavation.
18
7. Linear joint relaxation.
8. Full mobilization of joint was assumed by Crawford and Bray.
Ultimate pullout force Ty across the wedge can be calculated
according to Eq. 3-1.
(3-1)
In which, C = σh×h
Crawford and Bray method is studied in detail because it gives basis
for the analytical solution of block analysis. The purpose of this study
is to apply the solution by Crawford and Bray and calculate ultimate
pull out force at different stress levels and then compare this solution
with new methods. According to the analyses done by Bagheri [10],
Bray-Crawford solution has good accuracy for the tunnels with
negligible vertical in-situ stresses and high value of Ko.
It can be concluded that Crawford and Bray method of analyzing
block stability has many simplifications so the model is very
uncertain. The accuracy of this method decreases as it calculates
clamping forces from horizontal in situ stresses which remains
constant. Crawford and Bray method also applies constant ratio for
joint normal and shear stiffness and it does not considers the influence
of joint relaxation. So Crawford and Bray method of analyzing block
stability is improved and key parameters are taken into account to get
more precise estimation in the following new methods.
19
3-3. New methods to calculate ultimate
pullout force
To understand the influence of joint normal to shear stiffness ration
and clamping forces, the new methods can be divided into three
categories which are as follows.
Kn/Ks constant.
Kn/Ks function of σn.
Kn/Ks function of σn and Gradual increase of pullout force.
3-3-1. Kn/Ks constant method
In this method Clamping forces are calculated from normal and shear
forces (N2 and S2) calculated in stage three. Joint normal and shear
stiffness are calculated by using initial normal stress and calculating
ΔN and ΔS by using Eq. 2-5 and Eq. 2-6 Bagheri and Stille, [8]. The
difference between this method and Crawford-Bray method is the use
of clamping forces calculated from normal and shear forces (N2 and
S2) as described above considering relaxation of induced stresses.
(3-2)
Ultimate pullout force Ty is calculated using Eq. 3-1.
20
3-3-2. Kn/Ks function of σn method
The idea of this method is to calculate joint stiffness’s ratio based on
the normal stress acting on the joint. This method introduces the use
of R which is the ratio between joint normal and shear stiffness. Joint
shear stiffness Ks generally decreases with decreasing normal stress
according to Barton and Chouby, [6]. It can be seen from the Barton
Eq. 3-3, that joint shear stiffness is a function of normal stress. Barton
Equation is applied to find joint shear stiffness Ks1 in this stage
according to the induced stresses by Barton and chouby [6]. Joint
normal stress value is calculated by using normal force in Eq. 3-4.
(3-3)
(3-4)
Joint normal stiffness can then be calculated by using the ratio of joint
normal stiffness to joint shear stiffness Kn/Ks which depends upon
normal stress σn. By using Ks calculated from Eq. 3-3, and R the value
of Kn is calculated according to Eq. 3-5.
(3-5)

21
3-3-2-1. Calculation for R
The ratio between joint normal and shear stiffness R depends upon
the normal stress on the joint. It was observed by Bandis [4] and
represented in a form of a graph as shown in the Fig. 3-2. As it can be
seen in the graph, R depends upon normal stress σn. Higher the R,
lower will be the ultimate pullout force, therefore the largest value of
R was used for calculations as shown in the Fig. 3-3.
Fig. 3-2. Ratio of Normal to shear stiffness (Bandis et al, 1981)
22
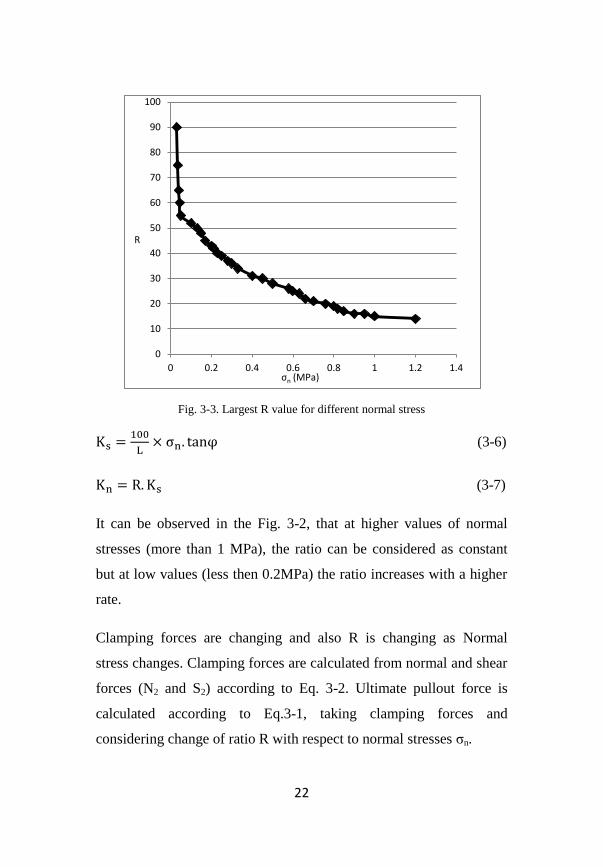
Fig. 3-3. Largest R value for different normal stress
(3-6)
(3-7)
It can be observed in the Fig. 3-2, that at higher values of normal
stresses (more than 1 MPa), the ratio can be considered as constant
but at low values (less then 0.2MPa) the ratio increases with a higher
rate.
Clamping forces are changing and also R is changing as Normal
stress changes. Clamping forces are calculated from normal and shear
forces (N2 and S2) according to Eq. 3-2. Ultimate pullout force is
calculated according to Eq.3-1, taking clamping forces and
considering change of ratio R with respect to normal stresses σn.
0
10
20
30
40
50
60
70
80
90
100
0 0.2 0.4 0.6 0.8 1 1.2 1.4 σn (MPa)
R
23
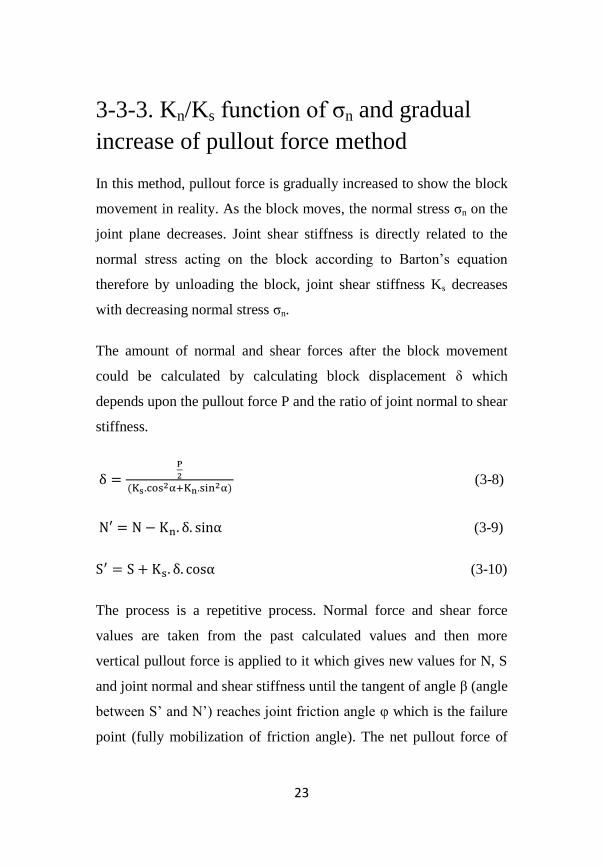
3-3-3. Kn/Ks function of σn and gradual
increase of pullout force method
In this method, pullout force is gradually increased to show the block
movement in reality. As the block moves, the normal stress σn on the
joint plane decreases. Joint shear stiffness is directly related to the
normal stress acting on the block according to Barton’s equation
therefore by unloading the block, joint shear stiffness Ks decreases
with decreasing normal stress σn.
The amount of normal and shear forces after the block movement
could be calculated by calculating block displacement δ which
depends upon the pullout force P and the ratio of joint normal to shear
stiffness.
(3-8)
(3-9)
(3-10)
The process is a repetitive process. Normal force and shear force
values are taken from the past calculated values and then more
vertical pullout force is applied to it which gives new values for N, S
and joint normal and shear stiffness until the tangent of angle β (angle
between S’ and N’) reaches joint friction angle υ which is the failure
point (fully mobilization of friction angle). The net pullout force of
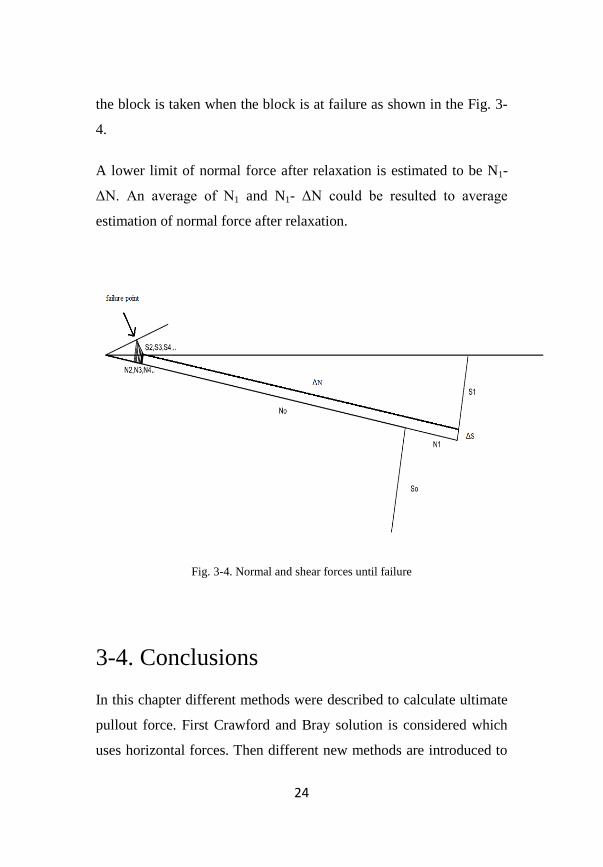
24
the block is taken when the block is at failure as shown in the Fig. 3-
4.
A lower limit of normal force after relaxation is estimated to be N1-
ΔN. An average of N1 and N1- ΔN could be resulted to average
estimation of normal force after relaxation.
Fig. 3-4. Normal and shear forces until failure
3-4. Conclusions
In this chapter different methods were described to calculate ultimate
pullout force. First Crawford and Bray solution is considered which
uses horizontal forces. Then different new methods are introduced to
25
corporate the changes of clamping forces and shear stiffness in the
relaxation process.
In the next chapters these methods will be applied and compared for
both cases of lower limit and average normal stress.
26
Chapter 4
Calculation for lower
limit of normal stress

27
4. Calculation for lower limit of
normal stress
4-1. Calculated models
Different tunnel depths were considered such as 20, 100 and 400m,
and the ratio between horizontal and vertical stress Ko, is taken as 0.5,
1 and 2. Semi apical angle for the block α, is taken as 10 degrees.
Friction angle for the block is taken as 30, 40 and 50 degrees. The
results of pullout force for different cases are summarized in Table 4-
1. In these cases a lower limit of normal stress was considered.
28
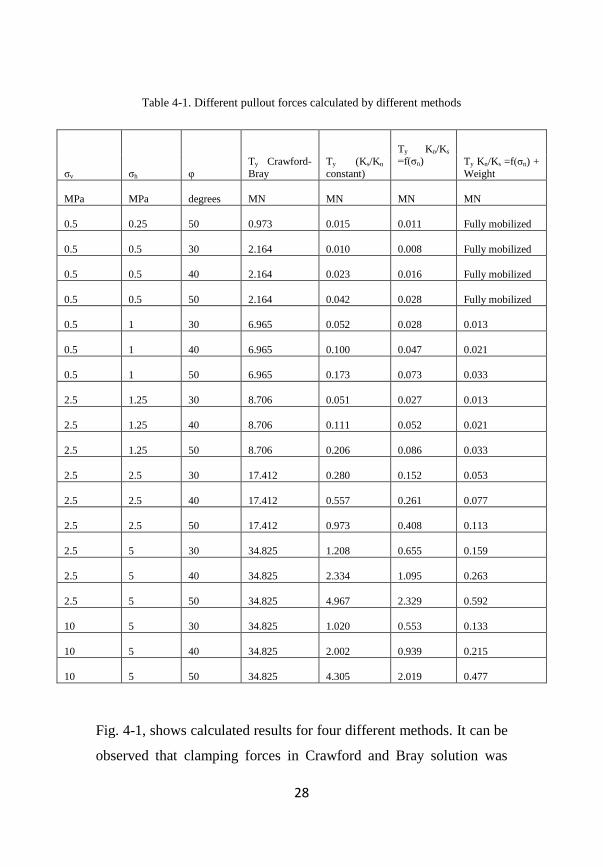
Table 4-1. Different pullout forces calculated by different methods
σv σh υ
Ty Crawford-
Bray
Ty (Ks/Kn
constant)
Ty Kn/Ks
=f(σn) Ty Kn/Ks =f(σn) +
Weight
MPa MPa degrees MN MN MN MN
0.5 0.25 50 0.973 0.015 0.011 Fully mobilized
0.5 0.5 30 2.164 0.010 0.008 Fully mobilized
0.5 0.5 40 2.164 0.023 0.016 Fully mobilized
0.5 0.5 50 2.164 0.042 0.028 Fully mobilized
0.5 1 30 6.965 0.052 0.028 0.013
0.5 1 40 6.965 0.100 0.047 0.021
0.5 1 50 6.965 0.173 0.073 0.033
2.5 1.25 30 8.706 0.051 0.027 0.013
2.5 1.25 40 8.706 0.111 0.052 0.021
2.5 1.25 50 8.706 0.206 0.086 0.033
2.5 2.5 30 17.412 0.280 0.152 0.053
2.5 2.5 40 17.412 0.557 0.261 0.077
2.5 2.5 50 17.412 0.973 0.408 0.113
2.5 5 30 34.825 1.208 0.655 0.159
2.5 5 40 34.825 2.334 1.095 0.263
2.5 5 50 34.825 4.967 2.329 0.592
10 5 30 34.825 1.020 0.553 0.133
10 5 40 34.825 2.002 0.939 0.215
10 5 50 34.825 4.305 2.019 0.477
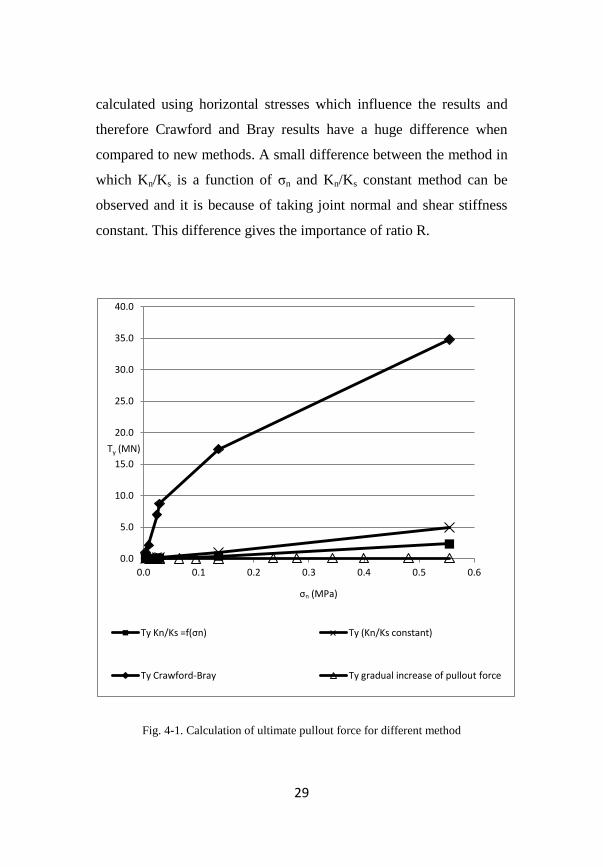
Fig. 4-1, shows calculated results for four different methods. It can be
observed that clamping forces in Crawford and Bray solution was
29
calculated using horizontal stresses which influence the results and
therefore Crawford and Bray results have a huge difference when
compared to new methods. A small difference between the method in
which Kn/Ks is a function of σn and Kn/Ks constant method can be
observed and it is because of taking joint normal and shear stiffness
constant. This difference gives the importance of ratio R.
Fig. 4-1. Calculation of ultimate pullout force for different method
0.0
5.0
10.0
15.0
20.0
25.0
30.0
35.0
40.0
0.0 0.1 0.2 0.3 0.4 0.5 0.6
Ty Kn/Ks =f(σn) Ty (Kn/Ks constant)
Ty Crawford-Bray Ty gradual increase of pullout force
Ty (MN)
σn (MPa)
30
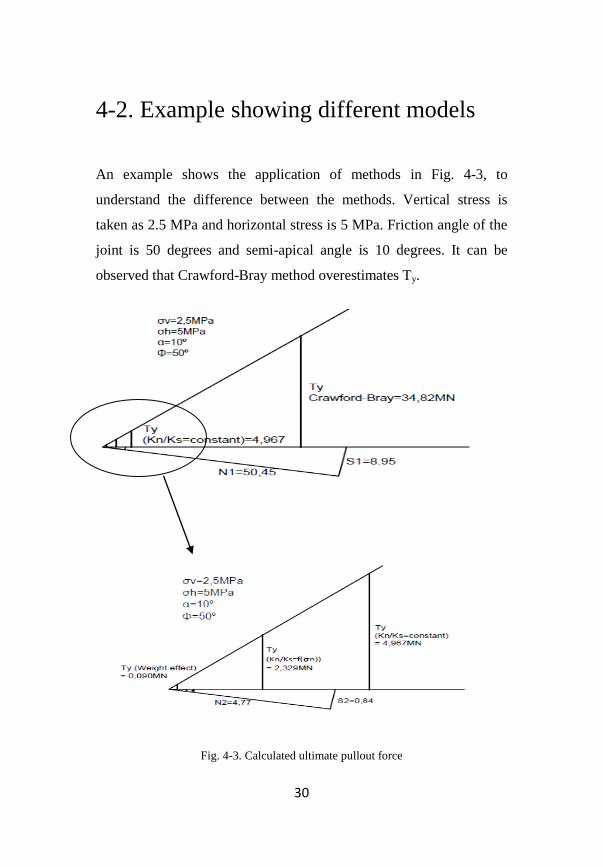
4-2. Example showing different models
An example shows the application of methods in Fig. 4-3, to
understand the difference between the methods. Vertical stress is
taken as 2.5 MPa and horizontal stress is 5 MPa. Friction angle of the
joint is 50 degrees and semi-apical angle is 10 degrees. It can be
observed that Crawford-Bray method overestimates Ty.
Fig. 4-3. Calculated ultimate pullout force
31
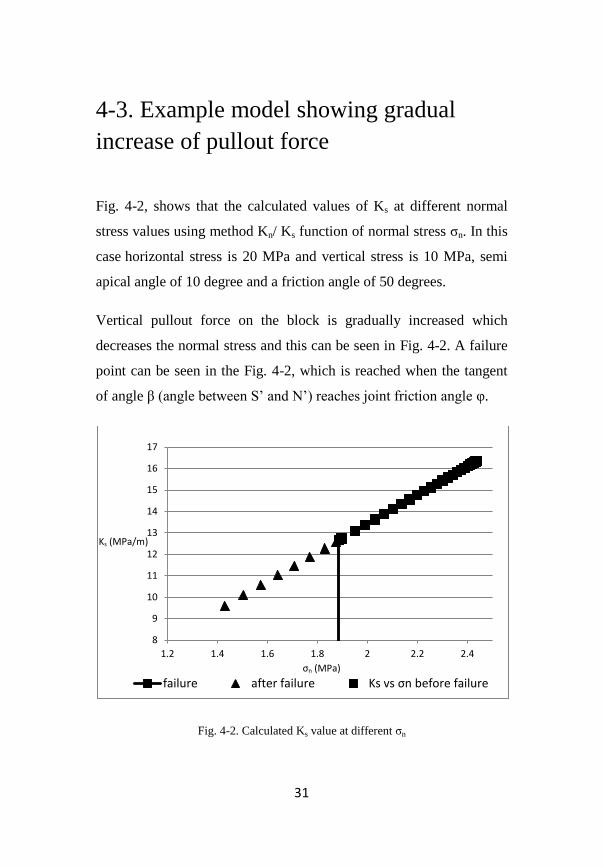
4-3. Example model showing gradual
increase of pullout force
Fig. 4-2, shows that the calculated values of Ks at different normal
stress values using method Kn/ Ks function of normal stress σn. In this
case horizontal stress is 20 MPa and vertical stress is 10 MPa, semi
apical angle of 10 degree and a friction angle of 50 degrees.
Vertical pullout force on the block is gradually increased which
decreases the normal stress and this can be seen in Fig. 4-2. A failure
point can be seen in the Fig. 4-2, which is reached when the tangent
of angle β (angle between S’ and N’) reaches joint friction angle υ.
Fig. 4-2. Calculated Ks value at different σn
8
9
10
11
12
13
14
15
16
17
1.2 1.4 1.6 1.8 2 2.2 2.4
failure after failure Ks vs σn before failure σn (MPa)
Ks (MPa/m)
32
4-4. Conclusions
Joint shear stiffness depends upon the normal stress and it decreases
with decreasing normal stress. It can be seen that there is a linear
relationship between joint shear stiffness and normal stress in
accordance with Barton equation.

33
34
Chapter 5
Safety factor for lower
limit of normal stress
35
5. Safety factor for lower limit of
normal stress
5-1. Safety factor using Kn/Ks function of
σn and Kn/Ks constant
The factor of safety can be defined as follows according to Bray and
Crawford [3].
(5-1)
In Eq. 5-1, Ty is the block resistance force, B is the rock bolts
required for the desired safety factor and W is the weight of the block.
Safety factor of Kn/Ks constant method has been compared with those
from the method taking Kn/Ks as a function of normal stress σn. The
comparison between these two methods is important as it shows the
importance of changes of normal stress σn and ratio R in calculations.
Ultimate pullout force calculated from Kn/Ks constant method is
higher than Kn/Ks =f(σn) method as shown in Table 4-1.
Table 5-1, shows calculated rock bolts for 20, 100 and 400m depth,
and the ratio between horizontal and vertical stress Ko 0.5,1 and 2.
Semi apical angle for the block α is taken as 10 degrees. Assumed
safety factor is 2. The highlighted points on the Table 5-1 are of
importance because they show the difference between the two
36
considered methods. Positive sign for rock bolts means it needs rock
bolts and negative sign means that the desired safety factor has been
achieved and there are no required rock bolts. It can be seen that
Kn/Ks as a function of σn method shows that rock bolts are required
whereas Kn/Ks constant method show no rock bolts. This difference
shows that it’s important to take into consideration ratio of shear
stiffness to normal stiffness Kn/Ks.

37
Table 5-1. Calculations for rock bolts with a safety factor of 2
σv σh υ σn
Ty
Kn/Ks =f(σn)
Ty (Ks/Kn
constant)
R.B
Kn/Ks =f(σn)
R.B
(Ks/Kn
constant)
SF
Kn/Ks =f(σn)
SF
(Ks/Kn constant)
MPa MPa
deg
rees MPa MN MN
0.5 0.25 50 0.004 0.011 0.015 0.677 0.673 0.032 0.044
0.5 0.5 30 0.003 0.008 0.010 0.680 0.678 0.023 0.031
0.5 0.5 40 0.006 0.016 0.023 0.672 0.665 0.047 0.069
0.5 0.5 50 0.009 0.028 0.042 0.660 0.646 0.082 0.125
0.5 1 30 0.012 0.028 0.052 0.660 0.636 0.081 0.154
0.5 1 40 0.017 0.047 0.100 0.641 0.588 0.137 0.300
0.5 1 50 0.024 0.073 0.173 0.615 0.515 0.212 0.519
2.5 1.25 30 0.012 0.027 0.051 0.661 0.637 0.080 0.151
2.5 1.25 40 0.019 0.052 0.111 0.636 0.577 0.151 0.332
2.5 1.25 50 0.029 0.086 0.206 0.602 0.482 0.251 0.616
2.5 2.5 30 0.064 0.152 0.280 0.536 0.408 0.441 0.838
2.5 2.5 40 0.095 0.261 0.557 0.427 0.131 0.760 1.669
2.5 2.5 50 0.136 0.408 0.973 0.280 -0.285 1.186 2.913
2.5 5 30 0.278 0.655 1.208 0.033 -0.520 1.903 3.618
2.5 5 40 0.400 1.095 2.334 -0.407 -1.646 3.182 6.989
2.5 5 50 0.555 2.329 4.967 -1.641 -4.279 6.771 14.872
10 5 30 0.235 0.553 1.020 0.135 -0.332 1.607 3.054
10 5 40 0.343 0.939 2.002 -0.251 -1.314 2.729 5.993
10 5 50 0.481 2.019 4.305 -1.331 -3.617 5.868 12.889

38
Fig. 5-1, shows calculated safety factor for different tunnel
conditions. At low normal stress levels such as at shallow depths
clamping forces are almost equal to zero so the net pullout force is
negligible and the two methods corresponds to each other and both
recommend supporting full block weight.
Fig. 5-1. Safety factor calculations for different methods
If the desired safety factor is set to 2, it can be observed from Fig. 5-
1, that in the range of normal stress between 0.1 and 0.3 MPa (as
shown by the marked arrows), the methods in discussion gives
σn (MPa)
39
different results. The method with ratio Kn/Ks constant shows the
block is over the desired safety factor but the Kn/Ks=f(σn) method
suggests that safety factor is lower than desired safety factor so it
requires rock bolts. So Fig. 5-1, explains the importance of the
stiffness ratio, R. At higher stress levels both methods show safe
design at the desired safety factor of 2.
5-2. Safety factor using Kn/Ks function of
σn and gradual increasing weight
The difference between these two methods is gradual increase of
weight hence considering the movement of block. Ultimate pullout
force calculated using Kn/Ks function of σn provides higher safety
factor therefore unsafe design than gradually increasing weight
method, it is because stiffness is decreased during movement of
block.
If the desired safety factor is set to 2, it can be observed that the
method taking in consideration only the ratio of stiffness’s shows no
requirement of rock bolts in some cases and the method taking into
consideration weight effect show requirement of rock bolts which are
highlighted in the Table 5-2.

40
Table 5-2. Safety factor calculations for Kn/Ks=f(σn) method and gradual increasing
weight method
σv σh υ
Ty
Kn/Ks =f(σn)
Ty Kn/Ks =f(σn) + Weight
R.B
Kn/Ks =f(σn)
R.B Kn/Ks
=f(σn) + Weight
SF
Kn/Ks
=f(σn) SF Kn/Ks =f(σn)
+ Weight
MPa MPa degrees MN MN
0.5 0.25 50 0.011 Fully mobilized 0.677 Fully mobilized 0.032 Fully mobilized
0.5 0.5 30 0.008 Fully mobilized 0.680 Fully mobilized 0.023 Fully mobilized
0.5 0.5 40 0.016 Fully mobilized 0.672 Fully mobilized 0.047 Fully mobilized
0.5 0.5 50 0.028 Fully mobilized 0.660 Fully mobilized 0.082 Fully mobilized
0.5 1 30 0.028 0.013 0.660 0.675 0.081 0.039
0.5 1 40 0.047 0.021 0.641 0.667 0.137 0.063
0.5 1 50 0.073 0.033 0.615 0.655 0.212 0.098
2.5 1.25 30 0.027 0.013 0.661 0.675 0.080 0.037
2.5 1.25 40 0.052 0.021 0.636 0.667 0.151 0.063
2.5 1.25 50 0.086 0.033 0.602 0.655 0.251 0.098
2.5 2.5 30 0.152 0.053 0.536 0.635 0.441 0.158
2.5 2.5 40 0.261 0.077 0.427 0.611 0.760 0.231
2.5 2.5 50 0.408 0.113 0.280 0.575 1.186 0.337
2.5 5 30 0.655 0.159 0.033 0.529 1.903 0.477
2.5 5 40 1.095 0.263 -0.407 0.425 3.182 0.788
2.5 5 50 2.329 0.592 -1.641 0.096 6.771 1.771
10 5 30 0.553 0.133 0.135 0.555 1.607 0.399
10 5 40 0.939 0.215 -0.251 0.473 2.729 0.644
10 5 50 2.019 0.477 -1.331 0.211 5.868 1.428
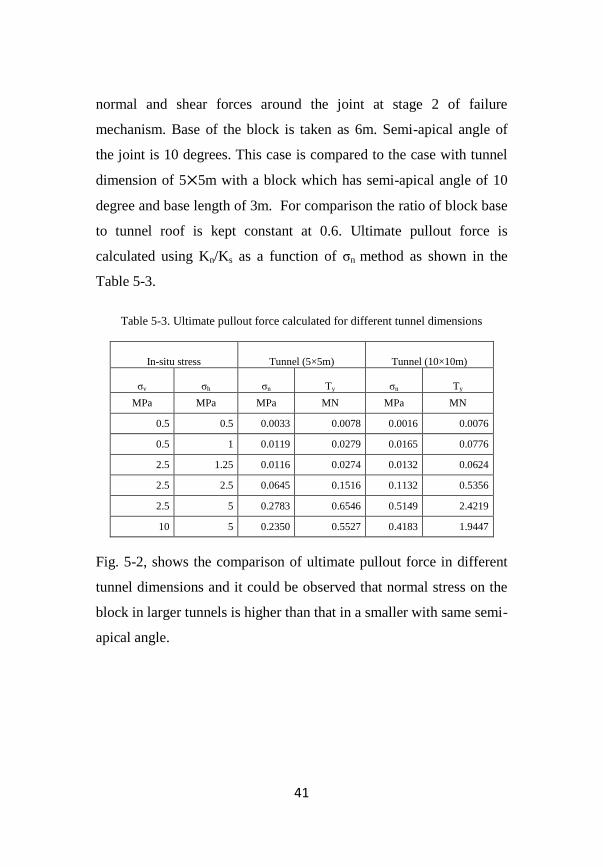
5-3. Calculations for large tunnels
A square shape tunnel with dimensions 10⨉10m is considered and
the model is run in examine 2D (Boundary Element Model) to get
41
normal and shear forces around the joint at stage 2 of failure
mechanism. Base of the block is taken as 6m. Semi-apical angle of
the joint is 10 degrees. This case is compared to the case with tunnel
dimension of 5⨉5m with a block which has semi-apical angle of 10
degree and base length of 3m. For comparison the ratio of block base
to tunnel roof is kept constant at 0.6. Ultimate pullout force is
calculated using Kn/Ks as a function of σn method as shown in the
Table 5-3.
Table 5-3. Ultimate pullout force calculated for different tunnel dimensions
In-situ stress Tunnel (5×5m) Tunnel (10×10m)
σv σh σn Ty σn Ty
MPa MPa MPa MN MPa MN
0.5 0.5 0.0033 0.0078 0.0016 0.0076
0.5 1 0.0119 0.0279 0.0165 0.0776
2.5 1.25 0.0116 0.0274 0.0132 0.0624
2.5 2.5 0.0645 0.1516 0.1132 0.5356
2.5 5 0.2783 0.6546 0.5149 2.4219
10 5 0.2350 0.5527 0.4183 1.9447
Fig. 5-2, shows the comparison of ultimate pullout force in different
tunnel dimensions and it could be observed that normal stress on the
block in larger tunnels is higher than that in a smaller with same semi-
apical angle.

42
Fig. 5-2. Calculation of ultimate pullout force at different tunnel dimensions
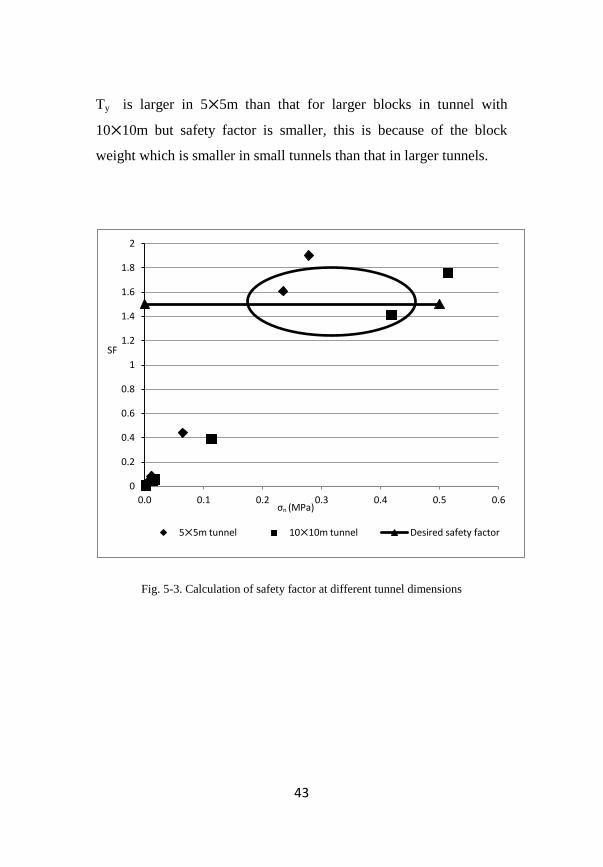
5-4. Safety factor for different tunnel
dimensions
If the desired safety factor is 1.5, it can be observed from the Fig. 5-3,
that in the range of normal stress of 0.2 to 0.45 MPa, two tunnels
dimensions (5⨉5m and 10⨉10m) provide different results. Marked
oval in the Fig. 5-3, shows values for safety factor at vertical stress 10
MPa and horizontal stress of 5 MPa. It can be observed that smaller
tunnel has achieved safety factor of 1.5 and there is no requirement of
rock bolts but larger tunnel is under the safety factor in the same
stress levels and it requires rock bolts.
0.0
0.5
1.0
1.5
2.0
2.5
3.0
0.0 0.1 0.2 0.3 0.4 0.5 0.6
5×5m tunnel Ks/Kn=f(σn) method 10⨉10m tunnel Kn/Ks=f(σn) method
Ty (MN)
σn (MPa)
43
Ty is larger in 5⨉5m than that for larger blocks in tunnel with
10⨉10m but safety factor is smaller, this is because of the block
weight which is smaller in small tunnels than that in larger tunnels.
Fig. 5-3. Calculation of safety factor at different tunnel dimensions
0
0.2
0.4
0.6
0.8
1
1.2
1.4
1.6
1.8
2
0.0 0.1 0.2 0.3 0.4 0.5 0.6
5⨉5m tunnel 10⨉10m tunnel Desired safety factor
SF
σn (MPa)

44
Chapter 6
Calculation for
average normal stress
45
6. Calculation for average
normal stress
6.1 Introduction
Normal stress on the joints influences joint stiffness values. Normal
stress depends on the normal force on the joint plane. The upper limit
of normal force on joint plane is estimated with no relaxation of joint.
The lower limit is estimated when the process of relaxation is fully
performed such as those showed in the previous chapter. With more
relaxation, the value of normal stress and thus joint stiffness
decreases. The lower limit may result to conservative design.
Therefore in this chapter a value which is based on the average of
lower and upper limit of the normal force is considered.
Eq. 6-1, gives the normal force after the joint has been relaxed.
(6-1)
Since we are taking the average of the initial and lower limit of
normal force, K is taken as 0.5, then
(6-2)
Corresponding shear forces S' are calculated using normal force N'.
46
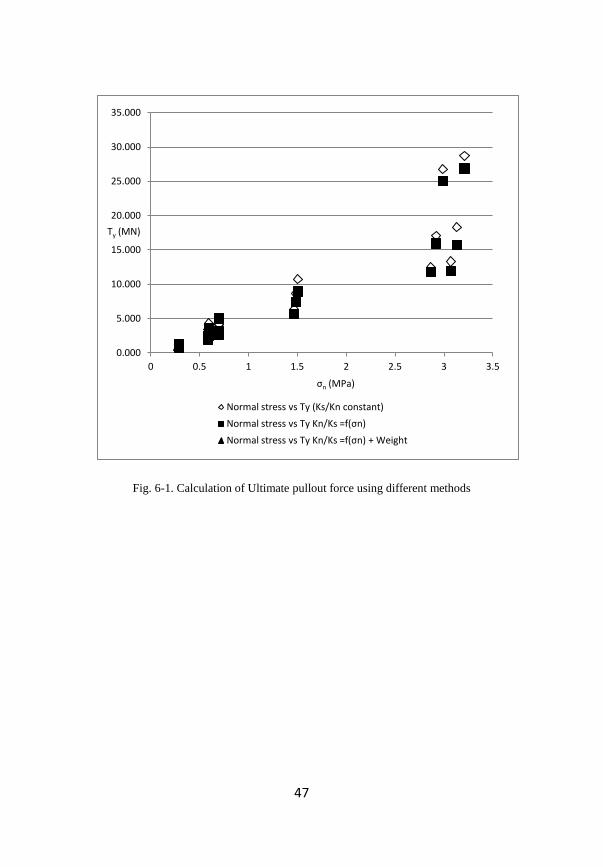
Clamping forces depends upon Normal forces as well, so they must
be changed according to the Eq. 6-3. New clamping force C' is
calculated using N' and taking K as 0.5.
(6-3)
Based on Eq. 6-2 and Eq. 6-3, the introduced methods descried in
chapter 3 has cases with different horizontal and vertical stresses, half
semi-apical angle of 10 degrees and a base of 3m are re-calculated
and presented in Fig. 6-1 and Table 6-1. It can be observed that
ultimate pullout force is larger than the case with lower limit of
normal force (Ko=1).
Fig. 6-1, shows calculated ultimate pullout force using different
methods. It can be observed that ultimate pullout force has been
increased due to consideration of average value for normal force.
47
Fig. 6-1. Calculation of Ultimate pullout force using different methods
0.000
5.000
10.000
15.000
20.000
25.000
30.000
35.000
0 0.5 1 1.5 2 2.5 3 3.5
Normal stress vs Ty (Ks/Kn constant)
Normal stress vs Ty Kn/Ks =f(σn)
Normal stress vs Ty Kn/Ks =f(σn) + Weight
σn (MPa)
Ty (MN)
48
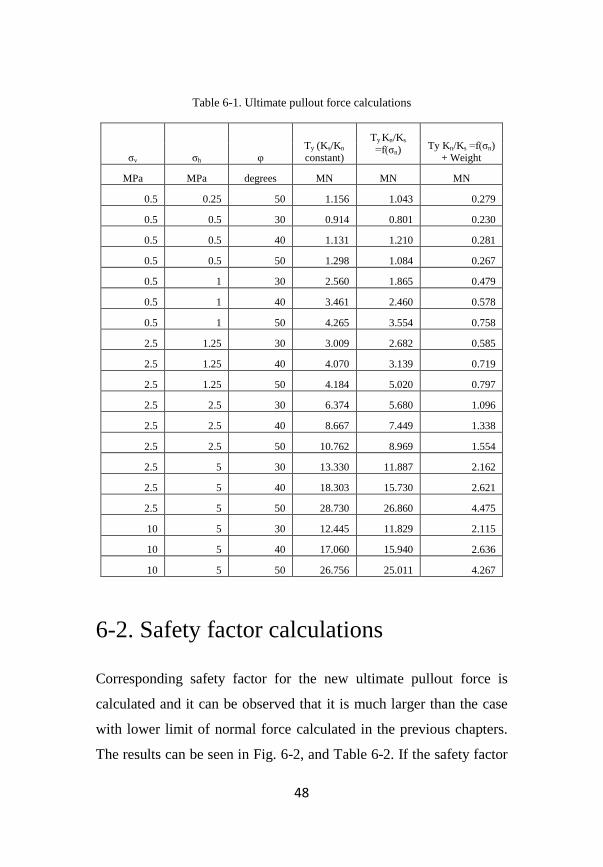
Table 6-1. Ultimate pullout force calculations
σv σh υ Ty (Ks/Kn constant)
Ty Kn/Ks
=f(σn) Ty Kn/Ks =f(σn)
+ Weight
MPa MPa degrees MN MN MN
0.5 0.25 50 1.156 1.043 0.279
0.5 0.5 30 0.914 0.801 0.230
0.5 0.5 40 1.131 1.210 0.281
0.5 0.5 50 1.298 1.084 0.267
0.5 1 30 2.560 1.865 0.479
0.5 1 40 3.461 2.460 0.578
0.5 1 50 4.265 3.554 0.758
2.5 1.25 30 3.009 2.682 0.585
2.5 1.25 40 4.070 3.139 0.719
2.5 1.25 50 4.184 5.020 0.797
2.5 2.5 30 6.374 5.680 1.096
2.5 2.5 40 8.667 7.449 1.338
2.5 2.5 50 10.762 8.969 1.554
2.5 5 30 13.330 11.887 2.162
2.5 5 40 18.303 15.730 2.621
2.5 5 50 28.730 26.860 4.475
10 5 30 12.445 11.829 2.115
10 5 40 17.060 15.940 2.636
10 5 50 26.756 25.011 4.267
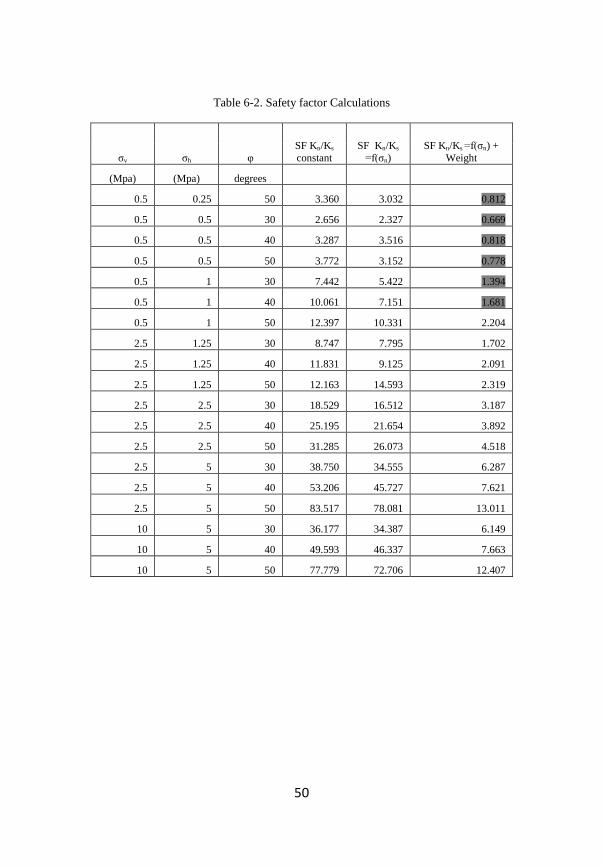
6-2. Safety factor calculations
Corresponding safety factor for the new ultimate pullout force is
calculated and it can be observed that it is much larger than the case
with lower limit of normal force calculated in the previous chapters.
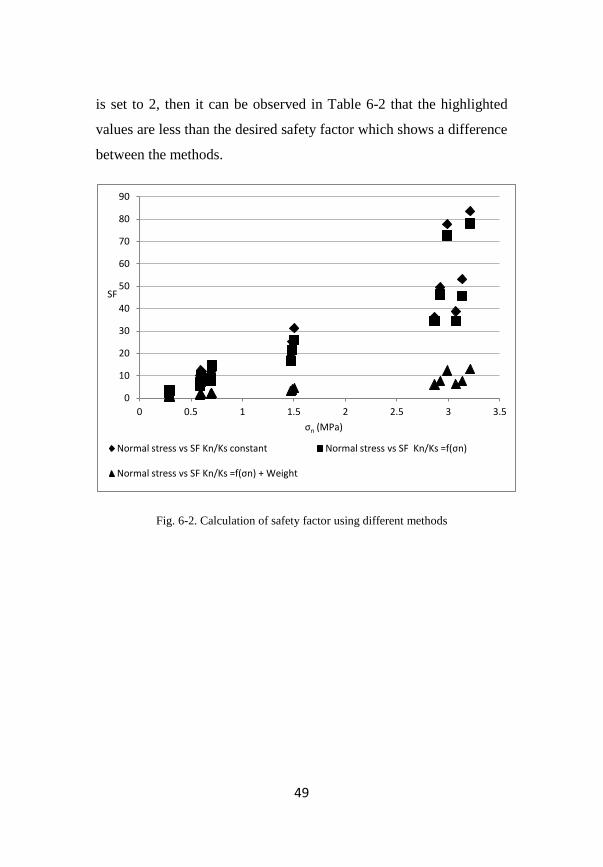
The results can be seen in Fig. 6-2, and Table 6-2. If the safety factor
49
is set to 2, then it can be observed in Table 6-2 that the highlighted
values are less than the desired safety factor which shows a difference
between the methods.
Fig. 6-2. Calculation of safety factor using different methods
0
10
20
30
40
50
60
70
80
90
0 0.5 1 1.5 2 2.5 3 3.5
Normal stress vs SF Kn/Ks constant Normal stress vs SF Kn/Ks =f(σn)
Normal stress vs SF Kn/Ks =f(σn) + Weight
SF
σn (MPa)
50
Table 6-2. Safety factor Calculations
σv σh υ
SF Kn/Ks
constant
SF Kn/Ks
=f(σn)
SF Kn/Ks =f(σn) +
Weight
(Mpa) (Mpa) degrees
0.5 0.25 50 3.360 3.032 0.812
0.5 0.5 30 2.656 2.327 0.669
0.5 0.5 40 3.287 3.516 0.818
0.5 0.5 50 3.772 3.152 0.778
0.5 1 30 7.442 5.422 1.394
0.5 1 40 10.061 7.151 1.681
0.5 1 50 12.397 10.331 2.204
2.5 1.25 30 8.747 7.795 1.702
2.5 1.25 40 11.831 9.125 2.091
2.5 1.25 50 12.163 14.593 2.319
2.5 2.5 30 18.529 16.512 3.187
2.5 2.5 40 25.195 21.654 3.892
2.5 2.5 50 31.285 26.073 4.518
2.5 5 30 38.750 34.555 6.287
2.5 5 40 53.206 45.727 7.621
2.5 5 50 83.517 78.081 13.011
10 5 30 36.177 34.387 6.149
10 5 40 49.593 46.337 7.663
10 5 50 77.779 72.706 12.407

51
52
Chapter 7
Summary and
conclusion
53
7-1. Summary and conclusions
Block stability dependens on the state of stress, stiffness and non-
linear behavior of properties of joints such as joint shear and normal
stiffness. These factors must be taken into consideration in analyzing
block.
In this thesis, block stability was analyzed with special emphasis on
joint normal and shear stiffness and influence of relaxation. The
Crawford-Bray solution is uncertain because of many simplifications
such as considering constant clamping force, and constant stiffnesses.
It can be concluded from this study that clamping force is an
important factor and it is the main cause of over-estimation of
ultimate pullout force in Crawford-Bray method. Ratio of stiffness’s
is also important as it was observed in the comparison of Kn/Ks as a
function of normal stress method and Kn/Ks constant method.
Normal stress and joint stiffness are connected to each other and
make the problem complex. It was observed that a decrease of normal
stress gives a decrease of clamping forces and an increase of stiffness
ratio which gives lower ultimate pullout force. A lower normal stress
produces design on safe side and uneconomical design. Therefore the
normal force on the joint is a dominant parameter.
The analyses shows improved estimation of ultimate pullout force and
it is safer than Bray-Crawford solution which does not take into
account the changes of joint normal and shear stiffness and clamping
force.
54
This thesis recognizes two important factors. The first one is that the
ratio of joint stiffness’s R which is very important and should not be
taken as constant but as a function of normal stress and the second
factor is clamping forces which keep on changing with respect to
normal stress. It was observed that these values have great impact on
the overall design while calculating for rock bolts.

55

56
References 1. Goodman R. Shi. G.H. 1985, Block theory and its application to rock engineering.
1st Ed. London: Prentice-Hall.
2. Miller D. R. 1979, Stability of backs walls and pillars in Dolphin Mine, King
Island, Division of Applied geomechanics, Technical rept, No 41, Commonwealth
Scientific and Industrial Research Organization, Melbourne, Australia.
3. Crawford A. M. Bray J. W. 1983, Influence of in-situ stress field and joint stiffness
on rock wedge stability in underground openings, Can Geotech. J. 20, pp 1990-2001.
4. Bandis S. C. Lumsden A. C. Barton, N. R. 1983, Fundamentals of Rock Joint
Deformation Int. J. Rock Mech. Min. Sci. & Geomech. Abstr. 20, No. 6, pp. 249-268.
5. Goodman R. Taylor R.L. and Brekke T. A model for the mechanics of jointed
rock. J. Soil Mech. Fdnd Div., Proc. Am. Soc. Civ. Engrs 94(SM3), 637-659 (1968).
6. Barton N. Choubey V. 1977, The shear strength of rock joints in theory and
practice, Rock Mechanics and Rock Engineering, 10 PP 1-54.
7. Stark, T. and Eid, H. (1998), “Performance of Three-Dimensional Slope Stability
Methods in Practice”, Journal of Geotechnical and Geoenvironmental Engineering,
Vol.124, No.11, pp. 1049-1060.
8. Bagheri M. and Stille H. 2011, New analytical solution based on joint relaxation.
Submitted to Rock mechanics & Rock engineering (under revision).
9. Elsworth D. 1986, Wedge stability in the roof of a circular tunnel:plane strain
condition, Int, J, Rock Mechanics and Mining Sci, & Geomech, Abs, 23(2), PP 181-
181.
10. Bagheri M. 2009, Model uncertainity of Design tools to analyze block stability.
11. Nomikos PP. Sofianos AI. 2008, Progressive failure of 2D symmetric roof rock
wedges, 5th Asian Rock Mechanics Symposium, Tehran.