Embed Size (px)
Citation preview

Omega 29 (2001) 473–478www.elsevier.com/locate/dsw
Analysis of advertising lifetime for mobile phone
So Young Sohn ∗, Hong ChoiDepartment of Computer Science & Industrial Systems Engineering, Yonsei University, Shinchondong 134, Seoul 120 749, South Korea
Received 15 May 2000; accepted 15 May 2001
Abstract
The market for mobile phones has increased substantially. In an attempt to maintain or increase their market share, mobilephone companies invest a signi1cant amount of their budget on advertising. In this paper, we analyze TV advertising lifetimedata of 1ve mobile phone companies in Korea. We identify the distribution of advertising lifetime and model the medianlife as a function of company-speci1c 1xed e8ects, type of advertising, the number of new customers signed for the service,and the number of new advertisements placed by the competitors. We show how the 1tted lifetime model can be applied toadvertising policy such as switching time for new advertisement. ? 2001 Elsevier Science Ltd. All rights reserved.
Keywords: TV advertising; Lifetime distribution; Switching time; Mobile phone
1. Introduction
The introduction of personal communications system(PCS) to the mobile phone market combined with thecellular phone increased the competition among existingcontenders. There is a tendency for each competing mobilephone company to employ sensational advertising schemesto attract potential customers. The main characteristics ofTV advertising for the mobile phone were the relativelyshort life expectancy due to the fast change in technologyand the format of a series of related advertising that sharesthe same theme. For marketing planners, decisions such ashow long to show an advertisement or when to turn to anewer segment of a series of advertisements were crucialamong many others in order to increase the share in theexploding mobile phone market. Yet, related research to an-alyze the distribution of advertising lifetime for the mobilephone, and to model the parameters of the life distributionwith potentially in=uential explanatory variables, has beenscarce.
∗ Corresponding author. Tel.: +82-2-2123-4014; fax: +82-2-364-7807.E-mail address: [email protected] (S.Y. Sohn).
The main purpose of this paper is to identify the advertis-ing life distributions of 1ve representational mobile phonecompanies in Korea. We not only identify the advertisinglife distributions but also model the related parameters withcompany-speci1c 1xed e8ects, a dummy variable indicatingif it is a series type or single advertisement, the number ofsubscribers, and the number of competing companies thatstarted to show new advertisements.
The organization of this paper is as follows. In Section 2,we brie=y review the related literature. In Section 3, we de-scribe two popular lifetime distributions and model relatedparameters of the advertising life distribution with covari-ates. In Section 3, we conduct an empirical data analysisand discuss the results of our study.
2. Literature review
Typical advertising literature mainly deals with thee8ect of advertising on sales. In view of our objective forthe lifetime analysis of advertising, we 1rst review the prod-uct lifetime analysis literature that can provide importantimplications for technology management and new productplanning. Bayus [1] measured product lifetimes directly
0305-0483/01/$ - see front matter ? 2001 Elsevier Science Ltd. All rights reserved.PII: S0305 -0483(01)00034 -2

474 S.Y. Sohn, H. Choi / Omega 29 (2001) 473–478
as the time between product introduction and withdrawal.Statistical analyses of desktop personal computer modelsintroduced between 1974 and 1992 were conducted at vari-ous market levels. It was assumed that the product lifetimefollows a Weibull distribution and the accelerated failuretime model was used to estimate the e8ects of three ex-planatory variables (product introduction year, 1rm entryyear, and the time before the next generation technology isavailable). The results indicated that (1) product technol-ogy and product model lifetimes have not accelerated, and(2) manufacturers have not systematically reduced the lifecycles of products within their lines. Instead, the productsof 1rms that have entered this industry in the more recentyears tend to be based on previously existing technology,and, not surprisingly, these products have lifetimes that areshorter than those of established 1rms.
Additionally, Bayus [2] found that there is no strong em-pirical support for shrinking product life cycles at the in-dustry, product category, product technology, and productmodel level, respectively.
Bayus’s model [1] is applied here to advertising lifetime,along with three covariates that would be in=uential on thevariation of the advertising lifetime for mobile phones inKorea: format of advertisement, the number of subscribers,and the competition.
This selection can be indirectly or reversely found fromthe general relationship between the marketing strategies(including advertising) and resulting performances. Typicaladvertising literature deals with how the changes in adver-tising format (length, content, and repetition) would a8ectthe performances of advertising and eventually market per-formances [3].
Erickson [4] used a dynamic model of oligopolistic ad-vertising competition, in which competitors are assumedto make a series of single-period advertising decisionswith salvage values attached to the achieved sales in eachperiod. This was the foundation for empirical analysisof the competitive situation involving the three largestready-to-eat cereal manufactures such as Kellog, GeneralMills, and the Post Division of Philip Morris’ generalFoods. The author developed two systems of equations,one representing the dynamic sales development for eachcompetitor and the e8ect of competitive advertising on suchsales development, and the other representing the formationof the period-by-period advertising expenditure decisionsof the competitors. The primary insight of the author’s em-pirical analysis is that General Mills places a higher futurevalue on the achieved sales than do the other competitorsin the market.
The advertising lifetime model can be utilized for 1ndingthe best timing of entry. Related literature includes Greenand Ryans [5] that examined the relationship between cer-tain aspects of market performance and various 1rms’ entrystrategies (e.g., the timing of entry, the magnitude and areasof investment, and the basis for competitive emphasis) intoa simulated market environment.
Putsis [6] illustrated how incentives for delaying the in-troduction of a new technology had played a major role inthe development of certain consumer electronics marketsover the past 25 years. It was shown that the introduction ofa new product that incorporates some new technology canoften be delayed until the 1rm’s need for growth exceedsthe fear of cannibalizing the 1rm’s current product line.
Balakrishnan and Hall [7] presented an analytical modelfor determining the optimal insertion timing pattern ofa long run advertisement campaign which consists of anumber of varying executions. The authors developed acomputational procedure to calculate the time between theinsertions within a pulse in order to maximize the minimume8ectiveness level at any point in time. The focus of thisprocedure is to provide conceptual insights on benchmarksolutions, which can reduce the computational burden ofsimulations, rather than on providing an exact solution. Theauthors also provided a theoretical justi1cation for the twocommon economic axioms of non-satiation and diminishingmarginal returns, in the context of an advertisement modelwith exponential forgetting.
3. Modeling advertising lifetime
An analysis of advertising life distribution is essential toidentify both the e8ects of new advertisements and turningpoints for newer advertising. Weibull, lognormal, and ex-ponential distributions are the popular ones used to analyzelife data. In this section, we brie=y introduce both lognor-mal and Weibull distributions along with their associatedregression models [8,9].
Suppose that the lifetime of advertising i (i= 1; : : : ; m)of company j (j= 1; : : : ; n); tij , follows a lognormal distri-bution with parameters �ij and 2. Then ln(tij) follows anormal distribution with mean �ij and variance 2.
ln tij ∼ N (�ij; 2); (1)
where 2 is assumed to be constant over all i and j, whilethe following regression model is assumed for �ij:
�ij = �0 + �1x1ij + · · · + �pxqij; (2)
where x1ij ; : : : ; xqij represent covariates related to the changeof �ij . Then by replacing (2) with that in (1), one can saythat
ln tij = �0 + �1x1ij + · · · + �pxqij + �ij ;
where �ij ∼ N (0; 2):(3)
From this formulation, the p × 100th percentile lifetime,tpij , can be found as
ln tpij = �0 + �1x1ij + · · · + �pxqij + z1−p; (4)
where z1−p is thep×100th percentile of the standard normaldistribution [10]. Note that the median lifetime can be found

S.Y. Sohn, H. Choi / Omega 29 (2001) 473–478 475
as follows:
ln t(0:5)ij = �0 + �1x1ij + · · · + �pxqij: (5)
Unknown parameters (�0; �1; : : : ; �p) can be estimated usingmaximum likelihood estimators which maximize the follow-ing likelihood function:m−1∏i=1
n∏j=1
f(tij:�ij; 2)[1 − F(tmj)];
where
f(tij) =1
tij√
2�exp
[−1
2
(ln tij − �ij
)2]
and
F(tij) =∫ tij
0
1
�√
2�exp
[−1
2
(ln �− �ij
)2]
d�: (6)
Note that mth observation of company j is right censoredand we use 1 − F(tmj) instead of f(tmj) in (5). When tij isassumed to follow a Weibull distribution, (1), (3) and (5) arereplaced with the following (7), (8) and (9), respectively:
ln tij ∼ Ext(�ij; 2); (7)
ln tij = �0 + �1x1ij + · · · + �pxqij + �ij ; �ij ∼ N (0; 2);(8)
where Ext represents an extreme value distribution and
f(ln tij:�ij; 2) = 1=2 exp((ln tij − �ij)=2)
− exp(ln tij − �ij)=2: (9)
4. Data analysis
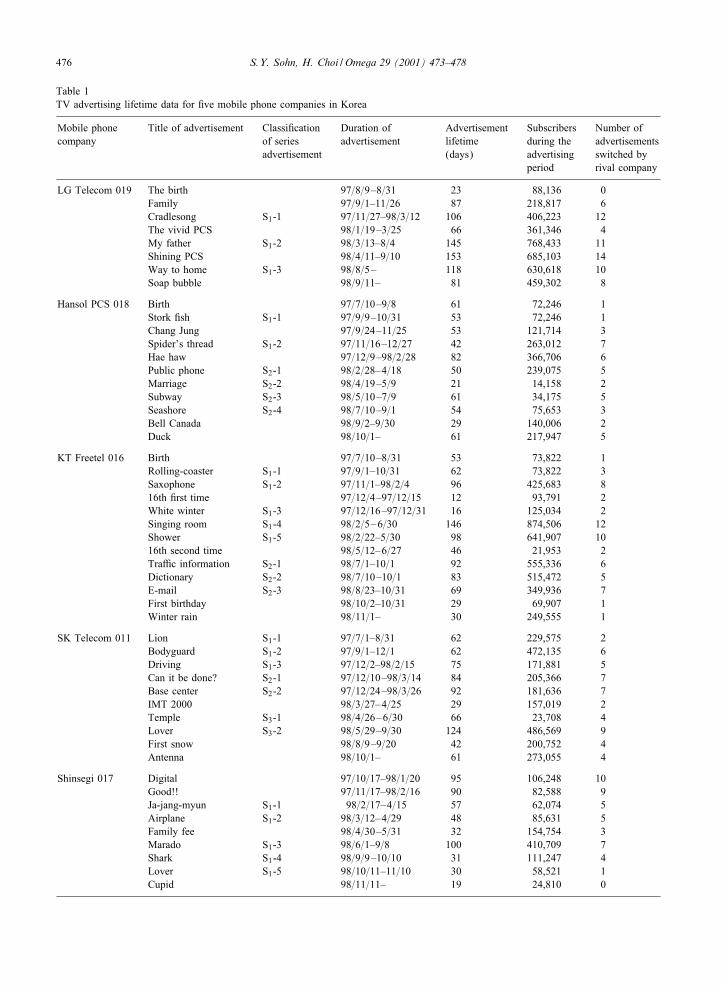
We obtained TV advertisement data of the 1ve mobilephone companies (LG, Hansol, KT-Freetel, SK-Telecom,Shinsegi) from advertising agencies LG-Advertisement andWell-Communication Co. in Korea. In this analysis, we de-1ne the advertisement life as the time between advertisementintroduction to and withdrawal from TV. Note that there arevarious other versions of de1nition of advertisement life.Another de1nition would take into account only a total ofthe real time of showing. But in this paper, the main pur-pose is to build a model by which one can infer the time fora new production of a newer advertisement. The resultinglife data are given in Table 1 along with a dummy variableindicating that it is a series or single advertisement, with thenumber of subscribers, and the number of competing com-panies that started to show a new advertisement. Note thatwe had a right censored data on November 30, 1998 andconsidered the type of advertisement whose subsequent pro-gram is not yet decided as a single advertisement instead ofa series advertisement.
Fig. 1. Lognormal probability plot of advertising lifetime for SKTelecom 011.
With this data set, 1rst, we wanted to identify the lifedistribution of advertisement for each company. We applyvarious probability plots such as Weibull, exponential, andlognormal and conclude that, at 5% signi1cance level, thelognormal distribution would be the best 1t for all 1ve com-panies. For instance, Fig. 1 shows a lognormal probabil-ity plot for advertisement lifetime of SK Telecom. For thenecessary calculation and plots, SAS PROC RELIABILITYwas used [11].
Estimated overall parameters (�; ) for each company aredisplayed in Table 2 along with the expected life and vari-ance. From the information given in Table 2, one can seethat the expected lifetime of advertisement of LG Telecomis about two times that of Hansol PCS. This re=ects the cul-ture of LG that tends to keep the old value so that it doesnot change company strategies quickly. Also it can be re-lated to the strategy of LG advertisement which concentrateson peaceful and stable family value in its advertisement. Interms of variance of advertisement life, Hansol PCS turnsout to have the smallest change re=ecting consistency ofshort advertisements. Hansol is relatively new in the mo-bile phone business and this strategy would be to keep freshimage of the company. We also obtained both 50th and90th percentiles advertisement life of all the 1ve companies.Except for Hansol PCS, 90th percentile lifetime of the re-maining four companies exceeds 100 days. It is interestingto note that half of mobile phone advertisements last about2 months except for LG Telecom.
This kind of information can be disaggregated over thedi8erent modes of advertisement. That is one can obtain theaverage and variance of advertisement lifetime by advertise-ment mode (single verses series). In general, it is expectedthat the average lifetime of series advertisement would be
476 S.Y. Sohn, H. Choi / Omega 29 (2001) 473–478
Table 1TV advertising lifetime data for 1ve mobile phone companies in Korea
Mobile phone Title of advertisement Classi1cation Duration of Advertisement Subscribers Number ofcompany of series advertisement lifetime during the advertisements
advertisement (days) advertising switched byperiod rival company
LG Telecom 019 The birth 97=8=9–8=31 23 88,136 0Family 97=9=1–11=26 87 218,817 6Cradlesong S1-1 97=11=27–98=3=12 106 406,223 12The vivid PCS 98=1=19–3=25 66 361,346 4My father S1-2 98=3=13–8=4 145 768,433 11Shining PCS 98=4=11–9=10 153 685,103 14Way to home S1-3 98=8=5– 118 630,618 10Soap bubble 98=9=11– 81 459,302 8
Hansol PCS 018 Birth 97=7=10–9=8 61 72,246 1Stork 1sh S1-1 97=9=9–10=31 53 72,246 1Chang Jung 97=9=24–11=25 53 121,714 3Spider’s thread S1-2 97=11=16–12=27 42 263,012 7Hae haw 97=12=9–98=2=28 82 366,706 6Public phone S2-1 98=2=28–4=18 50 239,075 5Marriage S2-2 98=4=19–5=9 21 14,158 2Subway S2-3 98=5=10–7=9 61 34,175 5Seashore S2-4 98=7=10–9=1 54 75,653 3Bell Canada 98=9=2–9=30 29 140,006 2Duck 98=10=1– 61 217,947 5
KT Freetel 016 Birth 97=7=10–8=31 53 73,822 1Rolling-coaster S1-1 97=9=1–10=31 62 73,822 3Saxophone S1-2 97=11=1–98=2=4 96 425,683 816th 1rst time 97=12=4–97=12=15 12 93,791 2White winter S1-3 97=12=16–97=12=31 16 125,034 2Singing room S1-4 98=2=5–6=30 146 874,506 12Shower S1-5 98=2=22–5=30 98 641,907 1016th second time 98=5=12–6=27 46 21,953 2TraPc information S2-1 98=7=1–10=1 92 555,336 6Dictionary S2-2 98=7=10–10=1 83 515,472 5E-mail S2-3 98=8=23–10=31 69 349,936 7First birthday 98=10=2–10=31 29 69,907 1Winter rain 98=11=1– 30 249,555 1
SK Telecom 011 Lion S1-1 97=7=1–8=31 62 229,575 2Bodyguard S1-2 97=9=1–12=1 62 472,135 6Driving S1-3 97=12=2–98=2=15 75 171,881 5Can it be done? S2-1 97=12=10–98=3=14 84 205,366 7Base center S2-2 97=12=24–98=3=26 92 181,636 7IMT 2000 98=3=27–4=25 29 157,019 2Temple S3-1 98=4=26–6=30 66 23,708 4Lover S3-2 98=5=29–9=30 124 486,569 9First snow 98=8=9–9=20 42 200,752 4Antenna 98=10=1– 61 273,055 4
Shinsegi 017 Digital 97=10=17–98=1=20 95 106,248 10Good!! 97=11=17–98=2=16 90 82,588 9Ja-jang-myun S1-1 98=2=17–4=15 57 62,074 5Airplane S1-2 98=3=12–4=29 48 85,631 5Family fee 98=4=30–5=31 32 154,754 3Marado S1-3 98=6=1–9=8 100 410,709 7Shark S1-4 98=9=9–10=10 31 111,247 4Lover S1-5 98=10=11–11=10 30 58,521 1Cupid 98=11=11– 19 24,810 0

S.Y. Sohn, H. Choi / Omega 29 (2001) 473–478 477
Table 2Parameter estimates of the distribution of advertising lifetime
Mobile phone Parameter E(T ) Var(T ) T50; T90company estimates (MTTF)
LG Telecom 019 �= 4:5194 109.96 24.12 92:1; 198:32= 0:6013
Hansol PCS 018 �= 3:9069 53.63 6.68 50:3; 81:83= 0:3877
KT Freetel 016 �= 4:0092 71.43 13.85 55:2; 138:72= 0:7205
SK Telecom 011 �= 4:2110 73.09 9.97 67:03; 112:82= 0:4016
Sinshegi 017 �= 3:9867 60.61 10.59 54:11; 100:31= 0:4852
Table 3MTTF by advertisement mode (days)
Mobile phone Series Singlecompany advertisement advertisement
nt nt
LG Telecom 019 123 82Hansol PCS 018 47 57KT Freetel 016 83 34SK Telecom 011 81 44Sinshegi 017 53 59
relatively short compared to that of a single advertisement.Apparently, our expectation does not seem to apply to all1ve companies, according to the observed pattern given inTable 3.
The lifetime of advertisements may be related to thenumber of subscribers. We would expect that companieswould try to extend the advertisement life when the num-ber of subscribers increases, while it may want to switchto a newer advertisement when the performance of adver-tisement is not felt strong enough. But in view of asymp-totic behavior, this relation would not be linear. What wereavailable to us was monthly subscriber statistics and weadjusted these statistics in order to obtain the number ofsubscribers added during the period of TV advertisementshowing when it encompasses more than 1 month. For in-stance, LG Telecom’s advertisement entitled ‘Family’ wasshowing on TV during September 1–November 26. We cal-culated the total number of subscribers as 88,136 (numberof subscribers in September and October) + 150; 786 (thatof November)×(26=30) = 218; 817. Subsequently, obtainedsubscriber information for other advertisements are given inTable 1.
Additionally, one may want to switch to a newer adver-tisement when its competitor puts a new advertisement onTV. But there would be the minimum running time for theold advertisement. In consideration of this kind of associ-
ation, next, we 1t the following regression model relatingthe advertisement lifetime with the mode of advertisement,the number of subscribers and the competition adjusted byadvertisement life along with dummy variables representingcompany di8erences.
ln tij = �0 +5∑j=2
�0jDj + �1x1ij + �2x2ij + �3x22ij
+ �4x3ij + �5x32ij + �ij ; where �ij ∼ N (0; 2);
(10)
D2 : : : D5 represent dummy variables for Hansol, KT, SKTelecom and Shinsegi respectively, setting LG as a refer-ence group. Additionally, x1ij is a dummy variable repre-senting 1 if the mode of advertisement i of company j is nota series type, otherwise 0; x2ij is the number of subscribersof advertisement i of company j divided by the correspond-ing advertisement lifetime; and x3ij is the lifetime adjustednumber of new advertisement made by competitors duringadvertisement i of company j when it was shown.
We 1tted model (10) using information collected in Table1 and the results are displayed in Table 4.
First of all, signi1cantly shorter median advertising life-times are found in Hansol and Shinsegi compared to LG. KTand SK did not show signi1cant di8erences from LG. Thisinterpretation is based on p-values associated with dummyvariables representing each company. SK, KT and LG arethe largest three contenders in Korean mobile phone servicemarket and they may follow the similar fashion in adver-tising life. According to the p-value involved in �1, singletype of advertising tends to have short median life than aseries type but the di8erence is not signi1cant at 5% level.
On the contrary, to our expectation, advertisement lifeturns out to have an insigni1cant relationship with the num-ber of subscribers adjusted by advertisement age. However,as far as competition is concerned, it appears to have a signif-icant negative second-order relationship with advertisementlife. But, in this case, a turning point comes fast due to alarge coePcient in the second-order term. This phenomenon

478 S.Y. Sohn, H. Choi / Omega 29 (2001) 473–478
Table 4Fitted regression model for advertising lifetime of mobile phone
Variable Parameter Std error p-valueestimates
Intercept (1xed e8ects of LG Telecom) 3.438912 0.3414156 0.0001�02 (1xed e8ects of Hansol) − 0:479291 0.2247412 0.0390�03 (1xed e8ects of KT) − 0:360343 0.2358108 0.1342�04 (1xed e8ects of SK Telecom) − 0:431367 0.2265756 0.0640�05 (1xed e8ects of Shinsegi) − 0:581559 0.2442502 0.0220�1 (single ad) 0.264674 0.1393619 0.0646�2 (subscribers) 0.000154 0.0001231 0.2173�3 (square term of subscribers) − 2:3917E-8 0.0000002 0.1326�4 (competitors) 22.029819 5.8380748 0.0005�5 (square term of competitors) −137:74931 35.896939 0.0004
can be interpreted as follows: initially advertisement life in-creases with increasing number of competitors’ advertise-ment, but this pattern changes quickly so that the life tendsto decrease with increasing competition. This shows that thecompany would be reluctant to put away their new advertise-ment until a certain amount of competition is accumulated.
Finally, we show how the 1tted model can be utilizedto estimate the residual life of advertisement. For instance,let us consider the non-series advertisement ‘But thereis 011’ of SK Telecom. Suppose that this advertisementwas shown for 1 month and attracted 97,710 subscribers(x2 = 3257 subscribers per day) while we observed about2 competitors switching to new advertisement during thatperiod (x3 = 0:066 competitors per day). Now we estimatethe median life to be about 80 days using Table 4.
tmedian = exp[3:438912 − 0:431367 + {0:264674 × 1}+ {(−2:3917 × 10−8) × (3257)2
+0:000154 × (3257)}+ {(−137:749313) × (0:066)2
+22:029819 × (0:066)}] = 79:435:
Therefore, the residual life can be calculated as 50 days,suggesting the possibility for preparation for the new adver-tisement for switch.
5. Discussion
In this research, we identify the advertisement lifetimedistribution of the 1ve mobile phone companies in Korea.Lognormal distribution turns out to provide a good 1t forour data. We then model log lifetime as a function of somepotentially in=uential covariates such as company speci1ce8ects, advertisement mode, the number of subscribers ad-justed by the age of advertisement, and the number of newadvertisements shown by competitors. We then apply the 1t-ted model for forecasting the residual life of advertisement.
This information is crucial in deciding the best timing forlaunching new advertisement in a competitive environment.Cost information was not released to us for the analysis eventhough it was necessary to add information such as the qual-ity of advertisement and advertisement cost to the regres-sion model in order to improve the prediction capability ofthe model. We expect that our approach can be further uti-lized when advertising agency is more cooperative in termsof releasing the data needed in such modeling.
References
[1] Bayus BL. An analysis of product lifetimes in atechnologically dynamic industry. Management Science1998;44(6):763–75.
[2] Bayus BL. Are product life cycles really getting shorter.Journal of Product Innovation Management 1994;11(4):300–8.
[3] Singh SN, Cole C. The e8ects of length, content, and repetitionon television commercial e8ectiveness. Journal of MarketingResearch 1993;30(2):91–104.
[4] Erickson GM. Advertising strategies in a dynamic oligopoly.Journal of Marketing Research 1995;32(2):233–7.
[5] Green DH, Ryans AB. Entry strategies and marketperformance causal modeling of a business simulation. Journalof Product Innovation Management 1990;7(1):45–58.
[6] Putsis Jr WP. Why put o8 until tomorrow what you can dotoday: incentives and the timing of new product introduction.Journal of Product Innovation Management 1993;10(3):195–203.
[7] Balakrishnan PV, Hall NG. Maximin procedure for the optimalinsertion timing of advertisement executions. EuropeanJournal of Operational Research 1995;85(2):368–82.
[8] Elsayed EA. Reliability engineering. Reading, MA:Addison-Wesley, Longman Inc., 1996.
[9] Meeker WQ, Escobar LA. Statistical method for reliabilitydata. New York: Wiley Interscience, 1998.
[10] Sohn SY. Application of degradation test data to advertisementof consumer electronic products. Reliability Engineering andSystem Safety 2000;67:317–20.
[11] SAS Institute, SAS=STAT User’s Guide 6.03. SAS Institute,Cary, NC, 1988.