Embed Size (px)
Citation preview

Analyses of Consumers’ Dietary Behavior:An Application of the AIDS Modelto Supermarket Scanner Data
Eugene JonesDepartment of Agricultural, Environmental, and Development Economics,The Ohio State University, 2120 Fyffe Road, Columbus, OH 43210.E-mail: [email protected]
Cuma AkbayDepartment of Agricultural Economics, Sutcu Iman University,Kahraman Maras, Turkey
Brian RoeDepartment of Agricultural, Environmental, and Development Economics,The Ohio State University, 2120 Fyffe Road, Columbus, OH 43210
Wen S. ChernDepartment of Agricultural, Environmental, and Development Economics,The Ohio State University, 2120 Fyffe Road, Columbus, OH 43210
ABSTRACT
Nationwide food consumption surveys often find no difference in the diets of lower and higherincome Americans, while studies of particular food commodities find major differences+ Thesecontrasting results represent a consumption paradox+ We attempt to gain an understanding of thisparadox by using supermarket scanner data to examine food purchases and, by extension, consump-tion patterns for consumers in two, geographically distinct, income areas+ These areas are part ofthe larger Columbus, OH, metropolitan area ~CMA! and six stores are selected for purchase andconsumption analyses—three from the lowest income areas of the CMA and three from the highestincome areas+ Seven product categories are analyzed in this study and these categories are sub-divided into meaningful nutritional classes+An Almost Ideal Demand System is employed and theempirical results reveal major differences in consumption behavior for the two groups+ @EconLitcitations: D120 and D190+# © 2003 Wiley Periodicals, Inc+
1. INTRODUCTION
Research on selected food commodities has revealed widely different consumption pat-terns for consumers with different levels of income+ For example, several studies on milkhave reported widespread and heavy use of whole milk among lower income consumers,but limited use of whole milk and heavy uses of skim and low-fat milk among higherincome consumers ~Jones & Akbay, 2000; Reger, 1998; Zho, Chern, & Jacobson, 1996!+
Agribusiness, Vol. 19 (2) 203–221 (2003) © 2003 Wiley Periodicals, Inc.Published online in Wiley InterScience (www.interscience.wiley.com). DOI: 10.1002/agr.10050
203

Similarly, higher income consumers have been shown to express a stronger preferencefor fresh fruits and vegetables,more nutritious types of breakfast cereals, and low-caloriebeer and soft drinks ~Akbay, 2000; Eastwood, 1997; Jones, 1997; Jones,Mustiful,& Chern,1994; The Packer, 1997–2001!+ These results, when extrapolated, suggest a more nutri-tious diet for higher income consumers+ Yet, food nutritionists have used comprehensivedata sets to assess consumers’ diets and these data analyses show little to no nutritionaldifference in the diets of higher and lower income consumers ~Murphy & Bayer, 1998;Murphy, Rose, Hudes, & Viteri, 1992!+ The confluence of these results is a paradox inwhich the sum ~total diet! seems unrelated to its collective parts ~selected commodities!+How can this be? And how can this paradox be resolved?
This study uses supermarket scanner data to examine food shopping behavior and con-sumption patterns for consumers in the metropolitan area of Columbus, OH+ Data fromsix supermarkets are used in these analyses+ Three stores are selected from the lowestincome areas of Columbus and three are selected from the highest income areas+ Theseselections form the basis for the overall premise of this research+ Stores in the lowestincome areas attract a larger proportion of lower income shoppers and are therefore ex-pected to reveal purchase and consumption behavior that is characteristic of lower in-come consumers+ Likewise, stores in the highest income areas attract a larger proportionof higher income shoppers and are therefore expected to reveal purchase and consump-tion behavior that is characteristic of higher income consumers+
Supermarket scanner data provide an alternative for simultaneously assessing consum-ers’ behavior with respect to individual commodities and total diets+ Retail stores aretypically organized into 60 or more food and nonfood categories, such as baked breads,canned fruits, canned vegetables, frozen potatoes, and paper products+ Analyses for aselected group of food categories will provide an assessment of consumer behavior forthese specific categories; analyses for all food categories will provide an assessment ofconsumer behavior for a total diet+ This research examines the consumption behavior ofconsumers within two distinct geographic areas: one with a large proportion of lowerincome consumers ~described as below $50,000 majority in household income!, and onewith a large proportion of higher income consumers ~described as above $50,000 major-ity in household income!+ Seven product categories are included in these analyses: break-fast cereals, cooking oils and shortening, fluid milk, ice cream,mayonnaise, salty snacks,and salad dressings+1 Selection of these categories was motivated partly by the ease inwhich nutritional contents could be used to distinguish product classes, but also by adesire to capture categories that represent frequent purchases for consumers at all incomelevels+
To help guide this discussion of consumer behavior, the remaining parts of this articleare organized into five sections+ Section II provides a discussion of: ~a! product catego-ries and classes; ~b! supermarket scanner data; and ~c! some of the socioeconomic char-acteristics of supermarket shoppers within the two geographic areas+ Section III presentsthe Almost Ideal Demand System ~AIDS! and its concomitant set of demand equationsthat is estimated to derive the empirical results+ Section IV provides a discussion of somedescriptive statistics that illuminate differences in the behavior of consumers for the twogeographic and income areas+ Section V provides a discussion of empirically estimated
1Salad dressings consist of two types: pourable and semisolids+ Semisolids are more comparable to mayon-naise, and these products have therefore been combined with mayonnaise+ For discussion purposes, these com-bined products are identified as mayonnaise+
204 JONES ET AL.
own-price elasticities and this discussion highlights important relationships among elas-ticities and per unit prices paid by shoppers in the two groups+ Section VI ends the articlewith a summary and conclusions+
2. PRODUCT CLASSES, SCANNER DATA, ANDSOCIOECONOMIC CHARACTERISTICS
Given the nutritional focus of this article, it is imperative that each product category besegmented into nutritional classes that are meaningful for research+ As consumers ex-press their product preferences through purchases, many supermarket managers have be-gun to identify product classes within product categories and then build promotionalstrategies around these classes+ For example, supermarkets classify pourable salad dress-ings into fat-free, light, and regular classes and a promotional strategy for a given weekmay focus on all products within one of these classes+ For this research, supermarketmanagers ~from a leading grocery chain that provided the scanner data! have provided alisting of product brands that fall into each class+ These lists and classes were used as astarting point to identify product classes+ Additional information was gained from theexamination of many product labels and several nutritional studies, especially when alarge number of new or lesser-known products were encountered in a given category+From nutritional studies, the health attributes of calories, cholesterol, fat ~monounsatu-rated, polyunsaturated, and saturated!, fiber, sodium, and sugar were identified as beingmost relevant for classifying products in the aforementioned categories+ A total of 32product classes were identified from the seven categories and these are shown in Table 1+
Table 1 shows that some product categories suggest their own classes+Milk, for exam-ple, suggests product classes based on its fat content: 0% ~skim!, 102%, 1%, 2%, 3+25%~whole!, and an “all other” or “unclassified” class that consists mainly of flavored andlactose products+ Both fat and cholesterol are used to segment brands of ice cream into sixproduct classes+ Similarly, fat, cholesterol and calories are used to segment salad dress-ings into six product classes—three for pourable salad dressings, and three for mayon-naise+A premise of this study is that these 32 classes will reveal widely different purchasingpatterns for the two groups of consumers+ Results consistent with resolving the afore-mentioned paradox would reveal higher levels of purchases of some healthy product classesby the below $50,000 majority+
The scanner data for this research are collected from a national supermarket chain inthe Columbus, OH, metropolitan area ~CMA!+ Data are available for a large number ofeconomically diverse and geographically dispersed stores+ These data represent weeklyobservations, and they consist of product sales, prices, units sold, customer counts, andtotal store sales+ Product sales cover many package sizes and many product varieties+Considerable computation is required to transform these disaggregated units into recog-nizable data observations+ The supermarket chain maintains data for 65 weeks beforediscarding it; hence, approximately five quarters of data are available to conduct thisresearch+ Despite the ready availability of scanner data, it is recognized that consumersdo not purchase all of their food at supermarkets+ Away-from-home food consumptionrepresents approximately 40% of food expenditures ~Blisard, 2000!+ Yet, given the factthat away-from-home foods are known to contain more nutrients that adversely impactconsumers’ health, such as fat and saturated fat, it is likely that at-home food consump-tion provides the most relevant measure of diet comparisons ~Lin, Frazao, & Guthrie,1999!+
ANALYSIS OF CONSUMER DIETARY BEHAVIOR 205

The selected stores are identified from socioeconomic information provided by thechain for all residents within a 3-mile radius of each store+As shown in Table 2, stores 1,2, and 3 are located in areas that have large proportions of lower income shoppers ~69%of households have incomes below $50,000!, while stores 4, 5, and 6 are located in areasthat have large proportions of higher income shoppers ~58% of households have incomes
TABLE 1+ Segmentation of Product Categories intoProduct Classes
Product Category and ClassIdentifying ProductCharacteristic
MilkSkimOne-half percentOne percent FatTwo percentWholeAll other
Ice creamRegularPremium Fat andSuper premium cholesterolRegular healthyPremium healthySuper premium healthy
Salad dressingFat free FatLow fat cholesterol andRegular calories
MayonnaiseFat free FatLow fat cholesterol andRegular calories
Breakfast cerealsHealthyModerately healthy FatHot cereals fiber andSnack cereals sugar
Salty snacksHealthy Fat andModerately healthy sodiumRegular
Cooking oilsCanolaOliveCornVegetable Monounsaturated fat andShortening saturated fatStick-free sprayAll other
206 JONES ET AL.

above $50,000!+ Also reflected in Table 2 is the large disparity in the under $10,000 in-comes for the two groups+ Twelve percent of the households surrounding stores 1, 2, and3 have incomes below $10,000, as compared to just 4% of the households surroundingstores 4, 5, and 6+ With respect to education, college graduates represent an average of38% of the prospective shoppers for stores 4, 5, and 6, but just 10% of the prospectiveshoppers for stores 1, 2, and 3+ Relative to race, stores with large proportions of lowerincome shoppers are shown to have more heterogeneous populations than stores withlarge proportions of higher income shoppers+ These and other socioeconomic factors arelikely to influence consumer purchase decisions and help focus the contrast between thediets of consumers with higher and lower incomes+
3. THEORETICAL AND EMPIRICAL MODEL
Deaton and Muellbauer ~1980a, 1980b! have shown that that the Almost Ideal DemandSystem ~AIDS! generates a system of demand equations that is consistent with neoclas-sical consumer theory+ The AIDS model has its roots in duality theory and multistagebudgeting, and it is most useful for providing insight into the process consumers use toallocate expenditures first among food groups and then among products within food groups+Researchers have used the model extensively and have made many modifications to im-prove its empirical usefulness ~Blanciforti & Green, 1983; Chafant, 1987; Moschini &Meilke, 1989; Seale, Sparks, & Baxton, 1992!+ As used in this study, the AIDS modelprovides a complete set of demand parameters for seven categories of food products:breakfast cereals, cooking oils and shortening, fluid milk, ice cream, salty snacks, may-onnaise, and pourable salad dressings+
TABLE 2+ Household Demographic Data for Six Stores ~by Percentage!
Below $50,000 Majority Above $50,000 Majority
DemographicInformation
Store1
Store2
Store3 Average
Store4
Store5
Store6 Average
Household incomeUnder $10,000 13+8 12+9 9+3 12+0 3+8 5+0 3+8 4+2$10,000– 49,999 57+6 58+3 54+1 56+7 32+8 41+8 37+7 37+4$50,000–74,999 18+5 18+2 22+4 19+7 27+4 20+9 24+6 24+3$75,000–99,999 6+5 6+3 8+4 7+1 17+5 12+1 15+3 15+0$100,000 � 3+8 4+3 5+9 4+7 18+8 20+2 18+2 19+1
RaceWhite 59+2 83+6 85+7 76+2 95+4 92+4 93+1 93+6Black 38+6 14+4 12+1 21+7 2+3 3+2 5+0 3+5Others 2+1 2+0 1+8 2+0 2+6 4+6 1+9 3+0
EducationGrade school 7+3 10+0 11+1 9+5 4+1 2+0 2+5 2+9Some high school 21+3 25+4 25+8 24+2 11+6 5+0 8+6 8+4High School graduate 33+5 36+7 37+6 35+9 28+2 16+2 27+0 23+8Some college 24+3 19+2 17+8 20+4 26+2 26+6 28+2 27+0College graduate 13+8 8+8 7+5 10+0 29+9 50+6 33+5 38+0
Source: Spectra, 2001+
ANALYSIS OF CONSUMER DIETARY BEHAVIOR 207
Each category of products is segmented into product classes, but at the first budgetingstage, consumers are assumed to allocate their budgets among seven categories+ At thesecond budgeting stage, consumers allocate expenditures among product classes withina category, and this process is consistent with the assumption of weak separability+ Toprovide a complete demand system, an “all other category” equation is added to eachdemand system and this equation consists of all categories except the category underconsideration+2 For example, in deriving empirical estimates for classes of breakfastcereals, an “all other category” consists of cooking oils and shortening, fluid milk, icecream, salty snacks, mayonnaise and pourable salad dressing+
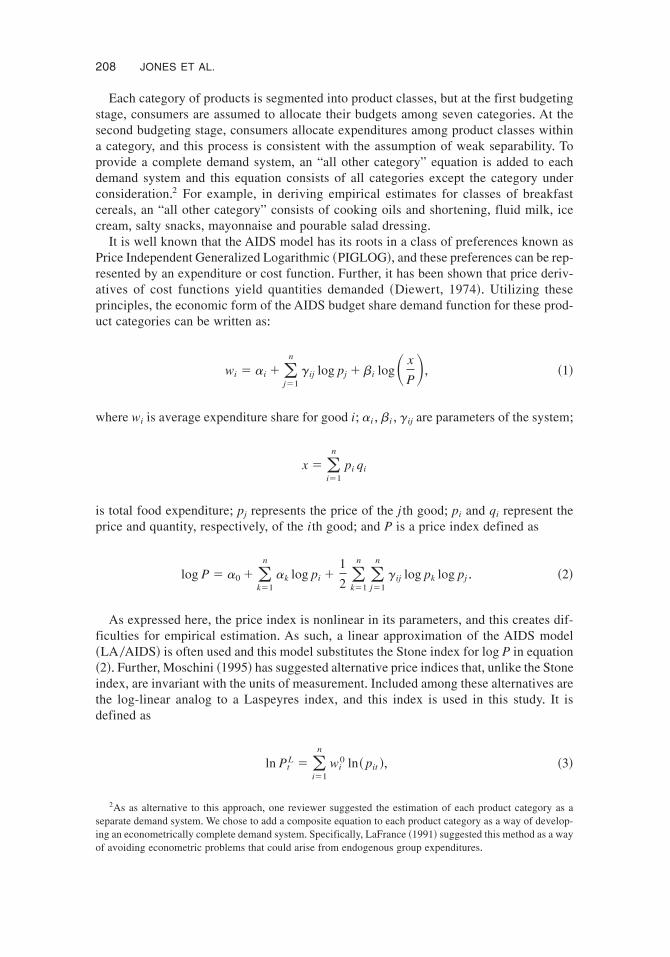
It is well known that the AIDS model has its roots in a class of preferences known asPrice Independent Generalized Logarithmic ~PIGLOG!, and these preferences can be rep-resented by an expenditure or cost function+ Further, it has been shown that price deriv-atives of cost functions yield quantities demanded ~Diewert, 1974!+ Utilizing theseprinciples, the economic form of the AIDS budget share demand function for these prod-uct categories can be written as:
wi � ai �(j�1
n
gij log pj � bi log� x
P�, ~1!
where wi is average expenditure share for good i; ai , bi , gij are parameters of the system;
x � (i�1
n
pi qi
is total food expenditure; pj represents the price of the j th good; pi and qi represent theprice and quantity, respectively, of the ith good; and P is a price index defined as
log P � a0 � (k�1
n
ak log pi �1
2 (k�1
n
(j�1
n
gij log pk log pj + ~2!
As expressed here, the price index is nonlinear in its parameters, and this creates dif-ficulties for empirical estimation+ As such, a linear approximation of the AIDS model~LA0AIDS! is often used and this model substitutes the Stone index for log P in equation~2!+ Further,Moschini ~1995! has suggested alternative price indices that, unlike the Stoneindex, are invariant with the units of measurement+ Included among these alternatives arethe log-linear analog to a Laspeyres index, and this index is used in this study+ It isdefined as
ln PtL � (
i�1
n
wi0 ln~ pit !, ~3!
2As as alternative to this approach, one reviewer suggested the estimation of each product category as aseparate demand system+We chose to add a composite equation to each product category as a way of develop-ing an econometrically complete demand system+ Specifically, LaFrance ~1991! suggested this method as a wayof avoiding econometric problems that could arise from endogenous group expenditures+
208 JONES ET AL.

where wi0 is the expenditure share of good i in the base period and pit is the price of good
i in the period t+ This index has been shown to perform well in Monte Carlo experiments~Buse & Chan, 2000!3, and it solves the problem of endogeneity ~Chern, 1999!+ Sometheoretical restrictions that are derived from utility theory and directly imposed upon theparameters in equation ~1! are:
Siai � 1, Si gij � Si bi � 0, and gij � gji + ~4!
These restrictions are known as the adding-up condition, homogeneity, and Slutskysymmetry+ Critical to the full development of the AIDS model with scanner data are thederivation of prices and the incorporation of demographic variables+ Prices are derived byexpressing each product sale as a ratio of all product sales within a given product class+That is, weighted prices are derived for each product class i during each time period+Mathematically,
Pi �(j
Wij Pij , where Wij � Pij Qij�(j
Pij Qij ~5!
and j denotes the products in a particular class+ Given the many brands and package sizesthat are represented by scanner data, it is important to emphasize that all brands andpackage sizes within a given product class are converted to a common unit of measure-ment, for example, gallons or ounces+ Prices are then calculated, but weighted by thenumber of units sold+As an illustration, skim milk consists of both store and other brandsof milk of various sizes ~e+g+, pint, quart, half gallon, and gallon!+ A weighted price ~Pi !is calculated for this class of milk and the relevant weights represent ratios of productsales for a given size and brand to total skim milk sales+
Still missing from equation ~1! is the inclusion of demographic variables+ Given theinfluence of demographic and noneconomic factors on consumer behavior, it is natural toextend the AIDS model to incorporate these factors+ This objective is accomplished byemploying a demographic translating method, as proposed by Pollak and Wales ~1978,1980!+ To include the effects of demographic and noneconomic variables, price coeffi-cients of the expenditure function are assumed to depend on demographic variables+ Theintercept term, ai , in equation ~1!, is assumed to be a linear function of the followingdemographic attributes: product promotion, calendar holidays, time trend, pay periods,customer counts, lagged expenditure share, store differences, seasonality, and product0promotion interactions+ These variables are deemed to be relevant for supermarket scan-ner data and they can be incorporated into the LA0AIDS model by specifying:
ai � ai*�(
j�1
N
dij Dj , ~6!
3Buse and Chan ~2000! conclude that all indices that are substituted for the true index in the AIDS modelproduce biased and inconsistent estimators+ However, for a linear AIDS model with positive collinearity amongprice data, Buse and Chan found the Laspeyres index to outperform other indices in terms of bias alone+Addingvariance to the picture in the face of collinear price data, the Laspeyres index proved to be almost equallyranged with the top-performing Tornquist index+ Hence, given our specification fo a LAIDS model with timeseries data and positive price colinearity, our use of the Laspeyres index seems to be a prudent selection+
ANALYSIS OF CONSUMER DIETARY BEHAVIOR 209

where Dj are demographic attributes, ai* is the intercept net of demographic effects, and
dij are the parameters associated with Dj + Equation ~6! can be rewritten as:
ai � ai*� di1 PRt � di2 Ht � di3Tt � di4 PAYt � di5 Countt � (
h�1
m
dihWh~t�1!
� (s�1
2
dis SDst � (k�1
11
dik Skt � (m�1
n
dim Imt , ~7!
where PRt is product promotion, representing the number of products in a given productclass that receives discount pricing during week t; Ht is a zero-one dummy variable thatcaptures the effect of calendar holidays; Tt is a trend variable intended to capture growthof product sales; PAYt is nearness to pay periods ~1 for weeks including the first and 15thof each month; 0 otherwise!; Countt is the total number of shopping customers per week,and it is intended to capture the effects of store traffic on food purchases; Wj~t�1! is thelagged expenditure share of good j; SDst is a dummy variable intended to capture differ-ences between stores; Skt is the monthly seasonal dummy variable to capture monthlyseasonal effects; and Imt is a variable that captures interaction between product price andproduct promotion+ Note that the original nonlinear AIDS model is difficult to estimatebecause of a large number of demographic variables+ Furthermore, Alston, Cholfant, &Piggott ~2001! point out that use of linear translation in the LA0AIDS model does notviolate the invariance property with respect to the unit of measurement+ The violationoccurs in the AIDS, not the LA0AIDS+
Incorporating equation ~7! into equation ~1! and following standard procedures of ap-plying Hotelling-Shephard Lemma and logarithmetic differentiation to the extended AIDScost function, the demand function in budget share form becomes:
Wit � ai*� di1 PRt � di2 Ht � di3Tt � di4 PAYt � di5 Countt �(
j�1
n
dij Wj~t�1!
� (s�1
2
dis SDst �(k
11
dik Skt �(m
n
dim Imt �(j�1
n
gij log pjt � bi Log� X
P *�� eit , ~8!
where P* is the Laspeyres price index; X is total expenditure; ai* represents the budget
share when all logarithmic prices, expenditure, and noneconomic factors are zero; gi , di ,and bi are model parameters to be estimated, and eit is an error term+
It should be noted that equation ~8! does not include measures of income, cross-category prices, and competitor prices+ Data for these variables could not be obtained,and these omissions should have minimum impact on the results if the assumption holdsthat utility for each category is weakly separable from other categories+ This assumptionapplies for categories within a particular store as well as for categories across stores+Applying these assumption in the model specification means that uncompensated or Cournotown-price elasticities can be calculated as a function of three factors: budget share, co-efficient of expenditure and coefficient of own-price ~Chalfant, 1987!+More specifically,the formula is given as:
210 JONES ET AL.

1 �gij
wi� bi , ~9!
where gii is the coefficient of own-price, bi is the coefficient of expenditure, and wi is thebudget share+
Because this study uses retail-level demand equations for a group of frequently pur-chased related food products, it is reasonable to expect errors across equations to be highlycorrelated+ This type of correlation is known as contemporaneous correlation ~Zellner,1962!+ For food products, this correlation can be due to many factors+ Some of the morecommon ones are the general level of economic activity, competitors’ actions, prices ofother products within a retail firm, and omitted factors ~Capps, 1989!+When contempo-raneous correlation exists, it has been shown that it is more efficient to estimate all equa-tions jointly, rather than estimate each one separately with least squares ~Judge et al+,1988; Zellner, 1962, 1963!+ For this study, a system of demand equations for each com-modity category is estimated independently for each income group+
Zellner ~1962! has shown that seemingly unrelated regression ~SUR! is one of the mostefficient methods for estimating demand models+ Because the budget shares sum to onein the AIDS model, the contemporaneous covariance matrix of disturbance terms is sin-gular+ This singularity of the system leads to estimation by an iterative SUR estimationtechnique+ This method requires the exclusion of one equation, which is chosen to be thecategory for “all other goods” because it has the highest market share+ The iterative SURestimators are equivalent to maximum likelihood estimators as long as the error termshave a multivariate normal distribution ~Judge et al+, 1988!+ Excluding one equation fromthe system automatically satisfies the adding-up restriction, but homogeneity and sym-metry restrictions are imposed in the estimation procedures+
4. INSIGHTS FROM DESCRIPTIVE STATISTICS
The descriptive statistics of Table 3 provide quantity shares and unit prices for the twogroups of shoppers and these data reveal insight into their purchase and consumptionbehavior+Most revealing among the seven categories is the widely different consumptionpatterns for milk+ Low-fat milk ~skim, 102 and 1%! constitutes just 18% of milk con-sumption for shoppers in the below $50,000 majority area, but 48% of milk consumptionfor shoppers in the above $50,000 majority area+ By contrast, whole milk represents 42%of milk consumption for the former group, but just 13% of milk consumption for thelatter group+ Unit prices show that shoppers within the below $50,000 majority areas payconsistently lower prices and these price differences, as measured by z-tests of meandifferences, are statistically significant for all but 102% milk+Given uniform prices acrossstores, this suggests a type of utility maximization in which consumers with lower in-comes select either more lower priced store brands or larger product sizes with lowerper-unit costs+
Although Table 3 shows the above $50,000 majority shoppers to have a strong prefer-ence for low-fat milk, this preference function is somewhat mixed for a milk-related prod-uct, ice cream+ These same consumers purchase healthy brands of ice cream ~33% ofpurchases! more frequently than below $50,000 shoppers ~20% of purchases!+ Shoppersin the above $50,000 majority areas are far more likely to purchase premium and superpremium brands of nonhealthy ice cream+ These brands make up 38% of the purchases
ANALYSIS OF CONSUMER DIETARY BEHAVIOR 211

for the above $50,000 majority, but just 21% of the purchases for below $50,000 majority+These products contain much more butterfat than the regular brands, thereby offsettingsome of the nutritional advantages of low-fat milk+ It should be noted that consumptionshares of regular healthy ice cream do not differ statistically for the two groups, but prices
TABLE 3+ Descriptive Statistics ~Sample Means! of Selected Variables
Quantity Shares Z-Values* Prices Paid per Ounce Z-Values*
Product Classes
ABOVE$50,000Majority
BELOW$50,000Majority
MeanTests
ABOVE$50,000Majority
BELOW$50,000Majority
MeanTests
MilkSkim milk 27+79 7+69 58+90 3+73 3+61 1+970+5% milk 2+96 0+56 25+47 3+54 3+51 0+551% milk 17+13 9+88 26+60 3+61 3+41 4+072% milk 35+47 36+53 �3+21 3+68 3+51 3+27Whole milk 13+35 42+13 �64+10 3+72 3+55 2+98Other milk 3+29 3+21 0+51 5+88 5+54 4+50
Ice creamRegular 28+68 58+89 �110+86 3+31 3+01 4+93Premium 35+03 20+96 42+61 5+72 5+61 2+03Super prem+ 2+95 0+31 7+73 21+59 18+49 60+57Regular healthy 16+49 15+78 1+58 3+92 3+71 4+04Prem+ healthy 15+93 3+99 126+73 6+01 5+59 7+45S+ Prm+ healthy 0+90 0+07 5+27 17+61 15+61 13+91
Salad dressingFat free 27+21 16+20 40+40 13+48 13+61 �2+14Low fat 17+76 6+78 33+25 11+10 11+82 �13+31Regular 55+03 77+02 �64+44 14+50 13+48 19+61
MayonnaiseFat free 6+81 2+63 15+33 11+51 11+16 5+75Low fat 26+91 10+26 50+42 9+69 8+70 18+29Regular 66+27 87+11 �61+07 9+52 8+84 13+28
Breakfast CerealsHealthy 44+41 34+77 35+37 18+22 17+28 15+46Less healthy 32+56 41+76 �27+86 19+08 17+52 28+83Hot cereals 8+70 11+04 �6+85 15+28 13+08 44+79Snack cereals 14+33 12+42 4+25 16+10 13+22 55+38
Salty snacksHealthy 14+90 8+52 23+41 16+00 15+92 1+48Less healthy 15+03 18+25 �9+75 13+91 15+07 �21+44Regular 70+07 73+23 �9+26 17+63 17+00 12+11
Cooking oilsCanola oil 20+30 14+64 20+77 5+48 5+30 2+96Olive oil 10+68 1+72 27+13 30+64 29+18 26+98Corn oil 3+99 4+42 �1+26 5+56 5+32 4+89Vegetable 24+01 36+60 �28+04 5+54 5+35 3+65Shortening 12+38 21+83 �100+30 7+14 6+29 14+91Stick-free spray 3+62 1+50 13+46 31+70 30+84 11+40All other 25+02 19+29 21+03 9+59 6+94 43+58
*All z-values with magnitudes of 1+96 or greater ~absolute value! are statistically significant at the +05 level+
212 JONES ET AL.

paid per ounce are statistically different+ Shoppers in the below $50,000 majority areaslagged behind those in the above $50,000 majority areas with respect to purchases ofbrands from premium healthy and super premium healthy classes, but these differencesare possibly due to an income constraint imposed by higher prices+
Salad dressing and mayonnaise, two products that are part of the same category but areseparated for discussion purposes, differ widely in consumption patterns between the de-fined areas+ From the three classes of salad dressing, low-fat and fat-free dressings rep-resent 45% of purchases for above $50,000 majority, but just 23% of that for below $50,000majority+ Fat-free and low-fat salad dressing are two of three classes of products for whichshoppers in the below $50,000 majority did not pay a per-unit price lower than those paidby above $50,000 majority+ This phenomenon is perhaps best explained by the fact that alimited number of store brands and product sizes exist in the low-fat category+
For mayonnaise, low-fat and fat-free classes represent 34% of purchases for above$50,000 majority, but just 13% of that for below $50,000 majority+ These patterns areclearly preference related, as uniform pricing existed among all classes of salad dressingand the three classes of mayonnaise+ Consumers in the below $50,000 majority areas,compared to those in the above $50,000 majority areas, paid lower per unit prices for allclasses of mayonnaise+ This cost minimization is perhaps due to the fact that store brandsand a large variety of package sizes are available across all classes of mayonnaise+
Table 3 shows that healthy cereals represent 44% of purchases for the above $50,000majority, but just 35% of those for below $50,000 majority+ These purchase patterns arelikely influenced by product prices+ Many of the more nutritional cereals, such as thosemade from oats, rice, and wheat, are included in this healthy class, and these are alsosome of the higher priced products+ As such, it is likely that an income constraint in theform of higher prices place limits on the choices made by shoppers in the below $50,000areas+ It should be noted that hot cereals such as grits and oatmeal are considered quitenutritional and, as shown in Table 3, shoppers in the below $50,000 majority areas pur-chase these products in larger quantities+ Across all cereal classes, the below $50,000majority are shown to pay lower per unit prices, and this outcome obviously reflects anattempt to derive a maximum amount of utility through the selection of a large number ofstore brands+
Although many nutritionists might consider the term healthy salty snacks an oxymo-ron, this study used the salt and fat content of products to identify three classes of saltysnacks+ Products with no fat and0or no salt are classified as healthy and those with low fatand0or low salt are classified as moderately healthy+ All other products are consideredregular+ Using these classifications, the above $50,000 majority shoppers are shown tohave a stronger preference for healthy snacks; the below $50,000 majority shoppers havea stronger preference for less healthy snacks+ Both groups have a stronger preference forregular snack products that include both salt and fat+ Although salty snacks are oftenlabeled impulse items, the below $50,000 majority shoppers paid lower per-unit pricesfor two of the three classes of products, although just one of these differences is statisti-cally significant+
Canola and olive oils are classified by nutritionists as the healthiest classes of oils andthese two products are shown to represent 31% of the purchases for the above $50,000majority shoppers, but just 16% of oil purchases for the below $50,000 majority shop-pers+ These purchase patterns are intriguing because, although vegetable and canola oilsare similarly priced, the below $50,000 majority shoppers expressed a much strongerpreference for vegetable oil+ This could suggest an information constraint regarding the
ANALYSIS OF CONSUMER DIETARY BEHAVIOR 213

nutritional value of canola oil, or it could mean that the below $50,000 majority shoppersconsider vegetable oil to be of similar or higher nutritional value+ Additionally, it couldmean that one group of consumers simply have a preference for vegetable oil, regardlessof its health attributes+
5. ESTIMATION AND DISCUSSION
Over 1,600 parameter estimates are derived from the empirical models of this study andthese estimates are obviously too numerous to discuss individually+4 This discussion willtherefore focus on uncompensated own-price elasticities and expenditure elasticities, buta brief discussion is first provided of some statistical and econometric issues+ Three of theproduct classes, 102% milk, super premium healthy ice cream, and fat-free mayonnaise,had reasonably small budget shares and could not be empirically estimated+ Each classwas therefore combined with an adjacent class+Additionally, the “all other” class of milkwas dropped because the price variable generated problems of multicollinearity+ A totalof 28 product classes remained and this led to an estimation of 56 equations ~28 for eachconsumer group!+ R2s are shown in Table 4 for each equation from which the elasticitiesare derived+ Four of these 56 equations have adjusted R2s below 0+50, but overall the R2shave values that are statistically acceptable+The Durbin h statistic for each equation showedno problem with first-order autocorrelation+ Relative to habit effects, most of the param-eter estimates for the lagged dependent variables are positive, but statistically insignificant+5
As shown in Table 4, the below $50,000 majority are more sensitive to price changesfor milk, save for skim milk+ It should be noted that a simple pair-wise comparison ofown-price elasticities for the two groups of consumers showed all the elasticities to bestatistically different at the 0+05 level or better+ The empirical estimates of higher levelsof price sensitivity for the below $50,000 majority across three of the four classes of milkare consistent with economic theory, and these values are further confirmation of thestatistical insights revealed by the descriptive statistics of Table 3+ Per-unit prices paidsuggest that the below $50,000 majority has a higher level of price sensitivity, even forskim milk+ The empirical estimate of a lower value, relative to that calculated for theabove $50,000 majority, most likely reflects wide disparities in budget shares+ That is,with skim milk being a relatively small proportion of total milk purchases for the below$50,000 majority, it is possible for an empirical measure to be less precise+
Seven of the eight own-price elasticities for milk are inelastic and these values mostlikely reflect the importance of milk in consumers’ diets+Among the expenditure elastic-ities for milk, it is of interest to note that the below $50,000 majority increases theirconsumption of low-fat milk ~a combined class of 102 and 1%! by more than 1% foreach 1% increase in total expenditures+ Indeed, both income groups show the highest
4All of the regression results are available upon request+5Heien and Durham ~RES, 1991! estimated habit effects from both time series and cross-section data for a
comparable set of households, and their results show much smaller effects for cross-section data+ They con-cluded that habit effects are possibly overstated in time series studies by a factor of 3 or more+ The authors notedthat some of this difference in magnitude might be due to the fact that their studies employed quarterly data forthe cross-section study, but annual data for the time series study+ In both data sets, their estimated habit effectswere positive and statistically significant+ In our model, lagged shares are included primarily to satisfy theadding up condition+Weekly data are employed in our model and, more often than not, the habit effect is foundto be statistically insignificant+ Relative to the findings of Helen and Durham, our results seem to suggest adiminishing habit effect as time periods narrow+
214 JONES ET AL.
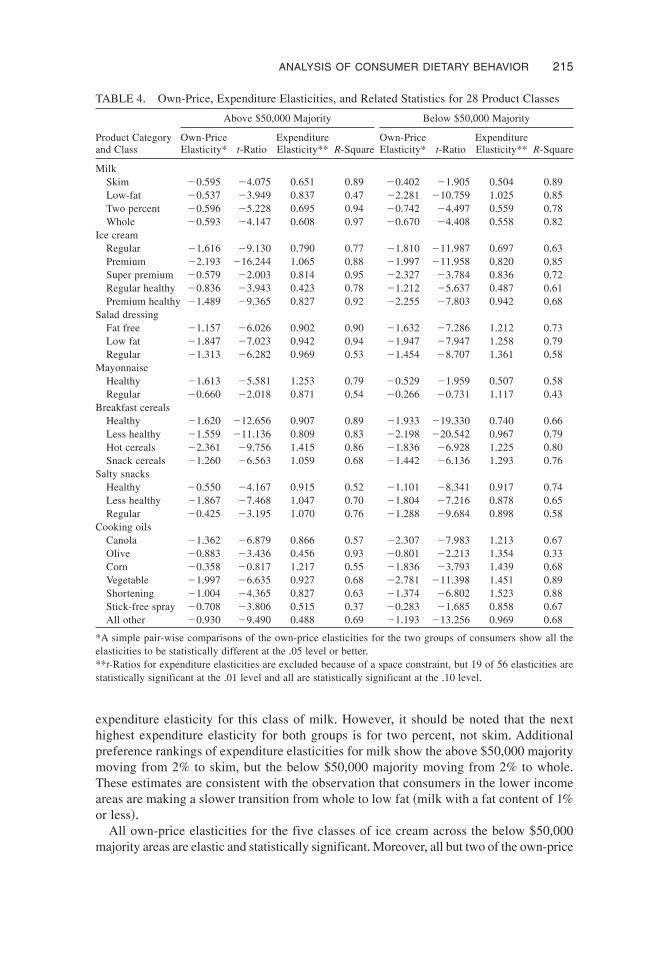
expenditure elasticity for this class of milk+ However, it should be noted that the nexthighest expenditure elasticity for both groups is for two percent, not skim+ Additionalpreference rankings of expenditure elasticities for milk show the above $50,000 majoritymoving from 2% to skim, but the below $50,000 majority moving from 2% to whole+These estimates are consistent with the observation that consumers in the lower incomeareas are making a slower transition from whole to low fat ~milk with a fat content of 1%or less!+
All own-price elasticities for the five classes of ice cream across the below $50,000majority areas are elastic and statistically significant+Moreover, all but two of the own-price
TABLE 4+ Own-Price, Expenditure Elasticities, and Related Statistics for 28 Product Classes
Above $50,000 Majority Below $50,000 Majority
Product Categoryand Class
Own-PriceElasticity* t-Ratio
ExpenditureElasticity** R-Square
Own-PriceElasticity* t-Ratio
ExpenditureElasticity** R-Square
MilkSkim �0+595 �4+075 0+651 0+89 �0+402 �1+905 0+504 0+89Low-fat �0+537 �3+949 0+837 0+47 �2+281 �10+759 1+025 0+85Two percent �0+596 �5+228 0+695 0+94 �0+742 �4+497 0+559 0+78Whole �0+593 �4+147 0+608 0+97 �0+670 �4+408 0+558 0+82
Ice creamRegular �1+616 �9+130 0+790 0+77 �1+810 �11+987 0+697 0+63Premium �2+193 �16+244 1+065 0+88 �1+997 �11+958 0+820 0+85Super premium �0+579 �2+003 0+814 0+95 �2+327 �3+784 0+836 0+72Regular healthy �0+836 �3+943 0+423 0+78 �1+212 �5+637 0+487 0+61Premium healthy �1+489 �9+365 0+827 0+92 �2+255 �7+803 0+942 0+68
Salad dressingFat free �1+157 �6+026 0+902 0+90 �1+632 �7+286 1+212 0+73Low fat �1+847 �7+023 0+942 0+94 �1+947 �7+947 1+258 0+79Regular �1+313 �6+282 0+969 0+53 �1+454 �8+707 1+361 0+58
MayonnaiseHealthy �1+613 �5+581 1+253 0+79 �0+529 �1+959 0+507 0+58Regular �0+660 �2+018 0+871 0+54 �0+266 �0+731 1+117 0+43
Breakfast cerealsHealthy �1+620 �12+656 0+907 0+89 �1+933 �19+330 0+740 0+66Less healthy �1+559 �11+136 0+809 0+83 �2+198 �20+542 0+967 0+79Hot cereals �2+361 �9+756 1+415 0+86 �1+836 �6+928 1+225 0+80Snack cereals �1+260 �6+563 1+059 0+68 �1+442 �6+136 1+293 0+76
Salty snacksHealthy �0+550 �4+167 0+915 0+52 �1+101 �8+341 0+917 0+74Less healthy �1+867 �7+468 1+047 0+70 �1+804 �7+216 0+878 0+65Regular �0+425 �3+195 1+070 0+76 �1+288 �9+684 0+898 0+58
Cooking oilsCanola �1+362 �6+879 0+866 0+57 �2+307 �7+983 1+213 0+67Olive �0+883 �3+436 0+456 0+93 �0+801 �2+213 1+354 0+33Corn �0+358 �0+817 1+217 0+55 �1+836 �3+793 1+439 0+68Vegetable �1+997 �6+635 0+927 0+68 �2+781 �11+398 1+451 0+89Shortening �1+004 �4+365 0+827 0+63 �1+374 �6+802 1+523 0+88Stick-free spray �0+708 �3+806 0+515 0+37 �0+283 �1+685 0+858 0+67All other �0+930 �9+490 0+488 0+69 �1+193 �13+256 0+969 0+68
*A simple pair-wise comparisons of the own-price elasticities for the two groups of consumers show all theelasticities to be statistically different at the +05 level or better+**t-Ratios for expenditure elasticities are excluded because of a space constraint, but 19 of 56 elasticities arestatistically significant at the +01 level and all are statistically significant at the +10 level+
ANALYSIS OF CONSUMER DIETARY BEHAVIOR 215

elasticities for the above $50,000 majority areas are elastic and statistically significant+With most brands of ice cream having prices that are either perceived to be high or areactually high, the estimated elastic demands are consistent with prior expectations andeconomic theory+ Comparing the two ice cream classes within the above $50,000 major-ity areas that have inelastic own-price elasticities, it is revealing to note that the mostinelastic value ~�0+579! is for super premium ice cream+ This estimated value is consis-tent with the data that show a super premium brand, Greaters, to be the number one seller~dollar sales! in all three of the higher income stores+ Further, in one of the three stores,a different flavor of Greaters is the number one, two, and three sellers+ These sales andown-price elasticity suggest that the above $50,000 majority associate quality with thename Greaters, and therefore, cost is not a major issue+
Consumers in the below $50,000 majority areas were hypothesized to show greaterprice sensitivity for all classes of ice cream and,with the exception of premium ice cream,these hypotheses are confirmed+ This lower level of price sensitivity for the premiumclass of ice cream by the below $50,000 majority is undoubtedly due to indulgence ef-fects associated with brands within this class+ That is, even though the below $50,000majority shoppers cannot afford the higher priced Greaters, they have obviously identi-fied brands within the premium class that have quality attributes and natural ingredientsthat diminish the importance of price+Yet, because of an income constraint, product pricesconstrain their purchases to yield an elastic demand+ Indeed prices paid per unit, shown inTable 3, show consumers in the lowest income areas having a higher level of price sen-sitivity, even for premium ice cream+ For both groups of consumers, it should be notedthat the highest expenditure elasticities are revealed for premium and superpremiumclasses+ These elasticities are consistent with observations by the International IceCream Association that consumers are expressing a rising preference for high-fat ice cream~Hopkins, 2002!+
Consumers can make their selections of salad dressings from a wide variety of brands,and these options were hypothesized to lead to own-price elasticities in the elastic rangefor both groups of consumers+ Empirical estimates confirm the hypothesis and consumersin the below $50,000 majority areas are shown to have greater price sensitivity for allproduct classes, even though per-unit prices paid show them paying higher prices for twoof the three classes+ This apparent anomaly is best explained by the fact that limited pri-vate label brands within those product classes placed a restriction on selections, but brandlimitations had little impact on quantity selections in response to price changes+All of theelasticity estimates are statistically significant at the 0+01 level, suggesting considerabledispersion in both prices and quantities over the 61 weeks of these data+ Expenditureelasticities are reasonably large for both groups of consumers, with all classes of saladdressing being identified as luxury goods for the below $50,000 majority+ Among thethree classes of salad dressing, expenditure elasticities are largest for regular salad dress-ing for both consumer groups+ As with ice cream, these estimates suggest that the richertaste associated with regular dressings plays a major role in consumers’ selection process+
For empirical estimation, fat-free mayonnaise is combined with the low-fat class be-cause of its low budget share+ This combined class is shown as healthy in Table 4, andconsumers in the two areas are shown to have widely different elasticities+ Consumers inthe above $50,000 areas have an elastic own-price demand for healthy mayonnaise, whilethose in the below $50,000 areas are shown to have an inelastic demand+ Inelastic de-mands are revealed for regular mayonnaise for both groups of consumers, although theestimate is statistically insignificant for consumers in the below $50,000 majority areas+
216 JONES ET AL.

Some additional analysis at the brand level ~not shown! coupled with those of Table 3help to explain these empirical results+ Consumers in the below $50,000 majority areasmade their product selections primarily from private-label products, and these productsshowed a limited amount of price variability during the data period+ Consumers in theabove $50,000 majority areas made their product selections primarily from national brands,and these products showed considerably price variability during the data period+As priceschanged, consumers in the above $50,000 majority areas altered their product purchases,and these fluctuations are captured as higher price elasticity+
Despite the somewhat unexpected empirical measures of price elasticities,Table 3 showsclearly that consumers in the below $50,000 majority areas paid lower per-unit prices foreach class of mayonnaise+ Expenditure elasticities show the above $50,000 majority in-creasing their consumption of healthy mayonnaise by more than 1% for each 1% increasein total expenditures, while the below $50,000 majority increases their consumption ofregular mayonnaise by more than 1% for each 1% increase in total expenditures+ Thesecontrasts in expenditure elasticities coupled with the contrasts in quantity shares, as shownin Table 3, suggest a path of continued divergence for this product category+
Breakfast cereals are a product category that offers consumers many brand choices,and economic theory would therefore suggest highly elastic demands+ Consistent withtheory, the results in Table 4 show all consumers to have elastic demands, and all of theseelasticities are statistically significant at the 0+01 level+ Consumers in the above $50,000majority areas are shown to have a more elastic demand for hot cereals, and this estimateis believed to reflect the sensitivity of the AIDS model to small budget shares+ For theother three classes of breakfast cereals, the below $50,000 group is shown to be far moreprice sensitive+ Further, even for hot cereals, the per unit prices paid, as shown it Table 3,support the premise that consumers with lower incomes display more price sensitivity+
It should be noted that both consumer groups express the lowest price sensitivity forsnack cereals+ This is a class of products that includes products consumers often buy onimpulse and one would therefore expect a lower level of price sensitivity+ Finally, it shouldbe recognized that even though many of the more nutritious and higher priced productsare included in the healthy class, both consumer groups paid higher per unit prices for theless healthy class of cereals+ This class of cereals includes most of the sugarcoated brandsthat are higher priced, and per-unit prices paid suggest that both consumer groups ex-pressed a strong preference for these products+ For both groups of consumers, expendi-ture elasticities are highest for hot and snack cereals+ Indeed these are luxury products forboth groups, meaning an increase in consumption of more than 1% for each 1% increasein total expenditures+ Relative to healthy and less healthy cereals, hot and snack cerealsrepresent small quantity shares, but the expenditure elasticities suggest continued growthfor these two classes+
Salty snacks are believed to have many of the same impulse characteristics as snackcereals+As such, it was difficult to hypothesize an expected range of elasticities for theseproducts+ The estimated own-price elasticities in Table 4 show consumers in the below$50,000 majority areas to be more price-sensitive for two ~healthy and regular! of thethree product classes+ Further, these empirical estimates of own-price elasticities are sup-ported by per unit prices paid, as shown in Table 3+ These empirical estimates and quan-tity shares of Table 3 shed some interesting insights into the behavior of consumers+ Forsalty snacks, consumers with higher incomes have made a two-step move: from regular toless healthy ~low salt and0or low fat!, and then to healthy ~no salt and0or no fat!+ Bycontrast, consumers with lower incomes have made a step-and-a-half move: from regular
ANALYSIS OF CONSUMER DIETARY BEHAVIOR 217

to less healthy, and then partly to healthy snacks+ Consumers in the above $50,000 ma-jority areas appear to have developed a strong preference for healthy snacks, and they areless sensitive to price changes for this product category+ Consumers in the below $50,000majority areas have yet to develop a strong preference for healthy snacks, and they arestill quite sensitive to price changes for this product class+
The aforementioned observation for salty snacks is similar to what has been observedfor milk+ All consumers of milk have increased their consumption of 2% milk as theyreduced their consumption of whole, but consumers in the below $50,000 majority areashave made a slow transition from 2% to low-fat milk, such as 1% and skim+ Statistically,expenditure elasticities for the two consumer groups are identical for healthy snacks,whilethe above $50,000 majority has higher expenditure elasticities for regular and less healthy+One consistency among the expenditure elasticities for both groups is the large magni-tude of the elasticities+ Such magnitudes suggest a sizeable increase in consumption foreach 1% increase in total expenditures+
Consistent with the predictions of economic theory, consumers in the below $50,000majority areas are shown to be more price sensitive toward the purchase of cooking oils+Although the magnitude of elasticities for two classes of oil ~olive and stick-free spray!seem to violate this premise, it should be noted from Table 3 that these classes representsmall budget shares for consumers in the below $50,000 majority areas ~less than 2%!+Further, the own-price elasticity for stick-free spray is statistically insignificant for thebelow $50,000 majority consumers and the elasticities for olive oil differ by just a smallmagnitude for the two groups+ Additionally, per-unit prices paid for these two classes ofproducts, as shown in Table 3, support the premise that consumers with lower incomesare more price sensitive toward cooking oil purchases than those with higher incomes+Interestingly, both consumer groups show the greatest price sensitivity for vegetable oil+This product class constitutes the largest proportion of oil purchases for the below $50,000majority and the second largest proportion for the above $50,000 majority+ Relative toexpenditure elasticities, the above $50,000 majority are shown to increase their consump-tion of corn oil by more than 1% for each 1% increase in total expenditures, whereas thebelow $50,000 majority increases their consumption of all but two oils ~stick-free sprayand all others! by more than 1% for each 1% increase in total expenditures+ These expen-diture measures for cooking oils suggest widely different preferences for the two groupsof consumers+ Indeed, across all product categories, it can be concluded that own-priceand expenditures show major differences for the two groups+
6. SUMMARY AND CONCLUSIONS
This research was motivated by a desire to explain why nationwide food consumptionsurveys can find little to no difference between the diets of consumers at opposite ends ofthe income spectrum, but selected studies of particular food commodities can find majordifferences+ It was reasoned that this phenomenon could be explained by the fact thatconsumers show widely different preferences for particular food commodities ~classes!,but then make tradeoffs among commodities ~classes! that lead to similar diets+ Sevencategories of food commodities ~breakfast cereals, cooking oils, ice cream, mayonnaise,milk, salad dressings, and salty snacks! were investigated in this study to try to determineif tradeoffs among these commodities could shed some insight on dietary differences be-tween income groups+ Some interesting results were found+
218 JONES ET AL.

Across the seven categories of food commodities, consumers in the highest incomeareas made larger purchases from the more nutritious classes+ Yet, despite uniform pric-ing across stores, shoppers in the lower income areas paid consistently lower unit prices+One could speculate that prices are higher for more nutritious products, and therefore,larger purchases of these products would lead to higher per unit prices+ For example, ifcereal purchases by consumers in the highest income areas included a disproportionateshare of high-priced bran cereals, one would conclude that price differences reflect dif-ferences in nutritional quality+ Yet, this study reveals differences in prices paid even forproducts with identical nutrients+ For example, consumers in the lowest income areaspaid a lower per-unit price for all classes of milk, despite the fact that each class is nu-tritionally identical and uniformly priced across all stores+As an alternative to the afore-mentioned speculation, a more reasonable conclusion might be that all consumers arerational, but those at lower income levels are more price-conscious of each dollar ofexpenditure+
Differences in the behavior of consumers within the two income areas are revealed notjust by per-unit prices paid, but also by empirical estimates of own-price elasticities andexpenditure elasticities+ Shoppers of the lowest income stores were hypothesized to bemore price-sensitive and this hypothesis is confirmed by the results+ For 20 of the 28 pairsof empirically estimated own-price elasticities, consumers of the lowest income storesare shown to be more price-sensitive+As shown in Table 4,most own-price elasticities areelastic and particularly noticeable is the relatively large elasticity for low-fat milk ~1%and 102%! for the lowest income areas+ As previously noted, consumers in the lowestincome areas have made a full transition from whole milk to 2%, but they are still makingthe transition from 2 to 1%+ The large elasticity suggests that these consumers still havea preference for whole and 2%, but will purchase low-fat milk when prices are quitefavorable+ One implication of this result is that consumption patterns for milk could un-doubtedly be influenced by public policy+ If health officials wished to reduce fat in con-sumers’ diet, they could encourage retailers ~perhaps with some incentives! to set ameaningful price differential on high-fat and low-fat milk, especially in stores servingconsumers in lower income areas+
Although the seven categories of food products for this study have not fully unraveledthe paradox of consumption behavior, these categories have provided some insight intothe roles prices and income play in influencing behavior+ Clearly, consumers at the lowestincome levels are more price-sensitive, and they tend to search for the lowest priced prod-ucts among all product classes+ On occasions when no significant price differences existamong products, consumers at the lowest income level appear to make what nutritionistswould regard as irrational choices+ Such choices, however, are likely to reflect a numberof demand and socioeconomic factors+ For example, consumers in the lowest incomeareas expressed a strong preference for vegetable oil, when comparably priced and morenutritious canola oil was available+ For such selections, it is likely that factors such aseducation, habits, information, and taste interact with, and perhaps dominate, prices andincome in determining purchases+ Further, the results of this study point to at least onetradeoff in consumption that helps to unravel the paradox+ Although consumers in thehighest income areas purchase large proportions of low-fat milk, they also purchase largequantities of the brand of ice cream that has the most butterfat—Greaters+ This brand ofice cream was the number one seller in all three of the higher income stores+ Indeed in onestore, a different flavor of Greaters was the number one, two, and three sellers+ Theseobservations suggest one way in which tradeoffs are possibly made in consumers’ market
ANALYSIS OF CONSUMER DIETARY BEHAVIOR 219

baskets that result in similarity in nutritional intakes for consumers across all levels ofincome+ Analyses of the more than 54 other categories are needed to further unravel theparadox+
REFERENCES
Akbay, C+ ~2000!+ An empirical analysis of consumption patterns for socioeconomic groups: Anapplication of Almost Ideal Demand System+ Unpublished PhD dissertation+ The Ohio StateUniversity+
Alston, J+M+, Chalfant, J+A+, & Piggott, N+E+ ~2001!+ Incorporating demand shifters in the AlmostIdeal Demand System+ Economics Letters, 70, 73–78+
Blanciforti, L+, & Green, R+ ~1983!+ An Almost Ideal System incorporating habits: An analysis ofexpenditures on food and aggregate commodity groups+ Review of Economics and Statistics,65, 513–515+
Blisard,N+ ~2000!+ Food spending by U+S+ households grew steadily in the 1990s+ Food Review, 23,18–22+
Buse, A+, & Chan,W+H+ ~2000!+ Invariance, price indices and estimation in Almost Ideal DemandSystems+ Empirical Economics, 25, 519–539+
Capps,O+, Jr+ ~1989!+Utilizing scanner data to estimated retail demand functions for meat products+American Journal of Agricultural Economics, 71, 750–760+
Chafant, J+ ~1987!+A globally flexible,Almost Ideal Demand System+ Journal of Business and Eco-nomic Statistics, 5, 233–242+
Chern, W+S+ ~1999!+ Demand for food and demand for health: Some methodological issues+ TheTaipei International Conference on Health Economics, Taipei, Taiwan, March 25–26+
Deaton, A+, & Muellbauer, J+ ~1980a!+ An Almost Ideal Demand System+ American Economic Re-view, 70, 312–326+
Deaton, A+, & Muellbauer, J+ ~1980b!+ Economics and consumer behavior+ Cambridge, MA: Cam-bridge University Press+
Diewert,W+E+ ~1974!+Applications of duality theory+ In M+D+ Intriligator & D+A+ Kendrick ~Eds+!,Frontiers of quantitative economics ~vol+ 2!+ Amsterdam+
Eastwood, D+B+ ~1997!+ Information technology and fresh produce: A case study using store levelscan data to analyze sales+Working paper 97–04+ The Retail Food Industry Center, Universityof Minnesota+
Heien, D+,& Durham, C+ ~1991!+A test of the habit formation hypothesis using household data+ Thereview of Economics and Statistics, 73, 189–199+
Hopkins, B+ ~2002!+ Frozen assets: Ice cream retains popularity even as competition heats up+ DailyNews, Los Angeles, May 26+
Jones, E+ ~1997!+ An analysis of consumer food shopping behavior using supermarket scannerdata: Differences by income and location+ American Journal of Agricultural Economics, 79,1437–1443+
Jones, E+,& Akbay, C+ ~2000!+An analysis of consumers purchasing behavior for high- and low-fatmilk: A focus on healthy drinking+ Journal of Food Distribution Research, 31, 124–131+
Jones, E+, Mustiful, B+W+, & Chern, W+S+ ~1994!+ Estimating demand elasticities for cereal prod-ucts:A socioeconomic approach using scanner data+Agribusiness:An International Journal, 10,325–339+
Judge, G+G+, Hill, R+C+, Griffiths, W+E+, Luetkepoh, H+, & Lee, T+C+ ~1988!+ Introduction to thetheory and practice of economics+ New York: John Wiley & Sons, Inc+
LaFrance, J+T+ ~1991!+When is expenditure “exogenenous” in separable demand models? WesternJournal of Agricultural Economics, 16, 49– 62+
Lin, B+-H+, Frazao, E+,& Guthrie, J+ ~1999!+Away-from-home foods increasingly important to qual-ity of American diet+ USDA Agriculture Information Bulletin No+ 749+
Moschini, G+ ~1995!+ Units of measurement and the Stone Price Index in demand system estima-tion+ American Journal of Agricultural Economics, 77, 63– 68+
Moschini, G+, & Meilke K+D+ ~1989!+ Modeling the pattern of structural change in U+S+ meat de-mand+ American Journal of Agricultural Economics, 71, 253–261+
220 JONES ET AL.

Murphy, S+P+, & Bayer, O+ ~1998!+ Evaluating dietary quality among low-income groups in theUnited States+ Poverty and food in welfare societies+ Berlin, Germany: Edition Sigma+ Heraus-gegeben Vom Wissenschffszentrum Berlin fur Sozialforschung, 1998+
Murphy, S+P+, Rose, D+, Hudes, M+, & Viteri, F+E+ ~1992!+ Demographic and economic factors as-sociated with dietary quality for adults in the 1987–88 nationwide food consumption survey+Journal of American Dietetic Association, 92, 1352–1357+
Pollak, R+A+,& Wales, T+J+ ~1978!+ Estimation of complete demand systems from household budgetdata: The linear and quadratic expenditure systems+American Economic Review, 68, 348–359+
Pollak, R+A+, & Wales, T+J+ ~1980!+ Comparison of the quadratic expenditure system and translogdemand systems with alternative specifications of demographic effects+ Econometrica, 48,595– 612+
Reger, B+ ~1998!+ 1% or less:A community-based nutrition campaign+ Public Health Reports, 113,Sept0Oct+
Seale, J+L+, Sparks,A+L+, & Buxton, B+M+ ~1992!+A Rotterdam application to international trade infresh apples: A differential approach+ Journal of Agricultural and Resource Economics, 17,138–149+
The Packer+ ~1997–2001!+ Fresh trends: Profile of the fresh produce consumer+ Lenexa, Kansas:Vance Publishing Corporation+
Zellner,A+ ~1962!+An efficient method of estimating seemingly unrelated regressions and tests foraggregation bias+ Journal of the American Statistical Association, 57, 348–368+
Zellner,A+ ~1963!+ Estimators for seemingly unrelated regression equations: Some exact finite sam-ple results+ Journal of the American Statistical Association, 58, 977–992+
Zho, J+, Chern,W+S+, & Jacobson, B+ ~1996!+ Consumer attitudes towards fat contents in food: Thecase of whole milk vs+ lower fat milk+ Consumer Interest Annual, 42, 60–77+
Eugene Jones is an associate professor in the Department of Agricultural, Environmental, andDevelopment Economics at the Ohio State University, Columbus. He holds a Ph.D. from the Uni-versity of Florida. His research areas are consumer demand analysis, economics of supermarketpricing, and fruit and vegetable marketing.
Cuma Akbay is an assistant professor in the Department of Agricultural Economics, Sutcu ImanUniversity, Kahraman Maras, Turkey. He holds a Ph.D. from the Ohio State University. His re-search focuses on the microeconomics of household decision-making for food purchases andconsumption.
Brian Roe is an assistant professor in the Department of Agricultural, Environmental and Devel-opment Economics at the Ohio State University, Columbus. He holds a Ph.D. from the Universityof Maryland. His research focuses on consumer demand for unorthodox product attributes, on con-sumer labeling issues and on livestock economics.
Wen S. Chern is a professor in Department of Agricultural, Environmental and Development Eco-nomics at the Ohio State University, Columbus. He holds a Ph.D. from the University of California,Berkeley. His current research interests focus on health economics, global food security, and foodconsumption and nutrition.
ANALYSIS OF CONSUMER DIETARY BEHAVIOR 221