Embed Size (px)
Citation preview

Important disclosures appear on the last page of this report.
The Henry Fund
Henry B. Tippie School of Management
Juhi Narang [[email protected]]
Analog Devices, Inc (ADI) September 17, 2017
Information Technology – Semiconductors Stock Rating Buy
Investment Thesis Target Price $95-$100 Analog Devices (ADI), established itself as the leader in analog chips and Integrated Circuits. The strong revenue growth forecast during forecast horizon (2017-2021) coupled with an estimated 15.4% upside for the stock are the drivers for the buy recommendation for the stock. Drivers of Thesis
• The demand for analog chips is expected to grow at a CAGR of 15% through 2022. The industrial semiconductor market is expected to grow at a CAGR of 9.7% by 2019 (18). The market trend of Internet of Things (IoT) is expected to grow at 14% CAGR to 2022 that drives demand for the analog semiconductor industry is positive (16)
• Global automotive sensors market is expected to grow at CAGR of 10%. This shows an opportunity that ADI can leverage to sell its analog ICs and chips and to double the per vehicle content for smart vehicles.
• ADI has a steady and profitable business model in terms of operating results and free cash flows during various stages of the industry's business cycle. It has relatively stable gross/operating margins and is less risky.
Risks to Thesis
• ADI is exposed to highly cyclical semiconductor industry due to its diverse customer base. The sales are closely related to the health of its various end markets like automobile, communications and electronic equipment
• ADI’s consumer business has seen a dependability on iPhone sales and may receive an increase in content per phone in near-term, but if Apple were to ever switch to a different supplier, sales may be impacted heavily
• ADI has $8.4 billion in debt that was raised to fund Linear Technologies acquisition deal. Any significant increase in fed fund rates in future can result in payment of higher interest
Henry Fund DCF $96.80 Henry Fund DDM $55.39 Relative Multiple $106.4 Price Data Current Price $83.84 52wk Range $59.54 – $90.49 Consensus 1yr Target $95.33 Key Statistics Market Cap (B) $30.83 Shares Outstanding (M) 367.67 Five Year Beta 1.36 Dividend Yield 1.98% Est. 5yr Growth 15.3% Price/Earnings (2017E) 22.5 Price/Earnings (2018E) 21.8 Price/Sales (ttm) 6.75 Price/Sales (2017E) 6.00 Price/Book (mrq) 3.09 Profitability Gross Margin 68.3% Profit Margin 28.0% Return on Assets (TTM) 6.01% Return on Equity (TTM) 9.07%
Earnings Estimates Year 2014 2015 2016 2017E 2018E 2019E
EPS $21.37 $23.78 $28.18 $30.60 $35.97 $41.96
growth -1% 12.0% 13.0% -15.5% 3.5% 15.3%
12 Month Performance Company Description
Analog Devices, Inc founded in 1965 is an American multinational company, headquartered in Norwood, Massachusetts. It is a world leader in manufacturing analog chips for electronic equipment, that convert real-world phenomena, like light, sound, temperature, motion, and pressure into electrical signals. The company earns profits from semiconductor content to highly diversified customers in the industrial, automotive and communications infrastructure industries.
22.2
9.1
29.1
18.3
0
5
10
15
20
25
30
35
P/E ROE
ADI Industry
Source: Yahoo Finance & HF estimates
-10%
-5%
0%
5%
10%
15%
20%
25%
30%
S O N D J F M A M J J A
ADI S&P 500
Source: Yahoo Finance

Page 2
EXECUTIVE SUMMARY
Analog Devices (ADI) has emerged as the largest in manufacturer of analog chips for electronic equipment. On March 10, 2017, the company completed acquisition of Linear Technology for $15.8 billion. Today, it serves more than 100,000 clients, including customers in consumer, automobile, communications sector.
After a detailed study of the end market demand drivers, the 5 Year CAGR for revenue was estimated to be 15% during the forecast horizon (2017-2021). This estimated top line revenue growth coupled with ADI’s efforts to increase the gross and operating margins are the major drivers of the DCF model used to compute the intrinsic value of ADI’s stock. The model suggests a 15.4% upside on the current stock price, which is the driver for the “Buy” recommendation for ADI.
COMPANY DESCRIPTION
Analog Devices was incorporated in the year 1965 and since has been growing semiconductor company. It is a market leader in manufacturing and designing analog chips worldwide. These chips leverage high-performance analog, mixed-signal and digital signal processing technology, including integrated circuits (ICs), algorithms, software, and subsystems that convert real-world signals, such as sound, temperature, and pressure, into digital signals that can be processed. The company serves customers worldwide, in key strategic markets such as the industrial, automotive, consumer and communications industries.
ADI recently acquired, for approximately $15.8 billion, Linear Technology Corporation, which manufactures high performance linear integrated circuits. Linear technologies’ products highly complement solutions provided by ADI as linear Technologies specializes in high performance analog circuits that consist higher precision, lower noise margins, low power operations, and higher linearity of operations.
Revenue Decomposition
ADI, pre-merger, had 4 operating segments: Industrial, Automotive Consumer and Communications. Linear technologies had 6 operating segments: Industrial, Automotive, Consumer, Communications, Computer, and Military. These 6 segments were merged with the 4 operating segments of ADI in the current year. The charts below display the revenue segments of ADI before the merger (FE 2016) and predicted after the merger will be completed in 2017.
Source: ADI 10-K(1)
Source: Henry Estimates

Page 3
The graph above states that we would expect to see a growth in percentage share of industrials because the revenue earned by Linear Technology in the defense segment will be added to the industrial segment post-merger.
Major Segments
Industrial
The Industrial segment is one of the biggest operating segment for ADI and consists of following sub-sector: Industrial and Instrumentation, Defense/Aerospace, Energy Management and Healthcare. This segment is driving majority of growth and solid margins for ADI. Industrial segment has reported 49% Y-o-Y growth for nine months ended 2017 and as mentioned in the earnings call, the company sees numerous opportunities to further drive revenue growth due to increase in demand for technology to make industrial applications more intelligent, more connected and more efficient (6).
Due to the realignment of merged segment, we would see an extraordinary growth in 2017. 2018 we assume the revenue to grow at a CAGR of 15%. 2019 onwards we assume the growth to stabilize at 7% as the demand for this segment is highly dependent on the growth of Internet of Things market (IoT) market.
Consumer
Consumer segment is the one that serves consumer electronics market. The segment has reported 87% Y-o-Y growth for nine months ended 2017 by addressing the market demand for analog solutions to support high quality user interfaces, music, movies and photographs. These solutions fulfill the rigorous cost and time-to-market requirements of the consumer electronics market (1). Large consumer-related orders from Apple will continue to drive the top-line growth for the analog chip business.
Due to the realignment of merged segment, we would see an extraordinary growth in 2017. In 2018 we assume the revenue to grow at a CAGR of 34%. 2019 onwards we assume the growth to stabilize at 28% as per the market demand.
Communications
Communications segment derives its demand from the growth of broadband, wireless and internet infrastructures industries. Constant efforts to increase the speed, efficiency of bandwidth and decrease the power consumption of communications has led to continuous rise in demand for the analog products. This segment has reported 24% Y-o-Y growth for nine months ended 2017 and continues to grow with rising industry for video streaming, voice communication and machine-type communications.
The graph below shows the revenue from Telecommunications industry in the past and the estimates for forecasted period. We see the steady rise in revenue and assume the growth to continue.
Source: Statista
Due to the realignment of merged segment, we would see an extraordinary growth in 2017. In 2018 we assume the revenue to grow at a CAGR of 7%. 2019 onwards we assume the growth to stabilize at 1.5% as per the market as depicted in the graph above.
Automotive
The Automotive segment developed differentiated high performance solutions that have helped automotive systems to be more green, safe and smart than they already were. This segment has reported 37% Y-o-Y revenue growth for nine months ended 2017 and increased significant market share through solutions that improve vehicle stability and in cabin audio/video quality.
Management expects the per vehicle dollar-content opportunity (currently $250) to double by next 5-7 years because traditional cars adding additional electronic
Page 4
content in their vehicles such as sensors, active safety systems, and advanced infotainment systems. The hybrid and electric autos are increasing the amount of chip content in each vehicle.
Due to the realignment of merged segment, we would see an extraordinary growth in 2017. In 2018 we assume the revenue to grow at a historical CAGR of 11%. 2019 onwards we assume the growth to stabilize at 10% as per the market demand.
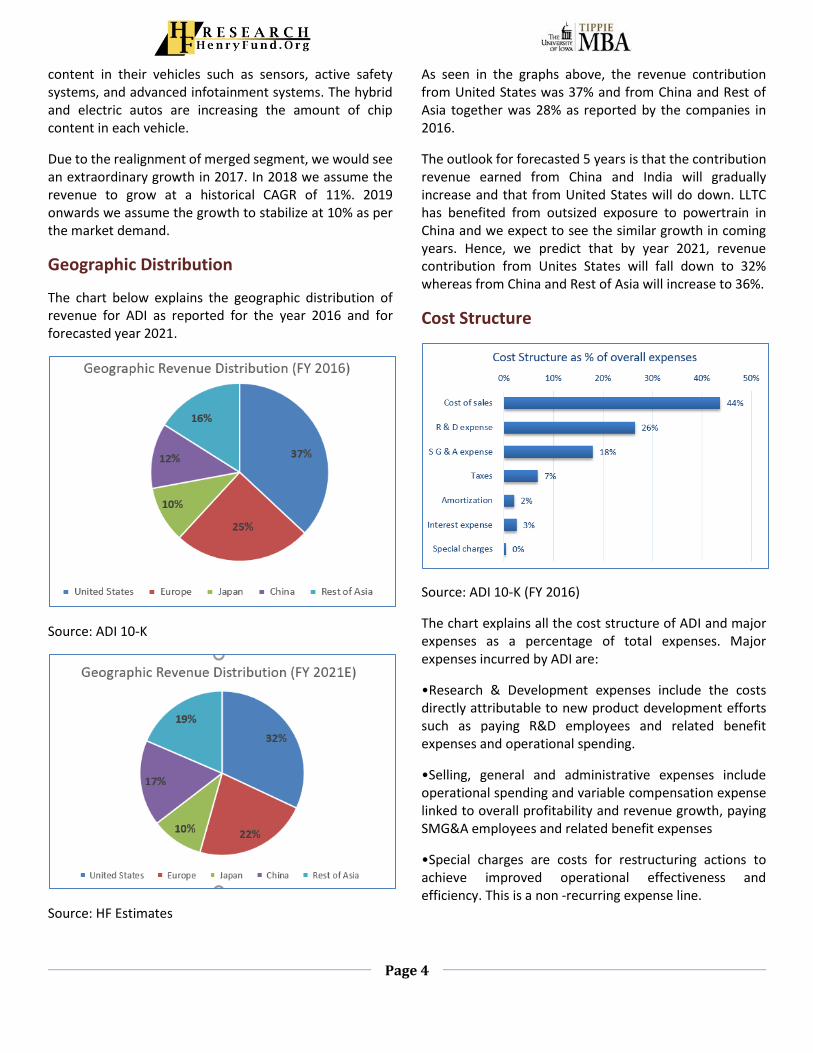
Geographic Distribution
The chart below explains the geographic distribution of revenue for ADI as reported for the year 2016 and for forecasted year 2021.
Source: ADI 10-K
Source: HF Estimates
As seen in the graphs above, the revenue contribution from United States was 37% and from China and Rest of Asia together was 28% as reported by the companies in 2016.
The outlook for forecasted 5 years is that the contribution revenue earned from China and India will gradually increase and that from United States will do down. LLTC has benefited from outsized exposure to powertrain in China and we expect to see the similar growth in coming years. Hence, we predict that by year 2021, revenue contribution from Unites States will fall down to 32% whereas from China and Rest of Asia will increase to 36%.
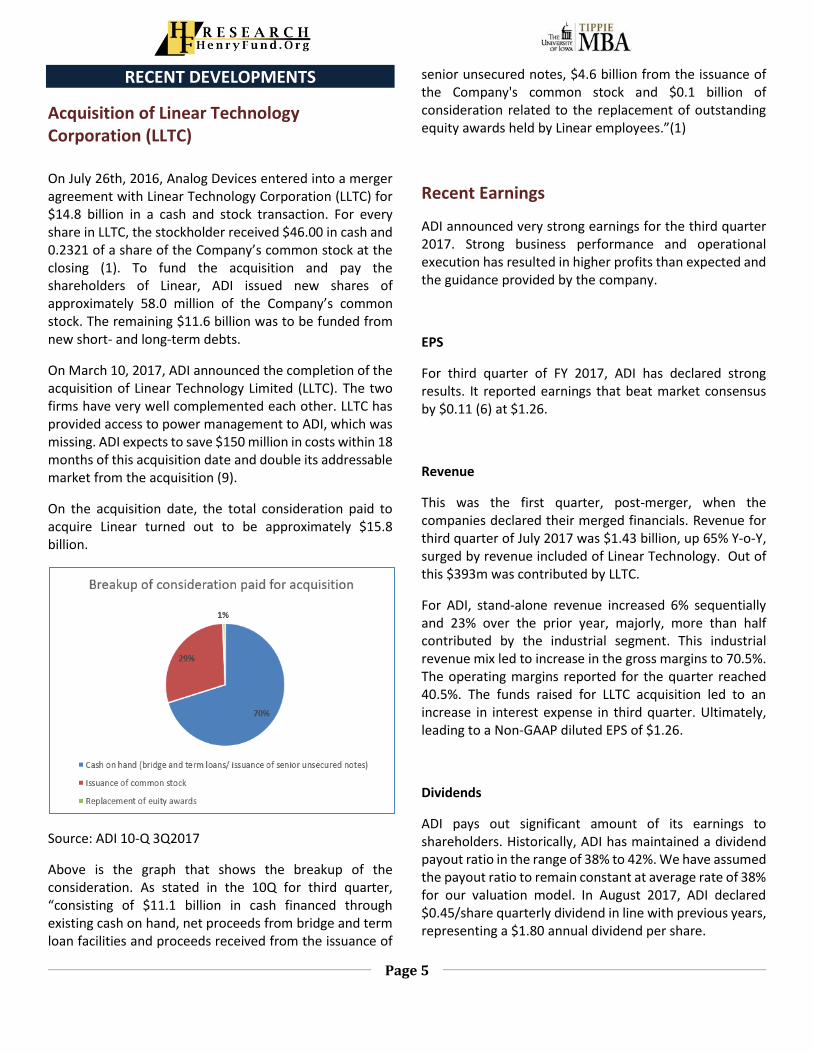
Cost Structure
Source: ADI 10-K (FY 2016)
The chart explains all the cost structure of ADI and major expenses as a percentage of total expenses. Major expenses incurred by ADI are:
•Research & Development expenses include the costs directly attributable to new product development efforts such as paying R&D employees and related benefit expenses and operational spending.
•Selling, general and administrative expenses include operational spending and variable compensation expense linked to overall profitability and revenue growth, paying SMG&A employees and related benefit expenses
•Special charges are costs for restructuring actions to achieve improved operational effectiveness and efficiency. This is a non -recurring expense line.
Page 5
RECENT DEVELOPMENTS
Acquisition of Linear Technology Corporation (LLTC) On July 26th, 2016, Analog Devices entered into a merger agreement with Linear Technology Corporation (LLTC) for $14.8 billion in a cash and stock transaction. For every share in LLTC, the stockholder received $46.00 in cash and 0.2321 of a share of the Company’s common stock at the closing (1). To fund the acquisition and pay the shareholders of Linear, ADI issued new shares of approximately 58.0 million of the Company’s common stock. The remaining $11.6 billion was to be funded from new short- and long-term debts.
On March 10, 2017, ADI announced the completion of the acquisition of Linear Technology Limited (LLTC). The two firms have very well complemented each other. LLTC has provided access to power management to ADI, which was missing. ADI expects to save $150 million in costs within 18 months of this acquisition date and double its addressable market from the acquisition (9).
On the acquisition date, the total consideration paid to acquire Linear turned out to be approximately $15.8 billion.
Source: ADI 10-Q 3Q2017
Above is the graph that shows the breakup of the consideration. As stated in the 10Q for third quarter, “consisting of $11.1 billion in cash financed through existing cash on hand, net proceeds from bridge and term loan facilities and proceeds received from the issuance of
senior unsecured notes, $4.6 billion from the issuance of the Company's common stock and $0.1 billion of consideration related to the replacement of outstanding equity awards held by Linear employees.”(1)
Recent Earnings
ADI announced very strong earnings for the third quarter 2017. Strong business performance and operational execution has resulted in higher profits than expected and the guidance provided by the company.
EPS
For third quarter of FY 2017, ADI has declared strong results. It reported earnings that beat market consensus by $0.11 (6) at $1.26.
Revenue
This was the first quarter, post-merger, when the companies declared their merged financials. Revenue for third quarter of July 2017 was $1.43 billion, up 65% Y-o-Y, surged by revenue included of Linear Technology. Out of this $393m was contributed by LLTC.
For ADI, stand-alone revenue increased 6% sequentially and 23% over the prior year, majorly, more than half contributed by the industrial segment. This industrial revenue mix led to increase in the gross margins to 70.5%. The operating margins reported for the quarter reached 40.5%. The funds raised for LLTC acquisition led to an increase in interest expense in third quarter. Ultimately, leading to a Non-GAAP diluted EPS of $1.26.
Dividends
ADI pays out significant amount of its earnings to shareholders. Historically, ADI has maintained a dividend payout ratio in the range of 38% to 42%. We have assumed the payout ratio to remain constant at average rate of 38% for our valuation model. In August 2017, ADI declared $0.45/share quarterly dividend in line with previous years, representing a $1.80 annual dividend per share.

Page 6
Future Estimates
Source: Bloomberg and HF estimates
The above graph states that, the revenue consensus estimates from Bloomberg and EPS estimates from Bloomberg align with the assumptions of the Henry Fund team for the DCF model. We expect ADI to earn an annual revenue of $5.1 bn in year 2017 and report an EPS of $4.10.
Historically, the company has mostly either met or beat its guidance for revenue and EPS and this trend makes us believe that it would continue the same in fourth quarter.
INDUSTRY TRENDS
We have a positive fundamental outlook for the semiconductors industry for coming three years.
World Semiconductor Trade Statistics (WSTS) industry forecast projects semiconductor global market to grow by an annualized rate of 11.50% in 2017 and 2.70% in 2018, followed by a slight decrease of 0.20% in 2019 (19). This semiconductor industry comprises of various sub-sectors:
Industrial - As per PricewaterhouseCoopers (PwC), the industrial semiconductor market is expected to grow at a CAGR of 9.7% by 2019 (18).
Medical – As per IC Insights, global medical semiconductor sales will grow at a 12.3% CAGR by 2018(18)
Automotive – As per MarketsandMarkets, the automotive semiconductor market will grow at a CAGR of 5.8% by 2022(18)
Source: Statista.com (16)
From the above graph, we see that the semiconductor industry is expected to grow at an annualized rate of 5% in next three years by 2019.
The biggest drivers of this growth in the industry are the trends mentioned below:
iPhone Sales
The Consumer segment’s revenue for ADI highly depends on smartphone sales. There exists a strong correlation between Apple (AAPL)’s revenue and ADI’s consumer segment revenue as it is ADI’s key customer in this segment. Refer to the graph below.
Source: Marketrealist(20)
Year Henry Fund Market Analysts
2017E 5171.2 5135
2018E 6050.9 5839
2019E 6750.0 6040
Revenue Estimates

Page 7
Fall in iPhone sales led to decrease in revenue from consumer segment for ADI, hence, ADI had reduced its dependence on Apple sales and moved to other segments for growth to reduce its exposure to Apple. If we compare the latest earnings release, we can see a correlation between Apple sales and ADI’s sales. Apple reported sales rising 5% YoY in fiscal 1Q17, and ADI’s consumer segment revenue increased 63.7% YoY during the same quarter.
Apple has launched two new smartphones this quarter: iPhone 8 / iPhone 8 Plus and premium iPhone X handset. This increases ADI’s content per phone and we expect to see high growth in consumer revenue.
Internet of Things – IoT
The Internet of things (IoT) is “the inter-networking of physical devices, vehicles (also referred to as "connected devices" and "smart devices"), buildings, and other items embedded with electronics, software, sensors, actuators, and network connectivity which enable these objects to collect and exchange data.”(2)
To simplify, IoT is basically connecting any device with an on and off switch to the Internet or vice versa. This includes everything from cellphones, coffee makers, washing machines, headphones, lamps, wearable devices and almost anything else you can think of (21). As more information is digitized, increasing analog chips are sold to assist the digital chips that process, transmit, and store information. The strong push toward wireless capabilities for electronic equipment, laptop PCs, automobile and smartphones has helped analog sales grow faster than the broader industry over the past few years.
Source: Statista
The graph shows the Size of the Internet of Things (IoT) in retail market in the United States from 2014 to 2022 (in billion U.S. dollars). It is evident the IoT market is expected to grow at a CAGR of 14% in coming years until 2022 (16). This means that the demand for analog chips and ICs will increase and improve drastically in coming years promising a healthy growth for the entire semiconductor industry.
Cloud Services
The sensors used for Internet of Things (IoT) just collect the data, measure and evaluates it. But IoT creates real value when the thus gathered data can be leveraged and applied to take decisions. Cloud services provide an infrastructure to save this data and analyze it in real time.
IoT cannot function without cloud-based applications that interpret and transmit the data coming from all these sensors. The cloud enables the apps to work anytime, anywhere.
Source: electroiq.com
The graph shows the explosive growth in demand for data storage and processing in the cloud (growing at a CAGR of 33%). The sales of analog devices for ADI is highly dependent on sales and availability of Cloud services
Market size of IoT in U.S.
Demand for data storage and Cloud Processing

Page 8
Electric Cars
Source: Statista
The graph above explains that the Global automotive sensors market from 2015 to 2021 is growing at a great speed CAGR of 10%. This shows an opportunity that ADI can leverage to sell its analog ICs and chips and increase the per vehicle content for smart vehicles.
The below graph shows the average value of power semiconductors per vehicle and its growth by 2022.
Source: www.powerelectronics.com
ADI expects the per vehicle dollar-content opportunity (currently $250) to double by next 5-7 years because traditional cars adding additional electronic content in their vehicles such as sensors, active safety systems, and advanced infotainment systems.
Book to Bill ratio
Source : semi.org(24)
Book to Bill ratio is “the ratio of new orders to completed sales in the semiconductor industry, regarded as an economic indicator for overall trends in the technology sector.”(2) It indicates how fast a company can satisfy demand for its products, is company under-selling their product , does company need to invest in speeding up their production and or shipping processes.
As we see the latest Book to Bill ratio is 1.06 as of Dec 2016, it indicates there is higher demand, demand is outpacing the supply but it still indicates a positive outlook and growth prospects for the semiconductor industry as a whole.
MARKETS AND COMPETITION
The semiconductor industry is highly cyclical as we already discussed. The demands for the products are highly associated with the end-market demand for cell phones, electronic equipment, high-tech automobile, etc. The chance for Analog Devices to improve profitability is to heavily invest in R&D to create new products and increase higher-end offerings for applications in non-consumer end-markets, increasing sales and driving gross margins, such as industrial and automobiles.
Analog markets are also appealing because there are innumerable designs available and once a company wins a spot in a customer's product, the apt price can be fixed, and maintain better price stability than many digital markets, where commodity pricing pressures prevail.
24
29
36
43
0
5
10
15
20
25
30
35
40
45
50
2015 2017 2019 2021
Mark
et siz
e in
bill
ion U
.S.
dolla
rs
1.061.05
1.00
1.15
1.00
1.04
0.98
1.10
0.95
1.00
1.05
1.10
1.15
1.20
Dec-14 Jul-15 Jan-16 Aug-16 Mar-17
Book to RatioDemand for data storage and Cloud Processing

Page 9
We have evaluated the market conditions based on Porter’s Five Forces model:
Threat of New Entrants: This industry of manufacturing analog chips is extremely difficult to enter. Reasons being first it requires a big amount of investment as setting up a chip fabrication factory requires billions of dollars. Second, the skill set is different for analog engineers than for digital designers, and it needs a practical experience beyond graduate education to fully develop the skills. After the setup cost, the expenditure to sustain the business is high too. Hence, the companies in this industry are forming alliances, evident from number of mergers and acquisitions taking place. This helps them be a market leader and spread out the costs of manufacturing.
Power of Suppliers : Suppliers have very little power for large analog chipmakers and semiconductor companies. There are many suppliers, which increases the power of companies in this industry to keep the bargaining power of any one supplier to a minimum.
Power of Buyers. The buyers have a little to medium bargaining power because industry is dominated by a small number of large players. These small number of large players fulfill the demand of diverse customer groups all across various segments including industrials, telecommunication, automobile, etc. But a few analog products contain high proprietary design content with equivalent products available from only a limited number of other analog chipmakers.
Availability of Substitutes. The threat of substitutes is relatively high and also depends on intellectual property protection that might give exclusive rights of manufacturing certain types for chips to a company for a short period of time. After that it is very easy for competitive company to produce equivalent products at lower prices. The company invests huge capital and resources in R&D in building smarter chips but the others just copy and take advantage of the invention.
Competitive Rivalry. The competition is extremely intense in this industry. Chip makers get their market share by differentiating themselves by manufacturing better, high speed, efficient chips. So, they are under constant pressure to come up with something better, faster and
cheaper than existing and produce cutting-edge technology while riding volatile business conditions.
Peer Comparisons
Revenue and Price to Sales
Source: Factset (13)
The graph above shows the comparison of total sales and P/S ratio among the Peer group of ADI. In terms of revenue, Texas Instruments followed by NXP Semiconductors have the biggest market shares. Analog Devices is the third largest in terms of revenue share of the market but it is still better than its peer companies.
Almost 80% of revenue for Texas Instruments comprises of Analog and embedded processors and extreme diverse customer base. The acquisition of NXP semiconductors by Qualcomm will end in 2017 end, for almost $14 billion, which is supposed to be one of the biggest deal in Semiconductor industry and would make Qualcomm a giant player.
It looks like Texas Instruments, Skyworks Solutions and ADI has one of the highest Forward Price to sales ratio amongst their peer group. A higher P/S ratio projects that the market expects maintenance of premium pricing of its products and safeguard of its margins from the firm. The other view can say that higher P/S ratio means company is overvalued but we cannot view P/S ratio only, as with any other ratio, the P/S ratio cannot be viewed in isolation, because it gives a smaller view of company’s valuation and outlook.

Page 10
Margins – Gross and Operating
Source: Factset (13)
The graph above shows the comparison of gross margin and EBITDA margin of Adi with its peer companies In the Semiconductor market.
In terms of Gross margins, ADI has the highest gross margin percentage (68% - 70%) amongst other companies, followed by Maxim Integrated products at 63% and Texas Instruments at 61%. For ADI, the acquisition of LLTC has pushed the gross profit margins from 68% in 2016 to 70% in 2017. The gross margin percentage represents the percent of total sales revenue retained by the company after incurring the direct costs to manufacture the goods and provide services. Hence, ADI’s higher percentage means it retains more on each dollar of sales, to service its other costs and debt obligations.
The EBITDA measures a company's profitability before deductions that are considered irrelevant such as interest, taxes, depreciation and amortization to the business decision-making process. The EBITDA margin is indicates the percentage of a company's earnings remaining after operating expenses. As seen in the graph, ADI has EBITDA margin almost at the median in comparison to its peers but we expect the margin to improve in near future with its merger with LLTC due to consolidation of operations.
Enterprise value/EBITDA and Price/Earnings
Source: Factset (13)
The graph above makes a peer comparison for ADI’s peer group based on two ratios – EV/EBITDA and P/E ratio. The EV/EBITDA is considered a better valuation metric as it is not affected if the capital structures changes, provides better comparison of companies with different capital structure. But price to earnings ratio indicates amount an people would invest in a company to receive one dollar of that company’s earnings. It more depends on investor’s outlook of the company’s earnings estimates. If we take a look at these ratios together, we would be able to identify company which is overvalued or undervalued.
Looking at the graph, we can see Microchip Technologies is extremely overvalued. The reason is the high net income numbers that have increased book value via retained earnings. ADI on a contrast looks to be undervalued with highest EV/EBITDA ratio but median Price/ Earnings ratio.
Debt/Equity Ratio
Source: Factset (13)

Page 11
The Debt/Equity ratio compares total liabilities to shareholders' equity. A higher median Debt /Equity ratio in the industry should raise a red flag. From the above graph, we see ADI is using very high leverage. But this is a temporary situation as the debt was raised to fund the acquisition of LLTC. The company plans to re-pay the debt at a faster pace in coming years. Microchip Technology has a sharply high debt and interest expense because of various acquisitions in the past but not able to reduce debt at a faster rate.
ECONOMIC OUTLOOK
We have a positive fundamental outlook for the semiconductor industry and analog chips manufacturers. The companies in this industry have had good growth and posted healthy earnings in last few years and we expect it to continue in future.
There is a strong correlation between growth of this industry and global employment growth. So, it is extremely necessary to forecast the US employment rate. It is also important to track the GDP growth forecasts for US as ADI’s revenue growth depends on the GDP growth. Ultimately interest expense will form a bigger component due to huge debt taken by ADI to fund LLTC acquisition. This is highly dependent on Fed Fund rates, we should forecast and estimate the rise in interest rates for coming years.
GDP Growth
Source: Tradingeconomics.com
Going forward, the US GDP will grow and is expected to remain stable at around 2.5% (2017-2019) and this should
translate to a steady demand for analog chips and ICs. GDP growth directly correlates to the buying power and disposable income available to spend on consumer discretionary electronic products such as smartphones, tablets, PCs, and other electronic devices.
Unemployment rate
A good employment rate and low unemployment rate are good signs for ADI. As the employment increases, the disposable income available for spending on consumer products and electronics increases. A good employment rate is positively correlated to spending on consumer discretionary electronics such as smartphones, tablets, PCs etc.
Source: www.tradingeconomics.com
Graph suggests that the unemployment rates in United States has been all time low recently. The unemployment rate in the US has continued to decline. Current unemployment rate is 4.4% in Aug 2017 and the Henry Fund team believes that unemployment will reach 4.3% over next 6 months. This rising employment rates indicate positive impacts on ADI’s revenue.
FED Interest rates
Federal Reserve Bank raised FED Funds rate in May 2017 to 1.16% and left the door open for further rates hikes. We forecast the fed funds rate will reach 2% over the 2 years’ horizon, while we estimate it to remain stable at 1.7% over the next six months. The increase will lead to increased borrowing costs which means that ADI will pay higher interest expense on the long-term debt borrowed for LLTC acquisition. The table below depicts interest rate trends.

Page 12
Source: Macrotrends.net
ADI’s Balance sheet represent long-term debt of around $ 8 billion. These funds have been used to fund and pay the shareholders of LLTC. As markets increases the interest rates in response to increase in Fed Funds rate, ADI will have to pay more interest on this loan.
INVESTMENT POSITIVES
• The industrial semiconductor market is expected to grow at a CAGR of 9.7% by 2019 (18). The demand for analog chips is expected to grow at a CAGR of 15% in coming years until 2022. The market trend of Internet of Things (IoT) that drives demand for the analog semiconductor industry is positive and expected to grow at 14% CAGR to 2022. (16). As more information is digitized, increasing analog chips are sold to assist the digital chips that process, transmit, and store information. The strong push toward wireless capabilities for electronic equipment, laptop PCs, automobile and smartphones has helped analog sales grow faster than the broader industry over the past few years.
• Global automotive sensors market from 2015 to 2021 is growing at a great speed CAGR of 10%. This shows an opportunity that ADI can leverage to sell its analog ICs and chips and to double the per vehicle content for smart vehicles.
• ADI has a steady and profitable business model, like other large analog players. Semiconductor industry tends to experience volatile swings in terms of operating results
and free cash flows during various stages of the industry's business cycle. Chipmakers in this segment are less risky and relatively stable.
INVESTMENT NEGATIVES
• ADI has a $8.4 billion in debt that was raised to fund and pay the shareholders of Linear Technologies as part of the acquisition deal. The fed fund rates were last raised in May 2017 and any significant increase in future can result in payment of higher interest. A further change in interest rates increases the risk associated with the investment also leading to a possible credit rating downgrade for ADI.
VALUATION
ADI follows a 52-week fiscal year ending in October. Discounted Cash Flow, Dividend Discount Model and relative P/E analysis have been used to value ADI. The three approaches presented a price of $96.8, $55 and $106 respectively. We believe that the intrinsic value of ADI’s stock is closest to the DCF-EP model as the DCF model accounts for the residual income available to all equity holders.
We believe the stock value is most closely captured by the DCF valuation as it most closely captures the revenue decomposition and growth forecasts of the different lines of business. Hence, we have given a BUY rating to the stock. The stock currently trades for around $89 and thus we estimate a high upside of 15.5%. We also used relative P/E valuation technique which presented a price of $106. We compared ADI to different semiconductor and analog chipmaker companies such as Texas Instruments, NXP Semiconductor, Microchip Technology and a few others. That can be called as the closest competitors to ADI. But there are differences in the business models and size of the clients. Due to different revenue segments and earnings composition, it is difficult to make a head to head comparison of these peer companies. Also, relative P/E valuation method assumes that market values peer stocks accurately. But these technology companies tend to have higher P/E multiples. This is because in the case of tech companies, the assumption is a growing stream of future income which increases the present value (share price) even though the present earnings are low.
FED Interest Rate Trends

Page 13
In FY 2016, ADI declared and paid $1.66 as dividend. We have assumed the 2016 payout ratio to continue in the foreseeable future and have assumed a payout ratio of 38%. No importance has been attached to the stock price derived from the DDM model due to the theoretical limitations of the DDM model not accounting for the complete residual income attributable to the equity holders of a firm. The shortcomings of Relative P/E valuation method and DDM, leads us to believe that DCF valuation captures the stock value most accurately.
Short-Term Revenue Growth Assumptions
Revenue from various segments as described earlier, is assumed to grow at a percentage which is a combination of historical average and the market growth estimates. Due to the realignment of merged segment, we would see an extraordinary growth in 2017.
Industrial - 2018 we assume the revenue to grow at a historical CAGR of 15%. 2019 onwards we assume the growth to stabilize at 7% as the demand for this segment is highly dependent on the growth of Internet of Things market (IoT) market.
Consumer - 2018 we assume the revenue to grow at a historical CAGR of 34%. 2019 onwards we assume the growth to stabilize at 28% as per the market demand.
Communications- 2018 we assume the revenue to grow at a historical CAGR of 7%. 2019 onwards we assume the growth to stabilize at 1.5% as per the market demand.
Automotive - 2018 we assume the revenue to grow at a historical CAGR of 11%. 2019 onwards we assume the growth to stabilize at 10% as per the market demand.
All these segments ensure sustainable revenue growth for ADI but we also need to consider the increased growth in other costs which grow in proportion with sales such as cost of sales - 30%, selling, general and admin - 12%, Research and Development – 19%, Special charges – 1.2% of sales. Other expenses like depreciation are expected to be CAGR rate of 20% of beginning assets. Amortization expense is taken as per the schedule provided in the 10-K.
Gross profit / Operating profit margins
Historical data shows that Gross profit margin has been between 68% and net operating margin between around
35%. By 2021, we expect a gross margin to be 70% and net margin to be around 25% which we include in our valuation model.
Capital Expenditure
Based on historical average of amount spent on Property, Plant and equipment, we expect gross tangible assets to grow at CAGR rate of following: Land and Building 10.5%, Machinery 9.7%, Office equipment 6%, Leasehold Improvement 5.45% every year. In case of intangibles, the historic growth has been due to development of technology and patents in the past. We assume that ADI makes no big acquisition in next five years and hence, intangibles grow at a low rate of CAGR 1.6% for patents relating to new technological developments.
Debt
ADI’s 10-Q mentions that it will repay 1 billion debt per year in next 5 years. We assume the same.
Share Repurchases
ADI currently has suspended their share repurchase program temporarily, that is in connection with the acquisition. We have no information on when the repurchase program will start again.
Other assumptions
Continuing value growth of EPS is assumed to be in line with estimated GDP growth i.e. estimated 3%. (21) Risk-free rate is taken as 2.66%, which is the 30-yr. treasury yield rate. Ultimately, we believe that the Equity Risk Premium is 4.8% which adequately captures the risk associated with the market over and above the risk-free rate.
Valuation Summary
The DCF model presents a stock price of $96.8, with a 4.8% equity risk premium. The various sensitivity analyses performed have been conducted that reveal the target price for ADI share to be between $94 - $100. The model presents 15.4% upside potential over current market price which is driving the BUY recommendation for the stock.

Page 14
KEYS TO MONITOR
ADI is exposed to highly cyclical semiconductor industry. Due to its diverse customer base, the sales and growth is closely related to the performance of its various end markets. Below are the risks faced by ADI and keys to be monitored essential for the growth of ADI:
• ADI’s revenue in communications segment will flow with the size and timing of various networking buildouts across the globe. Hence, the progress and growth of this industry need to be monitored.
• ADI should monitor health of industrial and automotive
end markets as more than half of its chip sales from this
segment, so weakness in these sectors can have an
impact on sales for ADI.
• ADI’s consumer business has seen a dependability on
iPhone sales and may receive an increase in content per
phone in near-term, but it is important to monitor the
iPhone sales number and relation with Apple, as sales
could fall just as quickly if Apple were to ever switch to a
different supplier.
• One of the most important keys to monitor is the competitive landscape of ADI. As ADI’s market share depends upon the technology, we must be vigilant for new technology in the market and continue to invest highly in R&D and Innovation.
REFERENCES
1. ADI 10-K, 10-Q
2. Wikipedia https://en.wikipedia.org/wiki/Analog_Devices
3. Bloomberg
4. Yahoo Finance
5. Analog Devices Website http://www.analog.com/en/about-adi/news-room/press-releases/2016/7-26-2016-adi-and-linear-technology-to-combine.html
http://investor.analog.com/releasedetail.cfm?releaseid=1016957
6. Seeking Alpha https://seekingalpha.com/article/4103029-analog-devices-adi-ceo-vincent-roche-q3-2017-results-earnings-call-transcript?part=single https://seekingalpha.com/article/4057559-microchip-tech-much-holding-share-price
7. Bloomberg
8. EE Times http://www.eetimes.com/document.asp?doc_id=1330204
9. Market Realist http://marketrealist.com/2017/02/adis-acquisition-strategy-focal-points/
10. Morningstar Equity Analyst Report
11. S&P Global Stock Report
12. Bank of America Equity report
13. Factset
14. Texas Instruments Website http://newscenter.ti.com/
15. Investopedia
http://www.investopedia.com/terms/p/price-to-salesratio.asp http://www.investopedia.com/terms/e/ebitda_to_sales_ratio.asp
16. Statista
17. IBIS World http://clients1.ibisworld.com.proxy.lib.uiowa.edu/reports/us/industry/industryoutlook.aspx?entid=752
18. NASDAQ

Page 15
http://www.nasdaq.com/article/semiconductor-industry-outlook-april-2017-cm780023
19. Semiconductor.org https://www.semiconductors.org/news/2017/06/06/global_sales_report_2017/global_semiconductor_sales_increase_21_percent_year_to_year_in_april_double_digit_annual_growth_projected_for_2017/
20. MarketRealist http://marketrealist.com/2017/02/will-apple-boost-adis-consumer-business/
21. Forbes https://www.forbes.com/sites/jacobmorgan/2014/05/13/simple-explanation-internet-things-that-anyone-can-understand/#26887ce41d09
22. https://www.wired.com/insights/2014/11/the-internet-of-things-bigger/
23. http://electroiq.com/blog/2017/02/huge-growth-in-cloud-memory-changes-semiconductor-supply-chain/
24. Powerelectronics.com
http://www.powerelectronics.com/pmics/market-power-semiconductors-automotive-rev-3-billion-2022
25. Semi.org http://www.semi.org/en/MarketInfo/billings
26. Tradingeconomics.com https://tradingeconomics.com/united-states/gdp-growth-annual
27. Macrotrends.net http://www.macrotrends.net/2015/fed-funds-rate-historical-chart
IMPORTANT DISCLAIMER
Henry Fund reports are created by student enrolled in the Applied Securities Management (Henry Fund) program at the University of Iowa’s Tippie School of Management. These reports are intended to provide
potential employers and other interested parties an example of the analytical skills, investment knowledge, and communication abilities of Henry Fund students. Henry Fund analysts are not registered investment advisors, brokers or officially licensed financial professionals. The investment opinion contained in this report does not represent an offer or solicitation to buy or sell any of the aforementioned securities. Unless otherwise noted, facts and figures included in this report are from publicly available sources. This report is not a complete compilation of data, and its accuracy is not guaranteed. From time to time, the University of Iowa, its faculty, staff, students, or the Henry Fund may hold a financial interest in the companies mentioned in this report.

Analog Devices (ADI)
Key Assumptions of Valuation Model
All figures in millions
Ticker Symbol ADI
Current Share Price $84.92
Current Model Date 9/15/2017
Fiscal Year End Oct.31
Scale Millions
Pre-Tax Cost of Debt 5.16%
Beta 1.53
Risk-Free Rate 2.66%
Equity Risk Premium 4.8%
CV Growth of NOPLAT 3.00%
CV Growth of EPS 3.00%
Operating Cash Assumption 2%
Marginal Tax Rate 9.98%
Marginal Tax Rate (Post Merger) 9.98%
WACC 8.88%
WACC (2017-CV) 8.88%
Total Shares outstanding (FY16) 308.17
Total Shares outstanding (FY17) 367.67
Current Dividend Yield 1.95%
DCF Share price $97.82
Upside potential 15.19%
DDM Price 56.10
Relative PV Price 106.39

Analog Devices (ADI)
Sensitivity Analysis
$97.82 1.332 1.382 1.432 1.482 1.532 1.582 1.632 1.682 1.732 1.782 1.832
4.40% 120.30 116.11 112.21 108.57 105.17 101.97 98.97 96.15 93.49 90.98 88.60
4.50% 117.73 113.63 109.82 106.25 102.92 99.80 96.86 94.10 91.50 89.04 86.72
4.60% 115.27 111.26 107.52 104.03 100.77 97.72 94.85 92.14 89.60 87.19 84.91
4.70% 112.91 108.98 105.32 101.91 98.72 95.72 92.91 90.27 87.77 85.42 83.19
4.80% 110.65 106.80 103.21 99.87 96.74 93.81 91.06 88.47 86.02 83.72 81.53
Equity Risk 4.90% 108.48 104.70 101.19 97.92 94.85 91.98 89.28 86.74 84.34 82.08 79.95
Premium 5.00% 106.39 102.69 99.25 96.04 93.03 90.22 87.57 85.08 82.73 80.52 78.42
5.10% 104.39 100.76 97.38 94.23 91.28 88.52 85.93 83.49 81.19 79.01 76.96
5.20% 102.46 98.90 95.59 92.50 89.60 86.89 84.35 81.95 79.70 77.56 75.55
5.30% 100.60 97.11 93.86 90.82 87.99 85.33 82.83 80.48 78.26 76.17 74.19
5.40% 98.82 95.39 92.19 89.21 86.43 83.82 81.36 79.06 76.88 74.83 72.89
5.50% 97.09 93.72 90.59 87.66 84.93 82.36 79.95 77.69 75.55 73.54 71.63
$97.82 26.00% 27.00% 28.00% 29.00% 30.00% 31.00% 32.00% 33.00% 34.00% 35.00% 36.00%
2.00% 98.23 95.32 92.41 89.49 86.58 83.67 80.76 77.85 74.94 72.04 69.13
2.25% 100.84 97.84 94.84 91.84 88.83 85.83 82.83 79.83 76.84 73.84 70.84
2.50% 103.66 100.56 97.46 94.36 91.26 88.17 85.07 81.97 78.88 75.79 72.70
2.75% 106.70 103.50 100.30 97.09 93.89 90.69 87.49 84.29 81.10 77.90 74.70
3.00% 110.00 106.69 103.37 100.06 96.74 93.43 90.11 86.80 83.50 80.19 76.88
CV NOPLAT 3.25% 113.60 110.16 106.72 103.29 99.85 96.41 92.97 89.54 86.11 82.68 79.24
Growth 3.50% 117.53 113.96 110.38 106.81 103.24 99.67 96.10 92.53 88.97 85.40 81.83
3.75% 121.84 118.12 114.40 110.68 106.97 103.25 99.53 95.81 92.10 88.39 84.67
4.00% 126.60 122.72 118.84 114.95 111.07 107.19 103.31 99.43 95.56 91.68 87.81
4.25% 131.87 127.81 123.75 119.68 115.62 111.56 107.50 103.44 99.39 95.34 91.28
4.50% 137.74 133.48 129.22 124.95 120.69 116.43 112.17 107.91 103.66 99.40 95.14
4.75% 144.32 139.84 135.35 130.86 126.38 121.89 117.40 112.92 108.44 103.96 99.48
$97.82 5.98% 6.98% 7.98% 8.98% 9.98% 10.98% 11.98% 12.98% 13.98% 14.98% 15.98%
0.16% 169.90 168.61 167.32 166.03 164.73 163.43 162.12 160.81 159.49 158.17 156.85
0.66% 148.80 147.69 146.57 145.46 144.33 143.21 142.08 140.95 139.81 138.67 137.52
1.16% 132.39 131.42 130.44 129.46 128.47 127.48 126.49 125.49 124.49 123.49 122.48
1.66% 119.28 118.41 117.53 116.66 115.78 114.90 114.01 113.12 112.23 111.33 110.44
2.16% 108.55 107.76 106.98 106.19 105.40 104.60 103.80 103.00 102.20 101.39 100.58
2.66% 99.61 98.90 98.18 97.46 96.74 96.02 95.29 94.56 93.83 93.10 92.36
3.16% 92.05 91.39 90.74 90.08 89.42 88.76 88.09 87.42 86.75 86.08 85.40
3.66% 85.56 84.96 84.36 83.75 83.15 82.53 81.92 81.30 80.69 80.06 79.44
4.16% 79.95 79.39 78.83 78.27 77.71 77.14 76.57 76.00 75.42 74.85 74.27
4.66% 75.04 74.52 74.00 73.47 72.95 72.42 71.89 71.36 70.82 70.28 69.74
5.16% 70.71 70.22 69.73 69.24 68.75 68.26 67.76 67.26 66.76 66.26 65.75
5.66% 66.85 66.40 65.94 65.48 65.02 64.55 64.09 63.62 63.15 62.68 62.20
6.16% 63.41 62.98 62.55 62.12 61.68 61.24 60.80 60.36 59.92 59.47 59.03
Risk Free
Rate
Beta
Cost of sales/sales
Tax Rate

$97.82 2.16% 2.66% 3.16% 3.66% 4.16% 5.16% 5.66% 6.16% 6.66% 7.16% 7.66%
7.0% 125.79 123.52 121.34 119.23 117.19 113.32 111.47 109.69 107.96 106.28 104.66
8.0% 122.10 119.90 117.78 115.74 113.76 110.00 108.21 106.48 104.80 103.18 101.60
9.0% 118.41 116.29 114.23 112.25 110.33 106.69 104.95 103.27 101.65 100.07 98.54
10.0% 114.73 112.67 110.68 108.76 106.90 103.37 101.69 100.07 98.49 96.96 95.48
11.0% 111.04 109.05 107.12 105.27 103.47 100.06 98.43 96.86 95.34 93.86 92.43
12.0% 107.36 105.43 103.57 101.78 100.04 96.74 95.17 93.65 92.18 90.75 89.37
13.0% 103.67 101.81 100.02 98.29 96.61 93.43 91.91 90.45 89.02 87.65 86.31
14.0% 99.99 98.19 96.47 94.80 93.18 90.11 88.65 87.24 85.87 84.54 83.25
15.0% 96.31 94.58 92.92 91.31 89.76 86.80 85.40 84.04 82.72 81.44 80.20
16.0% 92.63 90.97 89.37 87.83 86.33 83.50 82.15 80.84 79.57 78.34 77.15
17.0% 88.95 87.36 85.82 84.34 82.91 80.19 78.89 77.64 76.42 75.24 74.10
18.0% 85.27 83.74 82.27 80.86 79.48 76.88 75.64 74.43 73.27 72.14 71.05
19.0% 81.58 80.13 78.72 77.36 76.05 73.56 72.38 71.23 70.11 69.03 67.99
$97.82 0.88% 0.98% 1.08% 1.18% 1.28% 1.38% 1.48% 1.58% 1.68% 1.78% 1.88%
0.50% 97.19 97.18 97.18 97.18 97.17 97.17 97.16 97.16 97.15 97.15 97.14
0.75% 97.12 97.11 97.11 97.10 97.10 97.10 97.09 97.09 97.08 97.08 97.07
1.00% 97.05 97.04 97.04 97.03 97.03 97.02 97.02 97.01 97.01 97.01 97.00
1.25% 96.97 96.97 96.97 96.96 96.96 96.95 96.95 96.94 96.94 96.93 96.93
1.50% 96.90 96.90 96.89 96.89 96.89 96.88 96.88 96.87 96.87 96.86 96.86
1.75% 96.83 96.83 96.82 96.82 96.81 96.81 96.81 96.80 96.80 96.79 96.79
2.00% 96.76 96.76 96.75 96.75 96.74 96.74 96.73 96.73 96.73 96.72 96.72
2.25% 96.69 96.68 96.68 96.68 96.67 96.67 96.66 96.66 96.65 96.65 96.65
2.50% 96.62 96.61 96.61 96.60 96.60 96.60 96.59 96.59 96.58 96.58 96.57
2.75% 96.55 96.54 96.54 96.53 96.53 96.52 96.52 96.52 96.51 96.51 96.50
3.00% 96.48 96.47 96.47 96.46 96.46 96.45 96.45 96.44 96.44 96.44 96.43
3.25% 96.40 96.40 96.40 96.39 96.39 96.38 96.38 96.37 96.37 96.36 96.36
3.50% 96.33 96.33 96.32 96.32 96.32 96.31 96.31 96.30 96.30 96.29 96.29
$97.82
6.33% 100.99
6.83% 100.16
7.33% 99.32
7.83% 98.49
8.33% 97.66
8.83% 96.83
9.33% 95.99
9.83% 95.16
10.33% 94.33
10.83% 93.49
11.33% 92.66
11.83% 91.83
12.33% 90.99
WACC
Pre-Tax Cost of Debt
SG&A
Expense/Rev
enue
Special charges /sales
Normal Cash
%

Analog Devices (ADI)
Revenue Decomposition
All figures in millionsFiscal Years Ending Oct.31 2014 2015 2016 2017E 2018E 2019E 2020E 2021E
Total Revenue 4,253.2 4,910.2 4,845.3 5,171.2 6,050.9 6,750.0 7,585.6 8,591.7
Revenue Growth % 8.6% 15.4% -1.3% 6.7% 17.0% 11.6% 12.4% 13.3%
Segmental Analysis
Industrial 1344.906 1494.898 1,502.0 2,386.4 2,754.3 2,947.1 3,153.4 3,374.1
Automotive 525.123 525.893 540.9 794.7 881.4 968.8 1,064.9 1,170.4
Consumer 327.434 729.86 688.3 1,064.0 1,428.6 1,832.3 2,350.2 3,014.4
Communication 667.31 684.4 690.2 926.1 986.6 1,001.8 1,017.2 1,032.8
Linear Revenue (merged company) 1388.39 1475.14 1423.94 - - - - -
Total Revenue 4,253.2 4,910.2 4,845.3 5,171.2 6,050.9 6,750.0 7,585.6 8,591.7
Segmental Revenue Allocation % Industrial 32% 30% 31% 46% 46% 44% 42% 39% Automotive 12% 11% 11% 15% 15% 14% 14% 14% Consumer 8% 15% 14% 21% 24% 27% 31% 35%
Communication 16% 14% 14% 18% 16% 15% 13% 12% Linear Revenue (merged company) 33% 30% 29% 0% 0% 0% 0% 0%
Segmental Growth % Industrial 10% 11% 0% 59% 15% 7% 7% 7% Automotive 9% 0% 3% 47% 11% 10% 10% 10% Consumer -18% 123% -6% 55% 34% 28% 28% 28%
Communication 26% 3% 1% 34% 7% 2% 2% 2% Linear Revenue (merged company) 8% 6% -3%
Geographic Decomposition :
United States 1,296.51 1,830.67 1,791.56 1,912.04 2,176.80 2,360.80 2,577.19 2,833.12
Europe 1,191.48 1,231.23 1,205.33 1,286.38 1,474.96 1,611.62 1,773.20 1,965.44
Japan 531.05 548.67 495.63 528.96 618.94 690.45 775.93 878.85
China 459.26 511.37 575.69 614.40 779.43 936.98 1,128.83 1,364.48
Rest of Asia 774.9 788.26 777.15 829.40 1,000.75 1,150.13 1,330.43 1,549.86
Total Revenue 4,253.2 4,910.2 4,845.4 5,171.2 6,050.9 6,750.0 7,585.6 8,591.7
Geographic Distribution :
United States 32% 42% 37% 36% 35% 34% 33% 32%
Europe 32% 27% 25% 24% 24% 23% 23% 22%
Japan 11% 9% 10% 10% 10% 10% 10% 10%
China 16% 15% 12% 13% 14% 15% 16% 17%
Rest of Asia 9% 7% 16% 17% 17% 18% 18% 19%
Redistributed in the segments above

Analog Devices (ADI)
Income Statement (ADI merged with LLTC)
All figures in millionsFiscal Years Ending Oct.31 2014 2015 2016 2017E 2018E 2019E 2020E 2021E
Revenue 4,253.2 4,910.2 4,845.3 5,171.2 6,050.9 6,750.0 7,585.6 8,591.7
Cost of sales (1,371.0) (1,529.4) (1,535.8) (1,551.4) (1,815.3) (2,025.0) (2,275.7) (2,577.5)
Gross margin 2,882.2 3,380.9 3,309.5 3,619.8 4,235.6 4,725.0 5,309.9 6,014.2
Research and development excluding amortization of intangibles(810.1) (904.2) (930.3) (992.8) (1,161.7) (1,296.0) (1,456.4) (1,649.6)
Amortization of intangibles - Research and development (28.2) (90.5) (72.3) (346.0) (606.8) (623.9) (644.3) (665.1)
Selling, marketing, general and administrative (614.3) (648.9) (631.6) (620.5) (726.1) (810.0) (910.3) (1,031.0)
Special charges (37.3) - (13.7) (66.0) (77.2) (86.2) (96.8) (109.7)
Other operating expense - (223.7) - - - - - -
Total operating expenses (1,489.9) (1,867.3) (1,647.8) (2,025.4) (2,571.8) (2,816.0) (3,107.8) (3,455.3)
Operating income from continuing operations 1,392.2 1,513.5 1,661.7 1,594.4 1,663.8 1,909.0 2,202.1 2,558.9
Interest income excluding interest expense 12.2 8.6 21.2 14.8 0.6 2.8 5.6 8.9
Interest expense (76.0) (27.0) (88.8) (111.4) (111.4) (111.4) (100.6) (100.6)
Other, net 2.2 0.4 2.2 28.0 32.7 36.5 41.1 46.5
Income before income tax 1,330.6 1,495.5 1,596.4 1,525.9 1,585.8 1,837.0 2,148.2 2,513.7
Provision for income taxes (241.3) (277.7) (240.4) (152.3) (158.3) (183.4) (214.4) (250.9)
Income from continuing operations, net of tax 1,089.3 1,217.8 1,356.0 1,373.6 1,427.5 1,653.6 1,933.8 2,262.8
Loss / income from discontinued operations, net of tax - - - - - - - -
Net income 1,089.3 1,217.8 1,356.0 1,373.6 1,427.5 1,653.6 1,933.8 2,262.8
Year end shares outstanding 313.20 312.66 308.17 369.28 370.88 372.48 374.09 375.69
EPS (recurring) 3.48 3.90 4.40 3.72 3.85 4.44 5.17 6.02
Dividends per share 1.45 1.57 1.66 1.40 1.45 1.67 1.95 2.27
Dividend payout ratio 42% 40% 38% 38% 38% 38% 38% 38%

Analog Devices (ADI)
Balance Sheet (ADI merged with LLTC)
All figures in millionsFiscal Years Ending Oct.31 2014 2015 2016 2017E 2018E 2019E 2020E 2021E
ASSETS
Cash and cash equivalents 726.6 1,080.0 1,184.8 182.0 829.7 1,629.1 2,589.3 3,410.3
Short-term investments 3,152.7 3,151.6 4,319.3 - 0.6 3.5 9.1 18.0
Accounts receivable, net 569.9 645.8 635.1 668.0 781.7 872.0 979.9 1,109.9
Inventories 459.2 512.2 473.8 523.2 612.2 682.9 767.5 869.3
Deferred tax assets 128.9 129.2 - - - - - -
Prepaid income tax 6.6 1.9 6.4 2.7 2.8 3.2 3.8 4.4
Prepaid expenses and other current assets 132.6 143.5 110.2 117.7 137.7 153.6 172.6 195.5
Total Current assets 5,176.6 5,664.3 6,729.6 1,493.5 2,364.6 3,344.3 4,522.1 5,607.3
Land and buildings 1,449.5 1,569.9 1,618.8 788.0 870.5 961.6 1,062.2 1,173.3
Machinery and equipment 1,880.4 1,932.7 1,994.1 2,335.4 2,568.9 2,851.5 3,193.6 3,608.8
Office equipment 51.5 54.1 58.8 65.0 68.9 73.1 77.5 82.2
Leasehold improvements 50.8 55.6 59.6 67.5 71.1 75.0 79.1 83.4
Accumulated depreciation and amortization (2,532.6) (2,680.5) (2,809.4) (2,341.0) (2,697.3) (3,088.4) (3,521.5) (4,005.2)
Net property , plant & equipment 899.5 931.9 922.0 914.9 882.2 872.7 890.9 942.5
Deferred compensation plan investments 21.1 23.8 26.2 30.0 34.4 39.4 45.1 51.8
Other investments 13.4 17.5 21.9 28.1 35.9 46.0 58.8 75.3
Goodwill 1,644.6 1,638.7 1,681.3 12,241.8 12,241.8 12,241.8 12,241.8 12,241.8
Intangible,Gross 711.3 686.7 735.5 5,865.7 5,964.5 6,064.9 6,167.1 6,271.0
Accumulated Amortization (28.3) (93.7) (180.6) (526.6) (1,133.4) (1,757.2) (2,401.5) (3,066.6)
Intangible assets, net 683.0 592.9 554.9 5,339.1 4,831.1 4,307.7 3,765.6 3,204.4
Deferred tax assets 27.2 33.3 85.1 26.1 27.1 31.5 36.8 43.0
Other assets 49.8 40.6 48.4 52.3 61.2 68.3 76.7 86.9
Total assets 8,515.3 8,942.9 10,069.3 20,125.7 20,478.3 20,951.7 21,637.9 22,253.0
LIABILITIES
Accounts payable 167.2 191.9 188.9 194.7 227.9 254.2 285.7 323.5
Income taxes payable 104.5 20.9 7.4 34.1 35.4 41.0 48.0 56.1
Accrued compensation & benefits 101.3 125.5 112.0 117.2 137.1 153.0 171.9 194.7
Interest rate swap - 32.7 - - - - - -
Accrued special charges 40.5 5.9 12.4 - - - - -
Other accrued liabilities 232.2 245.0 290.6 281.0 328.9 366.9 412.3 467.0
Accrued liabilities 374.0 409.1 415.0 398.2 466.0 519.8 584.2 661.7
Debt, current - 374.6 - - - - - -
Deferred income on shipments to distributors, net 278.4 300.1 351.5 339.1 396.8 442.7 497.5 563.4
Current liabilities of discontinued operations - - - - - - - -
Total current liabilities 924.2 1,296.5 962.9 966.2 1,126.1 1,257.7 1,415.3 1,604.8
Long-term debt 872.8 495.3 1,732.2 8,199.2 7,368.0 6,536.7 5,705.5 4,552.4
Deferred income taxes 303.8 313.0 227.4 134.7 140.0 162.1 189.6 221.9
Deferred compensation plan liability 21.1 23.8 26.2 29.1 32.4 36.1 40.1 44.7
Other non-current liabilities excluding deferred compensation plan liability304.1 163.4 195.9 259.9 304.1 339.2 381.2 431.8
Total non-current liabilities 1,501.8 995.5 2,181.6 8,622.9 7,844.5 7,074.2 6,316.5 5,250.7
Total Liabilities 2,426.0 2,292.0 3,144.5 9,589.1 8,970.5 8,331.9 7,731.7 6,855.5
Shareholder's Equity :
Common stock and capital in excess of par value 2,642.9 2,739.0 2,590.8 5,333.7 5,415.9 5,498.1 5,580.3 5,662.5
Retained earnings 3,614.5 3,962.2 4,406.6 5,262.0 6,150.9 7,180.7 8,384.9 9,794.1
Accumulated other comprehensive loss / income (168.2) (50.3) (72.6) (59.0) (59.0) (59.0) (59.0) (59.0)
Total shareholders’ equity 6,089.3 6,650.9 6,924.8 10,536.7 11,507.8 12,619.8 13,906.2 15,397.5
Total liabilities & equity 8,515.3 8,942.9 10,069.3 20,125.7 20,478.3 20,951.7 21,637.9 22,253.0

Analog Devices (ADI)
Cash Flow Statement
All figures in millionsFiscal Years Ending Oct.31 2014 2015 2016
Net cash provided by operating activities 871.6 907.8 1,280.9
Net income 629.3 696.9 861.7
Total adjustments 242.3 210.9 419.2
Depreciation 114.1 130.1 134.5
Amortization of intangibles 27.9 92.1 75.3
Stock-based compensation expense 50.8 68.9 63.4
Loss on extinguishment of debt - - 3.3
Excess tax benefit - stock options (22.2) (25.0) (10.5)
Deferred income taxes (77.7) (52.2) 8.1
Other non-cash activity 4.4 7.0 24.6
Changes in operating assets and liabilities 145.0 (10.0) 120.5
Net cash used for / provided by investing activities (114.8) (17.1) (1,218.3)
Purchases of short-term available-for-sale investments (5,297.8) (4,832.8) (7,364.5)
Purchases of short-term available-for-sale investments excluding sales of short-term available-for-sale investments(7,485.2) (6,084.0) (7,697.3)
Sales of short-term available-for-sale investments 2,187.4 1,251.2 332.7
Maturities of short-term available-for-sale investments 7,318.9 4,985.0 6,375.4
Additions to property, plant and equipment (177.9) (154.0) (127.4)
Payments for acquisitions, net of cash acquired (1,945.9) (7.1) (83.2)
Change in other assets (12.1) (8.3) (18.5)
Net cash used for / provided by financing activities (576.6) (571.6) (22.9)
Early termination of debt - - (378.2)
Proceeds from / payments of derivative instruments - - (33.4)
Term loan repayments (1,995.4) - -
Proceeds from debt 1,995.4 - 1,235.3
Payments for deferred financing fees - - (26.6)
Dividend payments to shareholders (454.2) (491.1) (513.2)
Repurchase of common stock (356.3) (227.0) (370.1)
Proceeds from employee stock plans 200.1 122.6 61.5
Change in other financing activities 15.2 0.5 (7.4)
Excess tax benefit - stock options 22.2 25.0 10.5
Contingent consideration payment (3.6) (1.8) (1.4)
Effect of exchange rate changes on cash (3.1) (4.0) (2.9)
Net decrease / increase in cash and cash equivalents 177.1 315.1 36.8
Cash and cash equivalents at beginning of period 392.1 569.2 884.4
Cash and cash equivalents at end of period 569.2 884.4 921.1

Analog Devices (ADI)
Cash Flow Statement (ADI merged with LLTC)
All figures in millionsFiscal Years Ending Oct.31 2017E 2018E 2019E 2020E 2021E
Cash flow from operations:
Net Income (loss) 1,373.6 1,427.5 1,653.6 1,933.8 2,262.8
Add Depreciation (468.4) 356.3 391.1 433.1 483.7
Add Amortization 346.0 606.8 623.9 644.3 665.1
Changes :
Assets:
Accounts receivable, net 32.9 113.6 90.3 107.9 130.0
Inventories 49.4 89.0 70.7 84.5 101.8
Deferred tax assets - - - - -
Prepaid income tax (3.7) 0.1 0.4 0.5 0.6
Prepaid expenses and other current assets 7.4 20.0 15.9 19.0 22.9
Deferred tax assets (58.9) 1.0 4.3 5.3 6.3
Other assets 3.9 8.9 7.1 8.5 10.2
Change in assets (31.0) (232.7) (188.8) (225.8) (271.7)
Liabilities:
Accounts payable 5.8 33.1 26.3 31.5 37.9
Income taxes payable 26.6 1.3 5.6 6.9 8.2
Accrued compensation & benefits 5.2 19.9 15.8 18.9 22.8
Accrued special charges (12.4) - - - -
Other accrued liabilities (9.6) 47.8 38.0 45.4 54.7
Deferred income on shipments to distributors, net (12.4) 57.7 45.8 54.8 66.0
Deferred income taxes (92.7) 5.3 22.2 27.5 32.3
Other non-current liabilities 64.0 44.2 35.1 42.0 50.6
Change in liabilities (25.4) 209.4 188.9 227.0 272.4
Net cash flow from operating activities 1,194.7 2,367.2 2,668.8 3,012.3 3,412.2
Cash flow from investing :
Assets:
Short-term marketable securities 4,319.3 (0.6) (2.8) (5.6) (8.9)
Property, plant & equipment, gross 475.5 (323.6) (381.7) (451.3) (535.3)
Goodwill (10,560.5) - - - -
Intangible assets, gross (5,130.2) (98.8) (100.5) (102.2) (103.9)
Deferred compensation plan investments (3.8) (4.4) (5.0) (5.8) (6.6)
Other investments (6.1) (7.8) (10.0) (12.9) (16.4)
Deferred compensation plan liability 3.0 3.3 3.7 4.1 4.5
Net cash flow from investing activities (10,903.0) (431.9) (496.4) (573.6) (666.6)
Cash flow from financing:
Long-term debt 6,467.1 (831.3) (831.3) (831.3) (1,153.1)
Common Stock , Net of Treasury 2,742.9 82.2 82.2 82.2 82.2
Accumulated other comprehensive loss / income 13.6 - - - -
Dividends paid (518.2) (538.5) (623.8) (729.5) (853.7)
Net cash flow from financing activities 8,705.4 (1,287.6) (1,372.9) (1,478.6) (1,924.6)
Net change in cash (1,002.9) 647.7 799.5 960.2 821.0
Beginning Cash 1,184.8 182.0 829.7 1,629.1 2,589.3
Ending Cash 181.9 829.7 1,629.1 2,589.3 3,410.3

Analog Devices (ADI)
Common Size Income Statement
All figures in millionsFiscal Years Ending Oct.31 2014 2015 2016 2017E 2018E 2019E 2020E 2021E
Revenue 100.00% 100.00% 100.00% 100.00% 100.00% 100.00% 100.00% 100.00%
Cost of sales -32.24% -31.15% -31.70% -30.00% -30.00% -30.00% -30.00% -30.00%
Gross margin 67.76% 68.85% 68.30% 70.00% 70.00% 70.00% 70.00% 70.00%
Research and development excluding amortization of intangibles-19.05% -18.42% -19.20% -19.20% -19.20% -19.20% -19.20% -19.20%
Amortization of intangibles - Research and development -0.66% -1.84% -1.49% -6.69% -10.03% -9.24% -8.49% -7.74%
Selling, marketing, general and administrative -14.44% -13.22% -13.03% -12.00% -12.00% -12.00% -12.00% -12.00%
Special charges -0.88% 0.00% -0.28% -1.28% -1.28% -1.28% -1.28% -1.28%
Other operating expense 0.00% -4.56% 0.00% 0.00% 0.00% 0.00% 0.00% 0.00%
Total operating expenses -35.03% -38.03% -34.01% -39.17% -42.50% -41.72% -40.97% -40.22%
Operating income from continuing operations 32.73% 30.82% 34.29% 30.83% 27.50% 28.28% 29.03% 29.78%
Interest income excluding interest expense 0.29% 0.18% 0.44% 0.29% 0.01% 0.04% 0.07% 0.10%
Interest expense -1.79% -0.55% -1.83% -2.15% -1.84% -1.65% -1.33% -1.17%
Other, net 0.05% 0.01% 0.05% 0.54% 0.54% 0.54% 0.54% 0.54%
Income before income tax 31.29% 30.46% 32.95% 29.51% 26.21% 27.22% 28.32% 29.26%
Provision for income taxes -5.67% -5.65% -4.96% -2.95% -2.62% -2.72% -2.83% -2.92%
Income from continuing operations, net of tax 25.61% 24.80% 27.99% 26.56% 23.59% 24.50% 25.49% 26.34%
Loss / income from discontinued operations, net of tax 0.00% 0.00% 0.00% 0.00% 0.00% 0.00% 0.00% 0.00%
Net income 25.61% 24.80% 27.99% 26.56% 23.59% 24.50% 25.49% 26.34%

Analog Devices (ADI)
Common Size Balance Sheet
All figures in millionsFiscal Years Ending Oct.31 2014 2015 2016E 2017E 2018E 2019E 2020E 2021E
ASSETS
Cash 6.46% 5.46% 6.84% -12.98% -0.39% 11.50% 22.89% 29.76%
Institutional Money Market Funds 10.62% 16.53% 17.61% 16.50% 14.10% 12.64% 11.25% 9.93%
Cash and cash equivalents 17.08% 22.00% 24.45% 3.52% 13.71% 24.14% 34.13% 39.69%
Short-term investments 74.13% 64.18% 89.14% 0.00% 0.01% 0.05% 0.12% 0.21%
Accounts receivable, net 13.40% 13.15% 13.11% 12.92% 12.92% 12.92% 12.92% 12.92%
Inventories 10.80% 10.43% 9.78% 10.12% 10.12% 10.12% 10.12% 10.12%
Deferred tax assets 3.03% 2.63% 0.00% 0.00% 0.00% 0.00% 0.00% 0.00%
Deferred compensation plan investments 0.00% 0.00% 0.00% 0.00% 0.00% 0.00% 0.00% 0.00%
Prepaid income tax 0.16% 0.04% 0.13% 0.05% 0.05% 0.05% 0.05% 0.05%
Prepaid expenses and other current assets 3.12% 2.92% 2.28% 2.28% 2.28% 2.28% 2.28% 2.28%
Current assets of discontinued operations 0.00% 0.00% 0.00% 0.00% 0.00% 0.00% 0.00% 0.00%
Total Current assets 121.71% 115.36% 138.89% 28.88% 39.08% 49.55% 59.61% 65.26%
Land and buildings 34.08% 31.97% 33.41% 15.24% 14.39% 14.25% 14.00% 13.66%
Machinery and equipment 44.21% 39.36% 41.16% 45.16% 42.45% 42.24% 42.10% 42.00%
Office equipment 1.21% 1.10% 1.21% 1.26% 1.14% 1.08% 1.02% 0.96%
Leasehold improvements 1.19% 1.13% 1.23% 1.30% 1.18% 1.11% 1.04% 0.97%
Accumulated depreciation and amortization -59.55% -54.59% -57.98% -45.27% -44.58% -45.75% -46.42% -46.62%
Net property , plant & equipment 21.15% 18.98% 19.03% 17.69% 14.58% 12.93% 11.74% 10.97%
Deferred compensation plan investments 0.50% 0.48% 0.54% 0.58% 0.57% 0.58% 0.60% 0.60%
Other investments 0.31% 0.36% 0.45% 0.54% 0.59% 0.68% 0.78% 0.88%
Goodwill 38.67% 33.37% 34.70% 236.73% 202.31% 181.36% 161.38% 142.48%
Intangible,Gross 16.72% 13.98% 15.18% 113.43% 98.57% 89.85% 81.30% 72.99%
Accumulated Amortization -0.66% -1.91% -3.73% -10.18% -18.73% -26.03% -31.66% -35.69%
Intangible assets, net 16.06% 12.08% 11.45% 103.25% 79.84% 63.82% 49.64% 37.30%
Deferred tax assets 0.64% 0.68% 1.76% 0.51% 0.45% 0.47% 0.48% 0.50%
Other assets 1.17% 0.83% 1.00% 1.01% 1.01% 1.01% 1.01% 1.01%
Non-current assets of discontinued operations 0.00% 0.00% 0.00% 0.00% 0.00% 0.00% 0.00% 0.00%
Total assets 200.21% 182.13% 207.81% 389.19% 338.44% 310.40% 285.25% 259.00%
LIABILITIES
Accounts payable 3.93% 3.91% 3.90% 3.77% 3.77% 3.77% 3.77% 3.77%
Income taxes payable 2.46% 0.43% 0.15% 0.66% 0.59% 0.61% 0.63% 0.65%
Accrued compensation & benefits 2.38% 2.56% 2.31% 2.27% 2.27% 2.27% 2.27% 2.27%
Interest rate swap 0.00% 0.67% 0.00% 0.00% 0.00% 0.00% 0.00% 0.00%
Accrued special charges 0.95% 0.12% 0.26% 0.00% 0.00% 0.00% 0.00% 0.00%
Other accrued liabilities 5.46% 4.99% 6.00% 5.43% 5.43% 5.43% 5.43% 5.43%
Accrued liabilities 8.79% 8.33% 8.57% 7.70% 7.70% 7.70% 7.70% 7.70%
Debt, current 0.00% 7.63% 0.00% 0.00% 0.00% 0.00% 0.00% 0.00%
Deferred income on shipments to distributors, net 6.55% 6.11% 7.26% 6.56% 6.56% 6.56% 6.56% 6.56%
Current liabilities of discontinued operations 0.00% 0.00% 0.00% 0.00% 0.00% 0.00% 0.00% 0.00%
Total current liabilities 21.73% 26.40% 19.87% 18.68% 18.61% 18.63% 18.66% 18.68%
Long-term debt 20.52% 10.09% 35.75% 158.56% 121.77% 96.84% 75.21% 52.99%
Deferred income taxes 7.14% 6.37% 4.69% 2.60% 2.31% 2.40% 2.50% 2.58%
Deferred compensation plan liability 0.50% 0.48% 0.54% 0.56% 0.54% 0.53% 0.53% 0.52%
Other non-current liabilities excluding deferred compensation plan liability7.15% 3.33% 4.04% 5.03% 5.03% 5.03% 5.03% 5.03%
Total non-current liabilities 35.31% 20.27% 45.02% 166.75% 129.64% 104.80% 83.27% 61.11%
Total Liabilities 57.04% 46.68% 64.90% 185.43% 148.25% 123.44% 101.93% 79.79%
Shareholder's Equity : 0.00% 0.00% 0.00% 0.00% 0.00% 0.00% 0.00% 0.00%
Common stock and additional paid in capital 62.14% 55.78% 53.47% 103.14% 89.51% 81.45% 73.56% 65.91%
Retained earnings 84.98% 80.69% 90.94% 101.76% 101.65% 106.38% 110.54% 113.99%
Accumulated other comprehensive loss / income -3.95% -1.02% -1.50% -1.14% -0.98% -0.87% -0.78% -0.69%
Total shareholders’ equity 143.17% 135.45% 142.92% 203.76% 190.18% 186.96% 183.32% 179.21%
Total liabilities & equity 200.21% 182.13% 207.81% 389.19% 338.44% 310.40% 285.25% 259.00%

Analog Devices (ADI)
Value Driver Estimation
All figures in millionsFiscal Years Ending Oct.31 2014 2015 2016 2017E 2018E 2019E 2020E 2021E
Marginal Tax Rate Calculation:
Federal Statuatory rate 35.00% 35.00% 35.00% 35.00% 35.00% 35.00% 35.00% 35.00%
State income taxes, net of federal effect -0.87% -0.55% -0.6% -0.6% -0.6% -0.6% -0.6% -0.6%
Foreign rate differential -24.59% -24.45% -28.9% -24.5% -24.5% -24.5% -24.5% -24.5%
Marginal Tax Rate 9.54% 10.00% 5.55% 9.98% 9.98% 9.98% 9.98% 9.98%
EBITA Calculations:
Net Revenue 4,253 4,910 4,845 5,171 6,051 6,750 7,586 8,592
Less: Cost of sales (1,371) (1,529) (1,536) (1,551) (1,815) (2,025) (2,276) (2,578)
Less: Research & development expenses (810) (904) (930) (993) (1,162) (1,296) (1,456) (1,650)
Less: Selling, marketing, general & administrative expenses(614) (649) (632) (621) (726) (810) (910) (1,031)
Less: Amortization of intangibles (28) (91) (72) (346) (607) (624) (644) (665)
Less: Other operating expenses - (224) - - - - - -
Add: Implied Interest on Operating Leases 3.5 2.8 2.3 4.4 4.9 5.4 5.9 6.5
EBITA 1,433 1,516 1,678 1,665 1,746 2,001 2,305 2,675
Less Adjusted Income Taxes:
Provision for Income Taxes 241 278 240 152 158 183 214 251
Add Tax Shield on Special Charges 3.56 - 0.76 6.59 7.71 8.60 9.66 10.95
Add Tax Shield on Interest Expense 7.25 2.70 4.93 11.12 11.12 11.12 10.04 10.04
Add Tax Shield on Implied Interest on Operating Leases0.34 0.28 0.13 0.44 0.49 0.54 0.59 0.65
Less Tax on Interest Income (1.16) (0.86) (1.18) (1.48) (0.06) (0.28) (0.56) (0.89)
Less Tax on other non operating income (expenses) (0.21) (0.04) (0.12) (2.79) (3.27) (3.65) (4.10) (4.64) Adjusted income Taxes 251.11 279.75 244.87 166.19 174.28 199.70 230.09 267.05
Add Change in Deferred Taxes:
DT Liabilities 304 313 227 135 140 162 190 222
DT Assets 156 163 85 26 27 31 37 43
Net Changes to DT 148 150 142 109 113 131 153 179
Change in DT 256 3 (8) (34) 4 18 22 26
NOPLAT : EBITA - Adjusted Taxes + Change in
NOPLAT 1,438 1,239 1,425 1,465 1,576 1,819 2,097 2,434

Operating Current Assets:
Cash on Balance Sheet 727 1,080 1,185 182 830 1,629 2,589 3,410
Operating Cash Assumption (2% of Revenue) 85 98 97 103 121 135 152 172
Accounts receivable, net 570 646 635 668 782 872 980 1,110
Inventories 459 512 474 523 612 683 767 869
Prepaid income tax 7 2 6 3 3 3 4 4
Prepaid expenses & other current assets 133 144 110 118 138 154 173 195 Operating Current Assets 1,253 1,402 1,322 1,415 1,655 1,847 2,075 2,351
Operating Current Liabilities:
Accounts payable 167 192 189 195 228 254 286 324
Deferred income on shipments to distributors, net 278 300 352 339 397 443 497 563
Income taxes payable 105 21 7 34 35 41 48 56
Accrued compensation & benefits 101 126 112 117 137 153 172 195
Other accrued liabilities 232 245 291 281 329 367 412 467
Operating Current Liabilities 884 883 951 966 1,126 1,258 1,415 1,605
Other Operating Assets:
Net property, plant & equipment 899 932 922 915 882 873 891 942
Intangible assets, net 683 593 555 5,339 4,831 4,308 3,766 3,204
Other assets 50 41 48 52 61 68 77 87
PV of Operating Leases 55 45 85 94 104 115 127 140
Other Operating Assets 1,687 1,610 1,611 6,400 5,879 5,364 4,860 4,374
Other Operating Liabilities:
Other non-current liabilities 304 163 196 260 304 339 381 432
Other Operating Liabilities 304 163 196 260 304 339 381 432
Invested Capital:
Invested Capital 1,753 1,965 1,787 6,589 6,104 5,613 5,139 4,688
Return on Invested Capital:
NOPLAT 1,438 1,239 1,425 1,465 1,576 1,819 2,097 2,434 Beginning Invested Capital 981 1,753 1,965 1,787 6,589 6,104 5,613 5,139
ROIC 147% 71% 73% 82% 24% 30% 37% 47%
Economic Profit: Begin IC * ( ROIC -WACC)
Beginning Invested Capital 981 1,753 1,965 1,787 6,589 6,104 5,613 5,139
ROIC 147% 71% 73% 82% 24% 30% 37% 47%
WACC 8.88% 8.88% 8.88% 8.88% 8.88% 8.88% 8.88% 8.88%Economic Profit 1,351 1,084 1,250 1,306 991 1,277 1,599 1,978
FCF: NOPLAT+Change in Invested Capital
NOPLAT 1,438 1,239 1,425 1,465 1,576 1,819 2,097 2,434
Add: Beg Invested Capital 981 1,753 1,965 1,787 6,589 6,104 5,613 5,139
Less: Current Invested Capital 1,753 1,965 1,787 6,589 6,104 5,613 5,139 4,688 FCF 666 1,027 1,603 (3,338) 2,062 2,309 2,571 2,885

Present Value of Operating Lease Obligations (2016) Present Value of Operating Lease Obligations (2015)
Operating Operating
Fiscal Years Ending Oct.31 Leases Fiscal Years Ending Oct.31 Leases
2017 37.885 2016 24.93
2018 27.772 2017 9.18
2019 10.154 2018 4.99
2020 8.47 2019 2.57
2021 5.666 2020 2.19
Thereafter 5.541 Thereafter 6.21
Total Minimum Payments 95.488 Total Minimum Payments 50.08
Less: Interest 10 Less: Interest 6
PV of Minimum Payments 85 PV of Minimum Payments 44.50
Capitalization of Operating Leases Capitalization of Operating Leases
Pre-Tax Cost of Debt 5.16% Pre-Tax Cost of Debt 5.16%
Number Years Implied by Year 6 Payment 1.0 Number Years Implied by Year 6 Payment 2.8
Lease PV Lease Lease PV Lease
Year Commitment Payment Year Commitment Payment
1 37.885 36.0 1 24.934 23.7
2 27.772 25.1 2 9.1835 8.3
3 10.154 8.7 3 4.991 4.3
4 8.47 6.9 4 2.572 2.1
5 5.666 4.4 5 2.188 1.7
6 & beyond 5.541 4.1 6 & beyond 2.188 4.4
PV of Minimum Payments 85.3 PV of Minimum Payments 44.5

Present Value of Operating Lease Obligations (2014) Present Value of Operating Lease Obligations (2013)
Operating Operating
Fiscal Years Ending Oct.31 Leases Fiscal Years Ending Oct.31 Leases
2015 25.58 2014 30.65
2016 13.34 2015 15.68
2017 12.34 2016 14.88
2018 4.19 2017 6.45
2019 3.89 2018 6.25
Thereafter 1.45 Thereafter 2.95
Total Minimum Payments 60.793 Total Minimum Payments 76.871
Less: Interest 6 Less: Interest 8
PV of Minimum Payments 54.53 PV of Minimum Payments 68.45
Capitalization of Operating Leases Capitalization of Operating Leases
Pre-Tax Cost of Debt 5.16% Pre-Tax Cost of Debt 5.16%
Number Years Implied by Year 6 Payment 1.0 Number Years Implied by Year 6 Payment 1.0
Lease PV Lease Lease PV Lease
Year Commitment Payment Year Commitment Payment
1 25.581 24.3 1 30.645 29.1
2 13.339 12.1 2 15.683 14.2
3 12.339 10.6 3 14.883 12.8
4 4.1905 3.4 4 6.4535 5.3
5 3.8905 3.0 5 6.2535 4.9
6 & beyond 1.453 1.1 6 & beyond 2.953 2.2
PV of Minimum Payments 54.5 PV of Minimum Payments 68.4

Analog Devices (ADI)
Weighted Average Cost of Capital (WACC) Estimation
All figures in millions
Marginal Tax Rate 9.98%
Cost of equity Calculation
Risk Free Rate 2.66%
+
Beta* 1.53
Market Risk Premium 4.80%
= Cost of Equity 10.01%
WACC Calculation (2017)
Shares outstanding 367.67
MV of shares 84.92=Total MV of Equity [E] 31222.28
MV of ST Debt (ST) 0.00
MV of LT Debt (LT) 8199.00
PV of Operating Leases (OL) 85.30
Cost of ST Debt 5.16%
Cost of LT Debt 5.16%
Cost of Operating Leases 5.16%
MV of equity 31222.28
+
MV of debt 8284.30
= MV of the firm [V] 39506.59
Cost of Equity * 10.01%
(E/V) 79.03%
+
Cost of ST Debt 5.16%
(1-Marginal tax Rate) 90.02%
(ST/V) 0.00%
+
Cost of LT Debt 5.16%
(1-Marginal tax Rate) 90.02%
(LT/V) 20.75%
+
Cost of Operating Leases 5.16%
(1-Marginal tax Rate) 90.02%
(OL/V) 0.22%
= WACC 8.89%

WACC Calculation (2017-CV)
Marginal Tax Rate 9.98%
Cost of equity Calculation
Risk Free Rate 2.66%
+
Beta* 1.53
Market Risk Premium 4.80%
= Cost of Equity 10.01%
Shares outstanding 367.67
MV of shares 84.92=Total MV of Equity [E] 31222.28
MV of ST Debt (ST) 0.00
MV of LT Debt (LT) 8284.30
PV of Operating Leases (OL) 85.30
Cost of ST Debt 5.16%
Cost of LT Debt 5.16%
Cost of Operating Leases 5.16%
MV of equity 31222.28
+
MV of debt 8369.61
= MV of the firm [V] 39591.89
Cost of Equity * 10.01%
(E/V) 78.86%
+
Cost of ST Debt 5.16%
(1-Marginal tax Rate) 90.02%
(ST/V) 0.00%
+
Cost of LT Debt 5.16%
(1-Marginal tax Rate) 90.02%
(LT/V) 20.92%
+
Cost of Operating Leases 5.16%
(1-Marginal tax Rate) 90.02%
(OL/V) 0.22%
= WACC 8.88%

Analog Devices (ADI)
Discounted Cash Flow (DCF) and Economic Profit (EP) Valuation Models
All figures in millions
Key Inputs:
CV Growth 3.00%
CV ROIC 47%
WACC 8.88%
Cost of Equity 10.01%
Fiscal Years Ending Oct.31 2017E 2018E 2019E 2020E 2021E
DCF Model
Discount period 1 2 3 4 5
NOPLAT 1465 1576 1819 2097 2434
Continuing Value 38801
Free Cash Flow -3338 2062 2309 2571 2885
Net FCF -3338 2062 2309 41372
(Discounting Factor) ^-1 0.92 0.84 0.77 0.71 0.65 PV of free cash flows -3066 1739 1789 29443
Value of Operations discounted to 2016 29905
Non Operating Assets
Excess Cash 1088
Short-term investments 4319
Deferred compensation plan investments 26
Other investments 22
Value of Non Operating Assets 5455
Non Operating Liabilities (2017)
PV of Operating Leases 85
Interest rate swap 0
Deferred compensation plan liability 26
Total Debt 1732
PV of employee stock options 347
Value of Non Operating Liabilities 2191
Equity Value with Value of Operations 33169.88
Shares outstanding 367.67
Intrinsic Share Price 90.22
Intrinsic Share Price (Today) 97.82
Current Share Price 84.92

Key Inputs:
CV Growth 3.00%
CV ROIC 47.36%
WACC 8.88%
Cost of Equity 10.01%
Fiscal Years Ending 2017E 2018E 2019E 2020E 2021E
EP Model
Periods to discount 1 2 3 4 5
Economic Profit 1306 991 1277 1599 1978
Continuing Value 33662
Net EP 1306 991 1277 35260
(Discounting Factor) ^-1 0.92 0.84 0.77 0.71 0.65
PV of Economic Profit 1200 836 989 25093
Initial Invested CapitaL 1787
Value of Operations 29905
Non Operating Assets
Excess Cash 1,088
Short-term investments 4,319
Deferred compensation plan investments 26
Other investments 22
Value of Non Operating Assets 5,455
Non Operating Liabilities
PV of Operating Leases 85
Interest rate swap -
Deferred compensation plan liability 26
Total Debt 1,732
PV of employee stock options 347
Value of Non Operating Liabilities 2,191
Equity Value with Value of Operations computed 33,169.9
Shares outstanding 367.7
Intrinsic Share Price 90.2
Intrinsic Share Price (Today) 97.8

Analog Devices (ADI)
Dividend Discount Model (DDM) or Fundamental P/E Valuation Model
All figures in millions
Fiscal Years Ending Oct.31 2017E 2018E 2019E 2020E 2021E
Period of Discount 1 2 3 4 4
EPS 3.72$ 3.85$ 4.44$ 5.17$ 6.02$
Key Assumptions
CV growth 3.00%
CV ROE 14.70%
Cost of Equity 10.01%
Future Cash Flows
P/E Multiple (CV Year) 11.35
EPS (CV Year) 6.02
Future Stock Price 68.37
Dividends Per Share 1.40 1.45 1.67 1.95
Future Cash Flows 1.40 1.45 1.67 1.95 68.37
Discounted Cash Flows 1.28 1.20 1.26 1.33 46.68
Intrinsic Value 51.75$
Intrinsic Share Price (Today) 56.10
Current Share Price $84.92

Analog Devices (ADI)Relative Valuation Models
EPS EPS EPSTicker Company Price 2017E 2018E 2019E P/E 17 P/E 18 P/E 19
NXPI NXP Semiconductors NV $112.16 $5.71 $6.31 $7.13 19.6 17.8 15.7
TXN Texas Instruments $82.07 $4.08 $4.12 $4.29 20.1 19.9 19.1
MXIM Maxim Integrated Products $46.56 $1.98 $2.34 $2.49 23.5 19.9 18.7
MCHP Microchip Technology $86.12 $1.93 $5.27 $5.64 44.7 16.4 15.3
SWKS Skyworks Solutions $106.17 $5.21 $6.38 $7.27 20.4 16.6 14.6
SLAB Silicon Laboratories $75.95 $1.68 $3.05 $3.46 45.2 24.9 22.0
IDTI Integrated Device Tech $24.94 $0.76 $1.49 $1.75 32.6 16.7 14.3
CRUS Cirrus Logic $56.93 $4.32 $4.75 $4.80 13.2 12.0 11.9
SMTC Semtech $36.20 $0.95 $1.89 $2.22 38.1 19.1 16.3
ADI Analog Devices (ADI) $84.92 $3.72 $3.85 $4.44 22.8 22.1 19.1
Implied Value:
Relative P/E (EPS17) $ 106.39
Relative P/E (EPS18) 69.83$
Relative P/E (EPS19) 72.90$

Analog Devices (ADI)
Key Management Ratios
Fiscal Years Ending Oct.31 2014 2015 2016 2017E 2018E 2019E 2020E 2021E
Liquidity Ratios
Current Ratio (Current Assets/ Current Liabilities) 5.60 4.37 6.99 1.55 2.10 2.66 3.20 3.49
Operating Cash Flow Ratio (Operating CF/ Current Liabilities) 0.94 0.70 1.33 1.24 2.10 2.12 2.13 2.13
Quick Ratio (Cash and other liquid assets) / current liabilities 0.79 0.83 1.23 0.19 0.74 1.30 1.83 2.13
Activity or Asset-Management Ratios
Asset Turnover Ratio (Sales/Total Assets) 0.50 0.55 0.48 0.26 0.30 0.32 0.35 0.39
Inventory Turnover Ratio (Sales/Total Inventory) 9.26 9.59 10.23 9.88 9.88 9.88 9.88 9.88
Receivables Turnover Ratio (Sales/Average Accounts Receivable)8.18 8.08 7.57 7.94 8.35 8.16 8.19 8.22
Financial Leverage Ratios
Debt-to-Equity Ratio (Total Debt/Total Equity) 0.14 0.07 0.25 0.78 0.64 0.52 0.41 0.30
Equity Ratio (Total Equity/ Total Assets) 0.72 0.74 0.69 0.52 0.56 0.60 0.64 0.69
Interest Coverage (Operating Income) / (Interest Expense) 18.33 55.99 18.72 14.31 14.94 17.14 21.89 25.44
Profitability Ratios
Return on Assets (Net Income/Total Assets) 12.8% 13.6% 13.5% 6.8% 7.0% 7.9% 8.9% 10.2%
Return on Equity (Net Income/Shareholders Equity) 17.9% 18.3% 19.6% 13.0% 12.4% 13.1% 13.9% 14.7%
Gross Margin (Revenue-COGS)/Revenue 67.8% 68.9% 68.3% 70.0% 70.0% 70.0% 70.0% 70.0%
EBIT Margin (EBIT/Sales) 31.3% 30.5% 32.9% 29.5% 26.2% 27.2% 28.3% 29.3%
Profit Margin (Net Income/Sales) 25.6% 24.8% 28.0% 26.6% 23.6% 24.5% 25.5% 26.3%
Payout Policy Ratios
41.7% 40.3% 37.7% 37.7% 37.7% 37.7% 37.7% 37.7%
Payout Ratio (Dividend Payout Ratio) 41.7% 40.3% 37.7% 37.7% 37.7% 37.7% 37.7% 37.7%
Total Payout Ratio (Dividends paid + Repurchases)/NI

VALUATION OF OPTIONS GRANTED IN ESOP
Ticker Symbol ADI
Current Stock Price $84.92
Risk Free Rate 2.66%
Current Dividend Yield 1.95%
Annualized St. Dev. of Stock Returns 21.96%
Average Average B-S Value
Range of Number Exercise Remaining Option of Options
Outstanding Options of Shares Price Life (yrs) Price Granted
Range 1 10.1 51.22 6.30 34.32$ 347$
Total 10 51.22$ 6.30 34.32$ 347$

Effects of ESOP Exercise and Share Repurchases on Common Stock Balance Sheet Account and Number of Shares Outstanding
Number of Options Outstanding (shares): 10
Average Time to Maturity (years): 6.30
Expected Annual Number of Options Exercised: 2
Current Average Strike Price: 51.22$
Cost of Equity: 10.01%
Current Stock Price: $84.92
2017E 2018E 2019E 2020E 2021E
Increase in Shares Outstanding: 2 2 2 2 2
Average Strike Price: 51.22$ 51.22$ 51.22$ 51.22$ 51.22$
Increase in Common Stock Account: 82 82 82 82 82
Change in Treasury Stock 0 0 0 0 0
Expected Price of Repurchased Shares: 84.92$ 93.42$ 102.77$ 113.06$ 124.38$
Number of Shares Repurchased: - - - - -
Shares Outstanding (beginning of the year) 308 369 371 372 374
Plus: Shares Issued to acuired company 60
Plus: Shares Issued Through ESOP 2 2 2 2 2
Less: Shares Repurchased in Treasury - - - - -
Shares Outstanding (end of the year) 369 371 372 374 376
Suspended share repurchase program due to acquisition