Embed Size (px)
Citation preview

8/3/2019 Analisis Ekonomis - Minggu 9
http://slidepdf.com/reader/full/analisis-ekonomis-minggu-9 1/37
Analisis Ekonomis
8/3/2019 Analisis Ekonomis - Minggu 9
http://slidepdf.com/reader/full/analisis-ekonomis-minggu-9 2/37
Planning
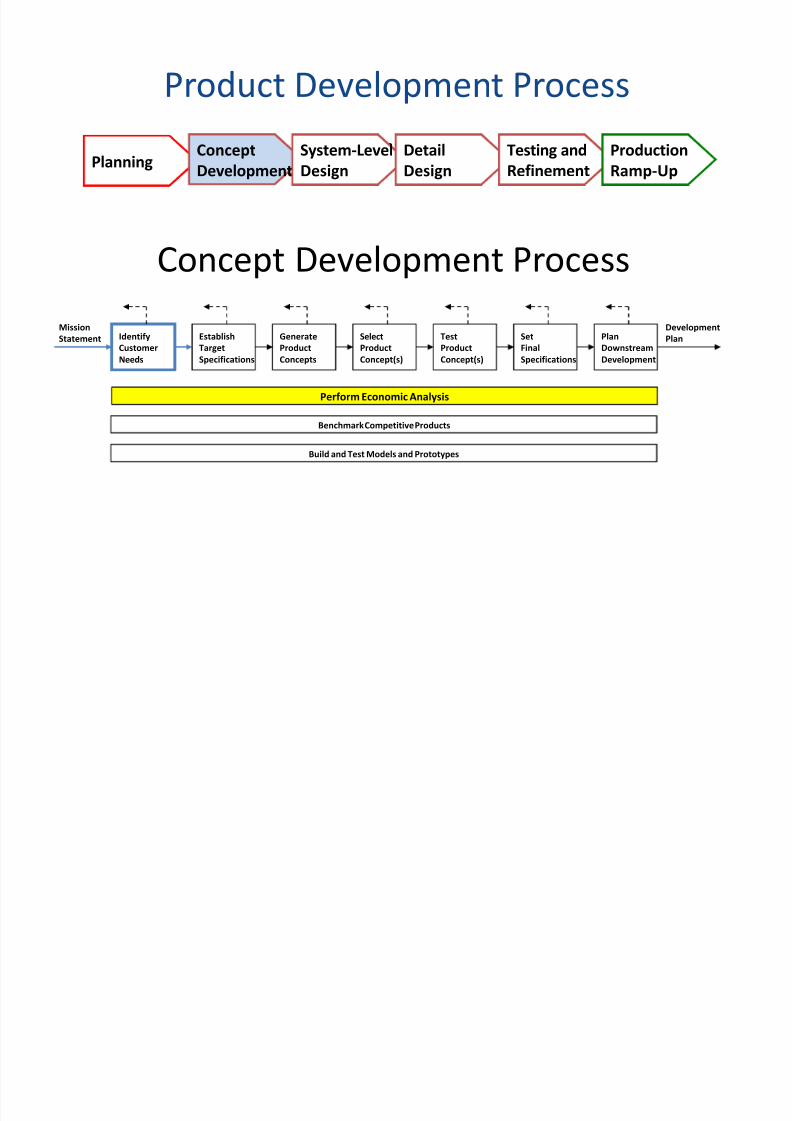
Product Development Process
Concept
Development
System-Level
Design
Detail
Design
Testing and
Refinement
Production
Ramp-Up
Concept Development Process
Perform Economic Analysis
Benchmark Competitive Products
Build and Test Models and Prototypes
Identify
Customer
Needs
Establish
Target
Specifications
Generate
Product
Concepts
Select
Product
Concept(s)
Set
Final
Specifications
Plan
Downstream
Development
Mission
Statement Test
Product
Concept(s)
Development
Plan

8/3/2019 Analisis Ekonomis - Minggu 9
http://slidepdf.com/reader/full/analisis-ekonomis-minggu-9 3/37
Time Value of Money
Proposition:
The value of money changes over time: generally$1 in the future is worth less than $1 now
Evidence:
Organizations are willing to borrow money in the
present and then return more than what theyborrowed at some point in the future (rentingmoney).

8/3/2019 Analisis Ekonomis - Minggu 9
http://slidepdf.com/reader/full/analisis-ekonomis-minggu-9 4/37
Example 1: Simple Interest Future Value
Assume:
± Invest $100 now (P=$100)
±
At 8% annual interest rate (i =8%=0.08)
± A single 1 year period (n=1)
Find: Future Value (F)
± F = (1+i)P = (1+0.08)100= $108

8/3/2019 Analisis Ekonomis - Minggu 9
http://slidepdf.com/reader/full/analisis-ekonomis-minggu-9 5/37
Example 2: Simple Interest Present Value
Assume:
± Desire a future payout of $100 (F=$100)
±
At 8% annual interest/discount rate (i =8%=0.08)
± After a single 1 year period (n=1)
Find: Present value to give F=$100
± Same equation: F = (1+i)P, but solve for P
± P=F/(1+i) = $100/(1+0.08)= $92.59

8/3/2019 Analisis Ekonomis - Minggu 9
http://slidepdf.com/reader/full/analisis-ekonomis-minggu-9 6/37
Example 3: Compound Interest Future Value
Assume: ± Invest $100 now (P=$100)
± At 8% annual interest rate (i =8%=0.08)
±
For a 3 year period (n=3) Find: Future Value (F)
± Fafter 1 year = (1+i)P = (1+0.08)100= $108
± Fafter 2 years = (1+i)(1+i)P = (1+0.08)(1+0.08)100= $116.64
±Fafter 3 years = (1+i)(1+i)(1+i)P = $125.97

8/3/2019 Analisis Ekonomis - Minggu 9
http://slidepdf.com/reader/full/analisis-ekonomis-minggu-9 7/37
Example 4: Compound Interest Present Value
Assume:
± Desire a future payout of $100 (F=$100)
±
At 8% annual interest rate (i =8%=0.08)
± After a 3 year period (n=3)
Find: Present value to give F=$100
± Same equation: F = (1+i)(1+i)(1+i)P, but solve for P
± P=$100/[(1+0.08)(1+0.08)(1+0.08)]= $79.38

8/3/2019 Analisis Ekonomis - Minggu 9
http://slidepdf.com/reader/full/analisis-ekonomis-minggu-9 8/37
General Equations for Compound Interest
Future Value:
Present Value:
Where:
± F is future value
± P is present value
± i is interest rate (or discount rate) ± n is number of periods

8/3/2019 Analisis Ekonomis - Minggu 9
http://slidepdf.com/reader/full/analisis-ekonomis-minggu-9 9/37
How Do We Compare Alternatives?
We need some form of equivalence
Present Value and Future Value can provide
th
at equivalence

8/3/2019 Analisis Ekonomis - Minggu 9
http://slidepdf.com/reader/full/analisis-ekonomis-minggu-9 10/37
Cash Flow Diagrams & Net Present Value
Page 867 Dieter and Schmidthttp://highered.mcgraw-hill.com/sites/dl/f ree/0072837039/595507/Chapter18Corr06_09.pdf

8/3/2019 Analisis Ekonomis - Minggu 9
http://slidepdf.com/reader/full/analisis-ekonomis-minggu-9 11/37
Net Present Value of the Costs of Machine A
Present Value of Year 0 Costs:
y $25,000
Present Value of Year 1 Costs:
y (2000-500)/(1+0.10)^1= $1363.63
Present Value of Year 2 Costs:
y (2000-500)/(1+0.10)^2= $1239.67
Present Value of Year 3 Costs:
y (2000-500)/(1+0.10)^3= $1126.97
Present Value of Year 4 Costs:
y
(2000-500)/(1+0.10)^4= $1024.52
Present Value of Year 5 Costs:
y (2000-500-3000)/(1+0.10)^5= -$931.38
Net Present Value of the Costs:
25,000
+1363.63
+1239.67
+1126.97
+1024.52
-931.38
$ 28,823

8/3/2019 Analisis Ekonomis - Minggu 9
http://slidepdf.com/reader/full/analisis-ekonomis-minggu-9 12/37
Interest
Number of periods Payments Made Each Period
Future Value
Using Excel for Year 3:
Present Value of Year 3 Costs:
(2000-500)/(1+0.10)^3= $1126.97

8/3/2019 Analisis Ekonomis - Minggu 9
http://slidepdf.com/reader/full/analisis-ekonomis-minggu-9 13/37
Interest
Number of periods
Payments (Costs) for Each Period
Additional Future Value
Using Excel to find the present
Value for the 5 years
of $1500 costs each year:
Present Value of the 5 years:
(2000-500)/(1+0.10)^1= $1363.63
(2000-500)/(1+0.10)^2= $1239.67
(2000-500)/(1+0.10)^3= $1126.97
(2000-500)/(1+0.10)^4= $1024.52
(2000-500)/(1+0.10)^5= $ 931.38$ 5686
0 if Payments (Costs)
made at end of period

8/3/2019 Analisis Ekonomis - Minggu 9
http://slidepdf.com/reader/full/analisis-ekonomis-minggu-9 14/37
Alternatively we can use the NPV (Net Present Value) function in Excel to
capture values of each year for this cash flow diagram.

8/3/2019 Analisis Ekonomis - Minggu 9
http://slidepdf.com/reader/full/analisis-ekonomis-minggu-9 15/37
Net Present Value of the Costs of Machine BPresent Value of Year 0 Costs:
$15,000
Present Value of Year 1 Costs:
(4000)/(1+0.10)^1= $3636.36
Present Value of Year 2 Costs:
(4000)/(1+0.10)^2= $3305.79
Present Value of Year 3 Costs:
(4000+3500)/(1+0.10)^3= $5634.86
Present Value of Year 4 Costs: (4000)/(1+0.10)^4= $2732.05
Present Value of Year 3 Costs:
(4000)/(1+0.10)^5= $2483.69
Net Present Value of the Costs:
15,000
+3636.36
+3305.79
+5634.86
+2732.05
+2483.69
$ 32,793

8/3/2019 Analisis Ekonomis - Minggu 9
http://slidepdf.com/reader/full/analisis-ekonomis-minggu-9 16/37
Net Present Value Comparison
NPV Costmachine A = $28,823
NPV Costmachine B = $32,793
Costmachine A unadjusted = $29,500 Costmachine B unadjusted = $38,500
8/3/2019 Analisis Ekonomis - Minggu 9
http://slidepdf.com/reader/full/analisis-ekonomis-minggu-9 17/37
Other Economic Issues
Depreciation and Taxes
Profitability
± Rate of return on investment (ROI)
± Payback pe
riod
± Internal rate of return

8/3/2019 Analisis Ekonomis - Minggu 9
http://slidepdf.com/reader/full/analisis-ekonomis-minggu-9 18/37
Depreciation of Capital Assets
Accounting systems assume that capitalequipment (not land) loses value over time
The loss of value of capital equipment is called
depreciation Depreciation is important in the economic
analysis of engineering projects because
depreciation can be used to reduce th
e taxesthat are paid on corporate income

8/3/2019 Analisis Ekonomis - Minggu 9
http://slidepdf.com/reader/full/analisis-ekonomis-minggu-9 19/37
Calculating Depreciation
Step 1: determine the period over which the
capital asset should be depreciated.
Step 2: determine how the depreciating value
should be distributed over the selected period
8/3/2019 Analisis Ekonomis - Minggu 9
http://slidepdf.com/reader/full/analisis-ekonomis-minggu-9 20/37
Payback Period
Furnace A Furnace B
Year Invest
K$
Operating
Costs
K$
Taxes
K$
Net
Cash
Flow
K$
Payback
K$Invest Operating
CostsTaxes Net
Cash
Flow
K$
Payback
K$
0 -325 -400
1 -432 ~168 200 -125 -363 ~199 239 -161
2 75 78

8/3/2019 Analisis Ekonomis - Minggu 9
http://slidepdf.com/reader/full/analisis-ekonomis-minggu-9 21/37
Economic Metrics
to Evaluate Projects
Return on Investment (ROI)
Payback period
Internal Rate of Return

8/3/2019 Analisis Ekonomis - Minggu 9
http://slidepdf.com/reader/full/analisis-ekonomis-minggu-9 22/37
Return on Investment (ROI)
yRatio of some desired economic outcome tothe investment for that outcome
yTypical numerators:
Annual profit before taxes
Annual profit after taxes
Annual cash flow before taxes
Annual cash flow after taxesyTypical denominator: capital investment
8/3/2019 Analisis Ekonomis - Minggu 9
http://slidepdf.com/reader/full/analisis-ekonomis-minggu-9 23/37
Payback Period
yTypical definition: Ratio of the investment tothe annual benefit giving an estimate of thetime to recover the investment
y If benefits are not uniform over time it isthe time at which the cumulative sum of thebenefits equal the investment
yTypically does not take into account t
he time-value of money

8/3/2019 Analisis Ekonomis - Minggu 9
http://slidepdf.com/reader/full/analisis-ekonomis-minggu-9 24/37
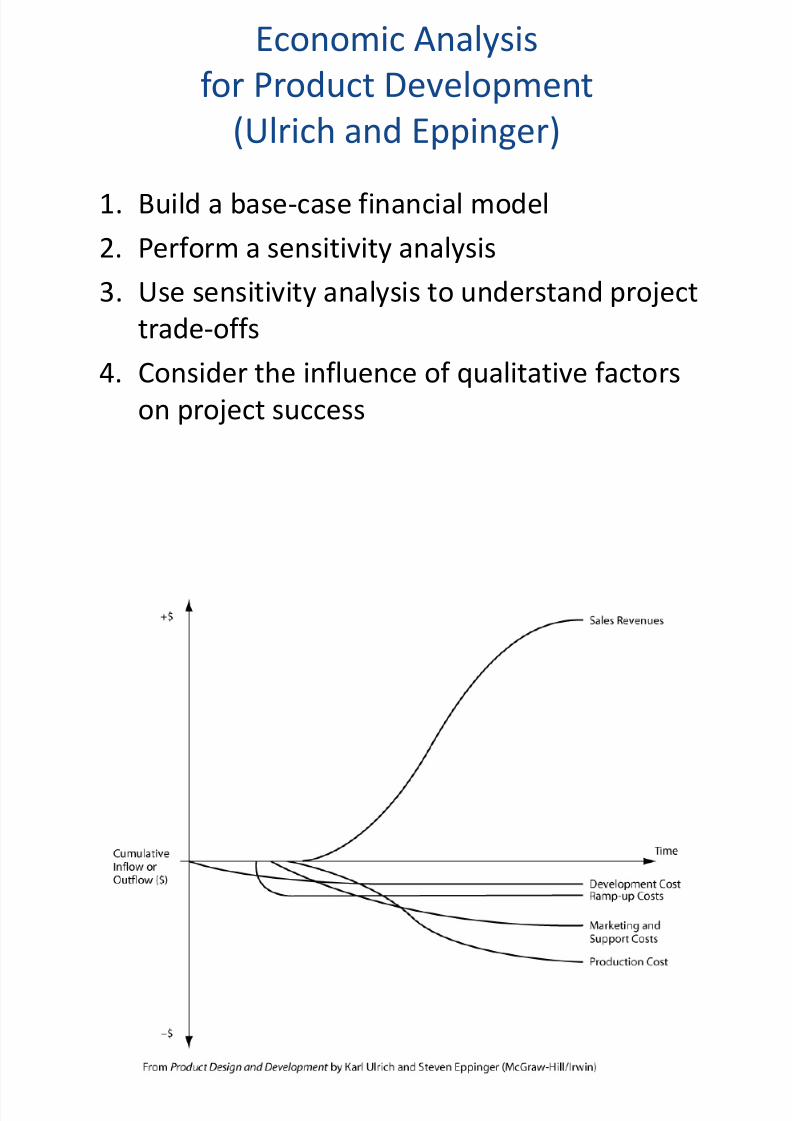
Economic Analysis
for Product Development
(Ulrich and Eppinger)
1. Build a base-case financial model
2. Perform a sensitivity analysis3. Use sensitivity analysis to understand project
trade-offs
4. Consider th
e influence of qualitative factorson project success

8/3/2019 Analisis Ekonomis - Minggu 9
http://slidepdf.com/reader/full/analisis-ekonomis-minggu-9 25/37
8/3/2019 Analisis Ekonomis - Minggu 9
http://slidepdf.com/reader/full/analisis-ekonomis-minggu-9 26/37
Step 1: Build a Base-Case Model
8/3/2019 Analisis Ekonomis - Minggu 9
http://slidepdf.com/reader/full/analisis-ekonomis-minggu-9 27/37
Step 1: Build a Base-Case Model

8/3/2019 Analisis Ekonomis - Minggu 9
http://slidepdf.com/reader/full/analisis-ekonomis-minggu-9 28/37
Annual interest divided
by number of periods
per year
Number of periods
Payments Made Each Period
Future Value
Using Excel for Q4 of Year 1:
Present Value of Year 3 Costs:
(-2250)/(1+0.10/4)^3= -$2089

8/3/2019 Analisis Ekonomis - Minggu 9
http://slidepdf.com/reader/full/analisis-ekonomis-minggu-9 29/37

8/3/2019 Analisis Ekonomis - Minggu 9
http://slidepdf.com/reader/full/analisis-ekonomis-minggu-9 30/37
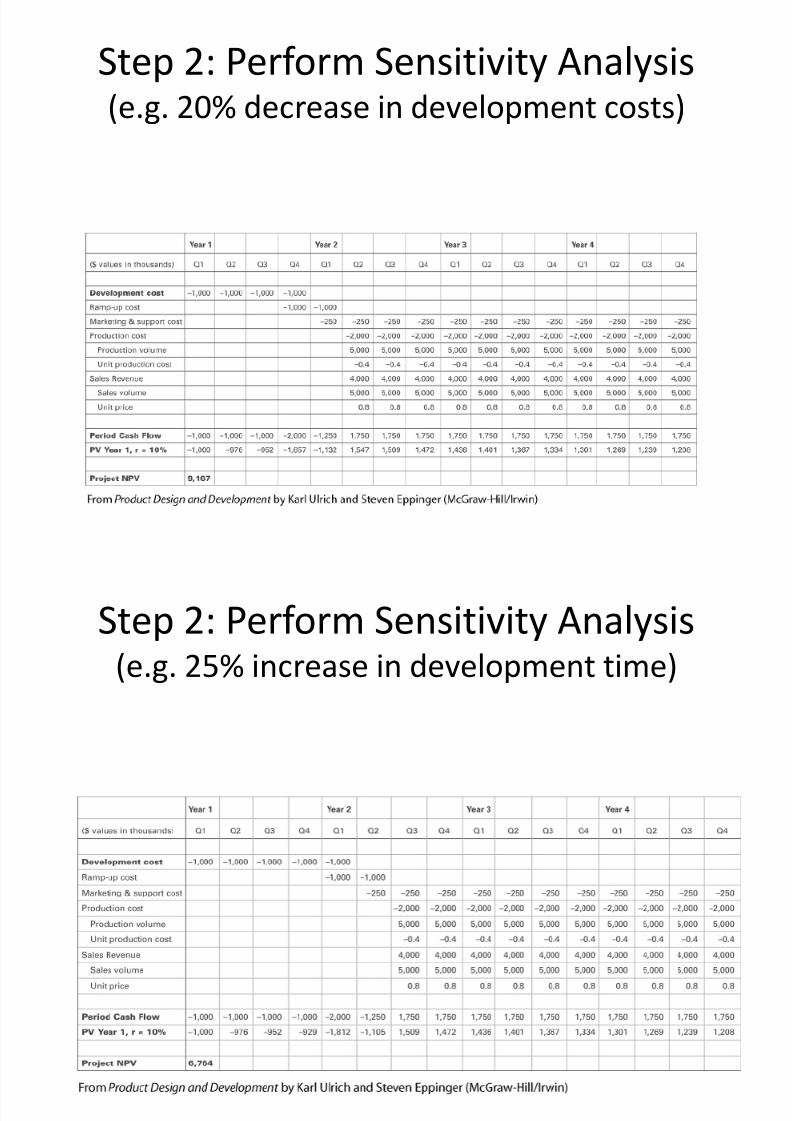
Step 2: Perform Sensitivity Analysis(e.g. 20% decrease in development costs)

8/3/2019 Analisis Ekonomis - Minggu 9
http://slidepdf.com/reader/full/analisis-ekonomis-minggu-9 31/37
Step 2: Perform Sensitivity Analysis(e.g. 25% increase in development time)

8/3/2019 Analisis Ekonomis - Minggu 9
http://slidepdf.com/reader/full/analisis-ekonomis-minggu-9 32/37
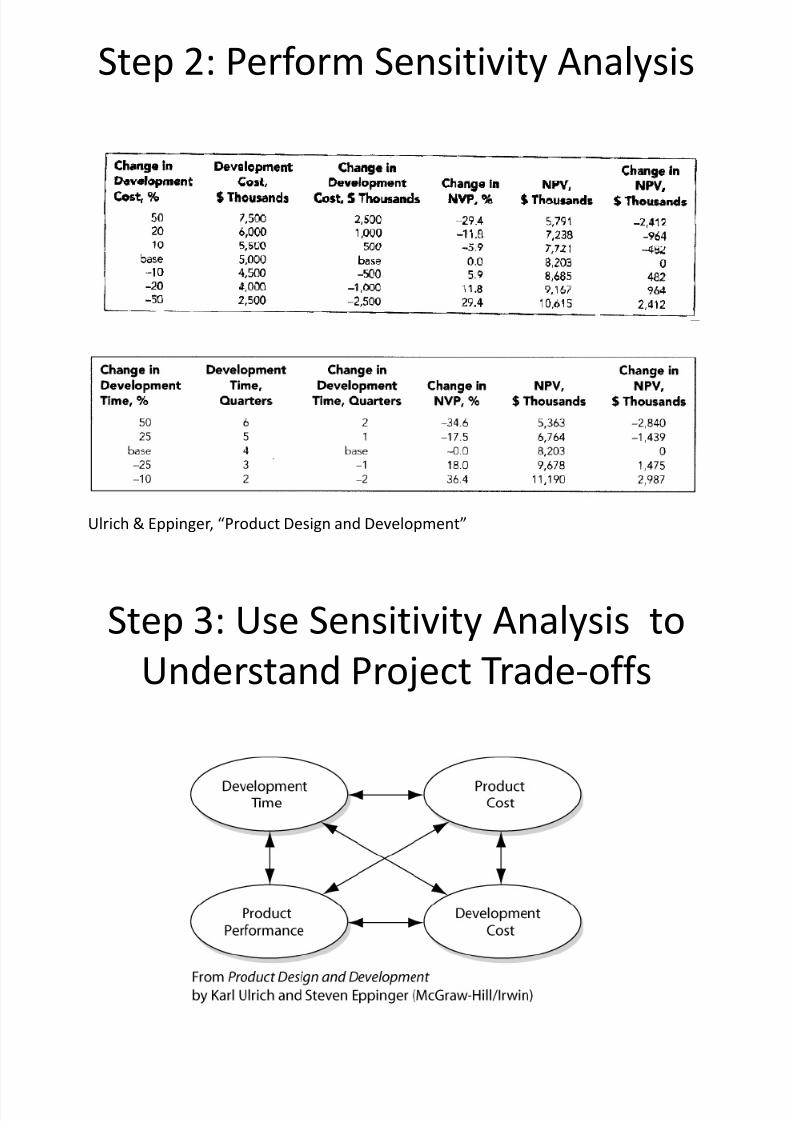
Step 2: Perform Sensitivity Analysis
Ulrich & Eppinger, Product Design and Development

8/3/2019 Analisis Ekonomis - Minggu 9
http://slidepdf.com/reader/full/analisis-ekonomis-minggu-9 33/37
Step 3: Use Sensitivity Analysis to
Understand
Project
Trade-offs

8/3/2019 Analisis Ekonomis - Minggu 9
http://slidepdf.com/reader/full/analisis-ekonomis-minggu-9 34/37
Step 3: Use Sensitivity Analysis to
Understand
Project
Trade-offs(estimate Trade-off Rules f rom sensitivity analyses)
Ulrich & Eppinger, Product Design and Development

8/3/2019 Analisis Ekonomis - Minggu 9
http://slidepdf.com/reader/full/analisis-ekonomis-minggu-9 35/37
A Question:
What are some situations when you might not
pursue an option that presents the best NPV?

8/3/2019 Analisis Ekonomis - Minggu 9
http://slidepdf.com/reader/full/analisis-ekonomis-minggu-9 36/37
Step 4: Consider the Influence of
Qualitative Factors
Ulrich & Eppinger, Product Design and Development
Interactions between the Project and the
Firm (e.g. strategic fit, risk/liability exposure)
Interactions between the Project and theMarket (e.g. competitors, customers,
suppliers)
Interactions between th
e Project and th
eMacro Environment (e.g. economic shifts,
government regulations, social trends)

8/3/2019 Analisis Ekonomis - Minggu 9
http://slidepdf.com/reader/full/analisis-ekonomis-minggu-9 37/37


![Laporan Hasil Praktikum Kimia Analisis [Minggu I].doc](https://img.dokumen.tips/doc/110x75/563dbb54550346aa9aac3959/laporan-hasil-praktikum-kimia-analisis-minggu-idoc.jpg)