Embed Size (px)
Citation preview

1
An Unintended Curse of Gifts: Worker’s
Remittances and International Competitiveness in
Armenia
By Gregory Loshkajian
Department of Economics
Princeton University
Princeton, NJ, USA
Abstract: Quantitative research on the effects of worker’s remittances on
international competitiveness has been performed in a variety of regions and
countries. However, Armenian remittances, which currently constitute
approximately a quarter of the country’s GDP, have been left unstudied.
This research seeks to fill this informational gap. Consistent with the
economic literature, we use a VAR (Vector Autoregressive) model,
combined with instrumentation for higher education rates, to analyze the
effects of remittances on Armenian international competitiveness. We find
that remittances cause an appreciation in Armenian real exchange rate,
which lowers Armenian international competitiveness, and we show that this
appreciation has a direct link with changes in the prices of non-tradable
goods.
Keywords: Armenia, VAR, workers remittances

2
I. Introduction
In the past decade, the global movement of migrant workers and remittance flows
from these workers has increased significantly. Currently, about 3% of the global
population is living outside their country of origin (World Bank 2014), which has
attracted the interest of researchers, observers, and policy makers to study the
implications of this phenomenon, mainly through the effects of remittances. In 2014,
estimated global remittances reached approximately $582 billion, $410 billion of which
went to developing countries. In fact, remittance is a major source of foreign exchange
earnings for many developing countries.
A large portion of remittances (approximately 50-200 percent of officially
recorded remittances) is believed to be unrecorded, mainly because remittances are often
sent through unofficial channels (Aggarwal et al. 2006). These remittances tend to come
from developed countries with a large number of job opportunities, such as the United
States and Saudi Arabia, with US $75 billion originating from these two countries in
2009. Perhaps because of this, worker’s remittances have begun to surpass private capital
inflows and foreign aid in recent years, particularly in countries like Armenia.
In 2014, the stock of migrant workers from Armenia was approximately .777
million people in 2014 (World Bank 2014). According to the United Nations Population
Division, in 2012, migrant Armenian workers were mainly employed by neighboring CIS
states, with European Member States acting as residual destinations, which we can see in
table 1. In particular, Russia is a particularly popular location and remittance source: at
827 million in US dollars in remittances, Russia provided approximate 57.1% of
Armenian 2012 remittance outflows. Migrants fit into a wide range of labor classes: in

3
2010, 20.5% of Armenian migrant workers were less skilled, 43.7% were semi-skilled,
and 35.8% were skilled. Also, approximately 39 percent of Armenian migrants are
employed in professional positions. The split between male and female migrant workers
is approximately 3 male workers for every one female worker (World Bank 2014).
Due to the diaspora created by the Armenian genocide, Armenia’s migrant stock
has experienced decent growth over the past century. However, the years following
independence from the Soviet Union have seen an even greater increase in Armenian
Table 1. Country-wise migrant stocks and workers remittances (selected countries for 2013)
Country of Employment Migrant Stock 2013 Remittance income 2013
(US$ million)
Australia 1,253 2
Austria 2 727 1
Azerbaijan 3 729 62
Belgium 3 243 2
Canada 2,675 5
Cyprus 1 383 2
Czech Republic 2 234 2
Denmark 666 1
France 18 766 27
Georgia 2,227 24
Germany 10 667 30
Greece 7,779 15
Iran, Islamic Rep. 2 469 2
Ireland 139 0
Italy 1,008 1
Kazakhstan 8 416 11
Latvia 821 5
Lithuania 522 1
Netherlands 782 4
Norway 272 0
Poland 2 256 3
Russian Federation 510 640 827
Slovak Republic 104 0
Spain 10,642 23
Sweden 2,149 2
Switzerland 731 1
Turkey 1 178 1
Turkmenistan 2 609 11
Ukraine 49,862 75
United States 92,671 158
Total 777 313 1,449
Source: World Bank Remittance and United Nations Population Division databases

4
migrant stock, fueled by new labor market opportunities in neighboring countries such as
Russia, as well as anger with the lack of employment opportunities in the Armenian
economy (International Monetary Fund 2012). Due to this trend, Armenian emigration
has reached a peak of approximately 19100 people in 2004. However, it is important to
note that, while Armenian migration stock has grown, emigration has experienced a
downward trend in the past 15 years, only experiencing a particularly large jump from
2003 to 2004, with a smooth downward trend afterwards, which we can see in Figure 1.
Interestingly, while Armenian remittances have always been small in number,
ranking 45th
in the world and constituting only .5% of global remittances in 2012, the real
importance of Armenian remittance can be found in its importance to the country’s GDP.
Since the late 1980’s, remittances have played an integral role in Armenian economic
development, to the point where Armenian worker’s remittances reached a peak of 21.0%
of the country’s GDP in 2013. Globally, Armenia is the 9th
largest recipient of
remittances as a percentage of GDP in 2012 (World Bank Prospects 2014). These facts
show that Armenia has a strong economic dependence on remittance inflows.
Figure 1. Migration Data, Armenia 2000-2012 Source: This data was constructed by the author using CIA
World Factbook (2012) data
-25000
-20000
-15000
-10000
-5000
02000 2001 2002 2003 2004 2005 2006 2007 2008 2009 2010 2011 2012
Nu
mb
er
of
Mig
ran
ts
Year

5
Given the large increase of remittance inflows into developing countries such as
Armenia, economic impact of remittances on receiving countries has become a very
important topic for study. In spite of the numerous economic and developmental effects
remittances can provide, some concerns have been raised due to the importance Armenia
places on remittances. Remittances, as a type of net capital inflow, can lower the
international trade competitiveness of a country by causing a Dutch-disease- like
reallocation of resources to the nontradable sector. Such an effect would prove to be
extremely problematic for any country which relies on remittances as heavily as Armenia
does. However, despite the Armenian economy’s massive dependence on remittances,
there have been no quantitative studies examining the effect of worker’s remittances on
international competitiveness at the country specific level for Armenia.
Therefore, survey data from Armenian migrant workers and real exchange rate
data from 1993 was used on a variation of VAR model utilized by Mamta B. Chowdhury
and Fazle Rabbi, as well as an instrumentation of remittances with education, to analyze
whether the established negative effect of workers remittances on international
competitiveness holds when tested within the Armenian economy. Results show that
Armenian real exchange rate increases by 17% when remittances double, which suggests
that there is a small, significant and positive correlation between workers remittances and
exchange rate. Focusing on the relationship between terms of trade and real exchange rate
shows that this shift is driven by a positive relationship between remittances and non-
tradable prices.
The remainder of this paper will proceed as follows. Section II explores the
literature surrounding the effects of remittance inflows and the determinants of real

6
exchange rates. Section III discusses the issues related to data gathering and the
construction of variables employed to study the long run effect of remittances on the real
effective exchange rate of Armenia. Section IV presents the empirical model, as well as
the methodology used in this study. Section V shows the econometric results and Section
VI draws conclusions and makes suggestions as to further avenues for research on the
topic and country. Section VII presents references and an appendix with further data.
II. Literature Review
When examining the effects of remittances on an economy, the economist is faced
with a myriad of positive and negative contributions. One of these, shown by Adams
(2005), Ratha et al. (2005) and Aggarwal et al. (2006), is that remittances, as well as
other monetary inflows, can enhance the long run growth potential of developing
countries by reducing poverty and increasing financial development by reducing
constraints on investment. A steady flow in remittance can reduce the volatility in output,
which has positive effects on growth (Kroft and Lloyd-Ellis 2002). However, existing
literature has also shown that remittances could have certain potential negative effects on
the recipient country’s economy. One such effect, shown by Chami et al. in 2003, is that
remittances can introduce a moral hazard problem, i.e. they allow the migrant’s family to
reduce their work effort, which reduces growth. Secondly, and most importantly to our
analysis, there may be a detrimental effect of remittances on external trade
competitiveness, in that the transfer of aid could impact a country’s economic structure
by inducing a “Dutch disease” like effect.
The Dutch Disease, hypothesized by W. Max Corden and J. Peter Neary in 1982,
is, essentially, the idea that there are possible negative consequences in the labor and

7
tradable good markets caused by large increases in a country’s income. To explain the
disease, Corden and Neary use the framework of a small open economy producing two
goods at exogenously given world prices, and a third nontraded good, whose price moves
according to domestic supply and demand. The traded goods are themselves separated
into a booming good and a non booming good. The booming good tends to be the
extraction of natural resources, such as oil or gold, whereas the lagging sector would be
manufacturing. Since one good (the natural resource) is booming, the sector experiences
extra revenue and more demand for labor. However, since natural resource industries
tend to employ fewer people, this shift in labor is negligible. The clearer effect comes
from indirect de-industrialization, where the increase in revenue from the booming
tradable sector causes demand for goods and labor to shift to the non-tradable sector at
the expense of the lagging tradable sector. Naturally, this shift in demand will cause the
price of non-tradable goods to rise, but since prices in the traded goods sector are
internationally determined, they cannot change to match the non-tradable goods sector.
This amounts to an increase in the real exchange rate, since this trend will also lead to a
higher demand for local currency.
While the Dutch disease theory is based upon the idea of resource booms, the
concept translates quite well to capital inflows. In such a case, the “Dutch disease” theory
suggests that cash inflows from sources such as foreign aid, foreign direct investment,
and workers’ remittances may cause the economy to reallocate resources towards the
nontradable sector rather than the tradable sector, reducing the relative price of tradables
(Chowdhury 2004). With weaker tradables, the country’s currency becomes less valuable
in comparison with that of the rest of the world, and the real exchange rate decreases in

8
value. The potential reallocation effect of remittances was first postulated by Michaely
(1981), and was later confirmed by Neary (1988), who also suggested that remittances
inflows might cause real exchange rates to appreciate.
Recent research on the relationship between remittance and international
competitiveness has focused on identifying the mechanics behind Michaely’s and
Neary’s suggestions, and applying this idea to various countries around the world. Most
studies identify determinants of exchange rate to use as controls and/or examine the
previously established relationship between remittance and international competitiveness
at country and region specific levels. In a panel study of 13 Latin American countries,
Dorantes and Pozo (2004) use government spending, terms of trade, real interest, and
foreign aid as determinants of international competitiveness, finding that doubling
remittances lead to a 22% increase in RER. On the other hand, Bourdet and Falck (2006)
utilize a time series model with controls for government policy, government spending,
and technological progress to argue that, in Cape Verde, remittance increases also lead to
a significant increase in exchange rate, but with an expectation of long run deprecation.
Chowdhury and Rabbi (2013) examine the proposed relationship in Bangladesh
with a slightly different time series model, which also happens to expand its
methodological scope from Dorantes’ and Bourdet’s work. Most importantly for our
purposes, they do so with a set of proxies based on trade and domestic policies, which
eliminates many ambiguities caused by changes within the international and domestic
markets. By using this model, Chowdhury and Rabbi found that increases in remittance
did lead to significant decreases in Bangladesh’s international competitiveness. While the
literature seems to have obtained a clearer picture of the remittances-real effective

9
exchange rate relationship through Chowdhury’s model, an application of this effect to a
CIS state is still non-existent. By applying Chowdhury and Rabbi’s model to Armenia my
paper fills this informational void.
III. Data
Before continuing, it would be prudent to mention certain issues relating to data
availability. Due to Armenia’s status as a post-Soviet country, there is very little data
circa 1993, and data post 1993 is very limited. However, most of the necessary data is
thankfully encompassed within development indicators. Therefore, unless otherwise
noted within this section, the analysis will rely on data from the World Development
Indicator database within the World Bank and is annual. The database contains detailed
information about labor composition and trade activity. In order to account for the
Armenian dram’s adjustment to the world market, the analysis is restricted to the time
period encompassing 1995-2013
Table 2 presents descriptive statistics over the sample time frame. Following is a
summary of the relevant variables based on the model devised by Chowdhury et al.
Table 2: Descriptive Statistics for Sample Period: 1995-2013
Variable Obs Mean Std. Dev. Min Max
Real Ex. Rate 19 82.08845 15.05439 52.3621 106.0325
Remittance 19 0.245824 0.1357958 0.092113 0.4374128
Trade Product. 19 10477.24 9983.286 1344.142 32727.51
Money Supply 19 0.182734 0.0858634 0.0770715 0.3616688
Openness 19 0.7106526 0.072725 0.53659 0.86227
Terms of Trade 19 0.4916938 0.1082401 0.347892 0.666421
Tert. Educ.
Rate
19 .3767308 .1012688 . 168175 .510014
Source: Constructed using World Bank (2014), United Nations (2014), OSCE (2011), International
Monetary Fund (2014), and UIS Data Centre (2014) data.

10
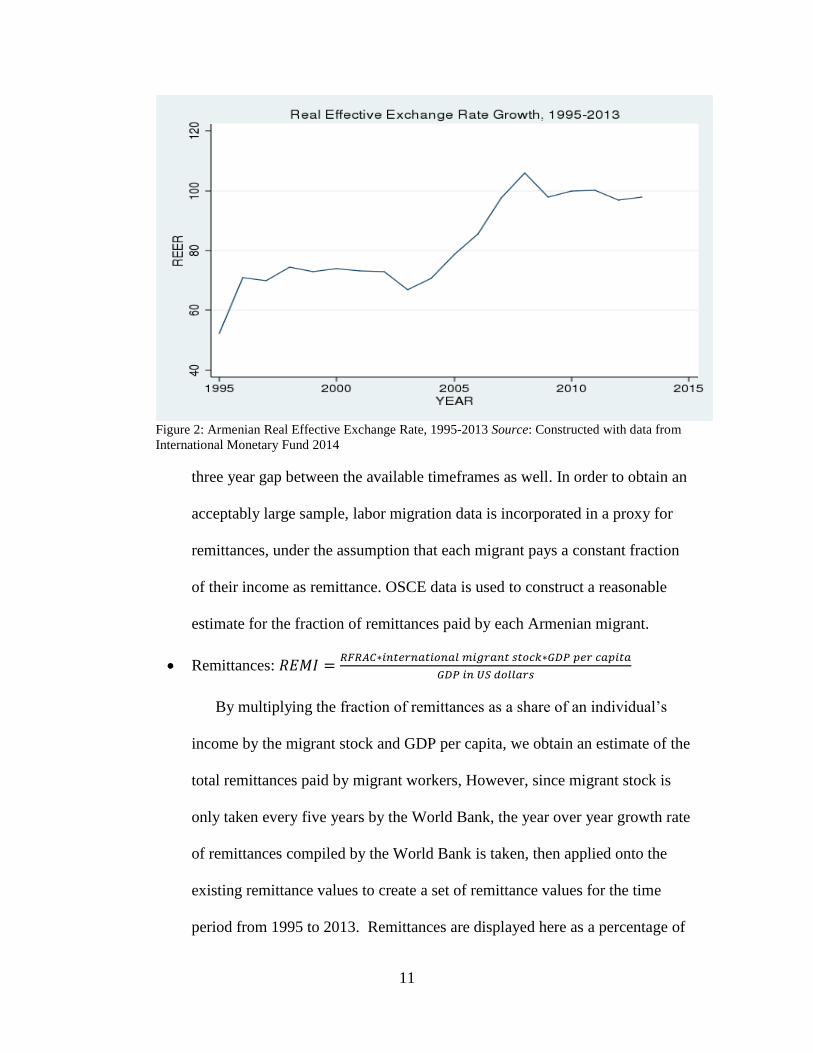
Exchange Rate: REER= Real Effective Exchange Rate (2010=100)
For exchange rate data, annual real effective exchange rate data from the
International Financial Statistics database provided by the International
Monetary fund is used. It is assumed that the consumer price index from
2010 is the base value. Here, real effective exchange rate serves as the main
indicator for international competitiveness. Figure 2 plots REER over the
sample period. REER exhibits a clear positive trend, with a sharp increase
between 2004 and 2008.
Remittance Fraction: 𝑅𝐹𝑅𝐴𝐶 =𝑣𝑎𝑙𝑢𝑒 𝑜𝑓 𝑟𝑒𝑚𝑖𝑡𝑡𝑎𝑛𝑐𝑒 𝑠𝑒𝑛𝑡 𝑡𝑜 𝐴𝑟𝑚𝑒𝑛𝑖𝑎 𝑜𝑛 𝑡𝑟𝑖𝑝
𝑖𝑛𝑐𝑜𝑚𝑒 𝑜𝑛 𝑠𝑎𝑚𝑒 𝑡𝑟𝑖𝑝
While Armenian remittance data does exist within the World Bank’s
database, it is not utilized here. The main reason for this is that the World
Bank only displays reported remittances, which, as previously noted, are a
small part of actual remittances. Instead, data has been taken from three
surveys given from 2002-2005, 2005-2007 and from 2011 to 2012 by the
Organization for Security and Cooperation in Europe to individual Armenian
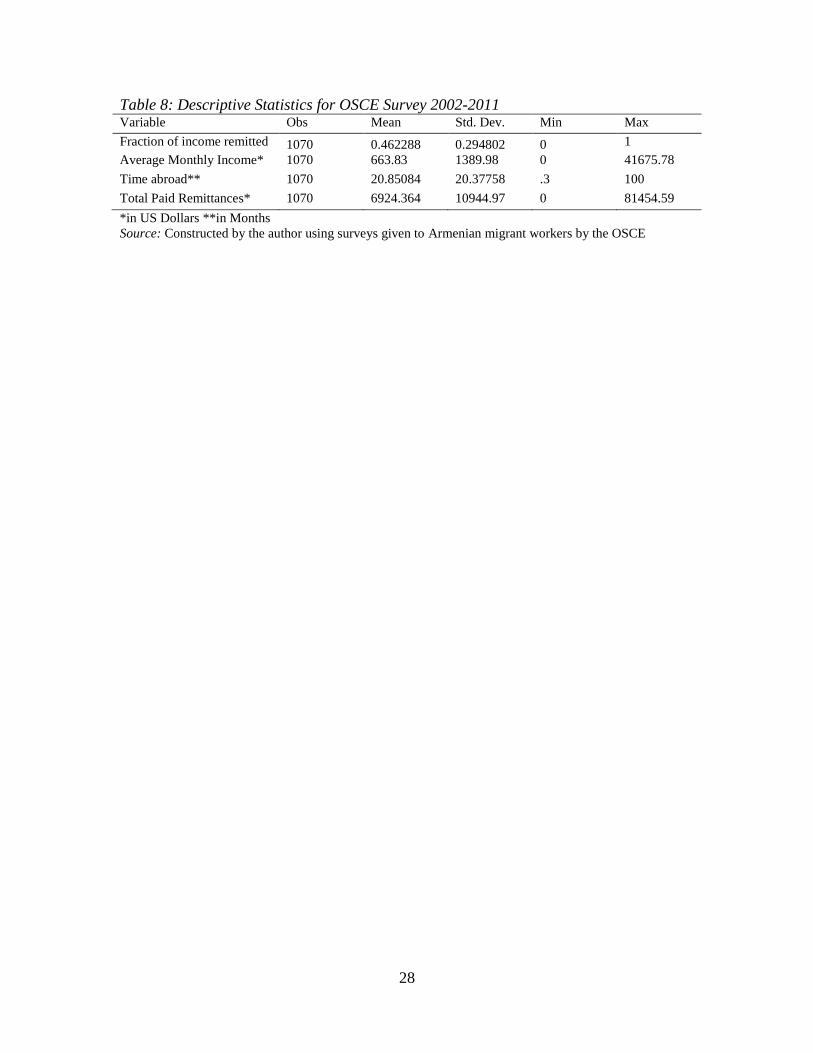
migrants on specific labor migration issues. Table 8, found within the
appendix, presents relevant descriptive statistics for surveyed workers.
Examination of these statistics reveals decent spread in socioeconomic
circumstances and time away from Armenia among sampled workers, which
lends strength to my intended proxy.
For the purposes of this paper, values of interest include the amount of
money sent home during a trip and average monthly income in US dollars.
However, this sample has a relatively small 8 year timeframe, and there is a
11
Figure 2: Armenian Real Effective Exchange Rate, 1995-2013 Source: Constructed with data from
International Monetary Fund 2014
three year gap between the available timeframes as well. In order to obtain an
acceptably large sample, labor migration data is incorporated in a proxy for
remittances, under the assumption that each migrant pays a constant fraction
of their income as remittance. OSCE data is used to construct a reasonable
estimate for the fraction of remittances paid by each Armenian migrant.
Remittances: 𝑅𝐸𝑀𝐼 =𝑅𝐹𝑅𝐴𝐶∗𝑖𝑛𝑡𝑒𝑟𝑛𝑎𝑡𝑖𝑜𝑛𝑎𝑙 𝑚𝑖𝑔𝑟𝑎𝑛𝑡 𝑠𝑡𝑜𝑐𝑘∗𝐺𝐷𝑃 𝑝𝑒𝑟 𝑐𝑎𝑝𝑖𝑡𝑎
𝐺𝐷𝑃 𝑖𝑛 𝑈𝑆 𝑑𝑜𝑙𝑙𝑎𝑟𝑠
By multiplying the fraction of remittances as a share of an individual’s
income by the migrant stock and GDP per capita, we obtain an estimate of the
total remittances paid by migrant workers, However, since migrant stock is
only taken every five years by the World Bank, the year over year growth rate
of remittances compiled by the World Bank is taken, then applied onto the
existing remittance values to create a set of remittance values for the time
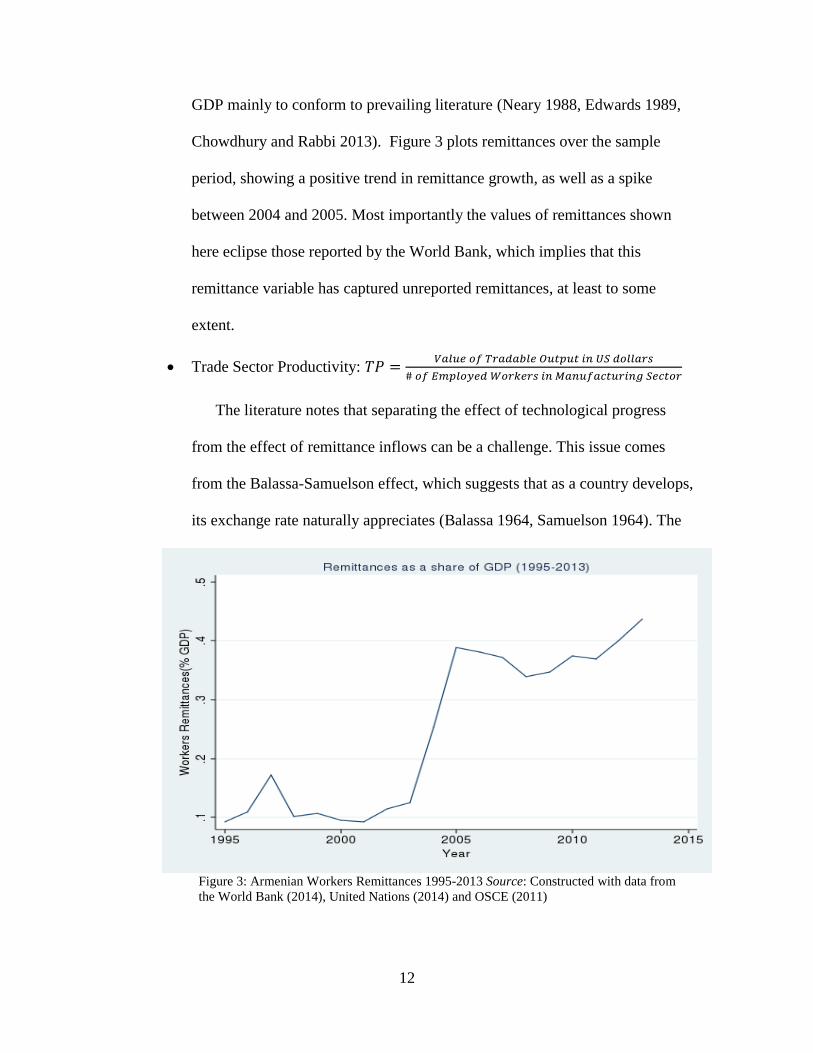
period from 1995 to 2013. Remittances are displayed here as a percentage of
12
GDP mainly to conform to prevailing literature (Neary 1988, Edwards 1989,
Chowdhury and Rabbi 2013). Figure 3 plots remittances over the sample
period, showing a positive trend in remittance growth, as well as a spike
between 2004 and 2005. Most importantly the values of remittances shown
here eclipse those reported by the World Bank, which implies that this
remittance variable has captured unreported remittances, at least to some
extent.
Trade Sector Productivity: 𝑇𝑃 =𝑉𝑎𝑙𝑢𝑒 𝑜𝑓 𝑇𝑟𝑎𝑑𝑎𝑏𝑙𝑒 𝑂𝑢𝑡𝑝𝑢𝑡 𝑖𝑛 𝑈𝑆 𝑑𝑜𝑙𝑙𝑎𝑟𝑠
# 𝑜𝑓 𝐸𝑚𝑝𝑙𝑜𝑦𝑒𝑑 𝑊𝑜𝑟𝑘𝑒𝑟𝑠 𝑖𝑛 𝑀𝑎𝑛𝑢𝑓𝑎𝑐𝑡𝑢𝑟𝑖𝑛𝑔 𝑆𝑒𝑐𝑡𝑜𝑟
The literature notes that separating the effect of technological progress
from the effect of remittance inflows can be a challenge. This issue comes
from the Balassa-Samuelson effect, which suggests that as a country develops,
its exchange rate naturally appreciates (Balassa 1964, Samuelson 1964). The
Figure 3: Armenian Workers Remittances 1995-2013 Source: Constructed with data from
the World Bank (2014), United Nations (2014) and OSCE (2011)

13
Balassa-Samuelson effect is important enough that some economists, such as
Bourdet et al, create particular controls for technology within their own
regressions to avoid this problem. In this analysis, the most commonly
accepted measure of technological progress; trade sector productivity, will be
utilized as defined by the above formula. Tradable output (assumed here to be
manufacturing output) and employment was taken from the United Nations
Industrial Development Organization, since the World Bank did not have this
data.
Terms of Trade: 𝑇𝑂𝑇 =𝑃𝑟𝑖𝑐𝑒 𝑜𝑓 𝑒𝑥𝑝𝑜𝑟𝑡𝑠 𝑖𝑛 𝑈𝑆 𝑑𝑜𝑙𝑙𝑎𝑟𝑠
𝑃𝑟𝑖𝑐𝑒 𝑜𝑓 𝑖𝑚𝑝𝑜𝑟𝑡𝑠 𝑖𝑛 𝑈𝑆 𝑑𝑜𝑙𝑙𝑎𝑟𝑠
Terms of trade serves as a control for the price of the tradable sector, in
that it provides a measure of the value of exports. Depending on the prices of
exports and imports (both of which are indexed at 2000=100), terms of trade
can lead to an income or substitution effect appreciation or depreciation of the
REER, which makes it a helpful control variable. However, by definition,
terms of trade is very similar to real effective exchange rate, lacking only the
price index for non-tradable items. This could lead to a high correlation
between the two variables.
Openness ratio: 𝑂 =𝐸𝑥𝑝𝑜𝑟𝑡𝑠 𝑖𝑛 𝑈𝑆 𝑑𝑜𝑙𝑙𝑎𝑟𝑠+𝐼𝑚𝑝𝑜𝑟𝑡𝑠 𝑖𝑛 𝑈𝑆 𝑑𝑜𝑙𝑙𝑎𝑟𝑠
𝐺𝑁𝑃 𝑖𝑛 𝑈𝑆 𝑑𝑜𝑙𝑙𝑎𝑟𝑠
The ratio of openness is another proxy for trade policy used often in the
literature (Edwards et al 1999), in particular, it measures how easily goods
and money flow from one country to another. Given that the main explanatory
variable involves the international flow of money from one country to another,
openness is an especially useful control.

14
Money Supply: 𝑀𝑆 =𝑀2 𝑖𝑛 𝑐𝑢𝑟𝑟𝑒𝑛𝑡 𝐺𝐷𝑃
𝐺𝐷𝑃 𝑖𝑛 𝑐𝑢𝑟𝑟𝑒𝑛𝑡 𝐿𝐶𝑈
Money supply, the ratio of M2 to GDP, has a positive effect on real
effective exchange rate. With a higher money supply, consumers can purchase
more goods within the tradable and nontradable sectors, leading to the
previously mentioned reallocation effect. M2, in this case, is obtained from
the International Financial Statistics database of the International Monetary
Fund. Unlike the other variables, money supply will be listed in LCU values
of GDP and M2, because these values are not given in US dollars by the
International Monetary Fund.
Tertiary Enrollment Rate: 𝑇𝐸𝑅 =𝑇𝑜𝑡𝑎𝑙 𝑡𝑒𝑟𝑡𝑖𝑎𝑟𝑦 𝑒𝑛𝑟𝑜𝑙𝑙𝑚𝑒𝑛𝑡
𝐴𝑙𝑙 𝑠𝑡𝑢𝑑𝑒𝑛𝑡𝑠 𝑤𝑖𝑡ℎ𝑖𝑛 𝑡𝑒𝑟𝑡𝑖𝑎𝑟𝑦 𝑎𝑔𝑒 𝑔𝑟𝑜𝑢𝑝 ∗ 100
This variable represents enrollment ratio for tertiary school education,
which is calculated by dividing the number of students enrolled in tertiary
level education (regardless of age) by the population of the age group which
corresponds to tertiary education. It is assumed that people enrolled in tertiary
education will have completed secondary school education, as secondary
completion is a usual requirement for admission into college. This variable
will serve as a way to describe education, for the purposes of instrumentation
on remittance, since many of Armenia’s problems in education center around
secondary school completion rate and college enrollment. This data was
constructed using information from the World Bank databases.
IV. Methodology
When looking at Figures 1 and 2, it is clear that Armenian workers’ remittances
and real effective exchange rate have both experienced a positive increasing trend from

15
1995 to 2013. With this information, in mind it seems reasonable to assume that there
some positive correlation between the two. In order to prove this, a VAR model based on
Chowdhury and Rabbi’s model, mentioned in Section II is utilized.
As mentioned previously, the effect of workers remittances on the real exchange
rate of Armenia has previously been specified by Chowdhury and Rabbi. This analysis
will build off of this model. The Chowdhury-Rabbi model is written as follows:
REERt = α + β1lREMIt+ βi Xt + εt (1)
where t is the sample time period, and REMI is the key explanatory variable referring to
the ratio of remittances to GDP. Xi corresponds to a vector which encompasses several
control variables: government expenditure (GOV), terms of trade (TOT), technological
progress (TP), openness to trade (O) nominal money supply (MS), and nominal
devaluation (NDV). All reported standard errors in this paper are robust to
heteroskedasticity. By separating the Xi vector into its separate components, and
transforming each series by taking its natural log, we obtain the full empirical model for
real exchange rate, as described by Chowdhury and Rabbi:
ln(REERt) = α + β1ln(REMIt)+ β2ln(TPt) + β3 ln(GOVt) + β4ln(TOTt) + β5ln(Ot)
+ β6 ln(MSt) + β7ln(NDt) + εt (2)
In effect, the Chowdhury-Rabbi model, estimates a vector autoregression (VAR)
model from 1995-2013 of the key relationship between remittances and the exchange
rate, while including standard control variables. However, there are five main differences
between this my model, and my analysis. First, I do not include Chowdury’s time dummy
variable because it was Bangladesh specific, which makes the variable useless for the
purposes of this paper. Instead, a dummy variable for the year 2004, γ, is introduced. This

16
year saw a number of socio-economic and political changes in the Armenian economy,
including the beginning of a large spike in remittances and emigration, the establishment
of credit registries and a private credit bureau, and mass protest against the newly elected
president. Robert Kocharyan. Table 3 shows the results of a Chow test for structural
break at 2004, revealing a clear break in the model at this point. γ takes the value of 0
between 1995 and 2003, and 1 from 2004 onwards.
Second, real effective exchange rate is defined in terms of the real effective
exchange rates, in lieu of Chowdhury’s constructed formula. This decision is motivated
by my access to the necessary information from the IMF and the fact Armenia’s
exchange rates are all based upon cross rates with the United States dollar as the base
currency. Third, other than within the following tests, none of these variables will be
lagged, in order to maintain a decently sized sample period of study, and based on the
recommendation of AIC and BIC criteria on the full regression. Fourth, the model takes a
single openness value instead of separating openness by capital markets and good
markets since the Armenian capital market is not nearly as established as Bangladesh’s is,
so its effect on RER is very minimal. Finally, GOV and ND are recognized as weak
controls for remittances, (even by Chowdhury et al.) so these variables will be ignored to
preserve efficiency in the analysis.
Regression analysis produces efficient estimates if the variables are stationary.
Therefore, as a prerequisite of the analysis, the presence of persistent trends in data is
tested using Augmented Dickey Fuller (ADF) tests. Results of the tests with a constant
and constant and trend are reported in Table 4. It is found that all variables used in this
study are non-stationary. However, some time-series, such as real exchange rate,

17
Table 3: Chow Break-Point Test: 2004 F-statistic: 7.74 Prob. F of Regression (5,11): 92.54
Prob. > F-statistic: .0047 Prob. Chi-Square(7): 0.000
Adjusted- R2: .92016
Note: Null Hypothesis: No breaks at specified breakpoints. Varying regressors: Equation Sample: 1995–
2013. Performed with 2 lags best on AIC testing
remittances, trade productivity, and money supply, are linearly stationary, and the others
are stationary of their first differences. Linearly stationary variables have been detrended,
and difference-stationary have been first-differenced to create stationary series for
efficient comparison. Note, however, that by differencing some of these series, there is
now one less data point to work with, and would be examining annual growth rates in
these particular cases.
Because there are 18 years to work with, which constitutes a very small number
of observations, not all of the control variables identified in equation 2 are used in any
one given regression. The regression in equation 2 will therefore be split into multiple
regressions for examination. As shown in table 4, a close glance at the correlations
between the explanatory variable and control variables reveals that the natural logs of MS
and TP are highly correlated with the natural log of remittances, and very decently
correlated with the other controls. Further testing, using variance inflation factor tests
(assuming a maximum acceptable VIF value of 10), reveals that while MS and TP are
highly collinear with each other, the two variables are not nearly as problematic when
placed in separate regressions. Therefore, to avoid multicollinearity with the major
independent variable, these two variables will be placed within separate regressions.
TOT, by definition, is very similar to real effective exchange rate, and will be left out of
this particular regression. Therefore, the new model, as a set of equations, is specified

18
Table 4: Augmented Dickey Fuller Unit Root Tests: F-statistics
Variables ADF without trend ADF with trend
(transformation)
Real Exchange Rate -2.420 -2.843** (TS)
Remittance -0.928 -1.821* (TS)
Trade Product. -0.059 -1.844* (TS)
Money Supply -0.374 -3.284** (TS)
Openness -2.500 -4.147** (DS)
Terms of Trade -1.453 -3.309* (DS)
Tertiary Educ. Rate -2.120 -4.314** (DS)
Note: All variables are natural logs. Null Hypothesis: Unit root exists *, ** and *** indicate No Unit Root
at 10%, 5% and 1%, respectively. Performed with 2 lags based on AIC tests of all series.
below. Note that none of the variables are lagged, based on the results of joint AIC and
BIC testing:
ln(REERt) = α+ β1ln(REMIt)+ β2ln(TPt)+ β3∆ln(Ot)+ γ + εt (3)
ln(REERt) = α+ β1ln(REMIt)+ β2ln(MSt)+ β3∆ln(Ot) + γ+ εt (4)
On another note, while TOT was previously excluded from the equation, it still
has a purpose within the overall analysis. Adding TOT as a regressor removes the effects
of the movement of goods prices from the real exchange tradable rate, leaving only the
change in non-tradable prices. Therefore, by using the two previous regressors, the rise in
nontradable prices, which is assumed to drive REER upward in the first place, can also be
examined. Thus I will also test the following regressions:
ln(REERt) = α+ β1ln(REMIt)+ β2ln(TPt)+ β3∆ln(TOTt)+ β4∆ln(Ot)+ γ+εt (5)
ln(REERt) = α+ β1ln(REMIt)+ β2ln(MSt)+ β3∆ln(TOTt)+ β4∆ln(Ot)+ γ+εt (6)
While this model is sound and is based on the discussion within the literature, the
literature also mentions a problematic endogeneity between remittances and real
exchange rate. In other word, the level of remittances experienced at any one point in
time is not exogenous. Rather, remittances may be responding to macroeconomic
conditions in the remitter’s country of origin. (Dorantes and Pozo 2004, Aggarwal et al
2005). With this in mind, we will also test instrumental variable regressions.

19
Table 5: Independent Variable Correlation Matrix LNREMI LNTP LNOPEN LNTOT LNMS
LNREMI 1.0000
LNTP .9252* 1.0000
LNOPEN -.4970 -.5779 1.0000
LNTOT .1890 .2120 .3003 1.0000
LNMS* .8103* .9524 -.6127 .2806 1.0000
*Assuming multicollinearity when |r| > .7, there is multicollinearity around the major independent variable,
LNREMI refers to the natural log of REMI (remittances as a share of GDP) The other variables in this
matrix follow the same convention.
Current discussion in the literature regarding instrumentation of the effect of remittance
on real exchange tends to focus on the relationship between education attainment and
remittance level. According to this theory, in countries with lower education rates,
migrant workers will be more likely to send remittances back to their homes, in order to
finance education for members of their households. Currently, observed data seems to
confirm this suggestion (Cox and Ureta 2003). Furthermore, there is no proven
relationship between real exchange rate and education.
The Cox-Ureta theory on the possible instrument effects of education on
remittance seems to be enough motivation to use an education indicator which captures
the education status for children in Armenia, such as primary schooling enrollment rates.
In fact, instruments such as this are popular in the remittance, exchange rate and
migration literature (Cox and Ureta 2003, Dorantes and Pozo 2004). However, Armenian
primary education rates are very high, approaching 99% (World Bank 2014), so
instrumenting with children’s education would not encompass education-based
remittance spending. Therefore, tertiary enrollment rates will be used as an instrument
for remittances.
Tertiary school enrollment rate is a useful variable to instrument for Armenian
education because Armenian citizens face two problems with access to tertiary education:

20
a low secondary school completion rate due to high dropout rate, as well as a high price
to university education. At the same time, education is highly valued in Armenian
culture, so it stands to reason that workers would remit for the same purposes which Cox
and Ureta propose. (World Bank 2014). The first stage regression for this instrumentation
is estimated as follows:
ln(REMIt) = α + β1ln∆(TERt)+ βi ln(Xt)+ γ + εt (7)
where TER represents tertiary enrollment rate. All other variables are as stated above.
The instrumental regression will also experience similar treatment as previously shown in
equations 3-6, where the controls are arranged in such a way as to preserve efficiency and
avoid multicollinearity.
V. Results
A. VAR Estimation
Table 6, shown below, presents the results of alternative versions of equation 2 of
the time series regression, shown by equations 3-6. Column 1 shows results for the
simple regression of real exchange rate on worker’s remittances. Columns 2 through 5
correspond to equations 3-6 shown within the econometric framework, where equations 2
and 3 represent the estimated effect of remittances on real exchange rate, and equations 4
and 5 represent the effect of remittances on nontradable prices.
Results of this regression mostly imply positive correlation between real effective
exchange rate and workers remittances. Without controls, the coefficient on workers
remittances is .061, implying a 6.1% increase in real exchange rate when remittances
double. When controls are added, the effect of the coefficient decreases in Column 2, to
about -9.1%, and increases in Column 3 to 9.6%, which would imply that money supply

21
Table 6: VAR estimates for real exchange rate on remittances 1996-2013 (1) (2) (3) (4) (5)
Regressor Real Exchange
Rate
Real Exchange
Rate
Real Exchange
Rate
Real Exchange
Rate
Real Exchange
Rate
Remittance 0.061 -0.091 0.095 -0.091 0.069
(0.061) (0.072) (0.10) (0.079) (0.13)
Dummy -0.0062 -0.034 -0.029 -0.034 -0.034
(0.047) (0.035) (0.039) (0.038) (0.042)
TP 0.35**
0.35**
(0.13) (0.14)
∆Openness -0.22 -0.22 -0.22 -0.13
(0.18) (0.23) (0.24) (0.24)
Money
Supply
0.19 0.23
(0.43) (0.38)
∆Terms of
Trade
0.0040 -0.18
(0.21) (0.27)
Intercept 0.0033 0.029 0.024 0.029 0.030
(0.036) (0.030) (0.025) (0.034) (0.032)
N 19 18 18 18 18
R2 0.037 0.425 0.170 0.425 0.217
adj. R2 -0.083 0.248 -0.085 0.185 -0.109
All regressors are in logarithmic form
Standard error in parentheses * p < 0.10,
** p < 0.05,
*** p < 0.01
has a clear negative bias effect, and that trade productivity has positively influenced
remittance. With only this regression to look at, it would be most reasonable to argue that
the observed effect of remittances is actually motivated by the natural progress of
Armenian growth. All other coefficients have their expected positive or negative effect
on real exchange rate.
Looking at columns 4 and 5, the same effect as shown from columns 2 and 3
appears. Due to this, it seems quite difficult to determine the effect of remittances of
nontradable prices. However, in Column 5, results indicate that doubling remittances
increases nontradable prices by 6.9%, which falls in line with the theoretical expectation.
However, it is clear that money supply and trade productivity influence these results in

22
the same way as they had for Columns 2 and 3. Unfortunately, none of these coefficients
are particularly precise or significant, so it would be difficult to draw concrete
conclusions from this particular model. With this fact in mind, we turn to the instrumental
variable analysis.
B. IV Analysis
Results from instrumenting remittance with tertiary enrollment rate are shown in
Table 6, which can be found below. As in the previous section, column 1 shows results
for the simple regression of real exchange rate on worker’s remittances. Columns 2
Table 7: IV estimates (instrumenting for workers remittances with tertiary enrollment)
1996-2013 Regressors (1) (2) (3) (4) (5)
Real Exchange
Rate
Real Exchange
Rate
Real Exchange
Rate
Real Exchange
Rate
Real Exchange
Rate
Remittance 0.19 0.17* 0.27* 0.20* 0.23
(0.13) (0.16) (0.19) (0.18) (0.28)
Dummy -0.065 -0.072 -0.063 -0.074 -0.060
(0.053) (0.049) (0.059) (0.048) (0.061)
TP 0.081 0.074
(0.16) (0.17)
∆Openness -0.028 -0.039 -0.038 -0.029
(0.21) (0.26) (0.21) (0.25)
Money Supply 0.49 0.46
(0.44) (0.51)
∆TOT 0.056 -0.081
(0.21) (0.31)
Intercept 0.046 0.051 0.045 0.051 0.044
(0.035) (0.034) (0.040) (0.035) (0.039)
First Stage
Fstatistic
1.56
(.23)
5.94
(.03)
1.77
(.18)
5.63
(.04)
1.82
(.17)
N 18 18 18 18 18
R2 0.004 0.062 < 0 < 0 0.059
adj. R2 0.129 0.227 < 0 < 0 0.333
All regressors are in logarithmic form
Standard error in parentheses (Prob > F. for F.stat) * p < 0.10,
** p < 0.05,
*** p < 0.01

23
through 5 correspond to equations 3-6 shown in the previous section. First stage
regressions can be found in Table 9, located in the appendix. While OLS regressions
from A. were hard to draw conclusions from, instrumental variable analysis, unlike OLS
regression, provides much more promising results.
According to the IV results table, the simple relationship between remittances and
exchange rate shows that real exchange rate will increase by 19% when remittances
increase. When controls are introduced in column 2, this result decreases to 17%, but
becomes much more significant. Such a result is comparable to Dorantes and Pozo’s
findings of a 22% increase in real exchange rate, as well as Chowdhury and Rabbi’s 14%
appreciation due to remittances Looking at non-tradable prices, Column 4 shows a
significant 20% increase in prices when remittances double. This result, along with the
results from column 2, seem most useful, both in their high adjusted R-squared values
and in the fact that they account for the Balassa-Samuelson effect, which has had a very
large and significant effect in each regression.
These results are further supported by the fact that tertiary education rate seems to
be a particularly useful instrument. Each column in Table 9 shows that remittances
increase by approximately 100 percent when tertiary enrollment doubles, which supports
the theoretical thrust behind the instrumentation. Secondly, the first stage tests for the
education rate instrument for Columns 2 and 4, our main columns of interest, show an F-
statistic equaling approximately 6. While this statistic fails the rule-of-thumb test, it is
large enough to not be considered extremely weak. Therefore, the instrumentation model
appears to be reasonably sound, if not exceptionally strong.

24
VI. Conclusion
This paper has studied whether remittance flows have an adverse effect on the
international competitiveness of Armenia. The results given show strong evidence that
although migrant workers work hard to save a major portion of their income to help their
families and improve their standard of living, their work creates challenges for the
Armenian tradable sector, and by extent, the international competitiveness of the country,
. In some ways, the model used in this paper serves as an improvement over
Chowdhury’s variable. While its data scope is severely decreased, it is also much simpler
econometrically, which makes it easier to infer policy implications by eliminating
confounding variables. Secondly, though its use of terms of trade, the model
distinguishes between the change of remittances on non-tradables and tradables, which
makes it easier to infer the cause of the change in real effective exchange rate.
Regardless, there are two potential pitfalls in these results, mainly stemming from
the proxies used, and the available data. While utilizing international migrant stock as a
proxy for remittance is a widely accepted transformation, and works decently well in this
case (proxy remittance values eclipse reported Armenian remittance values between 2010
and 2012), it still falls short in many ways. Since migrant population growth rate was
needed to create in migrant stock values (and by extension, remittance values), there is a
spike in remittances which might not exist I had access to better data, even though it is
justified by the existence of a structural break in all the series. Regardless, as it stands,
remittance is not as accurate as it should be.
Following from this point, there was little data to work with throughout this
analysis. Due to this lack of data, the aforementioned proxy of proxies was used to

25
construct the main explanatory variable. While this process allows the remittance variable
to capture some of the effects of unreported remittances on the Armenian economy, the
reliability of the original assumptions can be called into question, particularly because the
survey data gathered only took short-term migration into effect. At the same time, data is
also limited by time period. It is also possible that with a wider range of data to work
with from the beginning, then there would have been fewer problems with collinearity,
and the model could have measured the relationship between international
competitiveness and worker’s remittances more efficiently. Therefore, if more inroads are
to be made within this topic, then more attention needs to be paid to obtaining
development and migration indicators for Armenia, as well as other CIS states.
In spite of the positive socio-economic effects of remittances in Armenia, this
study concludes that the inflow of remittances is having adverse effects on the trade
competitiveness of the country. Therefore, the Armenian government should design
policies which create greater openness in goods and capital markets, allocate a portion of
the government budget for capital expenditure on the tradable sector, and divert valuable
remittance flows to priority investment areas through formal financial channels to
improve the international trade competitiveness of the country.

26
VII. References:
Adams, R. 2005. ‘‘Remittances, Household Expenditure and Investment in
Guatemala.’’ Policy Research Working Paper Series no. 3532, Washington, DC:
The World Bank.
Aggarwal, R., A. Demirguc-Kunt, and M. Peria. 2006. ‘‘Do Workers’ Remittances
Promote Financial Development?’’ World Bank Policy Research Working Paper
no. 3957, Washington, DC: The World Bank.
Amuedo-Dorantes, C., and S. Pozo. 2004. ‘‘Workers Remittances and the Real
Exchange Rate: A Paradox of Gifts.’’ World Development 32 (8): 1407–17.
Balassa, Bela, “The Purchasing Power Parity Doctrine: A Reappraisal,” Journal of
Political Economy 72 (1964):584–96.
Bourdet, Yves, and Hans Falck. "Emigrants' remittances and Dutch disease in Cape
Verde." International Economic Journal 20, no. 3 (2006): 267-284.
Chami, Ralph, Connel Fullenkamp, and Samir Jahjah. "Are immigrant remittance flows a
source of capital for development?." (2003): 1-48.
Chowdhury, M. 2004. Resources Booms and Macroeconomic Adjustments in
Developing Countries. Aldershot, UK and Burlington, VT: Ashgate.
Chowdhury M. & F. Rabbi. 2013, “Workers' remittances and Dutch Disease in
Bangladesh.” The Journal of International Trade & Economic Development: An
International and Comparative Review, 23:4, 455-475.
Corden, W. Max, and J. Peter Neary. "Booming sector and de-industrialisation in a small
open economy." The economic journal (1982): 825-848
Cox Edwards, Alejandra and Manuelita Ureta, 2003. “International Migration,
Remittances, and Schooling: Evidence from El Salvador.” Journal of
Development Economics 72, 429–61.
Datastream International. (October 15, 2014). In International Financial Statistics
[Online]. Available: Datastream International/Economics.
Edwards, S. 1989. Real Exchange Rates, Devaluation, and Adjustment: Exchange
Rate Policy in Developing Countries. Cambridge, MA: MIT Press
Edwards, S., and M. Savastano. 1999. ‘‘Exchange Rates in Emerging Economies:
What Do We know? What Do We Need to Know?’’ NBER Working Paper no.
7228. NBER: Cambridge, MA.

27
Ghazaryan, Armine, and Guillermo Tolosa. "Remittances in Armenia: Dynamic Patterns
and Drivers." International Monetary Fund. (2012).
Kroft, K. and Lloyd-Ellis, H. (2002) Further cross-country evidence on the link between
growth, volatility and business cycles, Working Paper, Queens University,
Kingston, ON.
Manufacturing Value Added Database [Online]. (November 17th 2014). Available:
United Nations Industrial Development Organization
Michaely, M. 1981. ‘‘Foreign Aid, Economic Structure and Dependence.’’ Journal of
Development Economics 9: 313–30.
Migration and Remittances Data (Prospects) [Online]. (October 15th 2014). Available:
World Bank.
Neary, P. 1988. ‘‘Determinants of the Equilibrium Real Exchange Rate.’’ American
Economic Review 78 (1): 201–15.
Organization for Security and Cooperation in Europe. 2005, 2007, 2012. "Labor
Migration from Armenia and Returnees Surveys." [Online] (November 17th
2014)
Available. The Caucasus Research Resource Center
Ratha, Dilip. "Workers’ remittances: an important and stable source of external
development finance." (2005).
Samuelson, Paul A., “Theoretical Notes on Trade Problems,” Review of Economics and
Statistics 23 (1964):1–60
Trends in International Migrant Stock, The 2013 Revision [Online]. (November 17th
2014) Available: United Nations Population Division
UIS Data Centre, Education Indicators [Online]. (March 27th
2015) Available: UNESCO
World Development Indicators, World Tables [Online]. (March 27th 2015). Available:
World Bank.
28
Table 8: Descriptive Statistics for OSCE Survey 2002-2011 Variable Obs Mean Std. Dev. Min Max
Fraction of income remitted 1070 0.462288 0.294802 0 1
Average Monthly Income* 1070 663.83 1389.98 0 41675.78
Time abroad** 1070 20.85084 20.37758 .3 100
Total Paid Remittances* 1070 6924.364 10944.97 0 81454.59
*in US Dollars **in Months
Source: Constructed by the author using surveys given to Armenian migrant workers by the OSCE

29
Table 9: First Stage OLS Regression Estimates for IV Analysis Regressor (1) (2) (3) (4) (5)
Remittances Remittances Remittances Remittances Remittances
Tertiary Enrollment 1.00 0.86**
0.78 1.03* 0.66
(0.80) (0.35) (0.62) (0.49) (0.64)
Dummy 0.34**
0.20**
0.25* 0.23
** 0.23
(0.14) (0.078) (0.13) (0.094) (0.15)
TP 0.94***
1.08***
(0.25) (0.20)
∆Openness -0.79* -1.10
** -1.02
* -0.90
(0.44) (0.50) (0.54) (0.69)
Money Supply -1.43* -1.34
(0.77) (0.76)
∆Terms of Trade 0.43 -0.30
(0.48) (0.66)
Intercept -0.24* -0.16
*** -0.19
* -0.19
** -0.17
(0.13) (0.036) (0.11) (0.063) (0.14)
N 18 18 18 18 18
R2 0.350 0.742 0.609 0.755 0.617
adj. R2 0.263 0.662 0.489 0.653 0.458
All regressors are logarithmic
Standard errors in parentheses * p < 0.10,
** p < 0.05,
*** p < 0.01