Embed Size (px)
Citation preview
RESEARCH ARTICLE Open Access
An optimization framework for measuringspatial access over healthcare networksZihao Li1, Nicoleta Serban1 and Julie L. Swann1,2*
Abstract
Background: Measurement of healthcare spatial access over a network involves accounting for demand, supply,and network structure. Popular approaches are based on floating catchment areas; however the methods canoverestimate demand over the network and fail to capture cascading effects across the system.
Methods: Optimization is presented as a framework to measure spatial access. Questions related to when and whyoptimization should be used are addressed. The accuracy of the optimization models compared to the two-stepfloating catchment area method and its variations is analytically demonstrated, and a case study of specialty carefor Cystic Fibrosis over the continental United States is used to compare these approaches.
Results: The optimization models capture a patient’s experience rather than their opportunities and avoidoverestimating patient demand. They can also capture system effects due to change based on congestion.Furthermore, the optimization models provide more elements of access than traditional catchment methods.
Conclusions: Optimization models can incorporate user choice and other variations, and they can be usefultowards targeting interventions to improve access. They can be easily adapted to measure access for differenttypes of patients, over different provider types, or with capacity constraints in the network. Moreover, optimizationmodels allow differences in access in rural and urban areas.
Keywords: Optimization, Health access, Measurement of access, Intervention
BackgroundAccess to healthcare is widely recognized as essential forensuring not only care of immediate health needs butalso to enable health and wellness in the population.Access has multiple dimensions including accessibility,availability, affordability, accommodation, and accept-ability [1–3] and is of great importance to decisionmakers in public health. In this paper, we focus onmeasurement models for spatial access over a healthnetwork with patients and providers, which is mostclosely related to the elements of accessibility (e.g., loca-tion and travel distance for care) and availability (e.g.,coverage or the volume of providers). A healthcare net-work is defined as a transportation network with pa-tients as demand nodes and providers as supply nodes,
and an arc between patient and provider if the provideris accessible for the patient.Themeasurementmodels studied in this paper are designed
to measure potential access based on the services that areavailable for use relative to population and distance. On thecontrary, realized access reflects actual use of services, whichcan be affected by finances, behaviors, and other factors.Potential access ismeasurable although it is not observable.An optimization-based approach is described in this
paper for quantifying potential access over the health-care network and for estimating the impact of changesto the network. Optimization is a mathematical sciencethat is widely accepted in engineering and science asproviding a way to balance complex interactions acrossa system, and there is a history of using optimization toassist medical decision making [4–6]. In this paper, the-oretical and practical optimization modeling techniquesare used to assist with health care policy development bymeasuring access and computing the economics behinddiscrepancy of access. Specifically, questions such as how
* Correspondence: [email protected]. Milton Stewart School of Industrial and Systems Engineering, GeorgiaInstitute of Technology, Atlanta, USA2School of Public Policy by courtesy, Georgia Institute of Technology, Atlanta,USA
© 2015 Li et al. This is an Open Access article distributed under the terms of the Creative Commons Attribution License(http://creativecommons.org/licenses/by/4.0), which permits unrestricted use, distribution, and reproduction in any medium,provided the original work is properly credited. The Creative Commons Public Domain Dedication waiver (http://creativecommons.org/publicdomain/zero/1.0/) applies to the data made available in this article, unless otherwise stated.
Li et al. BMC Health Services Research (2015) 15:273 DOI 10.1186/s12913-015-0919-8
optimization models can be used to measure access, onwhat types of networks they offer the most accurate esti-mates of access, and ultimately, why they should be usedfor measuring and for suggesting interventions to improveaccess are addressed in this paper. The answers to thesequestions are useful for improving the health of popula-tions and assisting with health policy development byinforming areas of greatest need.The optimization models are compared to some exist-
ing methods. In particular, comparisons are made to var-iations of the two-step floating catchment area (2SFCA)method [7], including the Enhanced 2SFCA (E2SFCA)method [8] and the Modified 2SFCA (MSFCA) method[9], with some discussion of other catchment methods.The catchment methods, which are offsprings of a grav-ity model of attractions between populations and pro-viders, estimate the size of population served at eachprovider using distance zones and compute accessibilityof a community based on the availability of providersin the community’s zones; communities can be cap-tured in the zones of multiple providers. In contrast,optimization models match patients and providersbased on both distances and the relatively crowdednessof each provider, and estimate the accessibility of a pa-tient using the matching results to determine the traveldistance and the corresponding crowdedness of eachpatient. Optimization models can take on the perspec-tive of a centralized planner in making assignments, orthey can be adapted to directly incorporate patientchoice over the network.To compare the measurement models for spatial ac-
cess, several specific network structures are examined,which are designed so that access measures can becompared analytically. Results on a large case study ofspecialty care of Cystic Fibrosis (CF), where thenetwork has varying levels of accessibility are alsoprovided.Analytically, this paper demonstrates that the total
number of patient visits captured by all facilities in the2SFCA methods is larger than the number of visitsexpected based on population size. The three-stepfloating catchment area (3SFCA) method [10] adds anassignment mechanism to address the competition byfacilities, but the assignments are only based ondistance. In contrast, in the optimization models, thewillingness to travel is not only a function of distancebut also of facility congestion including its size. As aresult, the optimization models can capture cascadingeffects in the system, where a change in congestionfor one population leads to different decisions andthus impacts individuals in another location. Theoptimization models also allow for simultaneous esti-mation of measures of access across the five dimen-sions outlined [1].
More generally, optimization models can be adaptedto many contexts including different patient types(e.g., Medicaid or not), provider constraints, or others.They are also useful in optimizing interventions, wherethe intervention can target different aspects of access(e.g., distance versus congestion).
MethodsOptimization frameworkIn healthcare decision making and service researchareas, optimization models have been used to determinethe best location for a new clinic [11–13], ensure thatresource locations are sufficient to cover the need acrossa network [14], route nurses for home health services[15], improve health outcomes among communities [16,17], and evaluate policies for pandemic influenza, breastcancer, and HIV over a network [18–20], among others.Wang [21] reviewed several cases where optimizationmodels could be used to improve access or service overa network.In our models, the cost of an individual is associ-
ated with two dimensions of access [1]: accessibilityand availability. The first is measured with travel dis-tance (or time). The second is measured with conges-tion, which for an individual is associated with therelative number of people (or visits) at a providercompared to the resources available. One can alsothink of this as capturing the waiting time until anappointment is available. Studies show that individualsare willing to drive further to receive an appointmentmore quickly [22]. Thus we assume that the utility(or disutility) associated with a patient’s access is aweighted sum of the distance and a congestion term,where we scale the congestion term to trade-off therelative importance between the two. We expect thatthe congestion weight (α) may be different for differ-ent types of healthcare services, such as primary careor specialty care (i.e., distance may have a relativelylower cost). The congestion weight can also representthe resources available at a facility.Several elements are defined for our formulation. The
total number of patients is n and the total number of fa-cilities is m. Let i = 1,…, n be the indices of patients andj = 1,…, m be the indices of facilities. The distance be-tween patient i and provider j is dij; vi is the estimatednumber of visits that patient i = 1,…, n will make(demand);and αj is the congestion weight at provider j.A dummy location can be introduced for the assignmentof demand that cannot be met.The decision variables are xij, which is the percentage
of time assigned to facility j from patient or communityi, for each i = 1,…, n and j = 1,…, m.The formulation of the basic centralized model
follows:
Li et al. BMC Health Services Research (2015) 15:273 Page 2 of 13
Objective function:
minXn
i¼1
Xm
j¼1dijxijvi þ
Xm
j¼1αj
Xn
i¼1xijvi
� �2ð1Þ
Constraints:Xm
j¼1xijvi ¼ vi; ∀i ¼ 1;…; n assignment constraintð Þ
ð2Þ0≤ xij ≤ 1;∀i ¼ 1;…; n and∀j ¼ 1;…;m: ð3Þ
The objective function (1) states that the total numberof visits assigned should be vi for each patient or com-munity i. Constraint (2) requires that all individuals beassigned, and equation (3) requires non-negativity of thedecision variables. Each individual’s congestion at a visitis proportional to the total number of visits at that facil-ity scaled by αj. The congestion term in the objectivesums over the congestion experienced by all patientsresulting in an overall term that is squared. The choiceof quadratic function comes from the following idea: if npatients receive care from a provider location, then eachpatient experiences n units of congestion, then the totalcongestion is n × n = n2 (similar to total latency in net-work congestion work [23]). Note that when α = 0, thismodel gives equivalent results to assignment by shortestdistance, and when α =∞, this model gives equivalent re-sults to equally distributing patient visits to each facility.See Additional file 1 section 1 for a process to select thecongestion weight.For a patient, the number of visits to a close location
is expected to be more than the number of visits to a farlocation because of the willingness to travel. Thus, thenumber of visits to each location using a function thatdecays with distance is determined. This is analogous tostep 1 in the E2SFCA method where the population ismultiplied by a weight. This also implies that the num-ber of visits covered in the network may be less than100 %.From the results of an optimization model, several
measures of spatial access are calculated. The measuresinclude i) the distance traveled for each patient or com-munity; ii) the congestion experienced by each patientor community; iii) the coverage, which is defined as theratio of visits assigned to visits needed for an individualor community.
Variations on the optimization modelWith optimization models, many variations are possible,including through the addition of constraints, the use ofdifferent objective function values, or by differentiatingdecision variables by type. Here we describe a majorvariation in our model, optimization with user choice(“Decentralized”), and include many others such as
capacity, unmet demand, and willingness to travel inAdditional file 1 section 2.The traditional deterministic optimization model (as
presented above) often assumes a centralized plannerwho makes decisions for every patient in a healthcarenetwork to achieve the best overall objective. However,user choice can be incorporated by an equilibrium con-straint that represents individual choices as in game the-ory [24]; we call the resulting optimization modeldecentralized.An overall equilibrium solution requires a user choice
constraint to be satisfied for each patient visit in the net-work, where the constraint states that the individualcannot improve their distance and congestion of thatvisit by switching to another facility given the other deci-sions on the network.The decision variable and equilibrium constraint are
defined below:xijk = decision variable is 1 if patient i chooses facility j
for visit k, or 0 otherwise;
dij þ αjXn
p¼1
Xvp
k¼1xpjk ≤ diq
þαqXn
p¼1
Xvp
k¼1xpqk þ 1
� �;∀q ≠ j;∀i;∀k
ð4Þ
The equilibrium condition includes a separate con-straint for each patient’s visit and each location whenthere is no distance decay function. The left-hand side isthe distance and congestion associated with current fa-cility choice j for a visit k, and the right-hand side is thedistance and congestion at any location other than j. SeeAdditional file 1 section 3 for more details.
Review of catchment modelsGravity models use the following general form to calcu-late an “attraction” measure for each patient i:
AGi ¼
Xm
j¼1
Sjw dij� �
Xk
i¼1Piw dij
� �; ð5Þ
where Sj is the supply at provider j, Pi is the popula-tion at location i, w(dij) is the decay function based ondistance of each patient-provider pair (i,j).The original 2SFCA method was introduced by Luo
and Wang [7]; it allows the catchment of each providerand patient to float based on the distances between eachpair. E2SFCA is a variation that suggests applying differ-ent weights within travel time zones to account fordecaying of the willingness to travel as distance increases[8]. Under the E2SFCA model, in the first step the“physician-to-population ratio” at each provider is calcu-lated. Although the E2SFCA aims to estimate the num-ber of patients that may potentially use a facility, it iseasy to extend the metrics to estimate the number of
Li et al. BMC Health Services Research (2015) 15:273 Page 3 of 13
visits by replicating each patient using visits demanded(e.g., a patient demanding 10 visits can be viewed as 10patients) [25, 26]. We make a minor adjustment to allowfor each patient to have multiple visits to a provider, sowe use physician-to-visits ratio instead. Thus we obtain:
Rj ¼ SjXr
Xi∈ dij<Drf gV iWr
; ð6Þ
where Sj is the number of physicians available at pro-vider j, Wr is the weight value corresponding to thecatchment zone of dij. The value of Wr is calculatedusing the distance decay function, which is usually non-linear. Dr is the distance threshold of catchment zone r.The parameter Vi is the number of potential visits ifthere is no decay in willingness to travel or the maximaldemand for patient or community i. The originalE2SFCA method introduced the model with three catch-ment zones, but an extension is to allow a differentnumber of zones or even a continuous decay (“imped-ance”) function across a single zone. Example choices ofimpedance functions include Gaussian [7, 27], exponen-tial, inverse power, and others; [27] discusses parametersetting for the impedance function. In the second step ofE2SFCA, the method defines the accessibility of eachpatient or community i based on the ratios at each pro-vider and the zone weights:
Ai ¼X
r
Xj∈ dij<Drf gRjWr: ð7Þ
Another catchment approach is the 3SFCA method,which incorporates competitions among multiple pro-viders within the same catchment zone of a patient andmakes assignments of patients by distance. The M2SFCAmethod [9] modifies the patient level accessibility in [7] bymultiplying the distance weight twice, while another ap-proach [28] allows for zones to differ by transportationmodes.For a simple system, the individual measures of spatial
access from optimization models can be combined todirectly compare with the accessibility measures of2SFCA methods (E2SFCA and M2SFCA). The simplestsupply network consists of n communities in a circularpopulation area with a facility at the center. Let di be thedistance from community i to the facility and S thenumber of physicians in the facility. Calculate the facilitypopulation-to-physician ratio R and patient accessibili-tyAi using [6] and [7]. Define a decay function w (di) ∈[0,1]. For this system, the optimization method isequivalent to assigning by shortest distance. Let F denotethe congestion at the facility, then F ¼ 1
R . The coverageof community i is calculated as w(di). Therefore, for thissystem, the patient accessibility is AE
i ¼ coveragecongestion , for the
E2SFCA method. For the M2SFCA method, a similarcalculation can be made, where the composite patient
accessibility measure is AMi ¼ coverage2
congestion.
Human subject study approvalThe Institutional Review Board of the Georgia Instituteof Technology approved the overall research projectusing data from the Cystic Fibrosis Foundation, and theCystic Fibrosis Foundation also approved the study touse registry data previously collected from patients withtheir signed consent. The submitted article uses theexisting locations of Cystic Fibrosis care centers, the dis-tances traveled by patients to CF centers for care, andsimulated patient locations with corresponding distancesto CF centers. Simulated locations of patients are ran-domly generated according to the prevalence of CF andthe composition of populations at the county level.
ResultsAnalytical comparisonsIn this section, analytical results on accessibility as mea-sured by the optimization method and catchmentmodels are provided. Most analyses in this section focuson simple systems where service areas are non-overlapping. For simple networks with overlappingservice areas, the detailed analysis can be found inAdditional file 1 section 4. Notations that will be usedfrequently in the analysis are defined below. The dis-tance decay function w(dij) is between 0 and 1. If dij isthe distance between community i and facility j, and viis the visits needed by community i, then we assumethat facility j receives w(dij)vi visits from community ias in the catchment models. In optimization models,let Pij be the proportion of the population in commu-nity i that visits facility j.
Result 1 (Opportunities vs. Experiences): optimizationmodels capture a patient’s experience rather than theiropportunities. As a result, 2SFCA methods tend tooverestimate the total number of visitsFor many catchment models, the estimated accessibilitymeasure increases when more facility choices areavailable to a population. However, assignments models(including optimization and the 3SFCA method), are es-timating the cost of potential access, and this does notincrease if a new choice is congested or inconsequential.This is illustrated with a simulated system of populationsand facilities, as in Delamater (2013) [9] .Consider System 1 as described in Fig. 1. When facility
A and population X are sufficiently far from B and Y, thecatchment models and the optimization method willprovide the same accessibility estimate. Consider a sec-ond system, where B and Y are both closer to X and A
Li et al. BMC Health Services Research (2015) 15:273 Page 4 of 13
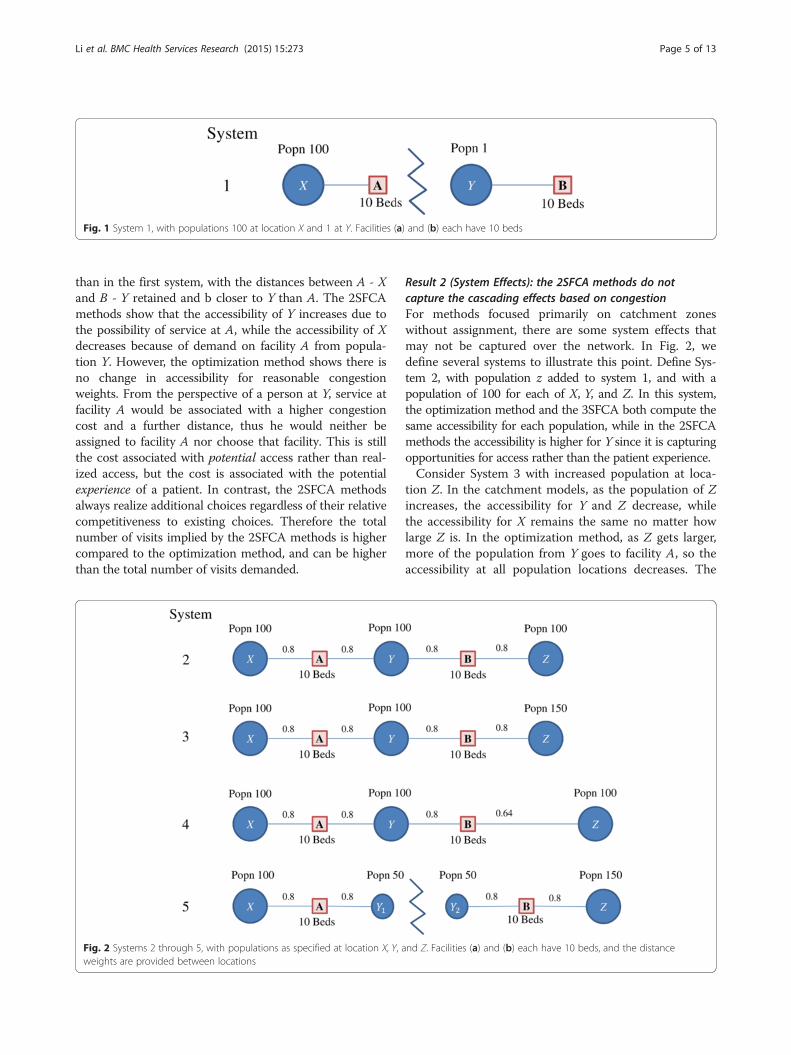
than in the first system, with the distances between A - Xand B - Y retained and b closer to Y than A. The 2SFCAmethods show that the accessibility of Y increases due tothe possibility of service at A, while the accessibility of Xdecreases because of demand on facility A from popula-tion Y. However, the optimization method shows there isno change in accessibility for reasonable congestionweights. From the perspective of a person at Y, service atfacility A would be associated with a higher congestioncost and a further distance, thus he would neither beassigned to facility A nor choose that facility. This is stillthe cost associated with potential access rather than real-ized access, but the cost is associated with the potentialexperience of a patient. In contrast, the 2SFCA methodsalways realize additional choices regardless of their relativecompetitiveness to existing choices. Therefore the totalnumber of visits implied by the 2SFCA methods is highercompared to the optimization method, and can be higherthan the total number of visits demanded.
Result 2 (System Effects): the 2SFCA methods do notcapture the cascading effects based on congestionFor methods focused primarily on catchment zoneswithout assignment, there are some system effects thatmay not be captured over the network. In Fig. 2, wedefine several systems to illustrate this point. Define Sys-tem 2, with population z added to system 1, and with apopulation of 100 for each of X, Y, and Z. In this system,the optimization method and the 3SFCA both compute thesame accessibility for each population, while in the 2SFCAmethods the accessibility is higher for Y since it is capturingopportunities for access rather than the patient experience.Consider System 3 with increased population at loca-
tion Z. In the catchment models, as the population of Zincreases, the accessibility for Y and Z decrease, whilethe accessibility for X remains the same no matter howlarge Z is. In the optimization method, as Z gets larger,more of the population from Y goes to facility A, so theaccessibility at all population locations decreases. The
Fig. 1 System 1, with populations 100 at location X and 1 at Y. Facilities (a) and (b) each have 10 beds
Fig. 2 Systems 2 through 5, with populations as specified at location X, Y, and Z. Facilities (a) and (b) each have 10 beds, and the distanceweights are provided between locations
Li et al. BMC Health Services Research (2015) 15:273 Page 5 of 13
accessibility at each location is the same because the sys-tem is constructed in a very specific and symmetric way.A similar effect can be seen when System 2 is varied
by moving population Z further away from the center(System 4). In this case, more patients from Y switch toB to reduce congestion, resulting in better access forpopulation X in the optimization method, while the2SFCA methods show no change for X.Define System 5 the same as 1 but with an unbreak-
able barrier separating population Y in half, and a popu-lation of Z equal to 150. The 3SFCA quantifies the sameaccess with and without the barrier, because the assign-ment is based on distance alone. On the other hand, theoptimization method shows different access in System 5compared to 3, because assignment is based on both dis-tance and congestion. The accessibility estimates for thedifferent systems are summarized in Table 1.
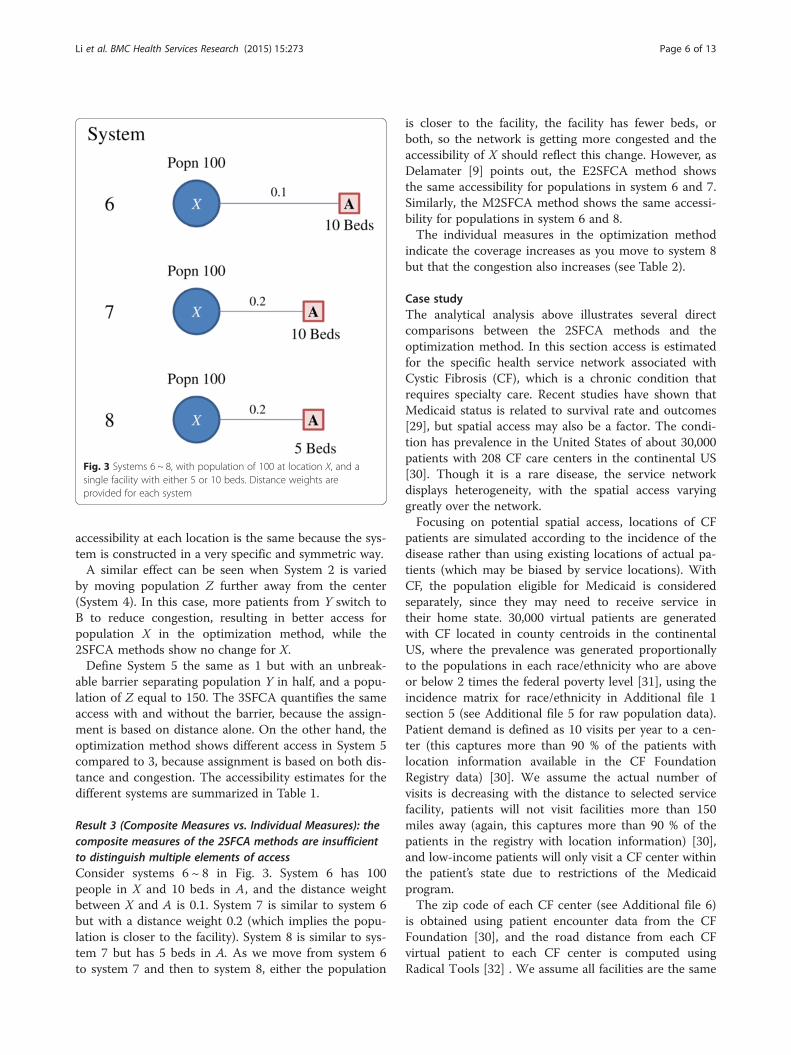
Result 3 (Composite Measures vs. Individual Measures): thecomposite measures of the 2SFCA methods are insufficientto distinguish multiple elements of accessConsider systems 6 ~ 8 in Fig. 3. System 6 has 100people in X and 10 beds in A, and the distance weightbetween X and A is 0.1. System 7 is similar to system 6but with a distance weight 0.2 (which implies the popu-lation is closer to the facility). System 8 is similar to sys-tem 7 but has 5 beds in A. As we move from system 6to system 7 and then to system 8, either the population
is closer to the facility, the facility has fewer beds, orboth, so the network is getting more congested and theaccessibility of X should reflect this change. However, asDelamater [9] points out, the E2SFCA method showsthe same accessibility for populations in system 6 and 7.Similarly, the M2SFCA method shows the same accessi-bility for populations in system 6 and 8.The individual measures in the optimization method
indicate the coverage increases as you move to system 8but that the congestion also increases (see Table 2).
Case studyThe analytical analysis above illustrates several directcomparisons between the 2SFCA methods and theoptimization method. In this section access is estimatedfor the specific health service network associated withCystic Fibrosis (CF), which is a chronic condition thatrequires specialty care. Recent studies have shown thatMedicaid status is related to survival rate and outcomes[29], but spatial access may also be a factor. The condi-tion has prevalence in the United States of about 30,000patients with 208 CF care centers in the continental US[30]. Though it is a rare disease, the service networkdisplays heterogeneity, with the spatial access varyinggreatly over the network.Focusing on potential spatial access, locations of CF
patients are simulated according to the incidence of thedisease rather than using existing locations of actual pa-tients (which may be biased by service locations). WithCF, the population eligible for Medicaid is consideredseparately, since they may need to receive service intheir home state. 30,000 virtual patients are generatedwith CF located in county centroids in the continentalUS, where the prevalence was generated proportionallyto the populations in each race/ethnicity who are aboveor below 2 times the federal poverty level [31], using theincidence matrix for race/ethnicity in Additional file 1section 5 (see Additional file 5 for raw population data).Patient demand is defined as 10 visits per year to a cen-ter (this captures more than 90 % of the patients withlocation information available in the CF FoundationRegistry data) [30]. We assume the actual number ofvisits is decreasing with the distance to selected servicefacility, patients will not visit facilities more than 150miles away (again, this captures more than 90 % of thepatients in the registry with location information) [30],and low-income patients will only visit a CF center withinthe patient’s state due to restrictions of the Medicaidprogram.The zip code of each CF center (see Additional file 6)
is obtained using patient encounter data from the CFFoundation [30], and the road distance from each CFvirtual patient to each CF center is computed usingRadical Tools [32] . We assume all facilities are the same
Fig. 3 Systems 6 ~ 8, with population of 100 at location X, and asingle facility with either 5 or 10 beds. Distance weights areprovided for each system
Li et al. BMC Health Services Research (2015) 15:273 Page 6 of 13
size (e.g., can serve 1500 visits a year); the exact numbercan be changed and the relative comparisons betweenmethods will hold.Accessibility measures were calculated for E2FSCA,
M2SFCA, and the decentralized (with user choice)optimization model. The optimization model was imple-mented using C++ and the CPLEX solver on a UNIXsystem (see Additional file 2). The decay functions aresuch that 10 visits will be made when distance is zero,and visits approach zero when distance is 150 miles; seespecific functions in section 7 in Additional file 1: TableS4. There are many functions that can be used to modelthe decaying willingness of travel. We have chosen touse the exponential function for the rare disease settingof Cystic Fibrosis. Because CF is rare and access to careis relatively low compared to primary care, patients arewilling to travel longer distances than for some conditions.The parameter used in the case study was calibrated to bein line with realized utilization derived from the CF regis-try data (see section 7 in Additional file 1: Figure S12). Forthe optimization model, a congestion weight of 10 is usedunless otherwise specified (see Additional file 1 section 1).For the 2SFCA methods, Medicaid patients were only in-cluded in catchment areas of facilities in their own states.Maps of the decentralized optimization model display
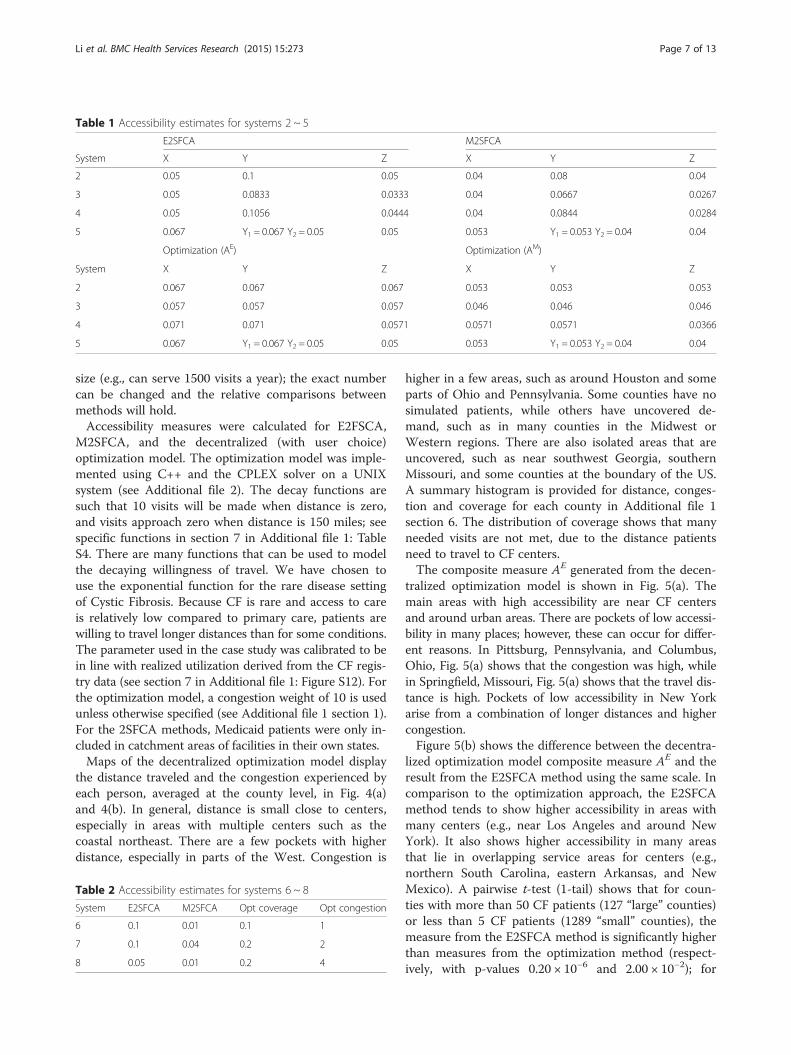
the distance traveled and the congestion experienced byeach person, averaged at the county level, in Fig. 4(a)and 4(b). In general, distance is small close to centers,especially in areas with multiple centers such as thecoastal northeast. There are a few pockets with higherdistance, especially in parts of the West. Congestion is
higher in a few areas, such as around Houston and someparts of Ohio and Pennsylvania. Some counties have nosimulated patients, while others have uncovered de-mand, such as in many counties in the Midwest orWestern regions. There are also isolated areas that areuncovered, such as near southwest Georgia, southernMissouri, and some counties at the boundary of the US.A summary histogram is provided for distance, conges-tion and coverage for each county in Additional file 1section 6. The distribution of coverage shows that manyneeded visits are not met, due to the distance patientsneed to travel to CF centers.The composite measure AE generated from the decen-
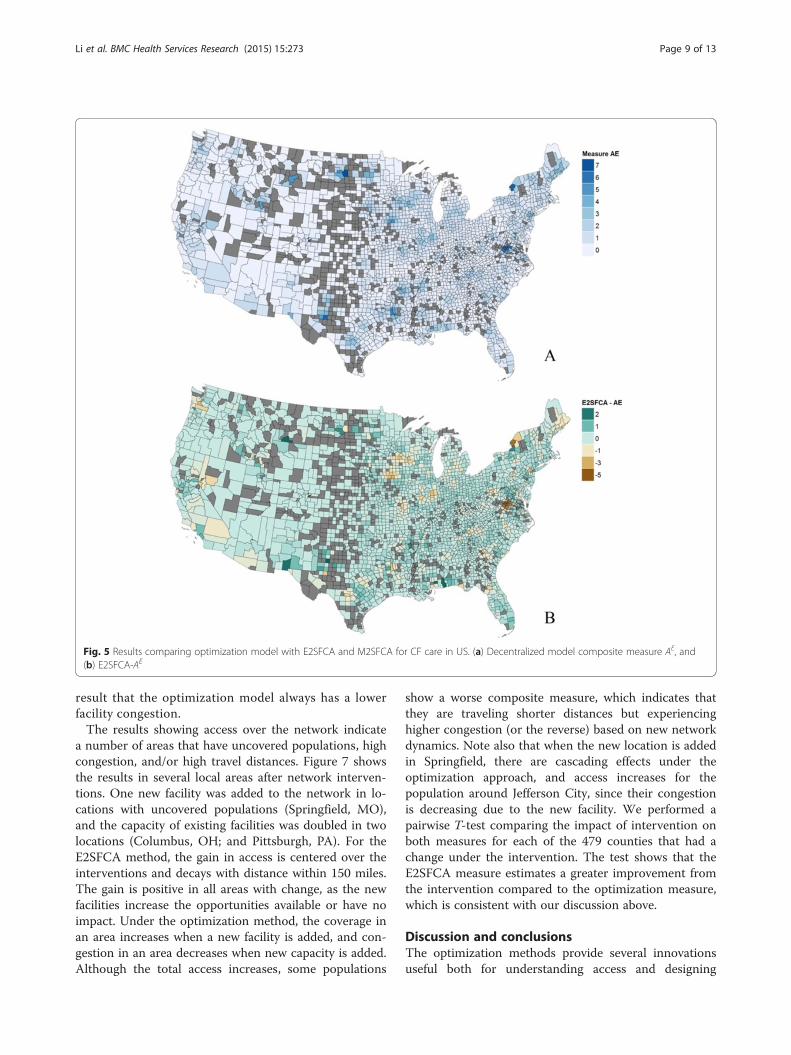
tralized optimization model is shown in Fig. 5(a). Themain areas with high accessibility are near CF centersand around urban areas. There are pockets of low accessi-bility in many places; however, these can occur for differ-ent reasons. In Pittsburg, Pennsylvania, and Columbus,Ohio, Fig. 5(a) shows that the congestion was high, whilein Springfield, Missouri, Fig. 5(a) shows that the travel dis-tance is high. Pockets of low accessibility in New Yorkarise from a combination of longer distances and highercongestion.Figure 5(b) shows the difference between the decentra-
lized optimization model composite measure AE and theresult from the E2SFCA method using the same scale. Incomparison to the optimization approach, the E2SFCAmethod tends to show higher accessibility in areas withmany centers (e.g., near Los Angeles and around NewYork). It also shows higher accessibility in many areasthat lie in overlapping service areas for centers (e.g.,northern South Carolina, eastern Arkansas, and NewMexico). A pairwise t-test (1-tail) shows that for coun-ties with more than 50 CF patients (127 “large” counties)or less than 5 CF patients (1289 “small” counties), themeasure from the E2SFCA method is significantly higherthan measures from the optimization method (respect-ively, with p-values 0.20 × 10⁻⁶ and 2.00 × 10⁻²); for
Table 2 Accessibility estimates for systems 6 ~ 8
System E2SFCA M2SFCA Opt coverage Opt congestion
6 0.1 0.01 0.1 1
7 0.1 0.04 0.2 2
8 0.05 0.01 0.2 4
Table 1 Accessibility estimates for systems 2 ~ 5
E2SFCA M2SFCA
System X Y Z X Y Z
2 0.05 0.1 0.05 0.04 0.08 0.04
3 0.05 0.0833 0.0333 0.04 0.0667 0.0267
4 0.05 0.1056 0.0444 0.04 0.0844 0.0284
5 0.067 Y1 = 0.067 Y2 = 0.05 0.05 0.053 Y1 = 0.053 Y2 = 0.04 0.04
Optimization (AE) Optimization (AM)
System X Y Z X Y Z
2 0.067 0.067 0.067 0.053 0.053 0.053
3 0.057 0.057 0.057 0.046 0.046 0.046
4 0.071 0.071 0.0571 0.0571 0.0571 0.0366
5 0.067 Y1 = 0.067 Y2 = 0.05 0.05 0.053 Y1 = 0.053 Y2 = 0.04 0.04
Li et al. BMC Health Services Research (2015) 15:273 Page 7 of 13
counties of other sizes (“medium” counties), the test isinconclusive. The F-test shows that for all groups ofcounties, the variance of the E2SFCA measure is higher(with p-value 1.88 × 10⁻⁴ for small counties, value lessthan 10−6 for medium counties, and 3.90 × 10⁻² for largecounties. The Mann–Whitney-Wilcoxon test shows thatthe E2SFCA measure is greater in median than theoptimization composite measure with p-values less than10−6 for small and medium counties, and 2.02 × 10⁻² forlarge counties. The finding is consistent with the analyt-ical results in Additional file 1 section 4 showing thatwith overlapping catchment areas, E2SFCA quantifieshigher access when distances are relatively small. Thecomparison between the composite measure AM and the
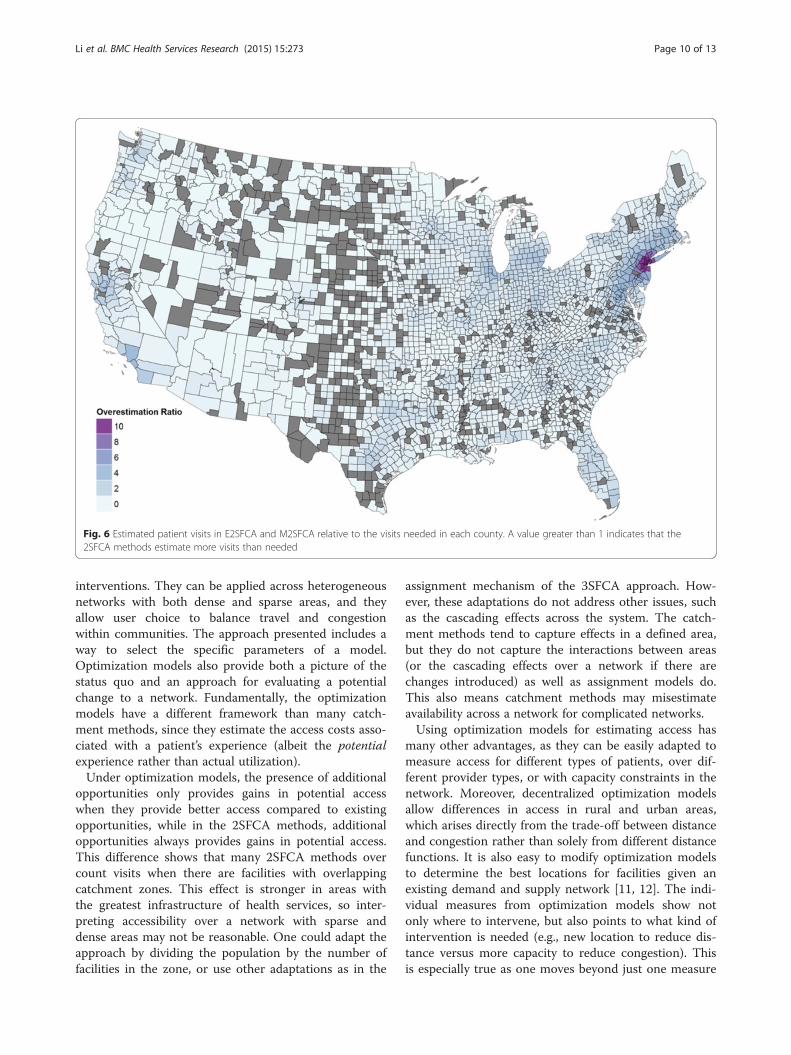
M2SFCA method is similar but the magnitude of differ-ences is smaller.The number of visits captured in the E2SFCA method
is shown in Fig. 6 in comparison to the visits needed bythe population. It is highest around facilities, and espe-cially with multiple facilities such as around New York.For the optimization model, the realized visits per facil-ity are estimated to be 0 to 3000. In contrast, the rangefor the E2SFCA result is 0 to 10,540 per facility. This isconsistent with the analytical result that the number ofvisits is higher in the E2SFCA approach. The F test indi-cates that the variance of the facility congestion issignificantly higher for the E2SFCA approach, with ap-value less than 10−6. This is similar to the analytical
Fig. 4 Optimization results for patient cost of potential access. (a) Distance, and (b) Congestion
Li et al. BMC Health Services Research (2015) 15:273 Page 8 of 13
result that the optimization model always has a lowerfacility congestion.The results showing access over the network indicate
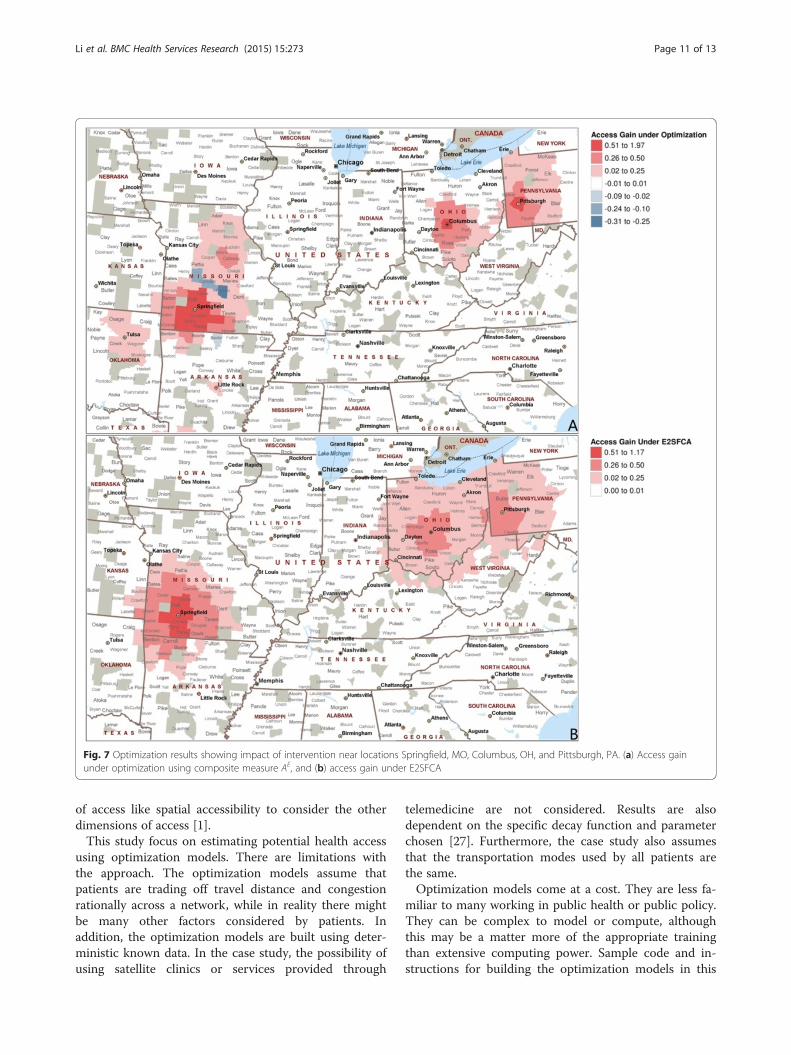
a number of areas that have uncovered populations, highcongestion, and/or high travel distances. Figure 7 showsthe results in several local areas after network interven-tions. One new facility was added to the network in lo-cations with uncovered populations (Springfield, MO),and the capacity of existing facilities was doubled in twolocations (Columbus, OH; and Pittsburgh, PA). For theE2SFCA method, the gain in access is centered over theinterventions and decays with distance within 150 miles.The gain is positive in all areas with change, as the newfacilities increase the opportunities available or have noimpact. Under the optimization method, the coverage inan area increases when a new facility is added, and con-gestion in an area decreases when new capacity is added.Although the total access increases, some populations
show a worse composite measure, which indicates thatthey are traveling shorter distances but experiencinghigher congestion (or the reverse) based on new networkdynamics. Note also that when the new location is addedin Springfield, there are cascading effects under theoptimization approach, and access increases for thepopulation around Jefferson City, since their congestionis decreasing due to the new facility. We performed apairwise T-test comparing the impact of intervention onboth measures for each of the 479 counties that had achange under the intervention. The test shows that theE2SFCA measure estimates a greater improvement fromthe intervention compared to the optimization measure,which is consistent with our discussion above.
Discussion and conclusionsThe optimization methods provide several innovationsuseful both for understanding access and designing
Fig. 5 Results comparing optimization model with E2SFCA and M2SFCA for CF care in US. (a) Decentralized model composite measure AE, and(b) E2SFCA-AE
Li et al. BMC Health Services Research (2015) 15:273 Page 9 of 13
interventions. They can be applied across heterogeneousnetworks with both dense and sparse areas, and theyallow user choice to balance travel and congestionwithin communities. The approach presented includes away to select the specific parameters of a model.Optimization models also provide both a picture of thestatus quo and an approach for evaluating a potentialchange to a network. Fundamentally, the optimizationmodels have a different framework than many catch-ment methods, since they estimate the access costs asso-ciated with a patient’s experience (albeit the potentialexperience rather than actual utilization).Under optimization models, the presence of additional
opportunities only provides gains in potential accesswhen they provide better access compared to existingopportunities, while in the 2SFCA methods, additionalopportunities always provides gains in potential access.This difference shows that many 2SFCA methods overcount visits when there are facilities with overlappingcatchment zones. This effect is stronger in areas withthe greatest infrastructure of health services, so inter-preting accessibility over a network with sparse anddense areas may not be reasonable. One could adapt theapproach by dividing the population by the number offacilities in the zone, or use other adaptations as in the
assignment mechanism of the 3SFCA approach. How-ever, these adaptations do not address other issues, suchas the cascading effects across the system. The catch-ment methods tend to capture effects in a defined area,but they do not capture the interactions between areas(or the cascading effects over a network if there arechanges introduced) as well as assignment models do.This also means catchment methods may misestimateavailability across a network for complicated networks.Using optimization models for estimating access has
many other advantages, as they can be easily adapted tomeasure access for different types of patients, over dif-ferent provider types, or with capacity constraints in thenetwork. Moreover, decentralized optimization modelsallow differences in access in rural and urban areas,which arises directly from the trade-off between distanceand congestion rather than solely from different distancefunctions. It is also easy to modify optimization modelsto determine the best locations for facilities given anexisting demand and supply network [11, 12]. The indi-vidual measures from optimization models show notonly where to intervene, but also points to what kind ofintervention is needed (e.g., new location to reduce dis-tance versus more capacity to reduce congestion). Thisis especially true as one moves beyond just one measure
Fig. 6 Estimated patient visits in E2SFCA and M2SFCA relative to the visits needed in each county. A value greater than 1 indicates that the2SFCA methods estimate more visits than needed
Li et al. BMC Health Services Research (2015) 15:273 Page 10 of 13
of access like spatial accessibility to consider the otherdimensions of access [1].This study focus on estimating potential health access
using optimization models. There are limitations withthe approach. The optimization models assume thatpatients are trading off travel distance and congestionrationally across a network, while in reality there mightbe many other factors considered by patients. Inaddition, the optimization models are built using deter-ministic known data. In the case study, the possibility ofusing satellite clinics or services provided through
telemedicine are not considered. Results are alsodependent on the specific decay function and parameterchosen [27]. Furthermore, the case study also assumesthat the transportation modes used by all patients arethe same.Optimization models come at a cost. They are less fa-
miliar to many working in public health or public policy.They can be complex to model or compute, althoughthis may be a matter more of the appropriate trainingthan extensive computing power. Sample code and in-structions for building the optimization models in this
Fig. 7 Optimization results showing impact of intervention near locations Springfield, MO, Columbus, OH, and Pittsburgh, PA. (a) Access gainunder optimization using composite measure AE, and (b) access gain under E2SFCA
Li et al. BMC Health Services Research (2015) 15:273 Page 11 of 13
paper are provided for use without a license in Additionalfile 4 (see Additional file 3 for the software package). Itmay be most important to use optimization models whena network has facilities with overlapping zones, when onewants to capture the nuances of access across populations,or when one needs to develop interventions to improveaccess. We hope that the use of optimization models willprovoke more discussion in how to measure access, andultimately how to improve access, especially in light of theincrease in computing power and big data that will becoming online in the US health system.
Availability of supporting dataThe data sets supporting the results of this article areincluded within the article and its additional files (seeAdditional file 6).
Additional files
Additional file 1: Appendix file that provides detailed supplementaryarguments and analysis of the methods and data in the article. The filealso contains a histogram of distances traveled by CF patients compared toestimated distances by the model.
Additional file 2: Computer codes used to implement theoptimization method in this article.
Additional file 3: The free AMPL package that researchers can useto implement optimization models to measure access described inthis article. We provide example codes and instructions to use theAMPL package for researchers who want to implement optimizationmodels to measure access.
Additional file 4: Contains example codes and instructions toimplement optimization models in AMPL and to utilize the freeonline NEOS solver to solve the optimization models.
Additional file 5: Contains population information to calculate theincidence rate by race/ethnicity who are above or below 2 timesthe federal poverty level.
Additional file 6: Provides Cystic Fibrosis care center locations andsimulated patient locations and demands that this article used tocarry out the case study.
Abbreviations2SFCA: Two-step floating catchment area; E2SFCA: Enhanced two-stepfloating catchment area; M2SFCA: Modified two-step floating catchmentarea; CF: Cystic fibrosis.
Competing interestsThe authors declare that they have no competing interests.
Authors’ contributionsZL participated in the design of the study, implemented the computationalmodel and data analysis, and drafted the manuscript. NS and JLS carried outthe study design and coordination and participated in data analysis. Allauthors contributed to interpretation of findings, preparing the manuscript,read and approved the final manuscript.
Authors’ informationZihao Li is an Operations Research Ph.D. student in the School of Industrialand System Engineering (ISyE) at Georgia Institute of Technology (GT).Dr. Nicoleta Serban is the Coca-Cola Associate Professor in the School of ISyEat GT. She received her B.S. in Mathematics and an M.S. in Theoretical Statisticsand Stochastic Processes from the University of Bucharest. She went on to earnher Ph.D. in Statistics at Carnegie Mellon University. In 2010, she was grantedthe NSF CAREER award for research in service equity and access. Her research
record is quite diverse, from mathematical statistics to modeling to data analysisto qualitative insights on causality and complexity. Dr. Serban’s researchinterests on Health Analytics span various dimensions including large-scaledata representation with a focus on processing patient-level health informationinto data features dictated by various considerations, such as data-generationprocess and data sparsity; machine learning and statistical modeling to acquireknowledge from a compilation of health-related datasets with a focus ongeographic and temporal variations; and integration of statistical estimatesinto informed decision making in healthcare delivery and into managing thecomplexity of the healthcare system.Dr. Julie Swann is the Harold R. and Mary Anne Nash Professor in the Schoolof ISyE at GT. She is also a co-founder and co-director of the Health andHumanitarian Systems Center at GT. She received her B.S. inIndustrial Engineering from GT in 1996 and her Ph.D. in Industrial Engineeringand Management Sciences from Northwestern in 2001. In 2009–2010 she wason loan to the Centers for Disease Control and Prevention (CDC) as a SeniorScience Advisor for the H1N1 pandemic response to advise and evaluate thelogistics of vaccine and medical countermeasures distribution to protect theAmerican public. Her research specializes in supply chain management(especially humanitarian networks) and health systems. Her researchmethods have focused on integrating optimization models with economicconcepts related to decentralized agents and on collaborating with otherdisciplines to solve problems in health policy. Dr. Swann was awarded the NSFcareer award in 2004 and 2014.
AcknowledgmentsThe authors thank Michael S. Schechter for providing knowledge of thecurrent health network of the disease and the Cystic Fibrosis Foundation forproviding the location of care centers. The study was supported by theNational Science Foundation Grant CMMI-0954283 and a seed grant awardedby the Healthcare System Institute and Children’s Healthcare of Atlanta.Dr. Swann was also supported by the Harold R. and Mary Anne Nash JuniorFaculty Endowment Fund.
Received: 21 August 2014 Accepted: 10 June 2015
References1. Penchansky R, Thomas JW. The concept of access: definition and
relationship to consumer satisfaction. Med Care. 1981;19(2):127–40.2. Khan AA. An integrated approach to measuring potential spatial access to
healthcare services. Socio Econ Plan Sci. 1992;26(4):275–87.3. Khan AA, Bhardwaj SM. Access to healthcare - a conceptual framework and
its relevance to healthcare planning. Eval Health Prof. 1994;17(1):60–76.4. Beck JR. Optimized resource-allocation in medicine using network flows.
Med Decis Mak. 1984;4(4):532.5. da Silva MEM, Santos ER, Borenstein D. Implementing regulation policy in
Brazilian Health Care Regulation Centers. Med Decis Mak. 2010;30(3):366–79.6. Parkan C, Hollands L. The use of efficiency linear programs for sensitivity
analysis in medical decision-making. Med Decis Mak. 1990;10(2):116–25.7. Luo W, Wang FH. Measures of spatial accessibility to health care in a GIS
environment: synthesis and a case study in the Chicago region. EnvironPlann B-Plann Des. 2003;30(6):865–84.
8. Luo W, Qi Y. An enhanced two-step floating catchment area (E2SFCA)method for measuring spatial accessibility to primary care physicians. HealthPlace. 2009;15(4):1100–7.
9. Delamater PL. Spatial accessibility in suboptimally configured health caresystems: A modified two-step floating catchment area (M2SFCA) metric.Health Place. 2013;24:30–43.
10. Wan N, Zou B, Sternberg T. A three-step floating catchment area methodfor analyzing spatial access to health services. Int J Geogr Inf Sci.2012;26(6):1073–89.
11. Griffin PM, Scherrer CR, Swann JL. Optimization of community health centerlocations and service offerings with statistical need estimation. IIE Trans.2008;40(9):880–92.
12. Daskin MS, Dean LK. Location of Health Care Facilities. In: Sainfort MB F,Pierskalla W, editors. Handbook of OR/MS in Health Care: A Handbook ofMethods and Applications. 2004. p. 43–76.
13. Schweikhart SB, Smithdaniels VL. Location and service mix decisions for amanaged health-care network. Socio Econ Plan Sci. 1993;27(4):289–302.
Li et al. BMC Health Services Research (2015) 15:273 Page 12 of 13
14. Alejo JS, Martin MG, Ortega-Mier M, Garcia-Sanchez A. Mixed integerprogramming model for optimizing the layout of an ICU vehicle. BMCHealth Serv Res. 2009;9:224.
15. Begur SV, Miller DM, Weaver JR. An integrated spatial DSS for schedulingand routing home-health-care nurses. Interfaces. 1997;27(4):35–48.
16. Deo S, Iravani S, Jiang TT, Smilowitz K, Samuelson S. Improving healthoutcomes through better capacity allocation in a community-based chroniccare model. Oper Res. 2013;61(6):1277–94.
17. Rosenhead J. Community-based operations research: decision modeling forlocal impact and diverse populations. Interfaces. 2013;43(6):609–10.
18. Ekici A, Keskinocak P, Swann JL. Pandemic influenza response: fooddistribution logistics. Manuf Serv Oper Manage. 2014;16(1):11–27.
19. Enns EA, Mounzer JJ, Brandeau ML. Optimal link removal for epidemicmitigation: a two-way partitioning approach. Math Biosci. 2012;235(2):138–47.
20. Xiong W, Hupert N, Hollingsworth EB, O’Brien ME, Fast J, Rodriguez WR. Canmodeling of HIV treatment processes improve outcomes? Capitalizing onan operations research approach to the global pandemic. BMC Health ServRes. 2008;8:166.
21. Wang FH. Measurement, optimization, and impact of health careaccessibility: a methodological review. Ann Assoc Am Geogr.2012;102(5):1104–12.
22. Ahmed A, Fincham JE. Physician office vs retail clinic: patient preferences incare seeking for minor illnesses. Ann Fam Med. 2010;8(2):117–23.
23. Kontogiannis S, Spirakis P. Atomic selfish routing in networks: A survey. In:Deng X, Ye Y, editors. Internet and Network Economics, Proceedings, vol.3828. Berlin: Springer-Verlag Berlin; 2005. p. 989–1002.
24. Heier Stamm J. Design and Analysis of Humanitarian and Public HealthLogistics Systems, Ph.D. Dissertation. Atlanta, GA: PhD thesis available fromGeorgia Institute of Technology; 2010.
25. McGrail MR, Humphreys JS. A new index of access to primary care servicesin rural areas. Aust N Z J Public Health. 2009;33(5):418–23.
26. Ngui A, Apparicio P. Optimizing the two-step floating catchment areamethod for measuring spatial accessibility to medical clinics in Montreal.BMC Health Serv Res. 2011;11:166.
27. Wan N, Zhan FB, Zou B, Chow E. A relative spatial access assessmentapproach for analyzing potential spatial access to colorectal cancer servicesin Texas. Appl Geogr. 2012;32(2):291–9.
28. Mao L, Nekorchuk D. Measuring spatial accessibility to healthcare forpopulations with multiple transportation modes. Health Place.2013;24:115–22.
29. Schechter MS, Margolis PA. Relationship between socioeconomic status anddisease severity in cystic fibrosis. J Pediatr. 1998;132(2):260–4.
30. Knapp E. Cystic Fibrosis Foundation Patient Registry (1986–2010). In: CysticFibrosis Foundation. 2012.
31. Ratio of Income to Poverty Level (C17002). In., 2012 edn. http://factfinder2.census.gov/: U.S. Census Bureau; 2010.
32. Radical Tools 5. In., 5 edn. http://www.radicallogistics.com/: Radical Logistics;2011.
Submit your next manuscript to BioMed Centraland take full advantage of:
• Convenient online submission
• Thorough peer review
• No space constraints or color figure charges
• Immediate publication on acceptance
• Inclusion in PubMed, CAS, Scopus and Google Scholar
• Research which is freely available for redistribution
Submit your manuscript at www.biomedcentral.com/submit
Li et al. BMC Health Services Research (2015) 15:273 Page 13 of 13