Embed Size (px)
Citation preview

International Journal of Applied Engineering Research ISSN 0973-4562 Volume 12, Number 20 (2017) pp. 10284-10297
© Research India Publications. http://www.ripublication.com
10284
An Investigation on Harmonic Problems for N-1 Contingency in Industrial
Distribution and Its Mitigation Using Fuzzy Controlled Hybrid Filter
Solomon Mesfun Ghulbet
Pan African University, Institute for Basic Science, Technology and Innovation, PObox62000-00200, Nairobi, Kenya.
ORCID iD : 0000-0002-0647-3840
Prof P.K.Hinga
School of Engineering, Jomo Kenyatta University of Agriculture and Technology, PO box 62000-00200, Nairobi, Kenya.
Prof. J. N. Nderu
School of Engineering,Jomo Kenyatta University of Agriculture and Technology, PO box 62000-00200,Nairobi,Kenya.
Abstract
The electric distribution structure of modern industries is
rapidly changing and becomes complex and complex as a result
of increase in demand and market competition. Effective
nonlinear electronic device were introduced recently to
increase productivity and efficiency. However, installing
devices such as; programmable logic controllers (PLCs),
adjustable-speed drives (ASDs), energy efficient motors and
other power electronic devices are creating a power quality
related problem namely harmonic distortion. Harmonic means
the multiple of fundamental frequencies resulting in excessive
current flow on lines due to power electronic devices, short
circuits and other contingency effect. This has a great threat for
industrial consumers, results in equipment damages, poor
power factor and excessive neutral currents. Considering the
economic consequence of harmonic problems due to damaging
of electric equipment and increase of electric bill due to poor
power factor in Industries, this research paper presents
modelling of an industrial distribution named Coca-Cola Share
Company using Matlab Simulink for an investigation of
harmonic distortion level. Then harmonic distortion level at
both PCC and IPC were computed for normal operating
conditions as well as for N-1 contingency cases. The result
were compared with the IEEE 519-2 and IEC 61000-2-4 for
class 2 standards and found don’t comply with the standards. A
fuzzy logic hybrid filter were designed to reduce the harmonic
distortion level that satisfies the standards.
Keywords: Total harmonic distortion (THD), Point of
common coupling (PCC), In plant point of coupling (IPC),
Variable Frequency Drive (VFD), Generalized Fryze Current
Control Strategy
INTRODUCTION
The modern industries are constantly exposed of power quality
related problems results in an unscheduled plant shutdown [1].
Power quality is a kind of disturbance or interruptions in
electric supply caused by a power system equipment. For
instance, transients, voltage sags or swells, electrical noise
,harmonic distortion, voltage notching and flickering lights are
some of power quality related disturbances [2]. From all those
power quality related disturbances, harmonic distortion is
critical as it represents the steady state problem. It is always
available as long as the harmonic producing equipment is there
[3]. Moreover, during switching on of large industrial loads
there is maximum fluctuation of current which results in
harmonics.
Non-linear load devices create harmonics when they convert
AC to DC, DC to DC, DC to AC, and AC to AC.Now a days
,these converters are widely used in the modern industrial
equipment’s such as programmable logic controllers (PLCs),
adjustable-speed drives (ASDs), energy efficient motors and
other electronic devices to improve productivity and efficiency.
Hence, These Nonlinear loads are the main contributors of
harmonic distortion and producing great destruction in
industrial companies worldwide[4].
The distorted current produced by the nonlinear loads
propagate through all the impedance between the load and
power source. It causes voltage drops for each harmonic
frequency based on ohms law and thereby producing total
voltage distortion at the point of common coupling (PCC) due
to the vector sum of the individual voltage drops. This
distortion is quantified by Total Harmonic Distortion (THD)
which is a function of the impedance between the power source
and the load [5]. If any change happens in the impedance due
to any sort of fault in the distribution system such as pure wiring

International Journal of Applied Engineering Research ISSN 0973-4562 Volume 12, Number 20 (2017) pp. 10284-10297
© Research India Publications. http://www.ripublication.com
10285
practice, geographical or weather conditions, and effect of
neighboring customers, it thus affects the THD [3]. In general
the THD at the PCC depends up on load, type of load,
Configuration (resonances depending on capacitive or
inductive character of the elements in the network),network
impedance and the fault level [6] [7] [8][9].
Understanding the economic impact of harmonic distortion in
industry, various researchers have made a contribution in an
investigation and mitigation of harmonic problems based on
hybrid filter using different control strategies
[10][11][12][13][14][15].However, As per the report of various
researchers, majority of the work done on the design of power
filter is based on fixed load conditions, or for small range of
load variations. But in practical life a part from small load
variation due to the activities of customers, power system
distribution is exposed to various types of faults. Hence, it
changes the loads greatly. Consequently, it exacerbates the
harmonic distortion level. Moreover, many researchers as
referred [16][17] have used power quality analyzers to quantify
the harmonic distortion level at different buses and designed
suitable filters accordingly. These methods are costly and time-
consuming as they need to take harmonic measurements
systematically. They only consider the circumstances in which
they were taken, therefore can’t be assured to reflect the worst
possible operating conditions of a system. Measurements can
also be inaccurate due to measuring errors or flawed use of
instruments[18].Therefore, there is a need of developing a
model which gives relative flexibility to investigate Harmonic
distortion at PCC considering various operating conditions of
the plant and designing a fuzzy logic controlled hybrid filter
that can maintain the THD well with in IEEE standards taking
contingency under consideration, so that it can effectively
mitigate the harmonic levels even in the worst case operation
of the plant. Therefore, this study focuses on an investigation
of harmonic distortion at both PCC and IPC of an industry
named Coca cola Share Company in Eritrea for N-1
contingency and Designing of a fuzzy logic controlled hybrid
filter.
DEVELOPING THE MODEL OF THE INDUSTRIAL
DISTRIBUTION
The utility or substation
The data needed is the line to line voltage (VLL), short-circuit
MVA (SC MVA), and X/R. Obtaining the voltage is simple
enough. SC MVA is the power available at a bolted three phase
fault. Bolted means all three phases connected together with no
added impedance. X/R is the ratio of reactance to resistance in
the supply. SC MVA and X/R may need to be derived from
other data [19].
,**3 LLSC VISCMVA (1)
Where Isc is expressed in KA and VLL –in KV
)tan(cos/ 1 PFRX (2)
Transformer modelling
Transformers are specified by output voltage (V), KVA rating,
percent impedance (%Z), and X/R ratio. All this information
apart X/R, is usually available on the transformer nameplate. If
the X/R is not specified 4.9 can be used for calculations.
Therefore the impedance(Z) can be calculated from V,KVA,
and %Z [20].
000100
2
,kVAVZ=Z
Or
VAVZ=Z
2
100 (3)
Transformer impedance
Z%=4% S=630KVA Secondary voltage =Vs=400v
f=50hz
Since
01.004.0*10*630
400%*
3
22
222
ZSKVAVZ
XRZ
s
ttt
(4)
Assuming 9.4t
t
RX
Therefore 310*12.4tR and 02.0tX
then
7.6350**2
02.0
50**2
tt
XL
The transformer data for modeling is
310*12.4tR 02.0tX
7.63tL
Computing of the transmission line parameters
The transmission line extends 3728 meters from the substation
to the factory transformer.it is 95mm2 aluminum type
conductor.
The resistance of the cable can be calculated as follows
The resistivity of aluminum is m 810*65.2
04.195
37281065.2 8
ALRC (5)
Similarly the inductance can be calculated
)]2/(4/1)/4log(303.2[2 lddllL Or
nHrLLL ]75.0)/2[ln(2 (6)
In the above equation, L is the inductance in nH (10-9
henry), l is the length and d is the diameter of the wire/rod
(both in cm). µ is the permeability of the material (=1.0,
except for iron and other ferromagnetic materials) [21].

International Journal of Applied Engineering Research ISSN 0973-4562 Volume 12, Number 20 (2017) pp. 10284-10297
© Research India Publications. http://www.ripublication.com
10286
Therefore L=9969188 nH the inductive reactance would be
13.3009969.0*50**2***2 LfX L (7)
Modeling of loads
VFD modeling
A Variable Frequency Drive (VFD) is a type of motor
controller that drives an electric motor by varying the frequency
and voltage supplied to the electric motor. Hence, the VFD
consists of three major components; the first is the front end,
which is usually a 6 or 12 pulse rectifier. The second is the
inverter stage that converts the generated DC voltage to
controllable frequency AC voltage to control the speed of the
motor. The last stage is the DC link (shunt capacitor) that
couples the two main stages and help in reducing the ripples of
the DC voltage in case of VSI and PWM topologies. The DC
link capacitor in case of VSI can block the propagation of the
harmonics generated from the inverter side from entering the
AC system. This conclusion calls for a simple representation of
the converter and the motor collectively by a DC current source
instead of a harmonic current source. The most common
rectifier circuit in three-phase PWM drives, 6-pulse VFD uses
six-pulse diode rectifier. A 6-pulse rectifier is the most robust
and cost effective solution in the VFD industry as of today,
even though input current contains some amount of low order
harmonics. The capacitor and resistor depends up on the active
power of the inverter. It can be modelled as shown in the fig1
[22][23][24][25][26].
Since the capacitive reactance affects the THD [27]
As a general rule ,%12,1 CRSR
,%6,2 CRSR %4,3 CRSR (8)
Assuming the lowest distortion
The capacitance value would be
%4,3 CRSR (9)
The general formula is
)(2 SR
Tx Rf
QC
, where 1< TQ <3 (10)
out
inSR P
VR 2)( (11)
Therefore for VFD motor having power rating of 15KW the
capacitance value would be
067.915000
85.0*4002
SRR Thus the capacitance value
would be mFCx 053.107.9*50**2
3
Therefore it can be modelled as shown in the fig.1
Figure 1: Six pulse variable frequency drive (VFD)
Figure 2: Switch mode power supplies (SMPS)

International Journal of Applied Engineering Research ISSN 0973-4562 Volume 12, Number 20 (2017) pp. 10284-10297
© Research India Publications. http://www.ripublication.com
10287
Similarly all the VFD available in the industry can modelled
likewise.
Switched-Mode Power Supplies.
These power supplies are the "front-end" of single-phase 120V
loads such as PCs and home entertainment equipment.
Typically, they have a full-wave diode rectifier connected
between the AC supply system and a capacitor, and the
capacitor serves as a low-ripple “battery” for the DC load.
Unfortunately, low ripple means that the AC system charges
the capacitor for only a fraction of each half-cycle, yielding an
AC waveform that is highly peaked[28]
The capacitor and resistor can found out using the following
formulas[29].
rated
dc
PV
R2
Where dcV the instantaneous value of the DC is
link voltage and ratedP is the rated power of the modelled
SMPS device.
Similarly the capacitor value can computed as shown below
1**22
1
RCfRf
r
[30]
(12)
Where Rf the ripple is factor and rf is the ripple frequency
Therefore the Switch mode power supplies (SMPS) can be
modelled as shown below
Model of the whole industrial network for harmonic study
The normal induction motors are modelled as a constant RL
load being assumed as linear passive loads, because an
Induction motor is basically a large inductor in which the
current doesn’t change very fast as per the inductive
property[31] [32]. The induction motor of each department are
lumped, whereas the VFD motors are preferred not to be
lumped, because the harmonics generated by each VFD drives
has canceling property that reduces the overall harmonic
distortion at the PCC. Hence, considering the above stated
cases the overall model of the plant with both active and passive
filter is as shown below
Figure 3: Model of the industrial network (SMPS)

International Journal of Applied Engineering Research ISSN 0973-4562 Volume 12, Number 20 (2017) pp. 10284-10297
© Research India Publications. http://www.ripublication.com
10288
Proposed control algorism
The control algorism used in this research is generalized
fryze current control strategy .This strategy is concise and
requires less computational efforts, since it deals directly
with the abc phase voltages and line currents. The
elimination of the clark transformation makes this control
strategy simple [33]
The hybrid filter generates appropriate compensating
currents based on the load currents, DC bus voltage and
peak voltage of AC source (Vsm).
The instantaneous voltages of AC source can be
represented as in equation below.
)240sin()(
)120sin()(
)sin()(
wtVtVwtVtVwtVtV
smsc
smsb
smsa
(13)
The ultimate role of the proposed hybrid filter is to
eliminate harmonics and compensate the current unbalance
and reactive power of the load. After compensation, the AC
source feeds the fundamental active power component of
load current and loss of inverter for regulating the DC
capacitor voltage. Hence the peak of source reference
current smI has two components .The first part derived
from the average load active power and the second
component is derived from the DC capacitor voltage
regulator [33].
The instantaneous power is given by
)()()(1
titvtpm
kkk
(14)
By definition the active power DCP equals the average
value (DC components) over one period T of the
instantaneous power )(tp .
DCP = T
dttpT 0
)(1
= T
dttitvT 0
)()(1
=
COSIV RMSRMS (15)
This average power can be obtained by passing the )(tp
through the low pass filter or moving average filter.
Considering the unity power factor the average active
power of the of the AC source can be represented as below
DCsmpsms PIVP 2/3 (16)
Where smV is the maximum amplitude voltage source and
can be calculated at sampling frequency fs from the source
phase voltages saV , sbV , scV , at each sampling instant, it
can be expressed as shown below
2223/2 scsbsasm VVVV , (17)
From this equation the first part of AC side current can be
derived
)/(*3/2 smDCsmp VPI (18)
The second component of AC current source is obtained
from DC link capacitor
The reference stored energy on the DC link capacitor is
given by
2
2
1dcndcn CVE (19)
Where dcnV is the reference or nominal voltage across the
capacitor C.
When the capacitor is charged with a dcV voltage the
energy unbalance in the DC link capacitor is [34]
22
2
1dcdcndc VVCE (20)
This energy unbalance must be supplied by the AC source.
Imposing a sinusoidal input current, the change in the
capacitor energy must satisfy
T
issmdssmdc dtitinIitVE
0
2
0 3
2
3
2sin (21)
The smdI is the active current supplied to the DC link
capacitor.
So the reference current to maintain the DC voltage is given
by
sm
dcdcn
sm
dcsmd TV
VVCTV
EI33
222
(22)
The desired peak current of AC source is then obtained
using the equation below.
smdsmpsm III (23)
The AC source current must be sinusoidal and in-phase
with source voltages. Therefore the desired currents of AC
source can be calculated by multiplying peak source current
with unity sinusoidal signal and these unity signals.
Therefore the desired or reference source current can be
obtained by the using equations below.
)*_
mag
asmaref V
VII

International Journal of Applied Engineering Research ISSN 0973-4562 Volume 12, Number 20 (2017) pp. 10284-10297
© Research India Publications. http://www.ripublication.com
10289
)*_
mag
bsmbref V
VII (24)
)*_
mag
csmcref V
VII
Finally, the reference currents of the hybrid filter can be
obtained by subtracting the reference source current from
load current as shown below.
areflaca IIi _
breflbcb IIi _ (25)
creflccc IIi _
These reference currents cai , cbi , cci will be fed to the
switching circuit of carrier-less hysteresis controller for
producing the necessary PWM pulse to the voltage source
inverter. So the voltage source inverter with the closed loop
system acts as a controlled current source and produces the
exact reference waveform at the output. This output of the
shunt active filter compensates the line harmonics and the
line current becomes sinusoidal.
Design of DC link capacitor and AC link inductor
The selection of DC link capacitor and AC link inductor
affects the performance of the active filter. Therefore they
have to be properly selected to get best result.
AC link inductor
The standard inductor differential equation is given by
flterLV
dtdi
(26)
The maximum possible inductance should be used to
achieve the lowest average switching frequency
Therefore the maximum value of the inductor can be
obtained using the equation below
dtdi
VL filter
max
(27)
The maximum dtdi
of the actual compensating current has
to be determined for each harmonic component based on its
amplitude and frequency. Hence the maximum value of the
inductor to be considered is as shown below
n
linedc
filter In
VV
L**
22
(28)
Where f**2 ( f is the fundamental frequency
and nI is the current of nth harmonic order.
The inductor should allow the flow of compensating
current which includes the harmonic components of load
current simultaneously it should block the high frequency
signals generated by the switching inverter to the
supply[35].
Table below shows the amplitude of each harmonic in the
FFT of load current. Neglecting Tripelen and third
harmonics up to 19th order are considered for inductor
design.
Table 1
Order of
harmonics
Amplitude
5th 0.013
7th 0.0033
11th 0.0029
13th 0.0012
17th 0.0011
19th 0.0003
Other Important parameters for the design are
AIL 7.438 and VVline 400
7.565400*2*2 linedc VV , Therefore dcV can be considered 600
mHI L 4.6
7.438*0003.0*50*2*197.438*0011.0*50*2*177.438*0012.0*50*2*13
7.438*0029.0*50*2*117.438*0033.0*50*2*77.438*013.0*50*2*5
2
400
2
600

International Journal of Applied Engineering Research ISSN 0973-4562 Volume 12, Number 20 (2017) pp. 10284-10297
© Research India Publications. http://www.ripublication.com
10290
Design of DC link capacitor
2
2
1
*
dcV
TPC ; Where IVP line *2
(29)
Therefore the capacitor value would be
2
3
2
1
10*40*124083
dcVC
=27574µF
Design of the passive filter
The capacitive reactance needed to improve from power
factor with θ1 to power factor with θ2 is defined by
VARs= P (tan θ2– tan θ1) (30)
Where
P= (V) (I) cos θ2 (31)
The capacitive reactance would be calculated using the
equation below
VARsVX C
2
(32)
The capacitor value will be [36]
2
2
2
1
nn
wVQC C
(33)
Similarly the inductance formula is
cwhL
2
1
2
1 , and
f
L
QXR where the fQ is the quality
factor (34)
Using the above formulas the computed parameters of the
passive filter are as shown below
Table 2
Filter type R(mΩ) L(µH) C(mF)
5th single tuned 41 4.88 83
7th single tuned 55.8 4.06 50.9
11th single tuned 52.5 2.43 34.4
13th single tuned 89.3 3.5 17.2
Design of fuzzy logic based DC Voltage control
sm
dcdcnsmd TV
VVCI3
22 (35)
From the equation (35) the block diagram of the control
system is
Figure 4. Design of the control system
Where the output of the controller is 2222 600 dcdcdcn VVVedc (36)
\

International Journal of Applied Engineering Research ISSN 0973-4562 Volume 12, Number 20 (2017) pp. 10284-10297
© Research India Publications. http://www.ripublication.com
10291
The input member function are
Figure 5: Input Error membership function
Figure 6: Input change of Error membership function
Similarly the output membership function is
Figure 7: Output membership function

International Journal of Applied Engineering Research ISSN 0973-4562 Volume 12, Number 20 (2017) pp. 10284-10297
© Research India Publications. http://www.ripublication.com
10292
The rule is constructed based on concept shown in the graph below
Figure 8: Concept of generating rule base
The Rule base for this controller is
Table 3
e NB NM NS Z PS PM PB
Δe
NB NVB NVB NVB NB NM NS Z
NM NVB NVB NB NM NS Z PS
NS NVB NB NM NS Z PS PM
Z NB NM NS Z PS PM PB
PS NM NS Z PS PM PB PVB
PM NS Z PS PM PB PVB PVB
PB Z PS PM PB PVB PVB PVB
SIMULATION RESULTS
Considering all the loads are working and loaded 100%, the
measured THDV and THDI at point both PCC and IPC
before compensation is

International Journal of Applied Engineering Research ISSN 0973-4562 Volume 12, Number 20 (2017) pp. 10284-10297
© Research India Publications. http://www.ripublication.com
10293
Figure 9: Voltage distortion at the PCC before compensation
Figure 10: Current distortion at the PCC before compensation
Table 4
Point THDV (%) THDI (%)
PCC 14.87 4.75
IPC 14.60 5.59
The THDV at the IPC is above the limit as per defined by the
IEC 61000-2-4 for class 2 [37]
Since tedIPC_PermitIPC THDVTHDV
14.60% 8%
Therefore a filter has to be designed to reduce the harmonic
distortion level to the limit. Similarly we have to calculate the
short circuit ratio at the PCC of the primary side of the
transformer to determine whether the voltage and harmonic
distortion level at the PCC are within the limit as per defined
by IEEE 519-2[38].
International Journal of Applied Engineering Research ISSN 0973-4562 Volume 12, Number 20 (2017) pp. 10284-10297
© Research India Publications. http://www.ripublication.com
10294
Computing the short-circuit ratio
L
sc
II
scI can be calculated from the utility information based on
this formula
3
1000
LL
scsc V
KVAI = A2309403*15000
1000*6000000
(37)
Whereas LI can be computed using this formula
* 3 *L
KwIPF kV
(38)
Where PF is the power factor and KW is the average power
demand that can be found out from the billing information of
over the recent 12 months [39]
Average power demand =KW=
kwh consumed in the period
hours in the period
(39)
Assuming the maximum power consumption 70500KWH
during the month of December
This month has 31 days therefore
The average power KWKWHKW 76.9431*24
70500
therefore 97.170400*3*8.0
76.94
KWIL
Therefore 76.135097.170
230940
L
sc
II
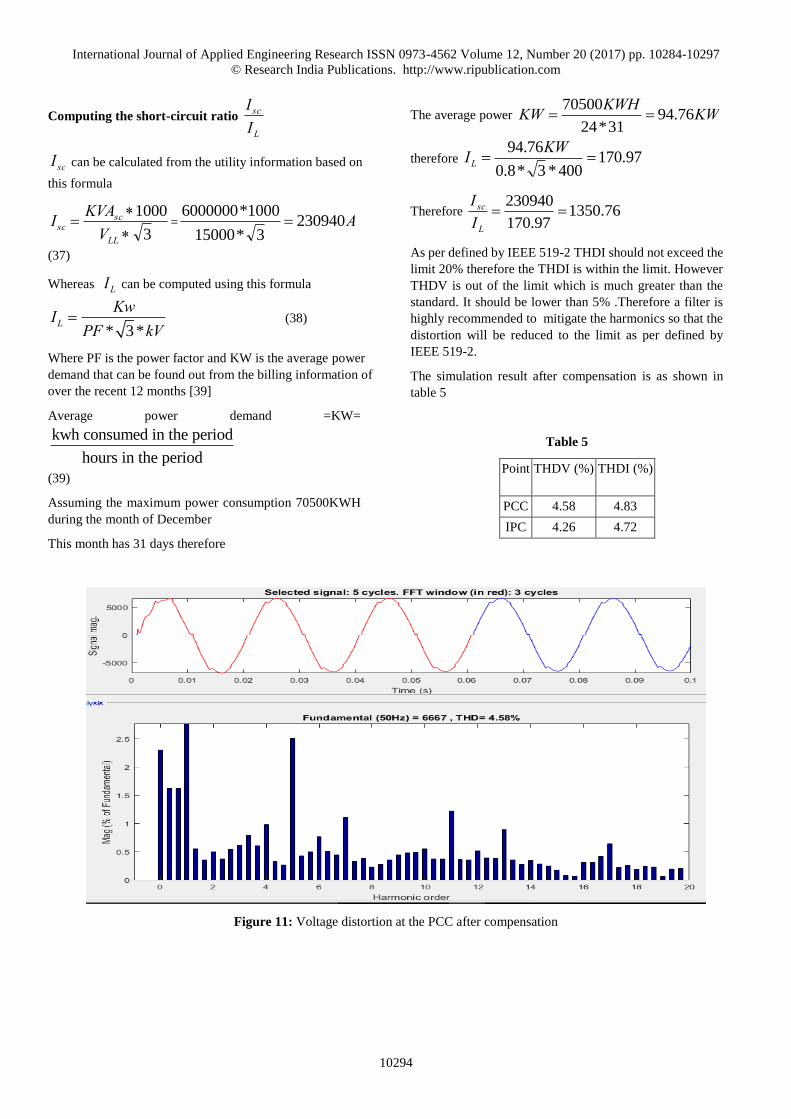
As per defined by IEEE 519-2 THDI should not exceed the
limit 20% therefore the THDI is within the limit. However
THDV is out of the limit which is much greater than the
standard. It should be lower than 5% .Therefore a filter is
highly recommended to mitigate the harmonics so that the
distortion will be reduced to the limit as per defined by
IEEE 519-2.
The simulation result after compensation is as shown in
table 5
Table 5
Point THDV (%) THDI (%)
PCC 4.58 4.83
IPC 4.26 4.72
Figure 11: Voltage distortion at the PCC after compensation

International Journal of Applied Engineering Research ISSN 0973-4562 Volume 12, Number 20 (2017) pp. 10284-10297
© Research India Publications. http://www.ripublication.com
10295
Figure 12: Current distortion at the PCC after compensation
The simulation result considering contingency that is loss of loads in one whole department.
Table 6
Point THDV (%) THDI (%)
PCC 4.47 5.91
IPC 4.42 5.62
Figure 13: Voltage distortion at the PCC after compensation with a loss of single load

International Journal of Applied Engineering Research ISSN 0973-4562 Volume 12, Number 20 (2017) pp. 10284-10297
© Research India Publications. http://www.ripublication.com
10296
Figure 14: Current distortion at the PCC after compensation with a loss of single load
CONCLUSION
An industrial electrical distribution is modelled for
harmonic study using mat lab Simulink. The harmonic
distortion level at both PCC and IPC were measured for
normal operating conditions and considering N-1
contingency i.e. single case loss of load in a particular
department. In all these cases the harmonic distortion level
does not meet the harmonic distortion as per the IEEE 519-
2 and IEC 61000-2-4 for class 2 standards. To reduce the
harmonic distortion level to the level that satisfies the stated
standards a fuzzy logic based hybrid filter were designed
using the concept of generalized fryze current control
strategy. The designed filter were able to mitigate the
harmonic distortion level regardless of the operating
conditions of the industry i.e. loss of load or disconnecting
any department.
REFERENCE
[1] S. Khalid and B. Dwivedi, “Power quality issues,
problems, standards and their effects in industry with
corrective means,” Int. J. Adv. Eng. Technol., vol. 1,
no. 2, pp. 1–11, 2011.
[2] K. Olikara, “Power Quality Issues , Impacts , and
Mitigation for Industrial Customers,” 2015.
[3] B. G. P.Eng, C. E. Partners, A. Calgary, M. S. Rouse,
and P.Eng, POWER QUALITY Energy Effi ciency Guide. NY, 1999.
[4] C. E. Commission, “Power Quality Solutions for
Industrial Customers,” California, 2000.
[5] Nikunj Shah, “Harmonics in Power Systems,” 2013.
[6] P. Vukan and P. Jelica, “ALLOCATION OF
HARMONIC DISTORTION MARGINS,” 21st Int. Conf. Electr. Distrib., no. 69, pp. 1–4, 2011.
[7] I. U. Marcus, A. E. Nestor, and P. Clarkson, “The
Influence of the Network Impedance on the
Nonsinusoidal ( Harmonic ) Network Current and
Flicker Measurements,” IEEE Trans. Instrum. Meas., vol. 60, no. 7, pp. 2202–2210, 2011.
[8] R. Pragale, T. J. Dionise, S. Member, and D. D. Shipp,
“Harmonic Analysis and Multistage Filter Design for a
Large Bleach Production Facility,” IEEE Trans. Ind. Appl., vol. 47, no. 3, pp. 1201–1209, 2011.
[9] H. M. Transformers, “International Inc. 6805,” MIRUS International Inc., Ontario, Canada, pp. 7–17, Jun-
2003.
[10] Y. DJEGHADER and L. ZELLOUMA, “Using Hybrid
Power Filter To Mitigate Currents and Voltages
Harmonics in Three Phase System,” Acta Electrotech. Inform., vol. 15, no. 4, pp. 37–43, 2015.
[11] S. K. Jain, P. Agrawal, and H. O. Gupta, “Fuzzy logic
controlled shunt active power filter for power quality
improvement,” IEEE Proc. Electr. Power Appl., pp.
317–328, 2002.
[12] A. A. L. I. Sahito, S. M. Tunio, and A. N. Khizer,
“Voltage Harmonics Mitigation through Hybrid Active
Power Filer,” vol. 35, no. 1, pp. 101–110, 2016.
[13] A. Sharma and A. K. Upadhyay, “Harmonic Mitigation
Using Inverter Based Hybrid Shunt Active Power
Filter,” vol. 7, no. 8, pp. 787–798, 2014.
[14] K. Dewangan and P. C. Tapre, “Harmonic Reduction

International Journal of Applied Engineering Research ISSN 0973-4562 Volume 12, Number 20 (2017) pp. 10284-10297
© Research India Publications. http://www.ripublication.com
10297
by Using Shunt Hybrid Power Filter,” ISSN || Int. J. Comput. Eng. Res., vol. 4, no. 5, pp. 41–49, 2014.
[15] N. Tilwani and D. Sharma, “Series Hybrid Filter for
Harmonic Compensation in Three Phase System,” vol.
4, no. 5, pp. 266–272, 2015.
[16] C. M. Ndungu, J. N. Nderu, and L. Ngoo, “Analysis of
Harmonic order levels at Power Lines to Improve the
Power Quality,” Sustain. Res. Innov. Proceedings,2011 - journals.jkuat.ac.ke, 2011.
[17] G. Nicholson, V. J. Gosbell, and A. Parsotam,
“Analysis of harmonic distortion levels on a
distribution network,” 2007 Australas. Univ. Power Eng. Conf. AUPEC, pp. 1–7, 2007.
[18] V. Lackovic, Introduction to Harmonic Analysis, no.
877. NY: Continuing Education and Development, Inc.
9 Greyridge Farm Court Stony Point, NY 10980, 2010.
[19] S. C. Program, “Short-Circuit Calculations,” 2006.
[20] H. M. Umran, “PARAMETERS IDENTIFICATION
OF A 3 - PHASE LC FILTER USED FOR
VARIABLE FREQUENCY DRIVE,” Kufa J. Eng., vol. 6, no. 2, pp. 76–89, 2015.
[21] E. B. Rosa, “The self and mutual-inductances of linear
conductors,” Bulletin of the Bureau of Standards, vol.
4, no. 2. p. 301, 1908.
[22] ARMSTRONG, “6 Pulse Vs. 12 and 18 Pulse
Harmonics Effect Reduction,” White Pap., 2015.
[23] C. Venkatesh and D. Kumar, “Modelling of Nonlinear
Loads and Estimation of Harmonics in Industrial
Distribution System,” Natl. Power Syst., vol. 2, no.
December, pp. 592–597, 2008.
[24] W. Wichakool, A. T. Avestruz, R. W. Cox, and S. B.
Leeb, “Modeling and estimating current harmonics of
variable electronic loads,” IEEE Trans. Power Electron., vol. 24, no. 12, pp. 2803–2811, 2009.
[25] T. Hidaka, M. Ishida, T. Hori, and H. Fujita, “High-
Frequency Equivalent Circuit of an Induction Motor
Driven by a PWM Inverter,” vol. 119, no. 12, pp. 65–
76, 2001.
[26] L. Hu and R. E. Morrison, “AC side equivalent circuit-
based method for harmonic analysis of a converter
system,” IEE Proc. - Electr. Power Appl., vol. 146, no.
1, p. 103, 1999.
[27] C. W. M. T. Mclyman, TRANSFORMER AND INDUCTOR DESIGN HANDBOOK, Third Edit.
California,USA: Marcel Dekker, 2004.
[28] P. M. Grady and M. Grady, “Understanding Power
System Harmonics,” no. April, 2012.
[29] A. J. Collin, C. E. Cresswell, and S. ?? Djoki??,
“Harmonic cancellation of modern switch-mode power
supply load,” ICHQP 2010 - 14th Int. Conf. Harmon. Qual. Power, 2010.
[30] S. Pyakuryal and M. Matin, “Filter Design for AC to
DC Converter,” Int. Ref. J. Eng. Sci., vol. 2, no. 6, pp.
42–49, 2013.
[31] Task Force on Harmonics Modeling and Simulation,
“Modeling and simulation of the propagation of
harmonics in electric power networks. I. Concepts,
models, and simulation techniques,” IEEE Trans. Power Deliv., vol. 11, no. 1, pp. 452–465, 1996.
[32] R. A. Mequon, “Straight Talk About PWM AC Drive
Harmonic Problems and Solutions.”
[33] T. Manigandan, “Implementation of a Novel Control
Strategy Using Fuzzy Logic Controller to Shunt Active
Filter for Line Harmonic Reduction Department of
EEE , Kongu Engineering College , P . A College of
Engineering and Technology , Pollachi , Tamilnadu ,
India,” vol. 8, no. 5, pp. 737–746, 2012.
[34] J. F. and H. A. Antonio Martins, “Active Power Filters
for Harmonic Elimination and Power Quality
Improvement,” World’s Larg. Sci. Technol. Med. Open Access B. Publ., 2011.
[35] M. C. Shah, S. K. Chauhan, P. N. Tekwani, and R. R.
Tiwari, “Analysis, design and digital implementation
of a shunt active power filter with different schemes of
reference current generation,” IET Power Electron., vol. 7, no. 3, pp. 627–639, 2013.
[36] F. C. De la Rosa, Harmonics and Power Systems.
Missouri: CRC Press Taylor & Francis Group, 2006.
[37] H. U. Boksberger, “Electrical network and power
converters,” Paul Scherrer Institute, pp. 347–362.
[38] IEEE, IEEE Recommended Practices and Requirements for Harmonic Control in Electrical Power Systems. 1993.
[39] “Understanding Demand / Energy Rates and Managing
Your Electricity Costs,” in An information guide for commercial and industrial customers, St. John’s,
Newfoundland and Labrador, Canada:
NEWFOUNDLAND POWER A FORTIS
COMPANY.