Embed Size (px)
Citation preview

1
An Investigation of the Leontief Paradox using
Canadian Agriculture and Food Trade: An
Input-Output Approach
Tingting Wu Ph.D Student
Department of Agricultural Economics McGill University, Macdonald Campus
21,111 Lakeshore Ste Anne De-‐Bellevue
Montreal, Quebec, Canada-‐H9X3V9 Tel: (+1)5148308991 Fax: (+1)5143987990
Email: [email protected]
Paul J. Thomassin Department of Agricultural Economics McGill University, Macdonald Campus
21,111 Lakeshore Ste Anne De-‐Bellevue
Montreal, Quebec, Canada-‐H9X3V9
Tel: (+1)5143987956 Fax: (+1)5143987990
Kakali Mukhopadhyay
Department of Agricultural Economics McGill University, Macdonald Campus
21,111 Lakeshore Ste Anne De-‐Bellevue
Montreal, Quebec, Canada-‐H9X3V9
Tel: (+1)5143988651 Fax: (+1)5143987990

2
Abstract Empirically testing trade theory emerged after the development of the
Input-Output model. Leontief found that the US was an exporter of labour intensive products and an importer of capital-intensive products, which contradicted the Heckscher-Ohlin theorem. This is known as the Leontief Paradox. This paradox continues to be tested by researchers. Canada is an open economy that relies heavily on international trade, which contributes 30% to GDP. More specifically, Canada is one of the world largest suppliers of agriculture products. No existing literature has investigated factor intensities of agricultural products in Canada. The current study investigated whether the Leontief Paradox existed for Canadian agriculture and processed food trade using the 2006 Input-Output model of Canada. Factor intensities in exports and import replacements of agriculture and processed food products were estimated applying both the Leontief and Leamer approaches. The Leamer approach provided additional information on factor endowment abundance, which gave a direct comparison between factor endowment and factor intensities of trade in Canada. Agriculture and processed food sectors were expanded in the I-O model to provide insight into the structure of Canadian agricultural and food products trade. Along with capital and labour, land was included in this study, since natural resources play an important role in Canadian trade. Contrary to Leontief’s finding, no evidence of the Leontief Paradox was observed for Canadian agriculture and processed food trade. Canada was found to export capital-intensive products while importing labour-intensive products. Even though Canada exported both land- and capital- intensive products, land was found to be relatively more intensive in exports than capital. This finding further affirms the assumption of natural resources as being a determinant factor in the structure of Canadian agricultural and processed food trade.
Keywords: Leontief Paradox, International trade, Canadian I-O model, factor
intensity

3
Introduction
Canada is an open economy that relies heavily on international trade. Its exports accounted for roughly 30% of GDP, and its international trade continues to increase, with the one exception being 2008-2009 due to the economic downturn. The United States is Canada’s largest trading partner accounting for 75% of exports and 50% of imports in 2010, followed by China and Japan. As one of the world largest suppliers of agricultural products, Canada’s exports of agriculture and fish products increased from 6.5% to 7.5% during 1995-2010. Similar to overall trade, the US is Canada’s largest agriculture products export market. This is followed by Japan and China, taking 8% and 7% respectively. In terms of the balance of trade, Canada has run a surplus in agriculture and fish products trade even when the total trade in Canada faced a deficit in 2009. According to the Heckscher-Ohlin-Vanek (H-O-V) theorem, Canada is expected to export capital- and natural resources- intensive agricultural and food processing goods due to its abundance of endowment in capital and natural resources. However, as noted with the Leontief Paradox (Leontief 1953), our prior expectation about factor intensity on trade may be misleading. Moreover, little information on factor content is revealed from the trade flows of Canadian agriculture and food trade. Therefore, to understand Canadian agriculture and food trade in depth, a comprehensive study of trade and its factor content needs to be undertaken. To date, no literature on factor intensities of Canadian agriculture and food trade have been conducted. This study aims at investigating whether the Leontief Paradox exists for Canadian agriculture and processed food trade and whether its factor content coincides with the H-O-V theorem. Factor contents, as measured by the direct plus indirect factor requirements of the production of trading goods, were computed using the Canadian Input-Output model for 2006. Following the H-O-V theorem, capital, labour, and land, as natural resource, are considered as production factors in this study. This paper is a sector specific study that expands the existing literatures on the testing of the Leontief Paradox. This study is beneficial to the understanding of Canadian agriculture and food trade and a test of the H-O-V theorem. The paper is structured in following way: section 2 provides a brief literature review on the H-O-V theorem and the Leontief Paradox. In section 3, the Canadian Input-Output(I-O) model used in this study is described. Section 4 provides a discussion of the data sources required for this study. Section 5 provides results and a discussion of their implications. The final section of the paper provides the conclusion of this study.

4
Literature reviews
Attempts to explain the trade structure of a country has led to the development of trade theories. H-O-V theorem (Vanek 1968) is one of the most important theories for the understanding of international trade. In the H-O-V theorem, it assumes that factor price is equal and technology is constant across countries for the same industry. Under these conditions, a country exports products using its relative abundant factor and imports products using its scarce factor. Though this theorem seems straightforward and intuitive, the H-O-V theorem failed empirically to test factor intensities in international trade at many times (Hufbauer 1970; James and Elmslie 1996; Jones 1956; Leontief 1953; Maskus 1985). One of the most influential studies was undertaken by Leontief (1953). He was the first to use a direct measurement to investigate trade patterns. In the study, he found that the US was an exporter of labour and an importer of capital. This finding contradicted the prediction of the H-O-V theorem, that the US would export capital-intensive goods while importing labour-intensive goods, given its abundance of capital. This finding was called the Leontief Paradox.
Whether the Leontief Paradox continues to hold for the US and other economies is intriguing (Brecher and Choudhri 1982; Casas and Choi 1985; Leamer 1980; Valavanis-Vail 1954). Several studies have investigated the trade directions of production factors. Many of these studies (Baldwin 1971; Brecher and Choudhri 1982; Weiser 1968) have reaffirmed the Leontief Paradox and have provided possible explanations for the results. In Leontief’s work, capital and labour were included as production factor. However, some researchers (Leontief 1956; Baldwin 1971; Swerling 1954; Vanek 1968; Vanek 1963; Weiser 1968) recognized that trade directions may be determined by production factors other than capital and labour. Natural resources, for example, could affect international trade. This is particularly important for agricultural production.
Natural resources are not only important as a factor by themselves, they can also impact the use of other factors. As pointed out by Vanek (1968), natural resources and capital are complements. The Leontief Paradox could be a result of the relative scarcity of natural resources instead of capital. Even if capital was a relative abundant factor in the US in 1947, it could have entered productive processes only in conjunction with a relatively small amount of natural resources. This could result in the observation of the U.S being an exporter of labour and importer of capital. Therefore, to understand trade patterns for a country, natural resources as a production factor must be included together with capital and labour. Young and Kreinin (1965) found that the labour efficiency in Canada and the US was the same. This provides support to the argument of the dominant role natural resources play in US-Canada trade. Excluding natural resources from US exports and import replacements resulted in a ratio of capital to labour embodied in import replacements versus exports to be close to 1. This change suggested that natural resources were

5
crucial in determining trade patterns in the US, which supported the H-O-V model. Weiser (1968) concluded that though natural resources was a determinant of trade patterns, especially to natural resource commodity trade, it did not reverse the Leontief Paradox in US trade over the period 1947-1962. This would suggest that the absence of the third production factor; i.e. natural resources, was not fully responsible for the existence of the Leontief Paradox.
Researchers (Branson 1971; Keesing 1965; Kreinin 1965; Travis 1972) also proposed that difference in endowment of human capital between the US and the rest of the world could be another explanation for the finding of the Leontief Paradox. Branson (1971) found that the US was human capital intensive in exports and physical capital intensive in imports assuming physical investment in creating human capital can move as freely as physical capital in the long run. However, most of the studies in international trade and factor endowments are undertaken in the short term. Given the assumptions of the Input-Output model it is difficult to draw conclusions on factor endowments when both human capital and physical capital are included in the analysis. As a result, many studies compared the amount of skilled labour, unskilled labour, capital, and other production factors as a means to determine trade patterns between nations. For example, Baldwin (1971) compared the ratio of research and development (R&D) costs involved in import replacements and exports and the ratio of the number of skilled workers engaged in import replacements with exports. He concluded that US exports incorporated more skilled labour than its import replacements. Keesing (1965) computed the capital per man-year embodied in exports by countries (developed countries) and by type of labour (skilled labour to unskilled labour) and concluded that skilled labour availability shaped trade patterns. More specifically, the availability of labour skills determined patterns of trade for products that were not closely tied with natural resources. Lownger and Thomas (1971) compared the skilled labour proportion in the total economic activities between Brazil and its major trading partners (Western Europe and North America) in the1960’s. They found that Brazil had lower levels of skilled labour endowments as compared to Western Europe and North America. Moreover, the exports of Brazil were relatively less “human capital” intensive compared to its imports. No significant evidence was found to conclude any relationship between physical capital endowments and patterns of trade in Brazil. However, Kreinin (1965) stated that the superior level of the US skilled labour was not significant enough to offset its scarcity of labour. The quality of labour did play a role in patterns of international trade. However, it cannot explain the existence of the Leontief Paradox. Apart from natural resources and skilled labour, researchers have proposed several other potential explanations. These include: (1) when factor-intensity reversals are large enough to fail the H-O proposition; (2) demand in the US is strongly biased towards capital intensive products causing the US to import even more capital;(3) trade-distortion policies favours the production of labour-intensive products and prevents the imports of these products at the same time.
Despite the observing of the Leontief Paradox in many literatures, some researchers argued that Leontief’s computation was simply a mistake, or the

6
paradoxical finding was based on an unusual year (Kreinin 1965; Leamer 1980). Leamer (1980) computed the capital and labour requirements in US net exports in 1947 and compared it with the capital and labour requirement in US consumption. He found that the capital per man year embodied in the US net exports was greater than that in US consumption. Therefore, Leamer suggested that the Leontief Paradox did not exist for US international trade. However, it is important to note that even with Leamer’s adjustments the Leontief Paradox observed by Baldwin (1971) would still exist. Brecher and Choudhri (1982) examined Leamer’s propositions. They argued that the statement from Leamer (1980) that a country was a net-exporter of labour service if and only if its total expenditure was less than that in the rest of the world was paradoxical. In 1947 worker expenditures were larger in the US than the rest of the world, while the US was found to be a net-exporter of labour. This brought questions on Leamer’s conclusion that the Leontief Paradox did not exist for the US economy. Maskus (1985) used the H-O-V model and followed Leamer and Brecher and Choudhri’s propositions to study trade patterns for the year 1958 and 1972 respectively. He ranked the ratio between factor content as total requirement of trade and the factor absorbed in domestic total production. In both years skilled labour (in this case engineers and scientists) and human capital were relative more abundant, while unskilled labour and physical capital were relatively scarce in the US. This finding supported the Leontief Paradox that the US import replacements were relatively capital intensive. Given these results Maskus concluded that the Paradox continued to exist in 1958 and 1972.Trefler (1993) examined the factor intensities for US trade in 1983. His result was similar to what was found by Leontief (1953) for labour. Lee and Wills (1988) tested the Leontief Paradox for US agricultural trade in 1977 and 1982. In their study they used Leontief’s (1953) and Leamer’s (1980) calculation to investigate factor scarcities in the US. They computed capital, labour, and land intensity for US agricultural trade. No evidence of the Leontief Paradox was found in either calculation.
The studies on the investigation of the Leontief Paradox were widely replicated in the US. However, such analysis was rarely applied in the rest of the world. As a result, the scope test of the Leontief Paradox was relatively limited. In this case the scope test would apply the same methods of calculating factor scarcity or intensity to other economies. Following are some of the studies that used the Input-Output modeling framework to test factor intensities. Tatemoto and Ichimura (1959) studied the Japanese trade patterns for 1951 and found a dual specialization in Japanese trade. Japan exported capital-intensive goods to developing countries while exporting labour-intensive goods to developed countries. Since 75% of its exports went to developing countries, Japan exported relatively capital-intensive products and imported relatively labour-intensive products compared to the rest of the world. Japan in 1950s was scarce in capital. This finding suggested the detection of the Leontief Paradox for Japanese economy in 1951. Heller (1976) further confirmed the dualism in Japanese trade from 1956 to 1969. Moreover, in his study, it was found that Japan’s export of capital-intensive goods to both developing and developed economies were intensified over the period, suggesting a convergence of comparative advantage for

7
Japanese trade. Yokokawa (1994) investigated factor content for Japanese trade from 1955 to 1985. Comtrary to Tatemoto and Ichimura’s (1959) conclusion on the Leontief Paradox in Japan, he argued that Japan was already abundantly endowed with capital and skills from mid-1950s. However, in his study, unskilled labour were still found to be relatively abundance compared to capital and skills, irrespective of its increase of exports in capital-intensive goods. Drysdale and Song (2001) investigated the comparative advantage for Japanese manufacturing industries by including physical capital, human capital, and unskilled labour in the study. They concluded that after mid-1970s, physical and human capital exert significant influence on Japan’s comparative advantage being an exporter of capital-intensive goods. Stolper and Roskmap (1961) used the Input-Output model to study Eastern Germany’s trade and found that Eastern Germany exported capital-ntensive products and imported labour intensive products. They concluded that no Paradox was found in Eastern Germany trade. They explained the results by noting that 75% of total trade of Eastern Germany went to the communist bloc and Eastern Germany was relatively endowed with an abundance of capital. Wahl (1961) investigated the Canadian capital-labour ratios for exports and import replacements. He found that the average total exports for Canada in 1949 were more capital intensive and less labour intensive than would have been required for the average import replacements. Moreover, contrary to Baldwin’s (1971) findings, Wahl found that Canadian exports to the US were also revealed to be capital intensive. The difference in results for Canada-US trade may be due to the different data sources used. Wahl measured labour intensity for Canada using wages rather than physical units. This change in the factor intensity measure made the estimates by Leontief and Baldwin not directly comparable. Canada’s trade was highly dependent on US economy. Its exports and imports to the US take up to 75% of its total trade value with the rest of the world. If it is assumed that in 1949 the US was relatively more endowed with capital, the finding by Wahl would suggest another Paradox for Canadian trade in 1949.
According to author’s knowledge, empirically testing the Leontief Paradox on the agriculture trade in Canada was never been conducted. Therefore, This study tests the presents of the Leontief Paradox in the agriculture and processed food trade. Such a study will contribute to the better understanding of the agriculture and processed food trade structure and its relationship with the domestic industrial production.
Canadian Input-Output modelling framework
Canadian Input-Output accounting tables are based on a rectangular accounting framework where the number of commodities and services exceeds the number of industries. The Canadian Input-Output model consists of three basic matrices (tables), i.e. Use Matrix(U), Make Matrix(V), and Final Demand Matrix(F). The model is based on the following accounting equations:
q = Ui + Fi (3-1)

8
where q is a vector of total demand for commodities, i.e. intermediate inputs plus final demand by commodity; U is the matrix of intermediate inputs by industrial sectors; F is the Final Demand Matrix, allocating the flow of commodities to final demand categories; i is a column vector whose elements are unity with appropriate row dimensions.
One of the assumptions that the present general equilibrium accounting framework follows is that all commodities, including main products and by-products, made by an industrial sector are produced with the same technical production structure. This is called the industry-based technology assumption. An input coefficient matrix B can be estimated using this assumption as follows:
B = Ug!! (3-2) where, g is a vector of the total value of industrial output by industrial sector; “^” indicates a diagonal matrix; superscript “-1” represents a vector or matrix inverse. The input coefficient matrix is a commodity by industry matrix. Each coefficient is the percentage of that input as a function of the total cost for that sector.
Similarly, the industrial sectors share of the total market for commodities can be represented by a matrix of commodity output proportions, also called the market share matrix, “D”. This can be expressed as follows:
D = Vq!! (3-3)
where V is the Make Matrix, documenting the share of each commodity produced by each industrial sector;
The market share matrix is an industry by commodity matrix. Each cell in a column is the output share of a commodity by industrial sector. Rewriting equation 3-2 and 3-3, U and V can be expressed as:
U = Bg (3-2*) 𝑉 = Dq (3-3*) q = B gi + Fi = Bg+ Fi (3-4) g = Dqi = Dq (3-5)
Rearranging (3-4) by replacing g according to (3-5), (3-4) can be rewritten as: q = (I− BD)!!Fi (3-4*)
where I is an identity matrix with appropriate dimensions; i.e., industry by industry or commodity by commodity.
Equation (3-4*) is used to estimate the commodity output change due to a change in the final demand for commodities. This model is called the Commodity-Demand Driven Model (Miller and Blair 2009). The industrial output changes to satisfy an exogenous shock by final demand can be written as:
g = I! − DB !!D Fi! (3-6) The bracketed quantity [(II – DB)-1D] is an Industry by commodity total requirement matrix. This matrix is called the impact matrix. The impact matrix is used to

9
estimate the direct plus indirect impacts in industrial output that are required to satisfy a change in final demand for commodities.
Leakage
A leakage can be defined as commodities that are used to satisfy either intermediate or final demand but are not supplied by the Canadian economy. Leakages are included in the model in order to provide a better estimate of the impact of a change in final demand. In this model, the leakage is defined as the import share to the domestically available goods and services and is represented by a commodity by 1 vector, “a”. Equation (3-6) can be rewritten to incorporate the leakage as follows:
g = I! − D I! − a B !!D Fi (3-7) Equation (3-7) will be used to estimate the direct plus indirect impacts on industrial sectors that are required to satisfy changes in final demand.
In order to test whether the Leontief Paradox exists for Canadian agriculture trade, this study computes factor intensities (capital, labour, and land) for Canadian agriculture and processed food trade in 2006. The Canadian Input-Output model with extended agriculture and processed food sectors for 2006 was used to conduct this analysis. Capital, labour, and land coefficients for each Canadian industrial sector were computed and these coefficients were used to estimate the factor requirements for agriculture and processed food trade. Equation (3-7) was used to compute the direct plus indirect impacts on industrial outputs to satisfy the final demand for these commodities.
A factor coefficient matrix, “Z”, can be estimated that can be used to estimate factor intensities. This matrix has the dimensions of the number of factors by the number of industrial sectors. The approach taken to investigate the production factors for Canada is similar to that suggested by Vanek (1963); i.e. capital, labour, and land. The factor requirements needed to satisfy the change in final demand can be written as:
Factor requirements = Z ∗ I! − D I! − a B !!D Fi (3-8)
In this study, agriculture and food exports and imports vectors were used respectively to replace final demand vector in equation (3-8) for the calculation of factor requirement from exports and imports of agriculture and food goods. Factor intensities for exports and imports were compared for the conclusion of the Leontief Paradox. Moreover, final demand vector in equasion (3-8) were replaced by agriculture and food exports, imports, and consumption. Factor intensities between net-exports and consumption were compared for Leamers proposition.

10
Data Sources
Input-Output tables
This study used the 2006 Statistics Canada Input-Output model that had been extended with the extended agriculture and processed food sectors. This model was used because it is the most recent model with the disaggregated agriculture sectors. It was deemed to be the most appropriate model to study the factor intensities of exports and import replacements of agriculture and food commodities in the Canadian economy. The extended agriculture Input-Output tables were used to build the agriculture sectors in the modified tables, while the food and beverage processing industrial sectors were obtained from the Link level of aggregation, and the other industrial sectors were from the Medium level of aggregation. There are 84 industrial sectors in the modified Input-Output model. These includes 13 agriculture and 12 processed food sectors.
Production factors
Production factors studied in this paper include capital, labour, and land. They are collected from different data sources, and aggregated to levels that suit the computation in this study.
1. Capital
Capital coefficients were collected and computed based on the KLEMS database (Statistics Canada 2007) built by the Micro-Economic Analysis Division, Statistics Canada, and the “Canadian Farm Financial database” (Statistics Canada and Agriculture and Agri-Food Canada 2009) for the year 2006. The capital stock defined by Statistics Canada consists of 15 types of equipment, 13 types of structures, and land and inventories adding up to total 30 types of assets (Baldwin, Gu and Yan 2007).
2. Labour
Labour coefficients for most industrial sectors were derived from the KLEMS database for Canada in 2006 (Statistics Canada 2007). In this study, working hours were used to measure the labour used in each industrial sector. For agricultural activities, The KLEMS database aggregated the agriculture sectors to 4 sectors; i.e. greenhouse, nursery and floriculture production, crop production, animal aquaculture, and animal production. Labour coefficients for the disaggregated agriculture sectors were estimated using information from the total payment of wages and salaries, and supplementary labour income shares by agricultural activity according to the Input-Output table for the year 2006.

11
3. Land
Land coefficients were only estimated for the agriculture activities in the model. Land as a factor of production does not play an important role in most industrial sectors, with the exceptions of agriculture, forestry, and mining. Since the analysis is focused on agriculture and food commodities, only the land coefficients for the agricultural activities were estimated. Land intensity by agricultural activity was estimated with information from the 2006 Census of Agriculture (Statistics Canada 2011).
Results and discussion
The Canadian agriculture and food trade in 2006
According to the Input-Output final demand table, Canada exported 33,177 million dollars and imported 25,109 million dollars of agriculture and food commodities in 2006. Canada was a net-exporter of agriculture and processed food products, with a net-exports value of 8,068 million dollars. Agriculture and processed food exports and imports accounted for 6.7% and 5.3% of total trade respectively in 2006. However, the net-exports of agriculture and food were greater than the total net-exports in Canada. This suggests that the large outflow of agriculture and processed food commodities from Canada contributed greatly to the Canadian trade surplus in 2006.
Canada’s largest agricultural export was wheat, worth 3,624 million dollars. Pork, fish and seafood products, vegetables other than potatoes were the second to the fifth largest outflow of agriculture and food exports. In terms of agriculture and processed food imports, Canada imported 1,790 million dollars’ worth of vegetables, which was the largest proportion of imports in agriculture and processed food. Wine, fresh fruits, fish and seafood products, and cigarettes were the second to the fifth largest inflow of commodities in 2006. Of the total agriculture and processed food commodities, the share of processed food exports and imports were over 50%. The share of agriculture products in exports was greater than the share in imports. This structural difference between Canadian agriculture and food commodities exports and imports in 2006 suggests that Canada’s exports were dependent more on agriculture products, while its imports were more dependent on processed food products. The different structure of production factors used in agriculture and processed food production would have an impact on the factor intensity in Canada’s agriculture and processed food trade.
Leontief’s approach
The capital, labour, and land requirements for exports and import replacements for agriculture and processed food commodities are listed in table 5-1. These results show that an average million dollars’ worth of Canadian agriculture and processed food exports use more capital and less labour than an equivalent amount for the

12
import replacements. The ratios between capital and labour for exports and import replacements are 168.2 and 112.2 dollars per working hour respectively. The ratio of capital per working hour between exports and import replacements is 1.5. These results would suggest that Canada used international trade in agriculture and processed food commodities to optimize labour and dispose of excess capital. In Leontief’s work, the capital per labour year ratio between exports and imports were 0.77. He concluded from this computation that the US exported labour-intensive while imported capital-intensive goods. By Leontief’s definition, Canadian agriculture and processed food exports are relatively more capital intensive than its import replacements. As a developed economy, Canada is endowed with abundance of capital, and it faces scarcity of labour. This endowment assumption is same to the case for the US. According to the H-O-V theorem, a country should export commodities that use its relative abundant factor and import commodities that use its relatively scarce factor. The estimates for Canadian agriculture and processed food trade are consistent with what is proposed by the H-O-V theorem. Therefore, using the same approach as Leontief on Canadian agriculture and food trade, no Leontief Paradox was found to exist for the year 2006.
Table 5-1. Domestic capital, labour and land requirements per million dollars of Canadian agriculture and food exports and import replacements
Exports Import Replacements
Capital (dollars) 3,542,800 2,572,600
Labour (working hours) 21,063.7 22,937.1
Land (acres) 2,210.1 994.7
As mentioned earlier, share of agriculture goods in agriculture and food exports is greater than it in imports. The capital requirement for exports is greater than the capital requirement for imports. Contrarily, the labour requirement for exports is smaller than the labour requirement for import. This result may suggest a relatively capital-intensive production technology in agriculture sectors in Canada. Canada as an developed economy replaced labour with capital in agriculture production process to subsidies its lacking of labour, which make agriculture production relatively capital intensive. This finding indicates that technology assumption used in this study is that agriculture sectors are also capital intensive comparing to labour.
Apart from capital and labour, land as a natural resource was also included in this analysis. The results indicate that Canada exported agriculture and processed food goods that used more land, and imported goods that used less land. The ratio of land use between exports and import replacements is 2.2. This means that for the

13
equivalent amount of exports and import replacements, land use in exports is more than double the land use in import replacements. Recalling that share of agriculture goods in agriculture and processed food exports is higher than that share of imports. In this study, land is only considered for land used by agriculture sectors. Higher land requirement for exports is mainly because of the higher share of agriculture goods in exports. This finding complies with the trade data. The ratio of land by labour was also computed for both exports and import replacements. It is found that the land-labour ratios for exports and import replacements are 0.1 and 0.04 acres per working hour respectively. The land-labour ratio in exports is 2.5 times the ratio for import replacements. These results suggest that Canadian agriculture and processed food exports require more land per working hour than the imports if they would have been produced domestically.
Capital and land requirements were relatively greater in Canadian agriculture and food exports, while the labour requirements were relatively greater in Canadian agriculture and food imports in 2006. This result can be interpreted as indicating that Canadian agriculture and food exports are relatively capital- and land- intensive, while its imports are relatively labour intensive. As a developed economy, Canada is expected to be well endowed with capital and having a scarcity of labour. Therefore, such result suggests that the Canadian agriculture and food trade support the H-O-V theorem. There is no evidence of the Leontief Paradox for Canadian agriculture and processed food trade in 2006.
Leamer’s approach
Factor content of net-exports of agriculture and processed food trade was computed. This was done by shocking the Input-Output model with the total value of agriculture and processed food exports and imports separately to estimate the impact, i.e. total industrial output, on the economy. Table 5-2 provides detailed information on the factor requirements by Canadian agricultural and processed food trade.
Table 5-2. Factor requirements for agriculture and processed food trade Exports Imports Net-exports Capital (thousand dollars)
117,910,000
65,601,000
52,309,000
Labour (thousand working hours)
700,494.9
584,440.5
116,054.4
Land (thousand acres)
73,677
25,704
47,973
Capital-labour ratio
168.2 112.2 450.7
Land-labour ratio 0.11
0.04
0.41
14
The results suggest that Canada was a net-exporter of capital, labour, and land in its agriculture and processed food trade in 2006 (Table5-2). The capital-labour ratio and land-labour ratio were 450.7 and 0.41 respectively. An average 1 million dollars of net-exports of agricultural and processed food products requires 6.48 million dollars of total capital inputs and 14,384 working hours. According to Leamer’s proposition (1980), if a country is a net-exporter of both capital and labour, trade can be used to determine if a country is relatively endowed in capital if and only if the ratio of capital-labour embodied in net-exports is greater than the capital-labour ratio absorbed by domestic consumption.
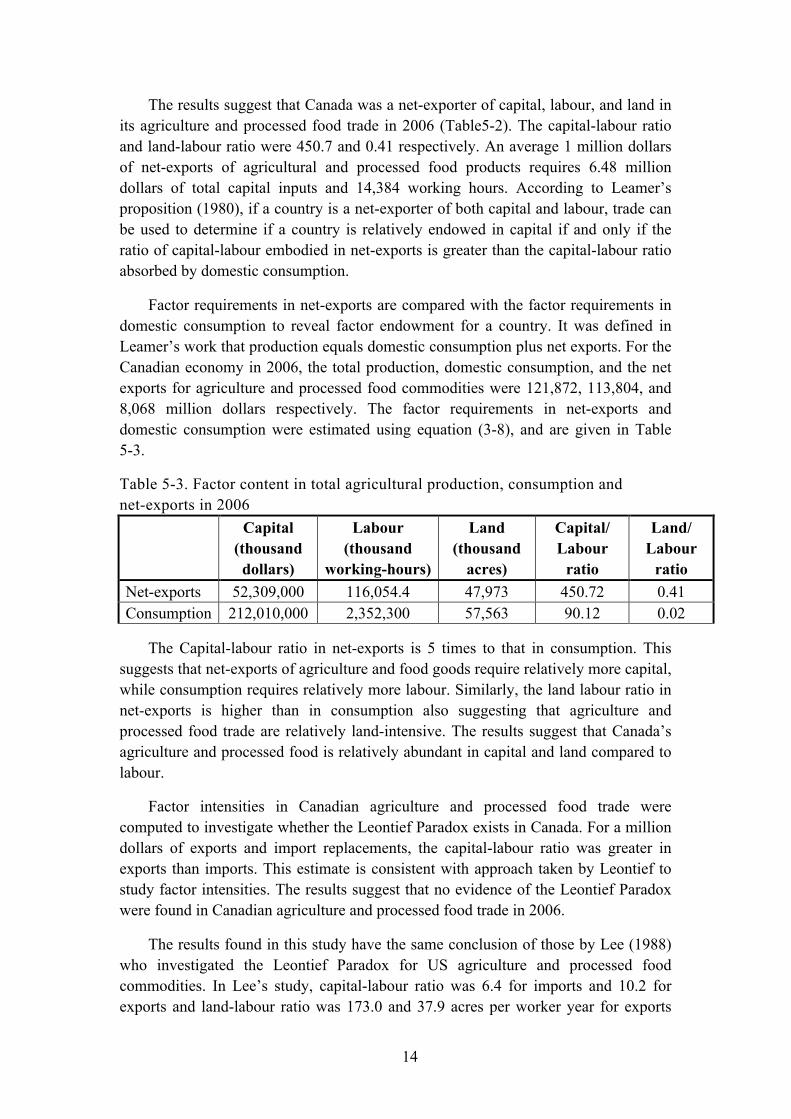
Factor requirements in net-exports are compared with the factor requirements in domestic consumption to reveal factor endowment for a country. It was defined in Leamer’s work that production equals domestic consumption plus net exports. For the Canadian economy in 2006, the total production, domestic consumption, and the net exports for agriculture and processed food commodities were 121,872, 113,804, and 8,068 million dollars respectively. The factor requirements in net-exports and domestic consumption were estimated using equation (3-8), and are given in Table 5-3.
Table 5-3. Factor content in total agricultural production, consumption and net-exports in 2006
Capital (thousand
dollars)
Labour (thousand
working-hours)
Land (thousand
acres)
Capital/ Labour
ratio
Land/ Labour
ratio Net-exports 52,309,000 116,054.4 47,973 450.72 0.41 Consumption 212,010,000 2,352,300 57,563 90.12 0.02
The Capital-labour ratio in net-exports is 5 times to that in consumption. This suggests that net-exports of agriculture and food goods require relatively more capital, while consumption requires relatively more labour. Similarly, the land labour ratio in net-exports is higher than in consumption also suggesting that agriculture and processed food trade are relatively land-intensive. The results suggest that Canada’s agriculture and processed food is relatively abundant in capital and land compared to labour.
Factor intensities in Canadian agriculture and processed food trade were computed to investigate whether the Leontief Paradox exists in Canada. For a million dollars of exports and import replacements, the capital-labour ratio was greater in exports than imports. This estimate is consistent with approach taken by Leontief to study factor intensities. The results suggest that no evidence of the Leontief Paradox were found in Canadian agriculture and processed food trade in 2006.
The results found in this study have the same conclusion of those by Lee (1988) who investigated the Leontief Paradox for US agriculture and processed food commodities. In Lee’s study, capital-labour ratio was 6.4 for imports and 10.2 for exports and land-labour ratio was 173.0 and 37.9 acres per worker year for exports

15
and imports respectively. His computation suggested that US agriculture and processed food exports were relatively capital- and land- intensive compared to labour in 1982. Factor intensities in US agriculture and food trade were similar to that in Canada.
The calculation of capital and labour intensity used in this study were different from those used by Leontief (1956) and Lee (1988). In their studies they estimated capital requirements using capital flows from the US Input-Output model. This study used a stock value for capital requirements. Using a stock value for capital as oppose to a flow value is expected to give more accurate estimate of capital intensity.
A comparison between factor intensities domestic consumption and net-exports are compared. It is found that the capital-labour and land-labour ratio for net-exports and production are greater than those for domestic consumptions, which suggests that Canada is relatively abundant in capital and land as compared to labour in the international trade of agriculture and food commodities. A few studies suggested that the capital and land intensities were observed to change in the same direction and as a result the Leontief Paradox could be explained by the complementary relationship between capital and land in the US. In this study, even though no Leontief Paradox was observed, the results suggest that Canada is relatively more abundant in capital and land. This may also be a reflection of the complementary between capital and land. However, studies of factor intensities in different years should be conducted to further investigate this argument.
Empirically, Canada as a developed country is endowed with relatively abundance of capital and natural resources. The observed capital intensities in agriculture and processed food trade are consistent with this fact. Canada’s exports of agricultural products such as wheat are a large proportion of Canada’s agriculture and processed food trade. Land use in wheat and other crop production is large. This can explain the abundant land use in total agriculture and food trade.
In conclusion, Canada was observed to export relatively capital and land intensive products as compared labour intensive products. The findings did not support the Leontief Paradox for agriculture and food trade in Canada for 2006. This conclusion is also supported by Leamer.
Conclusion
This paper investigated whether the Leontief Paradox exists for Canadian agriculture and food trade for the year 2006. Factor intensities of Canadian agriculture and food trade were computed and compared with the factor endowments in Canada. The Canadian Input-Output model with extended agriculture and processed food sectors was built to gauge the factor requirements in Canadian agriculture and processed food trade. Three production factors, capital, land, and labour, were included in this analysis. The study used both Leontief’s and Leamer’s approaches to
16
estimate the factor intensity and factor endowment revealed by agriculture and processed food trade in Canada.
The capital-labour ratio for agriculture and food exports and import replacements was 168.2 and 112.2 dollars per working hours respectively, and the land-labour ratio for exports and imports was 0.1 and 0.04 acres per working hours respectively. As for the factor requirements in net-exports, and consumptions for agriculture and food commodities, the capital-labour ratio were estimated to be 450.7 and 90.12 dollars per working hour respectively, while the land-labour ratio were 0.41 and 0.02 acres per working hour respectively. The results show that Canadian agriculture exports in 2006 were relatively capital- and land- intensive and its imports were relatively labour intensive. The capital and land intensity in net-exports was greater than that in domestic consumption, which suggests that Canada was revealed to be relatively endowed with capital and land as compared to labour. No evidence of the existence of the Leontief Paradox by Leontief and Leamer approaches in Canadian agriculture and food trade for 2006 was found.
In addition, it was found that the ratio of land embodied in net-exports to land required for an equivalent amount of domestic consumption suggested that land, as a natural resource, was dominant in net-exports of Canadian agriculture and food trade. This reflected the fact that Canada’s major agriculture and food exports, such as wheat and other crop, use large land areas. The relative land intensive of net-exports is also in line with the fact that Canada is well endowed with natural resources compared to the rest of the world.
In this study the evidence of the Leontief Paradox was not found. It cannot be generalized that the Leontief Paradox does not exists in Canadian trade at all. It should be noted that the Canadian trade balance went to deficit for the first time in 2008-2009 since decades. This shift from surplus to deficit may be accompanied by a shift in factor intensity in trade as well. It would be interesting to see how the change in direction of trade has to do with the factor content of trade by using time-series data.
References
Baldwin, J., W. Gu, and B. Yan. 2007. User Guide for Statictics Canada's Annual Multifactor Productivity Program. Ottawa: Statistics Canada, Rep. 15-206-XIE, no.014.
Baldwin, R.E. 1971. "Determinants of the Commodity Structure of U.S. Trade." The American Economic Review 61(1):126-146.
Branson, W.H. 1971. "U.S. Comparative Advantage: Some Further Results." Brookings Papers on Economic Activity 1971(3):754-759.

17
Brecher, R.A., and E.U. Choudhri. 1982. "The Leontief Paradox, Continued." The Journal of Political Economy 90(4):820-823.
Casas, F.R., and E.K. Choi. 1985. "The Leontief Paradox: Continued or Resolved?" The Journal of Political Economy 93(3):610-615.
Drysdale, P.D., and L. Song. “Evidence of Shifts in the Determinants of Japanese Manufacturing Trade 1970-95” , Australia-Japan Research Centre, Crawford School, Australia National University.
Heller, P.S. (1976) ‘Factor endowment change and comparative advantage: the case of Japan,1956-69’, Review of Economics and Statistics 58 (1), 283–92.
Hufbauer, G. (1970) The Impact of National Characteristics & Technology on the Commodity Composition of Trade in Manufactured Goods, ed. R. Vernon, UMI.
James, A.M., and B.T. Elmslie. 1996. "Testing Heckscher-Ohlin-Vanek in the G-7." Review of World Economics 132(1):139-159.
Jones, R.W. 1956. "Factor Proportions and the Heckscher-Ohlin Theorem." The Review of Economic Studies 24(1):1-10.
Keesing, D.B. 1965. "Labor Skills and International Trade: Evaluating Many Trade Flows with a Single Measuring Device." The Review of Economics and Statistics 47(3):287-294.
Kreinin, M.E. 1965. "Comparative Labor Effectiveness and the Leontief Scarce-Factor Paradox." The American Economic Review 55(1/2):131-140.
Leamer, E.E. 1980. "The Leontief Paradox, Reconsidered." The Journal of Political Economy 88(3):495-503.
Lee, C., D. Wills, and G. Schluter. 1988. "Examining the Leontief Paradox in U.S. Agricultural Trade." Agricultural Economics 2(3):259-272.
Leontief, W. 1953. "Domestic Production and Foreign Trade; The American Capital Position Re-Examined." Proceedings of the American Philosophical Society 97(4):332-349.
_____. 1956. "Factor Proportions and Structure of American Trade: Further Theoretical and Empirical Analysis." The Review of Economics and Statistics 38(4):386-407.
Lowinger, T.C. 1971. "The Neo-Factor Proportions Theory of International Trade: An Empirical Investigation." The American Economic Review 61(4):675-681.
Maskus, K.E. 1985. "A Test of the Heckscher-Ohlin-Vanek Theorem: The Leontief Commonplace." Journal of International Economics 19(1985):201-212.

18
Miller, r.E., and P.D. Blair. 2009. Input-Output Analysis Foundations and Extensions. Second ed. New York: Cambridge University Press.
Statistics Canada. 2006 Census of Agriculture.2006. http://www.statcan.gc.ca/ca-ra2006/index-eng.htm. Accessed April, 2011
Statistics Canada, and Agriculture and Agri-Food Canada. 2009 Canadian Farm financial Database. 2009. http://cansim2.statcan.gc.ca/cgiwin/cnsmcgi.pgm?Lang=E&CANSIMFile=CFFD-BDFEAC/ESAS_SESA-eng.htm. Accessed May, 2011
Statistics Canada Micro-Economic Analysis Division. 2006 KLEM Database. 2007.
Statistics Canada Industry Accounts Division. 2006 Canadian Input-Output Model, 2010.
Stolper, W.F., and K.W. Roskamp. 1961. "An Input-Output Table for East Germany with Applications to Foreign Trade." Bulletin of The Oxford University Instityte of Economics & Statistics 23(4):379-392.
Swerling, B.C. 1954. "Capital Shortage and Labor Surplus in the United States?" The Review of Economics and Statistics 36(3):286-289.
Tatemoto, M., and S. Ichimura. 1959. "Factor Proportions and Foreign Trade: The Case of Japan." The Review of Economics and Statistics 41(4):6.
Travis, W.P. 1972. "Production, Trade, and Protection When There are Many Commodities and Two Factors." The American Economic Review 62(1/2):87-106.
Trefler, D. 1993. "International Factor Price Differences: Leontief was Right!" The Journal of Political Economy 101(6):961-987.
Valavanis-Vail, S. 1954. "Leontief's Scarce Factor Paradox." The Journal of Political Economy 62(6):523-528.
Vanek, J. 1968. "The Factor Proportions Theory: The N-Factor Case." Kyklos 21(4):749-754.
_____. 1963. "The Natural Resource Content of Foreign Trade, 1870-1955, and the Relative Abundance of Natural Resources in the United States." The Review of Economics and Statistics 41(2):146-153.
Wahl, D.F. 1961. "Capital and Labour Requirements for Canada's Foreign Trade." The Canadian Journal of Economics and Political Science 27(3):349-358.
Weiser, L.A. 1968. "Changing Factor Requirements of United States Foreign Trade." The Review of Economics and Statistics 50(3):356-360.

19
Yokokawa, K. (1994) ‘Factor content of international trade in post-WW II Japan’, Keizai Shushi 64 (3), 407–18.


