Embed Size (px)
Citation preview

Western University Western University
Scholarship@Western Scholarship@Western
Electronic Thesis and Dissertation Repository
7-18-2013 12:00 AM
An Investigation of the Association Between Arithmetic An Investigation of the Association Between Arithmetic
Achievement and Symbolic and Nonsymbolic Magnitude Achievement and Symbolic and Nonsymbolic Magnitude
Processing in 5-9 Year-old Children: Evidence from a Paper-and-Processing in 5-9 Year-old Children: Evidence from a Paper-and-
pencil Test pencil Test
Nadia Nosworthy, The University of Western Ontario
Supervisor: Dr. Daniel Ansari, The University of Western Ontario
A thesis submitted in partial fulfillment of the requirements for the Doctor of Philosophy degree
in Psychology
© Nadia Nosworthy 2013
Follow this and additional works at: https://ir.lib.uwo.ca/etd
Part of the Developmental Psychology Commons
Recommended Citation Recommended Citation Nosworthy, Nadia, "An Investigation of the Association Between Arithmetic Achievement and Symbolic and Nonsymbolic Magnitude Processing in 5-9 Year-old Children: Evidence from a Paper-and-pencil Test" (2013). Electronic Thesis and Dissertation Repository. 1387. https://ir.lib.uwo.ca/etd/1387
This Dissertation/Thesis is brought to you for free and open access by Scholarship@Western. It has been accepted for inclusion in Electronic Thesis and Dissertation Repository by an authorized administrator of Scholarship@Western. For more information, please contact [email protected].

AN INVESTIGATION OF THE ASSOCIATION BETWEEN ARITHMETIC ACHIEVEMENT AND SYMBOLIC AND NONSYMBOLIC MAGNITUDE
PROCESSING IN 5-9 YEAR-OLD CHILDREN: EVIDENCE FROM A PAPER-AND-PENCIL TEST
(Thesis format: Integrated Article)
by
Nadia Nosworthy
Graduate Program in Psychology
A thesis submitted in partial fulfillment of the requirements for the degree of
Doctor of Philosophy
The School of Graduate and Postdoctoral Studies The University of Western Ontario
London, Ontario, Canada
© Nadia Nosworthy 2013

ii
Abstract
Recently, there has been a growing emphasis on basic number processing
competencies (such as the ability to judge which of two numbers is larger) and their role
in predicting individual differences in school-relevant math achievement. Children’s
ability to compare both symbolic (e.g. Arabic numerals) and nonsymbolic (e.g. dot
arrays) magnitudes has been found to correlate with their math achievement. The
available evidence, however, has focused on computerized paradigms which may not
always be suitable for universal, quick application in the classroom. Furthermore, it is
currently unclear whether both symbolic and nonsymbolic magnitude comparison are
related to children’s performance on tests of arithmetic competence and whether either of
these factors relates to arithmetic achievement over and above other factors such as
working memory and reading ability. In order to address these outstanding issues, a quick
(two-minute) paper-and-pencil tool was designed to measure children’s ability to
compare symbolic and nonsymbolic numerical magnitudes. Individual differences in
children’s performance on this test were then correlated with individual differences in
arithmetic achievement.
Chapter 2 demonstrated that both symbolic and nonsymbolic number comparison
accuracy were related to individual differences in arithmetic achievement; however, only
symbolic number comparison performance accounted for unique variance in arithmetic
achievement. Results also revealed that symbolic scores accounted for unique variance in
children’s arithmetic scores when controlling for age, IQ, reading skills and working
memory.
Chapter 3 assessed the soundness of the paper-and-pencil test. Results indicated

iii
that the paper-and-pencil test demonstrated criterion-related validity, levels of convergent
validity and test-retest reliability. Findings again revealed that only children’s
performances on symbolic items accounted for unique variance in arithmetic scores.
In Chapter 4, further evidence of the convergent validity of the paper-and-pencil
test was demonstrated, and again, symbolic processing accounted for unique variance in
children’s arithmetic achievement. Results also demonstrated that participants’
performance on the paper-and-pencil test in kindergarten was a significant predictor of
their math grade in Grade 1.
Together these three studies give evidence to suggest that a simple two-minute
paper-and-pencil test is a valuable and reliable tool for assessing basic magnitude
processing in children from kindergarten to the third grade.
Keywords: children, arithmetic, assessment, numerical magnitude processing, number
comparison, numerical cognition.

iv
Dedication
I dedicate this work to my wonderful parents and siblings. They have been an unending
source of encouragement and support. I could not have come this far without them.

v
Co-Authorship Statement
The research contained within this doctoral thesis was conducted in collaboration
with my advisor, Dr. Daniel Ansari. Dr. Ansari supervised and contributed to all aspects
of the research projects contained within this dissertation which include experimental
design, data analysis, interpretation and manuscript preparation. Dr. Barrie Evans
contributed to the design of the main assessment tool used throughout the collection of
studies presented in this dissertation and Christian Battista created the nonsymbolic
stimuli used for this same assessment. Stephanie Bugden provided assistance with the
writing of Chapter 2 and experimental design in Chapter 3. While the material contained
in this thesis is my own work, it should be acknowledged that Dr. Ansari provided
assistance in editing and revising all of the written material.

vi
Acknowledgments First, I would like to acknowledge the members of my examination committee which
consisted of Dr. Lisa Archibald, Dr. Donna Kotsopoulos, Dr. Marcie Penner-Wilger and
Dr. Lynne Zarbatany. I would like also to thank Dr. Debra Jared and Dr. Lisa Archibald
who served on my advisory committee.
A big thank you goes to the past and present members of the Numerical Cognition Lab:
Bea Goffin, Ian Holloway, Lucy Buckingham, Gavin Price, Stephen Vogel, Christian
Battista, Stephanie Bugden, Anna Matejko and Ian Lyons. It has been truly an honour to
work with such a talented and great group of individuals.
A special thank you to my sister Dianne Nosworthy who spent many hours reading over
my work and also to my good friend Kieren Bailey whose graphic artist skills were
instrumental in helping me design the main assessment material used in this project. I
thank also Chloe Weir and Kemi Ola for their support during the writing of this thesis.
Most importantly, I acknowledge Dr. Daniel Ansari for his amazing mentorship. It has
been a pleasure to work with someone who has so much enthusiasm for research. I am
grateful also to Dr. Ansari for all his guidance, support and generosity during the years of
my graduate studies and for always believing in me.
(Prov. 3:5, 6)

vii
Table of Contents
Abstract ............................................................................................................................... ii
Dedication .......................................................................................................................... iv
Co-Authorship Statement.................................................................................................... v
Acknowledgments.............................................................................................................. vi
Table of Contents .............................................................................................................. vii
List of Tables ................................................................................................................... xiii
List of Figures ................................................................................................................... xv
List of Appendices .......................................................................................................... xvii
Chapter 1............................................................................................................................. 1
1. General Introduction ....................................................................................................... 1
1.1 Why Study Number?..................................................................................................... 1
1.2 Numerical Magnitude Processing ................................................................................. 4
1.3 Classical Effects of Magnitude Comparison................................................................. 5
1.4 Models of the Numerical Distance Effect and Numerical Ratio Effect........................ 9
1.5 Symbolic and Nonsymbolic Magnitude Processing ................................................... 12
1.6 The Development of Numerical Magnitude Processing............................................. 14
1.6.1 Typical Developmental Changes in the Representation of Numerical Magnitude as Evidenced in Comparison Tasks ........................................................... 14
1.6.2 Typical Developmental Changes in the Representation of Numerical Magnitude as Evidenced in Number Line Estimation Tasks ....................................... 18
1.6.3 Atypical Developmental Changes of Numerical Magnitude Comparison.......... 22
1.7 Educational Implications ............................................................................................ 23
1.7.1 The Use of Basic Magnitude Processing in Educational Assessments............... 23
1.7.2 Test Design.......................................................................................................... 26

viii
1.8 Summary and Motivation of Current Study................................................................ 26
1.9 References................................................................................................................... 29
Chapter 2........................................................................................................................... 36
2. The Relationship Between Arithmetic Achievement and Symbolic and Nonsymbolic Numerical Magnitude Processing in Primary School: Evidence from a Paper-and-pencil Test................................................................................................ 36
2.1 Introduction................................................................................................................. 36
2.1.1 Foundational competencies of mathematical learning........................................ 36
2.1.2 The relationship between magnitude processing and math achievement .......... 38
2.1.3 Using magnitude processing in formal assessment ........................................... 43
2.1.4 Other predictors of math achievement ............................................................... 45
2.2 Methods....................................................................................................................... 47
2.2.1 Participants........................................................................................................ 47
2.2.2 Materials and Design ....................................................................................... 48
2.2.2.1 Magnitude comparison............................................................................ 48
2.2.2.2. Arithmetic Skills .................................................................................... 51
2.2.2.3 Reading Skills ......................................................................................... 53
2.2.2.4 Intelligence.............................................................................................. 53
2.2.2.5 Working memory .................................................................................... 53
2.2.3 Procedure .......................................................................................................... 55
2.3 Results......................................................................................................................... 55
2.3.1 Descriptive statistics ......................................................................................... 55
2.3.2 Age-related changes in basic magnitude processing skills ............................... 55
2.3.3 Investigating the relationship between basic magnitude processing and
arithmetic performance ..................................................................................... 56

ix
2.3.4 Investigating the variance accounted for in arithmetic achievement using,
reading, working memory, IQ, symbolic and nonsymbolic performance on
the paper-and-pencil test as predictors.............................................................. 67
2.4 Discussion ................................................................................................................... 70
2.5 References................................................................................................................... 78
Chapter 3........................................................................................................................... 82
3. Examining the Reliability and Validity of Different Task Variants of Magnitude Comparison, Their Association with Arithmetic Skills and the Role of Working Memory and Magnitude Processing in the Arithmetic Achievement of 6-7 year-old children......................................................................................................................... 82
3.1 Introduction................................................................................................................. 82
3.1.1 Constructing a sound test ................................................................................... 85
3.1.2 Validity .............................................................................................................. 86
3.1.3 Reliability........................................................................................................... 88
3.1.4 The relationship between symbolic and nonsymbolic processing in grade one children revisited ................................................................................................... 92
3.1.5 The role of working memory in numerical cognition........................................ 93
3.2 Methods....................................................................................................................... 95
3.2.1 Participants......................................................................................................... 95
3.2.2 Materials and design ........................................................................................... 96
3.2.2.1 Magnitude comparison task - computerized version ............................. 96
3.2.3 Procedure ............................................................................................................ 98
3.3 Results......................................................................................................................... 98
3.3.1 Descriptive statistics ............................................................................................ 98
3.3.2 Convergent validity............................................................................................ 100
3.3.3 Test-retest reliability for the paper-and-pencil test ............................................ 102

x
3.3.4 Investigating the relationship between the computerized task, the paper-and-
pencil task and student's Math Fluency scores.................................................. 105
3.3.5 Investigating the variance accounted for in Math Fluency using symbolic and
nonsymbolic performance on the paper-and-pencil test as predictors ............. 107
3.3.6 Correlations Between Math Fluency, Working Memory and Magnitude
Comparison ...................................................................................................... 111
3.4 Discussion ................................................................................................................. 116
3.5 References................................................................................................................. 123
Chapter 4......................................................................................................................... 127
4. Investigating the Predictive Validity of the Paper-and-pencil Task and its Association with Arithmetic Skills in Kindergarten Children ................................... 127
4.1 Introduction............................................................................................................... 127
4.1.1 Early predictors of academic achievement and success in the workplace ......... 129
4.1.2 Number line estimation...................................................................................... 134
4.1.3 The relationship between symbolic and nonsymbolic processing in
kindergarten children ......................................................................................... 135
4.2 . Materials and Method ............................................................................................. 136
4.2.1 Participants..................................................................................................... 136
4.2.2 Tests and Materials ........................................................................................ 137
4.2.2.1 Number Naming................................................................................ 137
4.2.2.2 Magnitude comparison task .............................................................. 137
4.2.2.3 Number line estimation...................................................................... 137
4.2.2.4 Arithmetic task................................................................................... 138
4.2.2.5 Report card grades ............................................................................. 139
4.2.3 Procedure ........................................................................................................ 139

xi
4.3 Results....................................................................................................................... 140
4.3.1 Descriptive statistics ........................................................................................ 140
4.3.2 Investigating symbolic compared to nonsymbolic performance on the paper-
and-pencil test ................................................................................................. 141
4.3.3 Investigating the relationship between the paper-and-pencil test, arithmetic
performance and number line estimation abilities .......................................... 142
4.3.4 Investigating the unique variance accounted for in children’s arithmetic
skills using age, number line estimation scores, symbolic processing and
nonsymbolic processing as predictors. ............................................................ 144
4.3.5 Examining the predictive validity of the paper-and-pencil test ....................... 146
4.4 Discussion ................................................................................................................ 149
4.5 References................................................................................................................. 156
Chapter 5......................................................................................................................... 159
5. Conclusion .................................................................................................................. 159
5.1 Summary of Results .................................................................................................. 159
5.2 The Role of Symbolic and Nonsymbolic Processing in the Development of Children's Numerical Abilities................................................................................... 161
5.2.1 The relationship between symbolic and nonsymbolic magnitude
processing .................................................................................................... 162
5.2.2 The relationship between magnitude processing and children's math
achievement.................................................................................................... 164
5.3 Educational Implications .......................................................................................... 167
5.4 Limitations .. ............................................................................................................. 169
5.5 Future directions ....................................................................................................... 170
5.6 Genreral Conclusion ................................................................................................. 171

xii
5.7 References................................................................................................................. 172
Appendix A..................................................................................................................... 174
Appendix B ..................................................................................................................... 175
CURRICULUM VITAE............................................................................................... 176

xiii
List of Tables
Table 2.1 Numerical pairs and ratios for the numerical comparison task………….50
Table 2.2 Means and Standard Deviations (S.D.)………………………………….58
Table 2.3 Partial correlations controlling for age in months (Gr. 1-3)……………..60
Table 2.4 Grade 1 correlations between arithmetic achievement and magnitude comparison……………………………………………………………....64
Table 2.5 Grade 2 correlations between arithmetic achievement and magnitude comparison………………………………………………………………64
Table 2.6 Grade 3 correlations between arithmetic achievement and magnitude comparison………………………………………………………………65
Table 2.7 Linear regression analyses predicting Math Fluency raw scores with chronological age, Reading Fluency, visual spatial working memory, verbal working memory, IQ, symbolic scores and nonsymbolic scores as predictors. ……………………………………………………………68
Table 2.8 Linear regression analyses predicting Calculation raw scores with
chronological age, Reading Fluency, visual spatial working memory, verbal working memory, IQ, symbolic scores and nonsymbolic scores as predictors...……………………………………………………………69
Table 3.1 Numerical pairs and ratios for the computerized numerical magnitude comparison task……………………………………………………….....97 Table 3.2 Means and Standard Deviations (S.D.)…………………………………99
Table 3.3 Correlation between response time measures, paper-and-pencil test and Math Fluency…………………………………………………………...101
Table 3.4 Test-retest stability coefficients…………………………………...........105
Table 3.5 Linear regression analyses predicting Math Fluency raw scores with symbolic efficiency measures and nonsymbolic efficiency measures as
predictors……………………………………………………………….106
Table 3.6 Linear regression analyses predicting Math Fluency raw scores with symbolic efficiency measures and symbolic performance on paper-and-pencil test as predictors…………………………………………………107
Table 3.7 Correlations between Math Fluency and magnitude comparison as measured by the paper-and-pencil test………………………………….108

xiv
Table 3.8 Linear regression analyses predicting Math Fluency raw scores with symbolic and nonsymbolic performance on the paper-and-pencil test as predictors. …………………………………………………………...110
Table 3.9 Correlations between Math Fluency, working memory and magnitude comparison………………………………….…………………………..113
Table 3.10 Linear regression analyses predicting Math Fluency raw scores with Odd-One-Out scores and symbolic scores as predictors. ……………………114
Table 3.11 Linear regression analyses predicting Math Fluency raw scores with Odd-One-Out scores and symbolic and nonsymbolic efficiency measures as predictors.………………………………….……………………………115
Table 4.1 Means and Standard Deviations (S.D.) ………………………………...140
Table 4.2 Correlation between children’s number line estimation, paper-and-pencil test and arithmetic scores………………………………….……………143
Table 4.3 Linear regression analyses predicting arithmetic scores with age, symbolic and nonsymbolic performance on the paper-and-pencil test as predictors………………………………………………………………..145
Table 4.4 Linear regression analyses predicting arithmetic scores with symbolic performance on the paper-and-pencil test and number line estimation as predictors………………………………………………………………..146

xv
List of Figures Figure 1.1 Numerical distance effect. As the numerical distance between two
numerals increases, the faster an individual’s reaction time………………6 Figure 1.2 Numerical ratio effect. In magnitude comparison tasks, reaction times
become slower as the ratio between magnitude pairs increases…………..7 Figure 1.3 A) Logarithmic number line hypothesis. Number is represented on a
compressed number line where variability around each magnitude is constant. B) Linear number line hypothesis. Numbers are placed on a linear scale, and the distribution around each number increases as the magnitudes become greater………………………………………………11
Figure 1.4 Size of NDE across development. This graph illustrates the mean
response time of identifying the numerically larger of two digits as a function of their numerical difference…………………………………...17
Figure 1.5. Number line estimation task. Participants are shown a number and have to
place a mark on the number line to estimate its location………………...19 Figure 1.6 Illustration of the progression from logarithmic pattern responses to a
more linear pattern in the first 3 years of school………………………....21 Figure 2.1 Paper-and-pencil measure. Figures A, B, and C are examples of symbolic
items. Figures D, E and F are examples of nonsymbolic items…………52 Figure 2.2 Grade by format interaction. Bar graph representing overall performance
of participants in each grade for symbolic and nonsymbolic items. Grade 1 participants were significantly better at nonsymbolic items compared to
symbolic items. Participants in grades 2 and 3 did not demonstrate any differences between conditions. Standard errors are represented by the error bars attached to each column………………………………………59
Figure 2.3 Correlation between Math Fluency scores and magnitude comparison
scores. Scatterplot showing significant correlation between standard scores on the Math Fluency subtest of the Woodcock-Johnson III battery and overall mean score of the magnitude comparison task (symbolic and nonsymbolic combined) for all participants. The solid line represents the linear regression line for this relationship……………………………….62

xvi
Figure 2.4 Correlation between Calculation scores and magnitude comparison scores Scatterplot showing significant correlation between standard scores on the Calculation subtest of the Woodcock-Johnson III battery and overall mean score of the magnitude comparison task (symbolic and nonsymbolic combined) for all participants. The solid line represents the linear regression line for this relationship……………………………………..63
Figure 3.1 Bar graph representing participant performance in each format of the test
at both time periods. Participants’ performance on symbolic items in T1 was not significantly different to performance on nonsymbolic items in T1. However, their performance on symbolic items in T2 was significantly lower than their performance on nonsymbolic items in T2. There was also a significant difference between participant scores on symbolic items in T1 and T2 as well as a significant difference between nonsymbolic items in T1 and T2……………………………………….103
Figure 3.2 Scatterplot showing significant correlation between raw scores on the
Math Fluency subtest of the Woodcock-Johnson III battery and overall mean score of the magnitude comparison task (symbolic and nonsymbolic combined) for 70 Grade 1 participants…………………………………109
Figure 3.3 Bar graph representing performance of combined Grade 1 sample in each
format of the paper-and-pencil test. Participants’ performance on nonsymbolic items was significantly greater than performance on symbolic items……………………………………………………….....111
Figure 4.1 Example of a test item on the number line estimation task…………. ...138
Figure 4.2 Bar graph representing participant performance in each format of the
paper- and-pencil test. Participants’ performance on nonsymbolic items was significantly higher than their performance on symbolic items
………………………………………………………………………….142
Figure 4.3 Bar graph illustrating overall performance of participants in each math grade level for symbolic and nonsymbolic items. Below average participants were significantly better at nonsymbolic items compared to symbolic items. Participants rated as average and above average in math did not demonstrate any difference between formats. The bar graph also illustrates that the overall scores on the paper-and-pencil test became significantly better the higher students’ achievement level in Grade 1 math. Standard errors are represented by the error bars attached to each column………………………………………………………………….148

xvii
List of Appendices
Appendix A: Documentation of ethics approval ………………………………………174
Appendix B: Documentation of ethics approval ……………………………………….175

1
Chapter 1
1. General Introduction
1.1. Why Study Number?
The importance of understanding and knowing how to work with numbers is
evident in a society such as the one in which we live. Understanding how numbers work
allows us to ask and answer everyday questions such as, how old are you? How much
does that cost? What is the temperature today? What time is it? In recent years, research
has shown that competence in mathematics is crucial to one’s success in school and the
workplace (Finnie & Meng, 2001). Furthermore, low numeracy skills are associated
with greater likelihood of criminal behaviour and incarceration, as well as higher risk for
depression and other illnesses (Parsons & Bynner, 2005).
Since working with numbers is such a central part of our everyday existence, it is
understandable that an in-depth understanding of how the brain develops the ability to
process numerical quantity and the mechanisms underlying this skill have been the focus
of much research in recent years. While a great deal of progress has been made in
furthering our knowledge about the underlying mental processes involved in number
processing and how these develop (as presented in the literature review below), less work
has centered on how to accurately measure basic number processing skills. These basic
skills are essential, in that, they are thought to lay the foundation on which higher-order
math abilities are built. In other words, they are the foundational competencies of
numeracy.
In contrast, the domain of literacy has progressed in reliable measurement of
foundational competencies of reading (Mee Bell & McCallum, 2008). Furthermore, the

2
link between these foundational competencies and the role they play in the development
of children’s reading skills is well understood (Goswami, 2003; Stanovich, 1986;
Vellutino & Scanlon, 1987). For example, we now know that a child’s ability to hear,
identify and manipulate phonemes, the individual sounds that make up a word, is an
essential building block for good reading skills (Adams, 1990). For instance, strong
readers recognize that the word ‘cat’ can be broken down into three phonemes: the
beginning sound “c”, the middle sound “a” and the ending sound “t.” Each one of these
sounds is a phoneme. Children who are unable to properly hear and identify phonemes
demonstrate poor phonemic awareness, and, therefore, struggle with reading. In many
instances, this is one of the first signs of severe learning disabilities related to reading,
such as developmental dyslexia. Moreover, children’s phonemic awareness is a very
strong predictor of their later reading fluency and comprehension (Adams, 1990). Based
on this knowledge, there now exists a plethora of standardized assessments for measuring
phonemic awareness at several grade levels. As a result, years ago, many students who
would have lagged behind their classmates are now able to receive the early intervention
they need to succeed in the classroom and remain on par with their peers.
While, presently, there are standardized tests available to teachers to evaluate
students’ numeracy skills, very few focus on assessing the foundational competencies, or
building blocks, of math. Most of these tests, instead, focus on more complex skills such
as arithmetic and problem solving. Although these skills are certainly contributing
factors to the development of children’s numeracy capabilities, knowledge of how a child
is performing on more basic and foundational skills can allow teachers to gain better
insight into what their students understand. Moreover, current tests assess what children

3
learn in school, and the knowledge they bring to school is disregarded. By testing
foundational competencies, teachers are able to assess students at a much earlier age,
which can help students to experience a successful start to their academic careers.
As mentioned, phonemic awareness is an essential skill for becoming a good
reader. One well-established building block of numerical development involves the
ability to process numerical magnitude. Numerical magnitude can be defined as the total
number of items in a set. This number can be exact or approximate, depending on
whether the sets of items are counted or estimated (Ansari, 2008). Numerical magnitude
processing can be tested by assessing an individual’s ability to discriminate between two
sets of objects (nonsymbolic magnitude processing) or two Arabic digits (symbolic
magnitude processing). For example, researchers can ask an individual to identify which
is the larger in a pair of magnitudes (i.e., Which group has more stars? **** vs.***, or
which number means the most things? 6 vs. 5). As you will read in this chapter, this
simple skill has recently been identified as a scaffold that is thought to support children’s
math development, but one that has generally been overlooked in formal, educationally
useable math assessments. The goal of my thesis is to fill this gap by designing a simple
tool to measure children’s basic magnitude processing abilities.
The focus of the following literature review will be to explore numerical
magnitude processing abilities which are the foundation upon which higher order math
skills, such as arithmetic, are built. I will begin with a detailed description of the
underlying processes involved in number processing, how they develop and change
across time, and describe theories of numerical development and evidence of basic
numerical representation in animals and infants. A discussion of the effects and models

4
of numerical magnitude comparison and the typical and atypical developmental changes
of comparing numerical magnitudes will follow. Next, I will present research on the
ongoing debate regarding the role of symbolic and nonsymbolic processing in children’s
math development. In conclusion, a description of the educational implications of the
studies presented will be discussed which include the role of magnitude processing in
educational assessment, when it should be assessed and how it should be tested.
1.2 Numerical Magnitude Processing
For years, researchers often questioned the origins of our ability to use and think
about number. The most plausible explanation was that we learn and acquire a sense for
number, or number sense, over the course of learning and development. There is,
however, now evidence to suggest that an awareness of numerical magnitude is present in
very young children long before they enter their first classroom or even take their first
step. This is supported by research indicating that infants, still without language and
knowledge of number symbols, display notions of magnitude as demonstrated by their
ability to discriminate between small numbers (Starkey & Cooper, 1980; Wynn, 1992;
Xu & Spelke, 2000). In the literature, there is also a collection of studies revealing that
even animals (Brannon, 2006; Dehaene, Dehaene-Lambertz & Cohen, 1998; Meck &
Church, 1983) are capable of this ability as well.
Evidence suggesting that both animals and infants have the ability to discriminate
between two numerical magnitudes demonstrates the importance of this basic,
foundational skill. Moreover, the fact that adults and beings with no language capacity
share an ability to discriminate between numbers suggests we come equipped with an
aptitude to complete these kinds of basic numerical tasks.

5
Studies that administer magnitude comparison tasks provide more support for this
shared ability between individuals and species. In the next section, I describe these
comparison tasks and classical effects that can be observed during their completion.
1.3 Classical Effects of Magnitude Comparison
To measure numerical magnitude discrimination, researchers frequently employ
numerical magnitude comparison paradigms. In magnitude comparison tasks,
participants are asked to choose which of two symbolic or two nonsymbolic magnitudes
is larger. Symbolic magnitudes are represented using symbols such as Arabic digits,
number words or Roman numerals. On the other hand, nonsymbolic magnitudes are
represented using objects, such as arrays of dots or sequences of tones or touches of the
hand. Two effects that have been identified in studies of magnitude comparison (i.e.,
judging which of two simultaneously or sequentially presented numerical magnitudes is
numerically larger or smaller), using both symbolic and nonsymbolic representations,
include the numerical distance effect (NDE) and the numerical ratio effect (NRE).
When individuals compare numerical magnitudes, an inverse relationship between
the numerical distance of two magnitudes and the reaction time required to make a
correct comparison is typically obtained. In other words, individuals are faster at judging
which of two numbers is greater when the numbers are numerically farther apart (e.g., 1
vs. 9) than when they are numerically close (e.g., 8 vs. 9). This phenomenon is known as
the numerical distance effect (see Fig.1.1).

6
Figure 1.1. Numerical distance effect. As the numerical distance between two numerals
increases, the faster an individual’s reaction time.
Moreover, when participants are asked to perform numerical magnitude
comparison, it is also found that participants more quickly and accurately compare two
numbers of a smaller magnitude versus two numbers of a larger magnitude, even when
the distance between the numbers remains constant (i.e., 3, 4 vs. 8, 9, where it takes
participants longer to judge that 9 is larger than 8 (ratio of .89) than it does for them to
decide 4 is larger than 3 (ratio of .75)). This is known as the numerical ratio effect (see
Fig. 1.2). Both of these effects have been replicated in humans (Brannon & Terrace,
2002; Dehaene, 1996; Moyer & Landauer, 1967; van Oeffelen & Vos, 1982, Xu &
Spelke, 2000) and have also been observed in animals (Brannon & Terrace, 1998;
Brannon & Terrace, 2002; Rilling & McDiarmid, 1965; Washburn & Rumbaugh, 1991).

7
Figure 1.2. Numerical ratio effect. In magnitude comparison tasks, reaction times
become slower as the ratio between magnitude pairs increases.
For example, monkeys in Washburn’s and Rumbaugh’s (1991) study learned that
Arabic numerals 0-9 represented corresponding quantities of food pellets and were able
to choose the numeral of greatest value in a comparison task. During this task, they
demonstrated fewer errors when the distance between the numerals being compared was
greater than five. Brannon and Terrace (1998) found that monkeys could be trained to
correctly order nonsymbolic numerosities of 1-9 in ascending order. It was revealed that
the numerical distance between the numbers being ordered had a significant effect on the
accuracy of the animals’ performance in such a way that pairs separated by a relatively
large numerical distance were ordered more correctly than those with a relatively small
distance.
Like the NDE, the NRE has also been observed in humans as well as animals.
Cantlon and Brannon (2006) tested nonsymbolic magnitude processing in college
students and monkeys using the same paradigm. In this task, both groups were required

8
to select the smaller of two arrays that were made up of square-shaped elements which
appeared on a touch screen monitor. Arrays were made up of values 1 through 9, 10, 15,
20 or 30. The final analysis revealed that both species displayed a similar NRE, in that,
when the distance between a pair of numbers was held constant but the magnitudes of the
numbers increased, errors and response time also increased. For instance, adult humans
and monkeys took longer to select 7 as smaller than 8, than to select 3 as smaller than 4,
even though both sets of pairs were separated by a numerical distance of one.
Research has also demonstrated the NRE in infants as young as 6 months old. In
their study, Xu and Spelke (2000) attempted to assess whether infants could represent
approximate magnitudes using the standard habituation-dishabituation-of-looking time
procedure. This method is based on the premise that babies gaze significantly longer at
novel stimuli and lose interest (habituate) when a familiar stimulus is repeatedly
presented. The experimenters presented test slides on a screen. Each slide contained
either 8 or 16 dots (ratio of .5) in various positions and sizes across each trial. Once the
infant had habituated to a test slide displaying one of the numerosities, the experimenter
would present a new image with either the same numerosity or the alternative, novel
numerosity. It was revealed that the infants spent more time looking at the slides with the
new versus familiar number of dots. In a second part of the experiment, Xu and Spelke
found that 6-month-old babies did not notice the difference between 8 and 12 dots (ratio
of .67). This suggests that infants as young as 6 months can discriminate between
numerosities provided that their ratio is sufficiently small.
The numerical distance effect and numerical ratio effect are even present in
individuals from societies who have a limited vocabulary for number and no system of

9
numerical symbols. For example, Pica, Lemer, Izard and Dehaene (2004) administered a
nonsymbolic magnitude comparison task to an Indigenous group which speaks
Mundurukú in the Amazon. In the Mundurukú language there is a lack of words for
numbers beyond five; however, individuals were still capable of comparing large
approximate numbers which were absent from their numerical lexicon. In addition, their
discrimination performance was dependent on the ratio of the magnitudes being
compared.
In sum, from the studies presented above, it can be seen that effects of numerical
distance and ratio during magnitude comparison tasks can be observed in both individuals
and animals who lack a symbolic system for representing magnitude. One area of interest
that arises from this research is the question of how numerical magnitude is represented
mentally.
1.4 Models of the Numerical Distance Effect and Numerical Ratio Effect
It is hypothesized that the NDE and NRE are a result of noisy mapping between
external and internal representations of numerical magnitude. In particular, magnitudes
that are numerically closer are thought to have more mental representational features in
common than those that are farther apart. Because of this, discriminating between a pair
of numerical magnitudes is more challenging for quantities that are numerically closer
together. A number of models have been put forth to explain how this leads to the
numerical distance and ratio effects and their underlying cognitive processes of numerical
representation. Two of these include the logarithmic number line model (Dehaene, 1992)
and the linear number line model (Gallistel & Gelman 1992).

10
Dehaene (1992) contends that the brain represents magnitude along a “mental
number line” based on the hypothesis that numbers do not merely suggest a sense of
quantity but also a sense of space. Numbers are represented with smaller magnitudes on
the left and greater magnitudes on the right. These quantities are represented on a
nonlinear or logarithmically compressed scale and each quantity has a fixed
representational distribution likened to a Gaussian Tuning Curve (see Fig. 1.3a). Due to
their proximity, magnitudes that are close together on the number line have more overlap
in their distribution and therefore are more difficult to discriminate than magnitudes that
are farther apart, accounting for the NDE. Furthermore, due to the compressed nature of
the number line, larger quantities are close together and, therefore, share an even larger
overlap in their distributions, compared to smaller magnitudes which leads to the NRE.
In their hypothesis, Gelman and Gallistel (1992) contend that numbers are also
represented on a mental number line; however, in contrast to the model presented above,
numbers are represented on a linear scale rather than on a compressed scale. In addition,
the distribution of each magnitude is not fixed as seen in Dehaene’s (1992) model, but
increases as a function of numerical size (see Fig. 1.3b). The NDE is again accounted for
by the proximity of magnitudes close to each other and the overlap they share. Due to the
scalar variability of the distributions, larger magnitudes share a greater overlap in their
distributions compared to smaller magnitudes, which leads to the NRE.

11
a b
Figure 1.3. a) Logarithmic number line hypothesis. Number is represented on a
compressed number line where variability around each magnitude is constant. b) Linear
number line hypothesis. Numbers are placed on a linear scale, and the distribution
around each number increases as the magnitudes become greater (Reprinted with
permission from Nieder & Miller, 2003).

12
Both of these models characterize the mental representations of numerical
magnitude in a different way; however, they each converge to suggest that the NDE and
NRE are central for modeling representations of numerical magnitude. Consequently, the
NDE and NRE have been used in multiple behavioural experiments to measure the
mental representation of numerical magnitude in adults and children (Buckley &
Gillman, 1974; Butterworth, 2005; Landerl, Bevan & Butterworth, 2004; Moyer &
Landauer, 1967; Sekuler & Mierkiewicz, 1977). Studies have also investigated the
typical and atypical changes of the NDE and NRE across developmental time. A review
of these studies will be presented in a later section entitled The Development of
Numerical Magnitude Processing.
As it was mentioned, magnitude comparison tasks can be either administered
using symbolic (i.e., Arabic digits) or nonsymbolic (i.e., arrays of dots) stimuli since
humans have the ability to represent both forms of numerical magnitude. However,
researchers are still unclear as to the exact contributions of both symbolic and
nonsymbolic processing in children’s math development. Does one matter more than the
other or do both play a significant role? We will now turn to a brief review of this
controversy in the field and the theories proposed from both sides of this debate.
1.5 Symbolic and Nonsymbolic Magnitude Processing
As presented earlier, evidence suggests that both humans and animals share the
ability to represent nonsymbolic numerical magnitudes; however, through explicit
instruction, humans learn to represent these quantities more precisely with number words
and other numerical symbols, such as Arabic numerals.

13
Since humans have the capacity to represent magnitude both symbolically and
nonsymbolically, questions that arise from this dual ability include how these systems of
symbolic and nonsymbolic processing interact throughout development. Does symbolic
number knowledge progress independently of nonsymbolic comparison skills, or do the
two systems work together in the development of mathematical capabilities?
Previous and current research in this area present mixed findings regarding the
relationship between nonsymbolic and symbolic magnitude processing, and two different
theories have been used to explain their role in the development of mathematical skills.
One theory posits that children learn the numerical meaning of number symbols
by mapping them onto pre-existing nonsymbolic magnitudes (Dehaene, 1992; Mundy &
Gilmore, 2009). That is, symbols acquire their meaning through their relationship with
the nonsymbolic system (Halberda & Feigenson, 2008; Libertus, Feigenson & Halberda,
2011; Mazzocco, Feigenson & Halberda, 2011). In this way, the nonsymbolic system is
thought to lay the foundation for symbolic magnitude processing. Evidence for this
theory comes from studies demonstrating that children with math learning disabilities
perform poorly on tasks of nonsymbolic and symbolic magnitude processing (Landerl,
Bevan & Butterworth, 2004; Mussolin, Meijas & Noël, 2010). In this account, those
struggling with math experience a core deficit in their nonsymbolic system which
translates to difficulty processing number symbols since they are mapped to nonsymbolic
magnitudes. This hypothesis has been supported by research revealing a correlation
between children’s nonsymbolic processing abilities and their math achievement
(Libertus, Feigenson & Halberda, 2013), suggesting that individual difference in

14
nonsymbolic numerical magnitude processing may provide the foundation for symbolic
math development.
On the other hand, a second theory proposes that the symbolic system exists
separately from the nonsymbolic system (i.e., Holloway & Ansari 2009; Rousselle &
Noël, 2007). Here, it is suggested that learning the meaning of number words leads to the
materialization of another system for representing magnitude more precisely via
numerical symbols. Support for this theory comes from studies demonstrating that as
early as kindergarten, children’s performance on tasks of nonsymbolic processing are not
predictive of their symbolic processing skills (Sasanguie, Defever, Maertens & Reynvoet,
2013). Additionally, research has shown that symbolic processing accounts for unique
variance in children’s arithmetic performance, while nonsymbolic processing does not
(Holloway & Ansari, 2009).
Clearly, the evidence regarding the role of these processing skills in children’s
math development remains inconclusive. Gaining a clearer understanding of how these
two systems relate to each other and to the development of competencies in mathematics
has many important educational implications as it may shed light on ways to improve
current teaching methods in the instruction of mathematics. Therefore, one of the goals of
this thesis was to examine this issue more closely.
1.6 The Development of Numerical Magnitude Processing
1.6.1 Typical Developmental Changes in the Representation of Numerical Magnitude as Evidenced in Comparison Tasks.
As presented earlier in this review, even infants display an elementary
understanding of numerical magnitude. This is suggested by their ability to differentiate

15
between nonsymbolic numerical quantities. Furthermore, when discriminating between
magnitudes, infants exhibit both distance and ratio effects. For instance, recall that in Xu
and Spelke’s (2002) study of 6-month olds, infants demonstrated a capability of
discriminating between 8 and 16 dots; however, they were unable to correctly compare 8
and 12 dots (a more difficult ratio). Subsequent studies have shown, however, that by 9
months of age, infants are capable of this more difficult discrimination (Lipton & Spelke,
2003). Considering that this improvement in magnitude comparison occurs in such
young infants in a relatively short period of time raises more questions about the changes
that occur in the processing and representation of magnitude across developmental time.
There is evidence to suggest that over the course of development, significant
changes occur in basic numerical magnitude processing; for example, Halberda and
Feigenson (2008) examined the change in the acuity of nonsymbolic magnitude
comparison in 3-6 year-old children and adults. Results demonstrated that the acuity of
nonsymbolic processing is still developing in children’s early years and does not appear
to reach its peak until early adolescence.
In a study along similar lines, Sekuler and Mierkiewicz (1977) examined the
development of symbolic processing across developmental time. Participants included
kindergarten children, first-, fourth- and seventh-grade students, and adults. Each
participant was presented with a pair of digits from 1-9 and was required to indicate
which of the two digits was numerically larger. Results revealed that response times and
errors decreased with age. In other words, as individuals aged they demonstrated an
increasingly smaller NDE (as illustrated by progressively smaller slopes in Figure 1.4),
indicating that symbolic magnitude processing becomes more refined across the lifespan.

16
Comparable findings were also reported by Duncan and McFarland (1980).
These researchers investigated the developmental aspects of the symbolic magnitude
processing in a cross-sectional sample of kindergartners, first, third and fifth graders, and
college students. Similar to the findings of Sekuler and Mierkiewicz (1977), the NDE was
detected in all age groups, but decreased in size as age of participants increased. From
these results, the authors suggest that the underlying mechanisms responsible for the
NDE are established at an early age and that the encoding and comparison of number
improve with time.
From the works described above, it can be seen that even young children
demonstrate sensitivity to numerical distance and ratio during magnitude comparisons.
In addition, younger children’s reaction time and accuracy in comparison tasks are more
greatly affected by distance and ratio than older children and adults. In other words,
discriminating between quantities that are separated by a large distance (small ratio) and
those separated by a smaller distance (large ratio) has a greater effect on the response
time and accuracy of younger children on the comparison task than on the accuracy and
response time of older children and adults (see Fig. 1.4) .
This change in the accuracy of symbolic and nonsymbolic magnitude comparison
has been attributed to transformations in the representation and processing of numerical
magnitude across developmental time. More specifically, researchers suggest that across
development, representations of numerical magnitude become more precise and the

17
Figure 1.4. Size of NDE across development. This graph illustrates the mean response
time of identifying the numerically larger of two digits as a function of their numerical
difference (Reprinted version with permission from Ansari & Karmiloff-Smith, 2002).

18
overlap between quantities on the mental number line decreases. This fine-tuning allows
individuals to discriminate between numerical magnitudes more quickly and accurately
as they become older. The precise mechanisms responsible for the developmental
changes in numerical magnitude processing are currently not well understood; however,
some research have shown that education may play a significant role in these changes
across the lifespan (Zebian & Ansari, 2012; Piazza et al., 2013).
What can be clearly seen from the studies reviewed here is that the acuity of
magnitude comparison for both symbolic and nonsymbolic stimuli sharpens as
individuals age. This observation has potential educational implications since basic
magnitude processing may provide a foundation for higher-level mathematics.
1.6.2 Typical Developmental Changes in the Representation of Numerical Magnitude as Evidenced in Number Line Estimation Tasks.
The section above described developmental changes in basic magnitude
processing as demonstrated through performance on magnitude comparison tasks.
However, in addition to magnitude comparison tasks, other measures are available to
assess children’s magnitude processing abilities. This includes tasks that require an
individual to estimate numerical magnitudes. Estimation can take a variety of forms. For
example, estimating the number of people in a large auditorium, the product of 345 x 567
and the speed of a passing train have little in common except that an individual will
produce an approximate answer to each problem. However, for the purposes of this
review, the focus is on pure numerical estimation which can be defined as: “a process
that has a goal of approximating some quantitative value; that uses numbers as inputs,
outputs, or both; and that does not require real-world knowledge of the entities which

19
properties are being estimated or of conventional measurement units” (Booth & Siegler,
2006, p. 189). One method of evaluating pure numerical estimation which has gained
popularity in recent years is the number line estimation task (Siegler & Opfer, 2003). In
this task, individuals are presented with a number line with 0 at one end and 10, 100 or
1000 at the other. Participants are required to estimate the position of a given number on
the line (see Fig. 1.5). A task such as this is an index of the variability, or noise, present
in the representation and processing of numerical magnitude and is therefore also
considered an assessment of an individual’s magnitude processing abilities.
Figure 1.5. Number line estimation task. Participants are shown a number and have to
place a mark on the number line to estimate its location.

20
By administering this task to individuals of many ages, researchers have
discovered noticeable changes in how individuals represent magnitude in space across
developmental time. As described in the section presented earlier entitled Models of the
Numerical Distance Effect and Numerical Ratio Effect, two hypotheses of how
magnitude may be represented in the brain were discussed. The first was the logarithmic
number line hypothesis which posits that numerical quantities are represented on a mental
number line whereby the larger the numerical magnitude, the smaller the spacing between
each quantity. On the other hand, the linear number line hypothesis contends that
magnitudes are equally spaced on the mental number line.
Several studies have demonstrated that the number line estimation task is an
effective method for differentiating between these models, and the relative fit of these
models changes over developmental time. For instance, Siegler and Booth (2004) had
participants in kindergarten, first grade and second grade to complete the number line
estimation task (0 – 100) and observed significant age differences in the performance of
participants. The responses of children in kindergarten and Grade 1 closely resembled a
logarithmic pattern. For example, for these children, the psychological distance between
0 and 25 would be greater than for the distance between 25 and 100. By Grade 2,
children’s responses followed a more linear pattern where the spacing between
magnitudes were more equidistant (see Fig. 1.6). This shift in representation has been
observed for number lines of varying sizes such as 0-10 (Petitto, 1990), 0-100 (Petitto,
1990; Siegler & Booth, 2004), and 0-1000 (Siegler & Opfer, 2003).

21
Figure 1.6. Illustration of the progression from logarithmic pattern responses to a more
linear pattern in the first 3 years of school (Reprinted with permission from Siegler &
Booth, 2004).

22
Research has suggested that this transformation over time in children’s underlying
representation of magnitude may be the product of increasing experience with numerical
magnitude over the course of learning and formal education (Dehaene, Izard, Spelke &
Pica, 2008; Siegler & Mu, 2008).
1.6.3 Atypical Developmental Changes of Numerical Magnitude Comparison
There is evidence to suggest that individuals who have poor mathematical skills
demonstrate difficulty with numerical magnitude processing as measured by magnitude
comparison. For instance, Landerl, Bevan and Butterworth (2004) compared children
with developmental dyscalculia (DD), reading difficulties or both with controls (children
without either dyscalculia or dyslexia) on a variety of basic number processing tasks.
Individuals with DD demonstrate substantial difficulties in acquiring school-level math
skills, even with normal or above normal academic achievement. Results showed that
participants with dyscalculia only showed deficits in each of these tasks which included
magnitude comparison, despite normal or above average performance on tests of
intelligence, vocabulary and working memory. Participants with both dyscalculia and
reading difficulties demonstrated a similar pattern of disabilities in numerical tasks as
those with dyscalculia. However, children with a reading disability only did not appear
to have any difficulties with number processing tasks, including number comparison.
Poor performance on number comparison tasks has also been seen in individuals
with genetic disorders. Paterson, Girelli, Butterworth and Karmiloff-Smith (2006)
studied a sample of individuals with Williams Syndrome (WS). This
neurodevelopmental disorder is caused by an absence of 26 genes from chromosome 7

23
and is characterized by developmental delay. Compared to the control group, those with
WS failed to exhibit a typical distance effect. A similar finding was also obtained in a
study of children with the chromosome 22q11.2 deletion syndrome (Simon, Bearden,
Mc-Ginn & Zackai, 2005). This condition results from a small deletion in chromosome
22 and presents itself by numerous birth defects and cognitive impairments. Participants
were presented with a magnitude comparison task using both nonsymbolic (dots) and
symbolic (digits) notation and did not show a consistent distance effect in either
condition.
1.7 Educational Implications 1.7.1 The Use of Basic Magnitude Processing in Educational Assessments
The review above demonstrates that there are significant developmental changes
in the processing and representation of both symbolic and nonsymbolic numerical
magnitudes. The individual differences demonstrated in these studies may lead one to
wonder if performance on these comparison tasks is related to individual differences in
more complex mathematical operations.
Indeed, several studies have shown a link between magnitude comparison skills
and individual differences in mathematical competency in typically developing children,
using both symbolic and nonsymbolic representations (De Smedt, Verschaffel &
Ghesquière, 2009; Durand et al., 2005; Halberda, Mazzocco & Feigenson, 2008;
Holloway & Ansari, 2009; Mazzocco, Feigenson & Halberda, 2011). The specifics of
these studies will be discussed in more detail in Chapter 2. Furthermore, studies have
also shown that individual differences in children’s performance on the number line
estimation task significantly correlates with their math achievement (Booth & Siegler,

24
2006; Laski & Siegler, 2007; Schneider, Grabner & Paetsch, 2009; Siegler & Booth,
2004) which will be introduced in more detail in Chapter 4 of this thesis. In other words,
children with more precise internal representations of magnitude as measured by tasks of
magnitude comparison and number line estimation have higher math achievement
compared to children who perform more poorly on these tasks. This indicates that the
more accurate an individual’s representation of internal magnitude, the more quickly and
accurately he or she can access these magnitudes to perform higher order operations such
as addition and subtraction.
The evidence demonstrated here presents the possibility of using measures of
magnitude processing in an educational setting. For instance, magnitude comparison
tasks could be used as a formal assessment to measure the foundational competency of
basic magnitude processing in children. One of the greatest advantages of using tasks
such as magnitude comparison in formal assessment is that nonsymbolic stimuli can be
used with very young preschool and kindergarten age children who may not yet be
familiar with symbolic representations of magnitude. In turn, assessments of this kind
can be used in early grade classrooms to assess children’s magnitude processing abilities
even before they receive formal math instruction, and teachers may assess the knowledge
students bring to school and may know whether students are prepared for the demands of
the formal classroom. Furthermore, research suggests that school-entry math skills are a
strong predictor of student’s future academic achievement and success in the workplace
(Duncan et al., 2007; Geary et al., 2013; Romano et al., 2010); therefore, assessments of
math learning are needed even at the earliest stages of formal education.

25
A second benefit of using tasks of magnitude comparison as an assessment tool is
its applicability on a global scale. Recall that even members of an Indigenous tribe with
no formal education or symbolic number system were able to successfully compare
nonsymbolic magnitudes. This suggests that basic magnitude processing (especially
nonsymbolic) is a skill that is not dependent on culture and is therefore a promising
means of evaluating children’s magnitude processing abilities across cultures and systems
of education.
Currently, many educational assessments of mathematics mainly focus on higher
order math skills in the evaluation of children’s number-related knowledge and ignore
more foundational competencies of math abilities such as magnitude processing. Most of
these tests instead focus on more complex skills such as arithmetic and problem solving.
In other words, children are assessed on the kinds of competencies they are required to
learn in school and not on the foundations that allow for such learning to proceed.
While higher order math skills are certainly contributing components to the
development of children’s numeracy capabilities, knowing how a child is performing on
foundational skills is equally important because it allows teachers to better comprehend
what their students truly understand about basic number processing. Therefore, what is
missing from current assessment tools are processing measures, measures that
characterize the very basic representations needed for children to successfully complete
higher-order mathematical operations. Many current reading assessments include both
tasks measuring complex reading skills, such as comprehension, and more foundational
competencies such as phonemic awareness. In a similar fashion, math assessments

26
should also combine both foundational competencies such as magnitude comparison and
more advanced skills such as calculation when testing children.
1.7.2 Test Design
In contemplating a test of magnitude processing for use in multiple settings, it is
important to consider the test’s design. The majority of the studies mentioned above that
used magnitude comparison paradigms had their participants complete tasks on a
computer. One main advantage computer testing is the ability to measure reaction times
for each item. While this may be a significant plus for use of technology, it is not
necessarily practical for all educational settings. For example, in many areas of the
world, student access to computers is not feasible and the use of specialized software
along with computers is resource intensive. One solution is to use a paper-and-pencil
measure which can be just as efficient and has the major advantage of being much more
cost effective than computers. While paper-and-pencil tests may not allow for the
measurement of item-by-item response times, they can still be used to assess the number
of items completed within a certain period of time. Furthermore, this method has been
successfully used to capture meaningful individual differences in children’s mathematical
achievement (Chard et al., 2005; Durand, Hulme, Larkin & Snowling, 2005). Against this
background, I employed this simple method of design in assessing the basic magnitude
processing skills of primary school children.
1.8 Summary and Motivation of Current Study
Motivated by the studies described above, the aim of this thesis was to create a
paper-and-pencil test designed to measure basic symbolic and nonsymbolic magnitude
processing skills in children 5-9 years old. The following chapters are a collection of

27
three studies in which I describe the design of this measure, elementary school children’s
performance on this assessment, its relationship to individual differences in arithmetic,
and finally, its ability to predict children’s math performance over the long term. I also
aimed to characterize the nature of the relationship between symbolic and nonsymbolic
magnitude processing and each system’s unique contribution to children’s arithmetic
achievement. I now describe the contents of each chapter in more detail.
In Chapter 2 of this thesis, I present an experiment in which I administered the
paper-and-pencil test to children in Grades 1 to 3 and pursued several lines of
investigation. My first goal was to see if children’s performance on my test would
correlate with their math achievement scores as demonstrated in previous research using
computerized as well as paper-and-pencil measures (De Smedt, Verschaffel &
Ghesquière, 2009; Durand et al., 2005; Halberda, Mazzocco & Feigenson, 2008;
Holloway & Ansari, 2009; Mazzocco, Feigenson & Halberda, 2011). Secondly, I was
interested to see if my test could identify any age-related differences in numerical
magnitude processing as demonstrated in the work of Halberda and Feigenson (2008) and
Sekuler and Mierkiewicz (1977).
Along with studies showing a positive correlation between math achievement and
magnitude processing, studies have also shown that math achievement is related to
variables such as age, IQ, reading skills and working memory (DeSmedt, Taylor,
Archibald & Ansari, 2010; DeStefano & LeFevre, 2004; Kalaman & LeFevre, 2007).
Therefore, the third goal of Chapter 2 was to explore whether the relationship between
participants’ scores on my paper-and-pencil test would remain significant even when
controlling for these other potentially confounding variables.

28
Chapter 3 of this thesis describes a second study that focused on assessing the
psychometric soundness of the paper-and-pencil test. To do this, I investigated the
criterion-related validity, convergent validity and test-retest reliability of the paper-and-
pencil measure with a sample of Grade 1 children. I also investigated whether or not I
could replicate my previous findings demonstrating that children’s scores on the symbolic
items of the paper-and-pencil test could account for unique variance in arithmetic skills
over and above working memory.
Finally, in Chapter 4, I describe a study of kindergarten children’s performance on
my paper-and-pencil test. I was specifically interested to see if symbolic processing
would again account for unique variance in arithmetic skills and if nonsymbolic
processing would not. I also wanted to examine the convergent validity of the paper-and-
pencil test even more thoroughly by investigating whether or not children’s magnitude
comparison abilities correlated with their performance on the number line estimation
task. Finally, I examined whether performance on the paper-and-pencil test could predict
children’s math grades on their first term report card in Grade 1.
In summary, these three studies provide a detailed investigation into the
effectiveness of a simple paper-and-pencil test of basic magnitude processing. The data
presented will demonstrate its value as an assessment tool in children 5- 9 years old and
its potential use in the classroom.

29
1.9 References
Adams, M.J. (1990). Beginning to Read: Thinking and Learning About Print.
Cambridge, MA: MIT Press.
Ansari, D. (2008). Effects of development and enculturation on number
representation in the brain. Nature Reviews Neuroscience, 9, 278-291.
Ansari, D. & Karmiloff-Smith, A. (2002). Atypical trajectories of number
development: A neuroconstructivist perspective. Trends in Cognitive Sciences,
6(12), 511-516.
Booth, J., & Siegler, R.S. (2006). Developmental and individual differences in pure
numerical estimation. Developmental Psychology, 41(6), 189-201.
Brannon, E. (2006). The representation of numerical magnitude. Current Opinion in
Neurobiology, 16, 222-229.
Brannon, E., & Terrace, H. (1998). Ordering of the numerosities 1 to 9 by monkeys.
Science, 282, 746-749.
Brannon, E., & Terrace, H. (2002). The evolution and ontogeny of ordinal
numerical ability. In M. Bekoff, C. Allen, & G. M. Burghardt (Eds.), The
Cognitive Animal. (pp. 197-204). Cambridge, MA: MIT Press.
Buckley, P. B., & Gillman, C. B. (1974). Comparisons of digits and dot patterns. Journal
of Experimental Psychology, 103, 1131-1136.
Butterworth, B. (2005). The development of arithmetical abilities. Journal of Child
Psychology, 46 (1), 3-18.
Cantlon, J.F., & Brannon, E.M. (2006). Shared system for ordering small and large
numbers in monkeys and humans. Psychological Science, 17(5), 401-406.

30
Chard, D., Clarke, B., Baker, S.K., Otterstedt J., Braun D., & Katz, R. (2005). Using
measures of number sense to screen for difficulties in mathematics: Preliminary
findings. Assessment for Effective Intervention 30(2), 3-14.
Deheane, S. (1992). Varieties of numerical abilities. Cognition, 44, 1-42.
Dehaene, S. (1996). The organization of brain activations in number comparisons:
Event-related potentials and the additive-factors method. Journal of Cognitive
Neuroscience, 8(1), 47-68.
Dehaene, S., Dehaene-Lambertz, G., & Cohen, L. (1998). Abstract representations of
numbers in the animal and human brain. Trends in Neurosciences, 21, 355-361.
Dehaene, S., Izard, V., Spelke, E., & Pica, P. (2008). Log or linear? Distinct intuitions of
the number scale in Western and Amazonian indigene cultures. Science,
320(5880), 1217-1220.
DeSmedt, B., Taylor, J., Archibald, L., & Ansari, D. (2010). How is phonological
processing related to individual differences in children’s arithmetic skills?
Developmental Science, 13, 508-520.
DeSmedt, B., Verschaffel, L., & Ghesquiere, P. (2009). The predictive value of
numerical magnitude comparison for individual differences in mathematics
achievement. Journal of Experimental Child Psychology, 103, 469-479.
DeStefano, D., & LeFevre, J. (2004). The role of working memory in mental arithmetic.
European Journal of Cognitive Psychology, 16, 353-386.
Duncan, E., & McFarland, C. (1980). Isolating the effects of symbolic distance and
semantic congruity in comparative judgments: An additive-factors analysis.
Memory & Cognition, 8(6), 612-622.

31
Durand, M., Hulme, C., Larkin, R., & Snowling, M. (2005). The cognitive foundations
of reading and arithmetic skills in 7 to 10-year-olds. Journal of Experimental
Child Psychology, 91, 113-136.
Finnie, R., & Meng, R. (2001). Cognitive skills and the youth labour market. Applied
Economics Letters, 8, 675-679.
Gallsitel, C.R., & Gelman, R. (1992). Preverbal and verbal counting and computation.
Cognition, 44, 43-74.
Geary, D.C., Hoard, M.K., Nugent, L., & Bailey, D.H. (2013). Adolescents’ functional
numeracy in predicted by their school entry number system knowledge. PLoS
ONE 8(1): e5461.
Goswami, U. (2003). Why theories about developmental dyslexia require developmental
designs. Trends in Cognitive Sciences, 7(12), 534-540.
Halberda, J., & Feigenson, L. (2008). Developmental change in the acuity of the “number
sense”: the approximate number system in 3-, 4-, 5-, and 6-year-olds and adults.
Developmental Psychology, 44, 1457-1465.
Halberda, J., Mazzocco, M., & Feigenson, L. (2008). Individual differences in non-
verbal number acuity correlate with maths achievement. Nature, 455, 665-668.
Holloway, I., & Ansari, D. (2009). Mapping numerical magnitudes onto symbols: The
distance effect and children’s mathematical competence. Journal of Experimental
Child Psychology, 103(1), 17-29.
Kalaman, D. A., & LeFevre, J. (2007). Working memory demands of exact and
approximate addition. European Journal of Cognitive Psychology, 19, 187-212.

32
Kaufmann, L., Koppelstaetter, F., Delazer, M., Siedentopf, C., Rhomberg, P.,
Golaszewski, S.,..Ischebeck, A. (2005). Neural correlates of distance and
congruity effects in a numerical Stroop task: an event-related fMRI study.
Neuroimage, 25(3), 888-898.
Landerl, K., Bevan, A., & Butterworth, B. (2004). Developmental dyscalculia and basic
numerical capacities: a study of 8-9 year-old students. Cognition, 93, 99-125.
Laski, E., & Siegler, R. (2007). Is 27 a big number? Correlational and causal
connections among numerical categorization, number line estimation, and
numerical magnitude comparison. Child Development, 78(6), 1723-1743.
Libertus, M.E., Feigenson, L., & Halberda, J. (2011). Preschool acuity of the approximate
number system correlates with school math ability. Developmental Science, 14,
1292-1300.
Lipton, J.S., & Spelke, E.S. (2003). Origins of number sense: Large number
discrimination in human infants. Psychological Science, 14, 396-401.
Mazzocco, M., Feigenson, L., & Halberda, J. (2011). Preschoolers’ precision of the
approximate number system predicts later school mathematics performance. PloS
ONE 6(9): e23749.
Mee Bell, S., & McCallum, R.S. (2008). Handbook of Reading Assessment. Boston,
MA: Pearson Education, Inc.
Meck, W., & Church, R. (1983). A mode control model of counting and timing
processes. Journal of Experimental Psychology: Animal Behaviour Processes,
9(3), 390-407.

33
Moyer, R.S., & Landauer, T.K. (1967). Time required for judgments of numerical
inequality. Nature, 215(109), 1519-1520.
Mundy, E., & Gilmore, C.K. (2009). Children’s mapping between symbolic and
nonsymbolic representations of number. Journal of Experimental Child
Psychology, 103, 490-502.
Mussolin, C., Meijas, S., & Noel, M.P. (2010). Symbolic and nonsymbolic number
comparison in children with and without dyscalculia. Cognition, 115, 10-25.
Nieder, A., & Miller, E.K. (2003). Coding of cognitive magnitude: Compressed scaling
of numerical information in primate prefrontal cortex. Neuron, 37, 149-157.
Parsons, S., & Bynner, J. (2005). Does Numeracy Matter More? London, England:
National Research and Development Centre for Adult Literacy and Numeracy.
Paterson, S., Girelli, L., Butterworth, B., & Karmiloff-Smith, A. (2006). Are numerical
impairments syndrome specific? Evidence from Williams syndrome and Down’s
syndrome. Journal of Child Psychology and Psychiatry,47(2), 190-204.
Petitto, A. L. (1990). Development of numberline and measurement concepts. Cognition
and Instruction, 7, 55-78.
Pica, P., Lemer, C., Izard, V., & Dehaene, S. (2004). Exact and approximate arithmetic in
an Amazonian indigene group. Science, 306(5695), 499-503.
Piazza, M., Pica, P., Izard, V., Spelke, E., & Dehaene, S. (2013). Education enhances the
acuity of the nonverbal approximate number system. Psychological Science,
24(6), 1037-1043.
Rilling, M., & McDiarinid, C. (1965). Signal detection in fixed-ratio schedules, Science,
148, 526-527.

34
Romano, E., Babchishin, L., Pagani, L.S., & Kohen, D. (2010). School readiness and
later achievement: Replication and extension using a nationwide Canadian survey.
Developmental Psychology, 46, 995–1007.
Rousselle L., & Noël, M. (2007). Basic numerical skills in children with mathematics
learning disabilities: a comparison of symbolic vs. non-symbolic number
magnitude processing. Cognition 102(3), 361-95.
Sasanguie, D., Defever, E., Maertens, B., & Reynvoet, B. (2013). The approximate
number system is not predictive for symbolic number processing in
kindergartners. The Quarterly Journal of Experimental Psychology,
http://www.tandfonline.com/doi/abs/10.1080/17470218.2013.803581?journalCod
e=pqje20#.UbfcB-v7Cuw
Schneider, M., Grabner, R.H., & Paetsch, J. (2009). Mental number line, number line
estimation, and mathematical school achievement: Their interrelations in Grades 5
and 6. Journal of Educational Psychology, 101, 359–372.
Sekuler, R., & Mierkiewicz, D. (1977). Children’s judgments of numerical inequality.
Child Development, 48(2), 630-63.
Siegler, R.S., & Booth, J.L. (2004). Development of numerical estimation in young
children. Child Development, 75, 428-444.
Siegler, R. S., & Opfer, J. E. (2003). The development of numerical estimation: evidence
for multiple representations of numerical quantity. Psychological Science, 14(3),
237-243.
Siegler, R. S., & Mu, Y. (2008). Chinese children excel on novel mathematics problems
even before elementary school. Psychological Science, 19(8), 759-763.

35
Simon, T., Bearden, C., McDonald Mc-Ginn, D., & Zackai, E. (2005). Visuospatial and
numerical cognitive deficits in children with chromosome 22Q11.2 deletion
syndrome. Cortex, 41, 145-155.
Stanovich, K. E. (1986). Matthew effects in reading: some consequences of individual
diffferences in the acquisition of literacy. Reading Research Quarterly, 21(4),
360-407.
Starkey, P., & Cooper, R. (1980). Perception of numbers by human infants. Science,
210(4473), 1033-1035.
Van Oefflen, M.P., & Vos, P.G. (1982). A probabilistic model for the discrimination of
visual number. Perception & Psychophysics, 32(2), 163-170.
Vellutino, F., & Scanlon, D.M. (1987). Phonological coding, phonological awareness,
and reading ability: Evidence from longitudinal and experimental study. Merill-
Palmer Quarterly, 33, 321-364.
Washburn, D., & Rumbaugh, D. (1991). Ordinal judgments of numerical symbols by
macaques (macaca mulatta). Psychological Science, 2(3), 190-193.
Wynn, K. (1992). Children’s acquisition of number words and the counting system.
Cognitive Psychology, 24, 220-251.
Xu, F., & Spelke, E.S. (2000). Large number discrimination in 6-month-old infants.
Cognition, 74, B1-B11.
Zebian, S. & Ansari, D. (2012). Differences between literates and illiterates on symbolic
but not nonsymbolic numerical magnitude processing. Psychonomic Bulletin &
Review,19, 93-100.

36
Chapter 2
2. The Relationship Between Arithmetic Achievement and Symbolic and Nonsymbolic Numerical Magnitude Processing in Primary School: Evidence from a Paper-and-pencil Test
2.1 Introduction
There is growing evidence to suggest math skills are just as important as reading
skills when predicting a child’s academic success, and competence in mathematics is
crucial to one’s success in school and the workplace (Duncan et al., 2007; Romano,
Babchishin, Pagani & Kohen, 2010). Moreover, low numeracy skills are associated with
worse health care, greater likelihood of criminal behaviour, as well as higher risk for
depression and other illnesses (Parsons & Bynner, 2005).
Against this background, early identification of students at risk for developing
poor math achievement should be a key priority of education systems and their teachers
in the classroom. In the domain of reading, much progress in early diagnosis of at-risk
children has been made by focusing on processing competencies that are foundational to
reading, such as phonological awareness (Stanovich, Cunningham & Cramer, 1984;
Williams, 1984; Vellutino & Scanlon, 1987). Currently, math skills are most frequently
measured by using tests of skills that children are taught in school, such as basic
calculation abilities. Such tests, however, do not necessarily tap into the foundational
processes that allow children to acquire educationally-relevant skills, such as arithmetic
fluency.
2.1.1 Foundational Competencies of Mathematical Learning
So what might be the foundational competencies that serve as a scaffold for
children’s early mathematical learning? In order to process numbers it is necessary to

37
have an understanding of the magnitudes they represent (e.g., knowing that the Arabic
digit 3 stands for three items). Without an understanding of numerical magnitude and its
association with numerical symbols, the learning of mental arithmetic cannot get off the
ground. Therefore, tests aiming to characterize the foundational skills of children’s
numerical abilities should include measures of numerical magnitude processing. Research
has shed light onto how numerical magnitudes are represented by adult humans
(Dehaene, 1992; Moyer & Landauer, 1967), and over the last two decades, a large body
of research has been amassed which demonstrates that even infants (Starkey & Cooper,
1980; Wynn, 1992; Xu & Spelke; 2000) and non-human species (Brannon, 2006;
Dehaene, Dehaene-Lambertz & Cohen, 1998; Meck & Church, 1983) are capable of
numerical magnitude processing, when these magnitudes are represented
nonsymbolically (e.g., arrays of dots). Evidence of numerical magnitude processing
ability in infants and non-human animals and adults suggests that it is a basic, yet
important skill in number processing and may provide the basis for learning the
numerical meaning of numerical symbols.
To measure numerical magnitude processing in older children and adults, researchers
have frequently employed number comparison paradigms in which participants are asked
to choose which of two numbers is larger in numerical magnitude. As described in
Chapter 1, when individuals compare numerical magnitudes, an inverse relationship
between the numerical distance of two magnitudes and the reaction time required to make
a correct comparison is obtained (Moyer & Landauer, 1967). In other words, individuals
are faster and more accurate at judging which of two numbers is numerically larger when
the numbers are numerically more distant (e.g., 5 vs. 9) than when they are relatively

38
close (e.g., 5 vs. 6). This relationship between numerical distance and response times and
accuracy is known as the numerical distance effect (NDE).
A second effect that is observed in numerical magnitude comparison studies is the
numerical ratio effect (NRE; Moyer & Landauer, 1967). The NRE posits that individuals
are faster and more accurate at comparing two numbers of a smaller magnitude versus
two numbers of a larger magnitude, even when the distance between the numbers remains
constant (i.e., 3, 4 vs. 8, 9, where it takes participants longer to judge that 9 is larger than
8 then it does them to decide that 4 is larger than 3). Both the NDE and the NRE can be
observed with symbolic stimuli such as Arabic digits and nonsymbolic stimuli such as
arrays of dots (Buckley & Gillman, 1974).
2.1.2 The Relationship Between Magnitude Processing and Math Achievement
The finding that the numerical ratio between two numbers influences the speed with
which they can be accurately compared is consistent with Weber’s Law which states that
the just noticeable difference between two stimuli is directly proportional to the
magnitude of the stimulus with which the comparison is being made. This is reflected in
the NRE where a specific difference between two magnitudes results in a faster response
time the smaller the absolute values of the magnitudes being compared.
Against the background of the review of the existing literature described above, it is
clear that much has been uncovered about the characteristics of the representation and
processing of both symbolic and nonsymbolic numerical magnitudes across development
and species. A question resulting from this research, which has been a growing focus in
recent years, is whether individual differences in basic number processing are related to
between-subjects variability in mathematical achievement. In other words, are metrics of

39
numerical magnitude processing, such as the numerical distance and numerical ratio
effects, meaningful predictors of individual differences in children’s level of
mathematical competence? And if so, can such measures be used to detect children at
risk of developing mathematical learning difficulties, such as developmental dyscalculia?
In recent years, a growing number of studies have begun to answer this question. In
one of the pioneering studies in this area, Durand, Hulme, Larkin and Snowling (2005)
studied typically developing children between the ages of 7 – 10 years. Participants’
ability to compare symbolic numerical magnitudes (Arabic digits) as rapidly and as
accurately as possible was assessed using a numerical comparison task. In this task,
participants were required to judge which of two digits was numerically the larger. The
digits used ranged from 3-9 and the numerical distance between pairs was either one or
two. Participants had a 30 second time limit to complete 28 questions in which they
responded by choosing the larger magnitude in each pair. In addition, children’s
arithmetic skills were measured using the Numerical Operations subtest of the Wechsler
Objective Numerical Dimensions (WOND). In the WOND, children are required to write
Arabic numerals and complete simple and multi-digit addition, subtraction, multiplication
and division problems. Other items in the subtest involved fractions, decimals and
negative numbers. Participants were also given an arithmetic task in which they had one
minute to answer as many addition and subtraction problems as possible. The results of
the study indicated that individual differences in the accuracy of symbolic numerical
magnitude comparison were associated with between-subject variability in arithmetic
ability: students with higher accuracy on the digit comparison task were better at solving
addition and subtraction problems and received higher scores on the WOND than

40
students who performed comparatively more poorly on the number comparison task.
This finding demonstrates that a very basic skill such as magnitude comparison is related
to children’s performance on higher-order math skills.
More recently, Holloway and Ansari (2009) conducted a study to test the
relationship between individual differences in primary school children’s NDE and
achievement in math. In their study, 6-8 year-old children were required to compare
numerical magnitudes ranging from 1-9 presented in a symbolic (Arabic digits) or
nonsymbolic format (collection of black squares against a white background). The
numerical distance between both nonsymbolic and symbolic numerical magnitudes
ranged from 1 to 6. A significant negative relationship was found between math
achievement and the size of the symbolic NDE; however, this relationship did not hold
for the nonsymbolic NDE. These findings suggest that children who had larger symbolic
NDE’s had poorer math skills. Given that developmental studies (Sekuler &
Mierkiewicz, 1977; Holloway & Ansari, 2009) have shown that the NDE decreases over
developmental time, the association between the magnitude of the NDE and arithmetic
skills may suggest that children with relatively more immature (large) NDEs are also
those that have comparatively poorer arithmetic abilities.
The work of Durand et al. (2005) and Holloway and Ansari (2009) each
demonstrate a relationship between symbolic numerical magnitude processing and
individual differences in children’s arithmetic skills; however, both of these studies were
correlational in nature and used cross-sectional samples. The question remains whether
individual differences in magnitude comparisons can predict individual differences in
higher order math skills. To examine this matter, De Smedt, Verschaffel and Ghesquière

41
(2009) investigated whether numerical magnitude comparison has predictive value for
individual differences in mathematical achievement. At the beginning of Grade 1,
children completed a computerized symbolic numerical comparison task. Subsequently,
at the beginning of Grade 2, children’s math achievement was assessed using a
standardized achievement test for mathematics covering number knowledge,
understanding operations, simple arithmetic, word problems and measurement. Results
of their longitudinal study demonstrated that individual differences in children’s symbolic
NDE, measured at the beginning of Grade 1, were related to achievement in math, as
measured at the beginning of second grade. More specifically, children with small NDEs
in Grade 1 tended to have higher scores on the standardized math assessment taken one
year later. Furthermore, this association remained significant even when variables such
as age, intellectual ability and speed of processing were controlled.
Contrary to the findings by Holloway and Ansari (2009) the relationship between
numerical magnitude processing and achievement in math has also been demonstrated
with nonsymbolic numerical magnitudes. In particular, Halberda, Mazzocco and
Feigenson (2008) investigated the relationship between individual differences in
performance on a nonsymbolic number comparison task and variability in math
achievement in a group of sixty-four 14 year-old children. These participants were
followed longitudinally beginning from kindergarten to grade six and were annually
given a large number of standardized measures of numerical and mathematical processing
as well as standardized tests of IQ, vocabulary and working memory. In this study, the
children, at age fourteen, were shown an array of blue and yellow dots on a computer
screen. These arrays were only presented for 200 ms making it too quick for participants
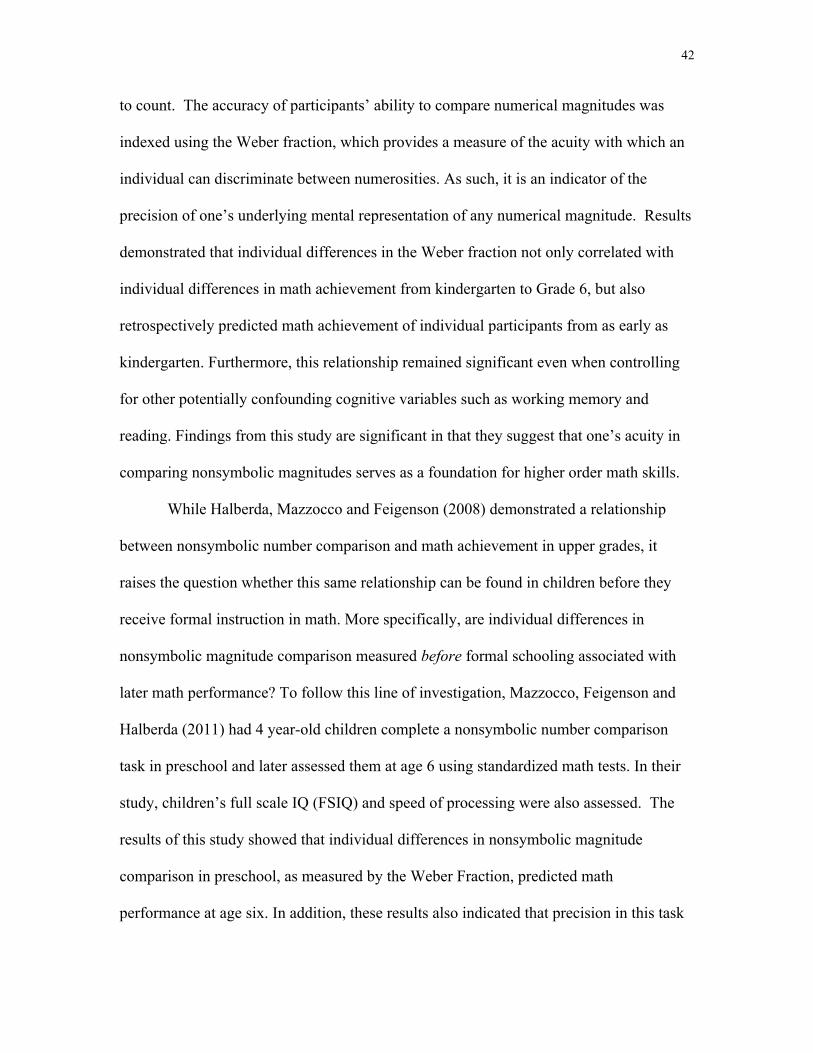
42
to count. The accuracy of participants’ ability to compare numerical magnitudes was
indexed using the Weber fraction, which provides a measure of the acuity with which an
individual can discriminate between numerosities. As such, it is an indicator of the
precision of one’s underlying mental representation of any numerical magnitude. Results
demonstrated that individual differences in the Weber fraction not only correlated with
individual differences in math achievement from kindergarten to Grade 6, but also
retrospectively predicted math achievement of individual participants from as early as
kindergarten. Furthermore, this relationship remained significant even when controlling
for other potentially confounding cognitive variables such as working memory and
reading. Findings from this study are significant in that they suggest that one’s acuity in
comparing nonsymbolic magnitudes serves as a foundation for higher order math skills.
While Halberda, Mazzocco and Feigenson (2008) demonstrated a relationship
between nonsymbolic number comparison and math achievement in upper grades, it
raises the question whether this same relationship can be found in children before they
receive formal instruction in math. More specifically, are individual differences in
nonsymbolic magnitude comparison measured before formal schooling associated with
later math performance? To follow this line of investigation, Mazzocco, Feigenson and
Halberda (2011) had 4 year-old children complete a nonsymbolic number comparison
task in preschool and later assessed them at age 6 using standardized math tests. In their
study, children’s full scale IQ (FSIQ) and speed of processing were also assessed. The
results of this study showed that individual differences in nonsymbolic magnitude
comparison in preschool, as measured by the Weber Fraction, predicted math
performance at age six. In addition, these results also indicated that precision in this task

43
at an early age significantly predicted later mathematical performance over and above
other cognitive skills, again demonstrating the important role of numerical magnitude
comparison ability for achievement in school mathematics.
In sum, while some studies suggest that symbolic but not nonsymbolic numerical
magnitude comparison performance is related to children’s arithmetic skills, other studies
have clearly shown that not only are nonsymbolic numerical magnitude processing skills
correlated with children’s math performance, but that such skills also predict arithmetic
achievement over the course of developmental time. Few studies have included both
symbolic and nonsymbolic numerical magnitude processing, and thus, it is unclear which
of these might be a stronger, unique predictor of children’s arithmetic achievement
scores.
2.1.3 Using Magnitude Processing in Formal Assessment
Empirical findings such as those discussed above, raise the question of whether or
not a quick, efficient and classroom friendly assessment tool could be designed to
formally measure basic magnitude processing in children. To partially address this
question, Chard and colleagues (2005) conducted a longitudinal study with kindergarten
and Grade 1 students using a symbolic numerical comparison task. At the beginning of
the school year (September), in the winter (January) and in the spring (May), participants
were required to complete the task in which they were to verbally select the larger of two
magnitudes ranging from 1-20. In the fall and spring of that same school year, they were
also given the Number Knowledge Test (Okamoto & Case, 1996) as a standardized
assessment of math achievement. The Number Knowledge Test comprises a math
assessment requiring participants to perform a variety of math skills such as counting,

44
comparing magnitudes and completing simple arithmetic problems. Findings indicated
that individual scores on the numerical comparison task correlated with children’s
performance on the Number Knowledge Test at both test periods.
It is important to note that, similar to the aforementioned Durand et al. (2005)
study, Chard et al. (2005) only examined symbolic magnitudes. Yet, as previously
discussed, there is substantial evidence for an association between nonsymbolic
magnitude processing and math abilities. Further, the Number Knowledge Test, like the
number comparison task, requires individuals to compare numerical magnitudes. This
weakens the correlational analysis conducted because the positive relationship revealed
could, at least in part, reflect an association between two forms of number comparison.
Finally, no other measures of cognitive performance were administered to participants.
Without controlling for these cognitive processes it is impossible to know whether or not
the relationship between magnitude comparison and math skills exists independently of
other cognitive factors such as IQ, working memory and reading ability, all of which
have been shown to correlate with children’s math achievement (Berg, 2008; DeStefano
& LeFevre, 2004; Kalaman & LeFevre, 2007; Koponen, Aunola, Ahonen & Nurmi,
2007).
Taken together, previous research strongly suggests a relationship between, on the
one hand, both symbolic and nonsymbolic number comparison and, on the other hand,
individual differences in math achievement. Preliminary research has also demonstrated
that an assessment of children’s symbolic magnitude processing is related to math
performance, particularly arithmetic achievement (Chard et al., 2005). What remains to
be elucidated is whether a basic paper-and-pencil assessment, suitable for use in

45
classrooms everywhere, measuring the accuracy of both children’s symbolic and
nonsymbolic magnitude comparison abilities can reveal relationships between individual
differences in numerical magnitude processing, both symbolic and nonsymbolic, and
variability in arithmetic skills. Furthermore, whether a test of this kind can capture
developmental changes in numerical magnitude processing also requires investigation.
This is important because in order for results from such a test to be interpreted
meaningfully, performance on the test should change as a function of chronological age
(i.e., older children should perform better than younger children).
A basic paper-and-pencil assessment would be a valuable tool for several reasons.
To begin, it would be very economical due to its low cost in comparison to computerized
versions of the test that require specialized equipment and software. A test of this kind
could also be quickly and easily administered and scored by the teacher in a large group
setting. This would allow teachers to assess the individual differences in basic numerical
magnitude processing competence among their students. As this test would not require
specialized software, it could be used by educators in any setting, such as schools with
few resources, or classrooms in developing countries, and could be easily integrated into
large scale studies that may be run by school boards, agencies or local governments.
2.1.4 Other Predictors of Math Achievement
The studies discussed above demonstrate that individual differences in basic
magnitude processing are related to children’s math scores. In this context it is important
to acknowledge that magnitude processing is not the only (or strongest) predictor of
individual differences in math achievement. There is a large body of evidence
demonstrating that math performance is related to cognitive abilities such as working

46
memory. For example, working memory has been shown to play an important role in
math skills such as solving both simple and complex arithmetic problems (DeStefano &
LeFevre, 2004; Kalaman & LeFevre, 2007). Furthermore, poor working memory has
been related to developmental disabilities in math (Geary, 1993). Meanwhile, math
performance has also been found to be related to literacy skills. For instance, Berg
(2008) and Koponen et al. (2007) demonstrated a significant relationship between math
achievement and reading. Similarly, De Smedt, Taylor, Archibald and Ansari (2010)
found a significant relationship between math performance such as arithmetic calculation
and phonological processing. Thus, when studying the role played by basic numerical
magnitude processing in math achievement, it is important to consider these other
predictors and to estimate the unique variance explained by numerical magnitude
processing measures.
In light of these findings, the objectives of the current chapter were threefold.
First, I wanted to investigate whether a basic paper-and-pencil measure of symbolic and
nonsymbolic number processing could characterize developmental changes in basic
numerical magnitude processing, such as age-related improvement in accuracy of
numerical comparisons. My second goal was to explore whether performance on such a
basic assessment tool of magnitude processing is capable of explaining variability in
children’s math achievement scores. Third, I wanted to determine whether the test
explained significant variance over other factors such as working memory and reading
skills.

47
2.2 Methods
2.2.1 Participants
A total of 197 students in Grades 1-3 participated in the current chapter. Eleven
students were removed due to incorrect completion of the digit comparison task such as
skipping pages of items or marking their responses in an unclear manner. Another four
were removed from analysis due to performing at ceiling on the task (that is, they
completed all trials correctly within the time-limit allotted). Twelve more children were
removed due to their inability to reach a basal score on the Math Fluency and Calculation
subtests of the Woodcock-Johnson III Subtests of Achievement (WJ III; see below). For
the Math Fluency test, any participant who had three or fewer items correct after one
minute did not reach basal. For the Calculation test, if a child did not respond correctly to
at least one of two practice items, the child did not reach basal and testing was
discontinued. Five children were not able to reach basal on the Reading Fluency test of
the WJ III; that is, they had fewer than three items correct on the four practice exercises.
Three children did not reach basal on the Vocabulary subtest of the Wechsler
Abbreviated Scale of Intelligence (WASI; see below). In the Vocabulary subtest of the
WASI, testing began on the fourth item. If the participant did not receive a perfect score
on the fourth and fifth items, then the examiner administered the first three items in
reverse order. Testing was discontinued after three consecutive scores of zero. In the
Automated Working Memory Assessment (AWMA; see below), one child did not reach
basal on the Spatial Recall subtest and one child did not reach basal on the Listening
Recall subtest meaning the participant failed to correctly answer the first three items on
each subtest. For each subtest of the AWMA, testing was discontinued if the participant

48
failed to correctly answer the first three items. Therefore, my final sample included 160
children (83 females) between the ages of 6 years, 4 months and 9 years, 7 months (Mage
= 8 years, 1 month, SD = 9.38 months). Twenty-six children were in Grade 1 (Mage = 6
years; 8 months, SD = 3.71 months), 56 children were in Grade 2 (Mage = 7 years; 8
months, SD = 3.43 months) and 78 children were in Grade 3 (Mage = 8 years; 8 months,
SD = 3.43 months). All participants spoke English fluently and had normal or corrected
to normal vision.
Permission was granted from a local school board and school principals to recruit
students from elementary schools in a region of Southwestern Ontario. Letters of
information and consent forms approved by the University of Western Ontario’s
Research Ethics Board were received and completed by parents of the participants before
the study began. Interested parents representing 36 schools in both urban and rural areas
consented to having their child(ren) participate in the current study. Participants were
from various socioeconomic and ethnic groups.
2.2.2 Materials and Design
2.2.2.1 Magnitude Comparison
During the magnitude comparison task, participants were required to compare pairs of
magnitudes ranging from 1-9. Stimuli were given in both symbolic (56 digit pairs) and
nonsymbolic (56 pairs of dot arrays) formats. In both formats of presentation, each
numerical magnitude was counterbalanced for the side of presentation (i.e., 2|7, 7|2).
Furthermore, in the nonsymbolic form, dot stimuli were controlled for area and density.
To control for area and density, half of the dot arrays used were matched for total area
and half of the dot arrays were matched for total perimeter. In other words, half of the

49
trials had equal area while the other half had equal perimeter. The array with the most
dots had a greater perimeter when cumulative surface area was matched. The array with
the most dots had more cumulative surface area when perimeter was matched. To avoid
having the participant rely on the relative size of the dot arrays, both perimeter-matched
and area-matched trials were presented randomly. To ensure that the test items became
increasingly difficult, the numerical ratio between the numerical magnitudes presented
was manipulated. Easier items (with smaller ratios) were presented first and more
difficult items were presented next (increasingly larger ratios). By starting with the easier
items, this ensured that children remained motivated to complete the task. The order of
trials in our assessment was similar to the order of ratios presented in Table 1. Order was
slightly varied between symbolic and nonsymbolic conditions to ensure that the order of
presentation of items was not identical between conditions, but both followed a similar
pattern where pairs of symbolic and nonsymbolic stimuli with relatively smaller ratios
were presented before larger ratios. The ratio (small/large) between numerical pairs
ranged from .11 to .89, for example the ratio between 3 and 5 is .60 (see Table 2.1 for
pairs and ratios used).

50
Table 2.1 Numerical pairs and ratios for the numerical comparison task. Number pair Ratio
1-9 0.11 1-8 0.13 1-7 0.14 1-6 0.17 1-5 0.2 2-9 0.22 2-8 0.25 2-7 0.29 3-9 0.33 3-8 0.38 2-5 0.4 3-7 0.43 4-9 0.44 3-6 0.5 4-8 0.5 5-9 0.56 4-7 0.57 3-5 0.6 5-8 0.63 2-3 0.67 5-7 0.71 6-8 0.75 7-9 0.78 4-5 0.8 5-6 0.83 6-7 0.86 7-8 0.88
8-9 0.89

51
During the test, participants were told to cross out the larger of the two
magnitudes and were given one minute to complete the symbolic condition and one
minute to complete the nonsymbolic condition. To ensure that participants understood the
task, each child completed three sample items with the examiner and then nine practice
items on their own before beginning the assessment (see Figs. 2.1a & 2.1d). This was
done for both symbolic and nonsymbolic conditions. During the instructions given for
the nonsymbolic condition, participants were told not to count the dots. Examiners were
again able to emphasize this instruction during the participants’ completion of the
practice items. The order of format presentation was varied in such a way that half of the
students in each grade received the symbolic items first and the other half received the
symbolic items second (see Fig. 1 for sample of test pages).
2.2.2.2 Arithmetic Skills
In order to determine the subjects’ competence in mathematics, the Woodcock-
Johnson III Subtests of Achievement (WJ III; Woodcock, McGrew & Mather, 2001) was
used. Each child was required to complete the Math Fluency and Calculation subtests.
The Calculation subtest measures skills in mathematical computations. The individual is
required to perform addition, subtraction, multiplication and division and combinations of
these operations. There is no time constraint. The Math Fluency test assesses the ability
to quickly solve simple arithmetic problems. The participant is given three minutes to
complete as many addition, subtraction and multiplication problems as possible. It
should be noted that neither of the subtests contained any item that required numerical
comparison.

52
a b c
practice items
d e f
practice items
Figure 2.1 Paper-and-pencil measure. Figures a, b and c are examples of symbolic items.
Figures d, e and f are examples of nonsymbolic items.

53
2.2.2.3 Reading Skills
In order to assess the reading ability of each participant, children were given the
Reading Fluency subtest of the WJ III (Woodcock, McGrew & Mather, 2001). This test
requires the individual to quickly read simple sentences and to decide if the sentences are
true or false by circling “yes” or “no” in the response booklet.
2.2.2.4 Intelligence
Cognitive ability was measured using two subtests of the Wechsler Abbreviated
Scale of Intelligence (WASI; Wechsler, 1999).
Vocabulary. Items of the Vocabulary subtest assess the individual’s ability to define
words. Initial items require subjects to name pictures of objects. Later items require
subjects to verbally define words that are read by the examiner.
Block Design. During this subtest the child is given a specific time frame to manipulate
blocks with the goal of replicating a stimulus design that has been visually presented.
2.2.2.5 Working Memory
The Automated Working Memory Assessment (AWMA; Alloway, 2007) is a
standardized computer-based tool used to assess both verbal and visual-spatial working
memory skills. Verbal working memory was measured using the Counting Recall and
Listening Recall sub-tests while visual-spatial working memory was measured using the
Odd-One-Out and Spatial Recall sub-tests. All tasks follow a span procedure such that
items in the list increase when the child completes at least 4 of 6 lists correctly and the
task is discontinued when the child fails three items at any list length.

54
Counting Recall. During this task, students count the circles in a series of shape arrays
and are required to recall the serial totals verbally. At each level, the task becomes
increasingly difficult as the number of arrays shown increases.
Listening Recall. This task requires the individual to listen to a sentence, to decide if the
statement is true or false, and then to repeat the last word of the phrase heard. As the test
continues, participants are presented with two to a maximum of six sentences at a time.
Odd-One-Out. During this subtest, the child is quickly presented with three stimuli of
which one is slightly different from the others. The child is required to point to the “odd-
one-out” and is then presented with another screen on which the stimuli are replaced by
three blank squares. The child is then asked to point to where the stimulus that was the
odd-one-out was originally located. In subsequent trials, the subject is presented with up
to seven different sets of stimuli in a row after which he or she is presented with the
screen with the blank squares and is asked to point to where each odd stimulus was
located in the same order in which they were originally presented.
Spatial Recall. During this task, individuals are shown two stimuli on a computer screen
that are either oriented in a similar direction or in an opposite fashion. The stimulus on
the right also has a red dot located at one of three positions. The participant is first
required to determine whether the stimuli are oriented in a similar or opposite fashion by
saying “same” or “opposite.” Following this, another screen is presented that displays
three black dots corresponding to the three possible positions for the red dots presented
with stimuli on the right from the previous screen. In this case the child is asked to point
to one of the black dots to indicate where the red dot had been located on the original
stimuli.

55
2.2.3 Procedure
The current chapter was part of a large-scale study wherein children’s reading,
math and language skills were tested. All participants were assessed at their respective
elementary school in three one-hour sessions over a period of three weeks at the end of
the school year. Each participant was tested individually by trained examiners in a quiet
area outside of the classroom.
2.3 Results
2.3.1 Descriptive Statistics
Participants’ ages along with the means and standard deviations for each test
administered are shown in Table 2.2.
2.3.2 Age Differences in Basic Magnitude Processing Skills
In order to investigate whether this assessment could identify age differences in
magnitude processing, a repeated measures ANOVA using format (symbolic and
nonsymbolic) as a within subjects variable and grade (1st, 2nd and 3rd grades) as a between
subjects variable was conducted. Analyses revealed no main effect of format (F(1, 157) =
.311, ns). A main effect of grade (F(2, 157) = 14.18, p < .001, η2 = .15 ) was found
whereby Grade 2 children performed significantly higher on symbolic comparison
compared to Grade 1 children (t(71) = -3.62, p < .001); however, there was no significant
difference between Grade 1 and 2 participants on their nonsymbolic comparison scores
(t(71) = -.969, ns). Grade 3 participants performed significantly higher than Grade 1
students on both symbolic (t(111) = -5.55, p <.001) and nonsymbolic comparison

56
(t(111) = -3.36, p <.001). Grade 3 children also performed significantly higher than
Grade 2 students on symbolic (t(132) = -2.27, p < .05) and nonsymbolic (t(132) = -2.95,
p < .05) comparison. A format x grade interaction was also found, (F(2, 157) = 6.61, p <
.001, η2 = .08; see Fig. 2), whereby Grade 1 children were more accurate on the
nonsymbolic items (t(25)= -3.21, p < .05) compared to symbolic items. In contrast, there
was no significant difference between formats in the Grade 2 (t(55) = 1.38, p = .17) or
Grade 3 (t(77) = 1.40, p = .165) participants.
2.3.3 Investigating the Relationship Between Basic Magnitude Processing and Arithmetic Performance
Correlations were calculated for the following variables across all three grades
(see Table 2.3): Math Fluency raw scores, Calculation raw scores, verbal working
memory raw scores, visual-spatial working memory raw scores, symbolic score (total
number of correctly solved symbolic comparison trials), nonsymbolic score (total number
of correctly solved nonsymbolic comparison trials), total score (total number of correctly
solved comparison trials across both symbolic and nonsymbolic), IQ raw scores and
Reading Fluency raw scores.1 To perform this analysis, a partial correlation was
performed controlling for age. In other words, the effect of chronological age on
participants’ raw scores on all standardized tests was removed.
1 I chose to use raw scores in my analysis because in a preliminary analysis it was found that age negatively correlated with Math Fluency, Calculation, IQ and Reading Fluency standard scores. Such a negative correlation is not expected because standard scores are adjusted for chronological age and thus there should be no relationship between chronological age and standard scores. By using the raw scores I avoid using a measurement that is related to a reference group that may not be fully representative of the one tested in the present study.

57
As seen from Table 2.3, the total score (symbolic and nonsymbolic combined) on
the magnitude comparison task significantly correlated with Math Fluency and
Calculation scores (see Figs. 2.3 & 2.4). The total score also correlated with each IQ
subtest and each working memory subtest except Counting Recall. Symbolic and
nonsymbolic scores each significantly correlated with Math Fluency, Calculation, and
Reading Fluency. Symbolic mean scores were found to significantly correlate with each
standardized test with the exception of Counting Recall. Nonsymbolic test scores
correlated with the Block Design subtest, but did not significantly correlate with the
Vocabulary subtest, nor any of the working memory subtests. Both Math Fluency and
Calculation correlated significantly with each of the standard tests that were
administered. Reading Fluency correlated with all measures except Spatial Recall and
Block Design. Turning to memory skills, Odd-One-Out scores correlated with each
standardized measure. Spatial Recall correlated with each standardized assessment with
the exception of Vocabulary. Listening Recall correlated with each standardized
assessment except Vocabulary and Counting Recall scores correlated with all measures
except Block Design.

58
Table 2.2 Means and Standard Deviations (S.D.)
Test N Mean Raw Scores (S.D.) Range (min.-max.) Mean Standard Scores (S.D.) Range (min.-max.)
Age (months) 160 97.54 (9.38) 77 - 115 N/A N/A Symbolic 160 36.65 (7.82) 16 - 55 N/A N/A Nonsymbolic 160 36.40 (6.01) 21 - 54 N/A N/A Math Fluency 160 31.23 (13.05) 4 - 75 92.60 (13.60) 65 - 136 Calculation 160 10.26 (3.09) 1 - 17 95.05 (15.36) 29 - 135 Listening Recall 160 10.00 (3.04) 4 - 20 103.29 (11.45) 78 - 135 Counting Recall 160 15.56 (4.35) 5 - 31 103.31 (13.74) 71 - 133 Odd-One-Out 160 17.50 (4.14) 3 - 29 110.76 (13.24) 71 - 133 Spatial Recall 160 14.35 (4.68) 1 - 26 104.84 (13.61) 69 - 137 Vocabulary1 160 28.04 (5.86) 13 - 43 49.73 (8.49) 29 - 69 Block Design1 160 16.51 (10.11) 3 - 48 53.65 (10.14) 34 - 80 Reading Fluency 160 28.66 (11.37) 2 - 57 101.90 (10.51) 75 - 142 Note. Symbolic - total correct scores on symbolic items; Nonsymbolic - total correct scores on nonsymbolic items; Math Fluency –scores received on WJ-III; Calculation – scores received on WJ-III; Listening Recall – scores received on AWMA; Counting Recall – scores received on AWMA; Odd-One-Out – scores received on AWMA; Spatial Recall – scores received on AWMA; Vocabulary – scores received on WASI; Block Design – scores received on WASI; Reading Fluency – scores received on WJ-III. 1 The WASI uses a population mean of 50 and standard deviation of 10.

59
Figure 2.2. Grade by format interaction. Bar graph representing overall performance of
participants in each grade for symbolic and nonsymbolic items. Grade 1 participants
were significantly better at nonsymbolic items compared to symbolic items. Participants
in grades 2 and 3 did not demonstrate any differences between conditions. Standard
errors are represented by the error bars attached to each column.
0
5
10
15
20
25
30
35
40
45
Grade 1 Grade 2 Grade 3
Mag
nitu
de c
ompa
rison
scor
es
symbolic nonsymbolic

60
Table 2.3 Partial correlations controlling for age in months (Gr. 1-3)
Variable 1 2 3 4 5 6 7 8 9 10 11 12
1. MF - .64** .40** .45** .38** .28** .34** .30** .17* .43** .33** .43** 2. MC - .31** .35** .28** .29** .43** .41** .35** .35** .26* .34** 3. RF - .32** .13 .39** .19* .33** .05 .31** .27* .33** 4. OOO - .51** .31** .40** .22* .27* .31** .15 .26* 5. SR - .22* .26* .15 .30** .21* .12 .19* 6. LR - .44** .32** .05 .18* .12 .18* 7. CR - .33** .23* .15 .03 .11 8. Vocab - .25* .16* .11 .16* 9. BD - .20* .34** .30** 10. sym - .59** .92** 11. non-sym - .87** 12. overall - Note. MC - Calculation; MF - Math Fluency; RF - Reading Fluency; OOO – Odd-One-Out; SR – Rpatial Recall; LR– Listening Recall; CR – Counting Recall; Vocab – Vocabulary; BD – Block Design; Sym – symbolic mean score; Non-sym – nonsymbolic mean score; Overall – overall mean score
* p < .05. ** p < .01.

61
Further analyses were conducted on the significant association between magnitude
comparison and arithmetic achievement to examine the relationship between performance
on the paper-and-pencil assessment and test scores for each grade level. As can be seen
in Table 2.4, for Grade 1, I found no significant relationship between Math Fluency
scores and performance on the symbolic items (r = .34, ns) or nonsymbolic items (r =
.25, ns). There was, a significant relationship between Calculation scores and
symbolic performance (r = .52, p < .01); however, there was no correlation between
Calculation scores and performance on nonsymbolic items (r = .25, ns). Table 2.5
demonstrates that in Grade 2 a significant relationship between students’ Math Fluency
scores and symbolic performance (r = .42, p < .01) and also between Math Fluency
scores and nonsymbolic performance (r = .33, p < .05) was obtained. In addition, there
was also a significant relationship between Calculation performance and symbolic scores
(r = .31, p < .01), but there was no significant correlation between Calculation and
nonsymbolic performance (r = .15, ns). Participants in the third grade (see Table 2.6)
demonstrated a significant relationship between Math Fluency scores and symbolic items
(r = .45, p < .01) as well as a significant correlation between Math Fluency and
nonsymbolic items (r = .33, p < .01). Significant associations were also found between
Calculation scores and symbolic scores (r = .30, p < .01) along with a significant
correlation between Calculation scores and nonsymbolic performance (r =.35, p < .01).

62
Figure. 2.3. Scatterplot showing significant correlation between standard scores on the Math Fluency subtest of the Woodcock-
Johnson III battery and overall mean score of the magnitude comparison task (symbolic and nonsymbolic combined) for all
participants. The solid line represents the linear regression line for this relationship.
0
20
40
60
80
100
120
-30 -20 -10 0 10 20 30 40 50
Mag
nitu
de c
ompa
rison
sco
res
Residual Math Fluency Raw scores (controlling for chronological age)

63
Figure 2.4. Scatterplot showing significant correlation between standard scores on the Math Calculation subtest of the Woodcock-
Johnson III battery and overall mean score of the magnitude comparison task (symbolic and nonsymbolic combined) for all
participants. The solid line represents the linear regression line for this relationship.
0
20
40
60
80
100
120
-12 -10 -8 -6 -4 -2 0 2 4 6 8
Mag
nitu
de c
ompa
rison
sco
res
Residual Math Calculation Raw scores (controlling for chronological age)

64
Table 2.4 Grade 1 correlations between arithmetic achievement and magnitude comparison Variable 1 2 3 4 5 1. MF - .73** .34 .25 .34 2. MC - .52** .25 .44* 3. Sym. - .56** .88** 4. Nonsym. - .87** 5. Overall - Note. MC – Calculation raw scores; MF - Math Fluency raw scores; Sym. – symbolic mean score; Non-sym. – nonsymbolic mean score; Overall – overall mean score
* p < .05. ** p < .01.
Table 2.5
Grade 2 correlations between arithmetic achievement and magnitude comparison
Variable 1 2 3 4 5 1. MF - .59** .42** .33* .41** 2. MC - .31* .15 .27* 3. Sym. - .68** .94** 4. Nonsym. - .88** 5. Overall - Note. MC – Calculation raw scores; MF - Math Fluency raw scores; Sym. – symbolic mean score; Non-sym. – nonsymbolic mean score; Overall – overall mean score
* p < .05. ** p < .01.

65
Table 2.6
Grade 3 correlations between arithmetic achievement and magnitude comparison
Variable 1 2 3 4 5 1. MF - .62** .45** .33** .45** 2. MC - .30** .35** .37* 3. Sym. - .56** .90** 4. Nonsym. - .86** 5. Overall - Note. MC – Calculation raw scores; MF - Math Fluency raw scores; Sym. – symbolic mean score; Non-sym. – nonsymbolic mean score; Overall – overall mean score
* p < .05. ** p < .01.

66
I then examined whether this grade-related difference in the strength of the
correlations between, on the one hand, the symbolic and nonsymbolic performance and,
on the other hand, Math Fluency and Calculation scores were statistically significant. In
other words, whether the nonsignificant correlations in Grade 1 differed significantly
from the significant correlations in the other grades. To do this I transformed correlation
coefficients into Fisher’s z statistics and then made comparisons using a z test. For the
association between the symbolic items and Math Fluency scores, the correlation for the
Grade 1 students was not significantly different from that of the Grade 2 students
(z = -0.37, ns) or the Grade 3 students (z = -0.55, ns). The difference between the Grade
2 and Grade 3 correlations was also not significant (z = -0.21, ns). Similarly, for the
association between the nonsymbolic items and Math Fluency scores, the correlation
between the students in Grade 1 compared to the correlation for Grade 2 students was not
significantly different (z = -0.35, ns) or for the students in the third grade (z = -0.37, ns).
The difference between the correlations for Grade 2 and Grade 3 were also nonsignificant
(z = -0.03, ns). Likewise, for the relationship between performance on symbolic items
and Calculation scores, the correlation coefficient for Grade 1 was once more not
significantly different from the correlation for either Grade 2 (z = 1.02, ns) or for Grade 3
(z = 1.12, ns). Additionally, the correlation for the Grade 2 students did not differ
significantly from the correlation for students in Grade 3 (z = .006, ns). Finally, the
differences found between the correlations of nonsymbolic items and Calculation scores
were nonsignificant between the Grade 1 and Grade 2 students (z = 0.42, ns) as well as
the Grade 1 and Grade 3 students (z = -.046, ns). Similarly, no significant difference was
found between the correlations of the Grade 2 and Grade 3 students (z = -1.19, ns).

67
Thus while the correlations in Grade 1 between math scores and symbolic and
nonsymbolic performance on the paper-and-pencil test do not pass the threshold for
statistical significance (likely due to the comparatively small sample size), these
correlations do not significantly differ from the ones in grades two and three. Therefore,
a true developmental change in the relationships between arithmetic performance and the
present measure of symbolic and nonsymbolic numerical magnitude processing cannot be
supported by the present data. Instead the difference in the correlational strengths is
likely due to differential sample sizes and, importantly, the correlations are significant
when all three samples are collapsed into one group.
2.3.4 Investigating the Variance Accounted for in Arithmetic Achievement Using Reading, Working Memory, IQ, Symbolic and Nonsymbolic Performance on the Paper-and-pencil Test as Predictors.
Since Reading Fluency, verbal working memory, visual spatial working memory
and IQ each correlated with children’s scores on Math Fluency and Calculation, the
specificity of the key relationship between number comparison and arithmetic skills
needed to be further investigated. To do so, two linear regressions were performed: one
to examine the relationship between Math Fluency (dependent variable), symbolic and
nonsymbolic total score while controlling for age, verbal working memory, visual-spatial
working memory, IQ and Reading Fluency; and the other, to examine the relationship
between Calculation (dependent variable), symbolic and nonsymbolic total score while
controlling for age, verbal working memory, visual-spatial working memory, IQ and
Reading Fluency. Since no hypotheses were made about the order of predictors, and in an
effort to investigate which variables accounted for significant unique variance, all
predictor variables were entered as one step (see Tables 2.7 & 2.8).

68
Results demonstrated that my first linear regression using Math Fluency as a
dependent variable was significant (F(10, 159) = 14.41, p < .001, R2 = .492). In this
model I found that only performance on Reading Fluency, Spatial Recall, Counting
Recall and symbolic items account for significant unique variance in Math Fluency.
Performance on nonsymbolic items did not account for significant unique variance in
Math Fluency.
The second regression analysis using Calculation as a dependent variable was also
significant (F(10, 159) = 15.67, p < .001, R2 = .513) and demonstrated that performance
on Counting Recall, Vocabulary, Block Design and symbolic items account for
significant unique variance in Calculation. Again, as in Math Fluency, performance on
nonsymbolic items did not account for significant unique variance.
Table 2.7 Linear regression analyses predicting Math Fluency raw scores with chronological age, Reading Fluency, visual spatial working memory, verbal working memory, IQ, symbolic scores and nonsymbolic scores as predictors. Math Fluency
Predictor β t ΔR2
Age .014 .187 .00012 Reading .208* 2.49 .02110 Odd-One-Out .148 1.91 .01240 Spatial Recall .183* 2.51 .02142 Listening Recall -.029 -.375 .00048 Counting Recall .159* 2.14 .01566 Vocabulary .088 1.24 .00523 Block Design -.066 -.912 .00284 Symbolic .197* 2.35 .01878 Nonsymbolic .128 1.56 .00831 * p < .05.

69
Table 2.8
Linear regression analyses predicting Calculation raw scores with chronological age, Reading Fluency, visual spatial working memory, verbal working memory, IQ, symbolic scores and nonsymbolic scores as predictors. Calculation
Predictor β t ΔR2
Age .126 1.72 .00973 Reading .126 1.53 .00770 Odd-One-Out .027 .355 .00042 Spatial Recall .049 .693 .00158 Listening Recall .020 .268 .00024 Counting Recall .226* 3.11 .03171 Vocabulary .157* 2.26 .01672 Block Design .186* 2.61 .02228 Symbolic .170* 2.07 .01411 Nonsymbolic .013 .164 .00009 * p < .05.

70
2.4 Discussion
The purpose of this chapter was to extend previous research in three principal
ways: 1) to investigate whether a basic paper-and-pencil measure of symbolic and
nonsymbolic numerical magnitude processing could be used to measure age differences
in basic numerical magnitude processing skills, 2) to explore whether performance on this
basic assessment tool is related to individual differences in children’s performance on
measures of arithmetic achievement, and 3) to determine whether it explains significant
variance over other factors such as age, working memory, reading skills and IQ.
With regards to the first aim of this chapter, I found age differences in the
performance of children on the paper-and-pencil measure. Specifically, analyses
demonstrated a main effect of grade, which indicates that children improved in the
magnitude comparison task as they became older, replicating previous findings and
suggesting that this test, like computerized measures, can be used to characterize
developmental changes in numerical magnitude processing. Furthermore, a format by
grade interaction was also found whereby Grade 1 students were the only age group that
performed significantly better on the nonsymbolic than symbolic items. This finding
demonstrates that younger children were more accurate at nonsymbolic number
processing than symbolic processing, whereas older children did not show this difference.
These results indicate that over the course of developmental time, typically developing
children become more proficient with symbolic number processing as they progress in
school and acquire more familiarity and automaticity with numerical symbols. Moreover,
these results also suggest that perhaps young children have strong pre-existing
representations of nonsymbolic numerical magnitude (that can even be found in infancy)

71
and only gradually map these onto symbolic representations.
The results from the current chapter also demonstrated that participants’ scores on
this basic assessment tool significantly correlated with their scores on standardized tests
of arithmetic achievement. More specifically, a significant positive relationship was
found between Math Fluency, Calculation and the accuracy with which participants
completed the symbolic items, nonsymbolic items and overall total scores on the
magnitude comparison task. This finding indicates that children who scored highly on
Calculation and Math Fluency also tended to receive high scores on my test. Also, this
association of numerical magnitude comparison skills and individual differences in
arithmetic skills replicates findings in earlier work. For instance, the positive correlation
found in the current study between performance on a timed numerical comparison task
and individual differences in arithmetic performance replicates the work of Durand,
Hulme, Larkin and Snowling (2005), but provides further constraints not afforded by
prior research. For example, Durand, Hulme, Larkin and Snowling (2005) only used
digits from 3-9 with digit pairs differing only by a magnitude of one or two. By including
a larger range of digits, greater magnitudes separating each digit pair, as well as
nonsymbolic stimuli in the current study, my results significantly expand upon the
Durand et al. (2005) findings. For example, including nonsymbolic items could allow for
this test to be used with children who do not yet have an understanding of number
symbols.
Finally, a key finding from this chapter indicated that performance on the
symbolic items accounts for unique variance in arithmetic skills. Interestingly, this same
result was not found for performance on the nonsymbolic items as demonstrated in

72
previous research (Halberda, Mazzocco & Feigenson, 2008; Mazzocco, Feigenson &
Halberda, 2011). Specifically, I found that while simple correlations show that both
symbolic and nonsymbolic magnitude comparison are related to arithmetic achievement,
only symbolic comparison accounted for unique, significant variance in children’s
performance on the standardized tests of arithmetic achievement. Since the simple
correlations revealed that accuracy on both the symbolic and nonsymbolic tasks
independently correlated with math achievement, it is possible that they share variance
related to core magnitude processing, but that nonsymbolic does not contribute any
additional, unique variance to math performance while symbolic does. I speculate that the
unique variance accounted for by symbolic processing is related to recognizing numerals
and mapping numerals to magnitudes – a skill that is important in the mental
manipulation of digits during calculation. While it is possible that symbolic and
nonsymbolic magnitude comparison share variance related to numerical magnitude
processing, it is equally plausible that their shared variance (and the absence of unique
variance accounted for by the nonsymbolic task) is explained by non-numerical factors
that are tapped by both tasks, such as speed of processing, attention, working memory or
a complex combination of these factors and numerical magnitude processing. It is
impossible to arbitrate between these different explanations given the current data.
However, what the current data show are that symbolic number comparison explains
unique variance while nonsymbolic does not, strengthening the notion that the mapping
of symbols to numerical magnitudes is a critical correlate of individual differences in
children’s arithmetic achievement (DeSmedt & Gilmore, 2011; Holloway & Ansari,
2009; Rousselle & Noël, 2007).

73
While children’s performance on the symbolic items of my test accounted for
unique variance in arithmetic performance, it was not the best predictor of arithmetic
achievement. For example, the counting recall task of the AWMA accounted for
variance in Calculation performance over and above symbolic number comparison
scores. This demonstrates that while my test does account for some unique variability in
children’s arithmetic skills, other number related abilities, as well as measures of working
memory, such as the counting recall task, also play an important role in children’s
arithmetic skills. This should be considered and investigated further in future research of
this kind.
Finally, the results from the multiple regression analyses reveal, as previous
studies have demonstrated (DeStefano & LeFevre, 2004; Kalaman & LeFevre, 2007),
that measures of both verbal and non-verbal working memory account for unique
variance in children’s arithmetic scores. What is novel about the present finding is that
both working memory and symbolic number processing skills account for unique
variance, suggesting that these competencies are not confounded with one another in
predicting individual differences in children’s arithmetic skills.
The age range of my sample and measures of math achievement used in the
current chapter are very similar to the work done by Holloway and Ansari (2009). Using
a computerized paradigm of symbolic and nonsymbolic magnitude comparison,
Holloway and Ansari (2009) investigated the relationship between basic magnitude
processing skills in 6-8 year-old children and arithmetic abilities using the same
standardized tests of math achievement as the current chapter. They found that
participants’ performance on symbolic, but not nonsymbolic magnitude comparison

74
significantly correlated with math achievement scores. Interestingly, these correlations
were strongest for the 6-year old children and weaker and nonsignificant, in older age
groups (7 and 8 years) tested, which suggested a developmental trend. However, as
detailed in the paper by Holloway and Ansari (2009) further analyses revealed that there
was no significant difference between the correlations for symbolic performance and test
scores between the different age groups. Therefore, in the absence of significant
differences between correlation coefficients they were unable to make any developmental
claims.
My findings also suggested a developmental trend whereby the relationship
between symbolic performance and math achievement became stronger and more
significant the older the participants, which may be construed to be contrary to the
findings reported by Holloway and Ansari (2009). However, like Holloway and Ansari
(2009), I also did not find any significant differences in the correlations for symbolic
performance and math achievement at each grade level. Again, since there is no evidence
of significant differences between correlation coefficients, I cannot make any claims
regarding developmental trends. Therefore, direct conclusions about the differences
between developmental trajectories in both papers cannot be made, since in neither paper
differences in the strength of correlations between age groups/grades were found to be
significant. Importantly, both my results and those reported by Holloway and Ansari
(2009) demonstrate that when controlling for chronological age, the performance of
children between the ages 6-9 years on measures of symbolic numerical magnitude
comparison significantly correlate with between-subjects variability on standardized

75
measures of arithmetic achievement. In this way there is convergence between the results
reported by Holloway and Ansari (2009) and those detailed in this chapter.
As seen in Table 2.1, there is a large difference between, on the one hand, Math
Fluency and Calculation scores and, on the other hand, Reading Fluency scores in my
sample. However, though the Math Fluency and Calculation scores are below average
they are still within the normal range (85-115). Moreover, in other studies I have
conducted with children in the local school district I have found similar average results.
Thus, the scores from my present sample are convergent with what I am finding in my
local area more generally. This may therefore be a consequence of the current
educational policy in the province of Ontario, which places a stronger emphasis on
problem solving over fluency in math. Consequently, my sample is somewhat discrepant
from the standardization sample. However, in my current analysis, I used raw scores and
thus did not rely on standardized results. Furthermore, while the average for math scores
is lower than 100, there is large variability in the scores with children performing both
above and below the normal range. Thus, I believe that while I have a sample with an
average below 100 (though still in the normal range), this large variability in math scores
found in my sample allows me to meaningfully capture individual differences.
Unfortunately, there were a greater number of parents of children in grades two
and three who agreed to have their children participate in the study than parents of
children in Grade 1. These practical constraints of the study led to considerable
differences in sample size between grade levels. Future investigations of this kind should
therefore be conducted using equal sample sizes.

76
In sum, the current results demonstrate that a relationship exists between
performance on a basic magnitude comparison task and individual differences in math
achievement (as measured by arithmetic skills). Furthermore, I found that symbolic
processing accounts for unique variance in arithmetic skills whereas nonsymbolic
processing does not. Finally, results indicate that a measure of this kind can characterize
developmental changes in basic numerical magnitude processing.
As mentioned, previous research has shown that children who have strong skills
in higher order mathematics, such as arithmetic, also demonstrate strong magnitude
processing skills. The measurement tool investigated in the current study will allow
educators to quickly and easily assess these foundational competencies. A test of this
kind will also help educators to focus on these essential skills during math instruction in
the classroom. By focusing on these basic, yet foundational abilities, educators can
directly foster the numerical magnitude processing abilities of their students.
In addition, previous research has shown that not all measures of basic number
processing correlate with individual differences in math achievement (Bugden & Ansari,
2011). Therefore, a differentiated understanding of basic number processing and its
relationship to arithmetic achievement is needed. In this regard, future studies should
investigate the relationship between the paper-and-pencil assessment and other measures
of magnitude processing such as response time measures, Weber fractions and number
line estimation tasks (see Chapters 3 and 4).
In the current chapter, I was found that children’s performance on nonsymbolic
items correlated with their arithmetic skills. This may suggest that the nonsymbolic
portion of my assessment may be used by itself with preschool children and children who

77
do not yet have a semantic representation of number symbols, further demonstrating the
utility of this simple assessment. Future studies would be needed to investigate this line
of research. In addition, future research should seek to examine the reliability of the
number comparison assessment by measuring the test-retest reliability of this assessment
tool (see Chapter 3). Using a longitudinal design, future research should also seek to
investigate the usefulness of this assessment tool for identifying children who are at risk
for developing difficulties in mathematics. Such research is critical, as the current
findings are merely correlational and may indicate that basic magnitude processing
facilitates math development, but performance on the test may equally well reflect the
fact that greater practice with arithmetic leads to improved performance in numerical
magnitude comparison. A test that has the potential to truly predict individual differences
in arithmetic ability would be a significant contribution to scores of classrooms and could
have a great impact on the future of many students. By identifying at-risk children earlier
and more reliably, findings from this and future studies will put us one step closer to
improving the numeracy skills of students with difficulties in math and possibly enhance
the teaching strategies currently used to instruct this specific group of children.

78
2.5 References
Alloway, T.P. (2007). Automated Working Memory Assessment. San Antonio, TX:
Psychological Corporation.
Berg, D. H. (2008). Working memory and arithmetic calculation in children: The
contributory roles of processing speed, short-term memory, and reading. Journal
of Experimental Child Psychology, 99, 288-308.
Brannon, E. (2006). The representation of numerical magnitude. Current Opinion in
Neurobiology, 16, 222-229.
Buckley, P.B., & Gillman, C.B. (1974). Comparisons of digits and dot patterns. Journal
of Experimental Psychology, 103, 1131-1136.
Bugden, S., & Ansari. D. (2011). Individual differences in children’s mathematical
competence are related to the intentional but not automatic processing of Arabic
numerals. Cognition, 118(1), 32-44.
Chard, D., Clarke, B., Baker, S.K., Otterstedt J., Braun D., & Katz, R. (2005). Using
measures of number sense to screen for difficulties in mathematics: Preliminary
findings. Assessment for Effective Intervention 30(2), 3-14.
Dehaene, S. (1992). Varieties of numerical abilities. Cognition, 44, 1-42.
Dehaene, S., Dehaene-Lambertz, G., & Cohen, L. (1998). Abstract representations of
numbers in the animal and human brain. Trends in Neurosciences, 21, 355-361.
DeSmedt, B. & Gilmore, C. K. (2011). Defective number module or impaired access?
Numerical magnitude processing in first graders with mathematical difficulties.
Journal of Experimental Child Psychology, 108, 278-292.

79
DeSmedt, B., Taylor, J. Archibald, L. & Ansari, D. (2010). How is phonological
processing related to individual differences in children’s arithmetic skills?
Developmental Science, 13, 508-20.
DeSmedt, B., Verschaffel, L., & Ghesquière, P. (2009). The predictive value of
numerical magnitude comparison for individual differences in mathematics
achievement. Journal of Experimental Child Psychology, 103, 469-479.
DeStefano, D., & LeFevre, J. (2004). The role of working memory in mental arithmetic.
European Journal of Cognitive Psychology, 16, 353-386.
Duncan, G., Dowsett, C., Claessens, A., Magnuson, K., Huston, A., Klebanov, P….
Japel, C. (2007). School Readiness and Later Achievement. Developmental
Psychology, 43(6), 1428-1445.
Durand, M., Hulme, C., Larkin, R., & Snowling, M. (2005). The cognitive foundations
of reading and arithmetic skills in 7 to 10-year-olds. Journal of Experimental
Child Psychology, 91, 113-136.
Geary, D. C. (1993). Mathematical disabilities: Cognitive, neuropsychological, and
genetic components. Psychological Bulletin, 114, 345-362.
Halberda, J., Mazzocco, M., & Feigenson, L. (2008). Individual differences in non-
verbal number acuity correlate with maths achievement. Nature, 455, 665-668.
Holloway, I., & Ansari, D. (2009). Mapping numerical magnitudes onto symbols: The
distance effect and children’s mathematical competence. Journal of Experimental
Child Psychology, 103(1), 17-29.
Kalaman, D. A., & LeFevre, J. (2007). Working memory demands of exact and
approximate addition. European Journal of Cognitive Psychology, 19, 187-212.

80
Koponen, T., Aunola, K., Ahonen, T., & Nurmi, J. (2007). Cognitive predictors of
single-digit and procedural calculation skills and their covariation with reading
skill. Journal of Experimental Child Psychology, 97, 220–241.
Mazzocco, M., Feigenson, L., & Halberda, J. (2011). Preschoolers’ precision of the
approximate number system predicts later school mathematics performance. PloS
ONE 6(9): e23749.
Meck, W., & Church, R. (1983). A mode control model of counting and timing
processes. Journal of Experimental Psychology: Animal Behaviour Processes,
9(3), 390-407.
Moyer, R.S., & Landauer, T.K. (1967). Time required for judgments of numerical
inequality. Nature, 215(109), 1519-1520.
Okamoto, Y., & Case, R. (1996). Exploring the microstructure of children’s central
conceptual structures in the domain of number. Monographs of the Society for
Research in Child Development, 61, 27– 59.
Parsons, S., & Bynner, J. (2005). Does Numeracy Matter More? London, England :
National Research and Development Centre for Adult Literacy and Numeracy.
Romano, E., Babchishin, L., Pagani, L.S., & Kohen, D. (2010). School readiness and
later achievement: Replication and extension using a nationwide Canadian survey.
Developmental Psychology, 46, 995–1007.
Rousselle L., & Noël, M. (2007). Basic numerical skills in children with mathematics
learning disabilities: a comparison of symbolic vs. non-symbolic number
magnitude processing. Cognition 102(3), 361-95.
Sekuler, R., & Mierkiewicz, D. (1977). Children’s judgments of numerical inequality.

81
Child Development, 48(2), 630-633.
Shalev, R. (2004). Developmental Dyscalculia. Journal of Child Neurology, 19(10),
765-771.
Stanovich, K.E., Cunningham, A.E., & Cramer, B.B. (1984). Assessing phonological
Awareness in kindergarten children: Issues of task comparability. Journal of
Experimental Child Psychology, 38(2), 175-190.
Starkey, P., & Cooper, R. (1980). Perception of numbers by human infants. Science,
210(4473), 1033-1035.
Vellutino, F.R., & Scanlon, D.M. (1987). Phonological coding, phonological
awareness and reading ability: Evidence from a longitudinal and experimental
study. Merrill-Palmer Quarterly, 33, 321-363.
Wechsler, D. (1999). Wechsler Abbreviated Scale of Intelligence. San Antonio, TX:
Psychological Corporation.
Williams, J. (1984). Phonemic analysis and how it relates to reading. Journal of
Learning Disabilities, 17, 240-5.
Woodcock, R.W., McGrew, K.S., & Mather, N. (2001). Woodcock-Johnson III Tests of
Achievement. Itasca, IL: Riverside.
Wynn, K. (1992). Addition and subtraction by human infants. Nature, 358, 749-750.
Xu, F., & Spelke, E. (2000). Large number discrimination in 6-month-old infants.
Cognition, 74, B1-B11.
Zorzi, M., Butterworth, B. (1999). A computational model of number comparison. Paper
presented at the 21st annual conference of the Cognitive Science Society,
Mahwah, NJ.

82
Chapter 3
3. Examining the Reliability and Validity of Different Task Variants of Magnitude Comparison, Their Association with Arithmetic Skills and the Role of Working Memory and Magnitude Processing in the Arithmetic Achievement of 6-7 Year-old Children.
3.1 Introduction
In the previous chapter, I reported evidence that children’s performance on the
paper-and-pencil test of numerical magnitude comparison correlated with their math
performance on both timed and untimed tests of arithmetic performance. More
specifically, correlations were found between scores on both symbolic and nonsymbolic
items and arithmetic, replicating previous work using reaction time and accuracy
measures (De Smedt, Verschaffel & Ghesquière, 2009; Durand et al., 2005; Halberda,
Mazzocco & Feigenson, 2008; Holloway & Ansari, 2009; Mazzocco, Feigenson &
Halberda, 2011). I also found that older children performed significantly better on the
magnitude comparison task compared to younger children. In addition, students in Grade
1 were significantly worse at discriminating between symbolic magnitudes compared to
nonsymbolic magnitudes, whereas Grade 2 and 3 students did not show this difference,
suggesting that over time, there may be a developmental shift in children’s magnitude
processing whereby they become more competent with processing symbolic number as
they advance in school and gain more familiarity and automaticity with numerical
symbols. This evidence also implies that pre-existing representations of nonsymbolic
numerical magnitude are still very strong at an early age and may indicate that mapping
from nonsymbolic to symbolic representations gradually takes place as children become
older.

83
In addition to the above, I also investigated whether performance on symbolic and
nonsymbolic magnitude comparison relate to arithmetic achievement over and above
other factors such as visual-spatial working memory, verbal working memory, IQ and
reading – variables that have been shown to correlate with math achievement in previous
work (Berg, 2008; DeStefano & LeFevre, 2004; Kalaman & LeFevre, 2007; Koponen,
Aunola, Ahonen & Nurmi, 2007). My data revealed that only children’s performance on
symbolic comparison accounted for unique variance in arithmetic performance, after
controlling for these variables, while nonsymbolic performance did not, as demonstrated
in previous research (Holloway & Ansari, 2009). This finding also indicates that
symbolic processing remained a significant predictor after controlling for these other
potentially confounding factors.
The main goal of this thesis was to create a sound measurement tool to assess
basic magnitude processing skills in children. My first set of results demonstrated a
correlation between the paper-and-pencil test and children’s arithmetic skills, which is a
good indicator of this test’s validity since it is associated with higher order number skills
and also replicates previous findings of this kind (Chard et al., 2005; Durand, Hulme,
Larkin & Snowling, 2005). However, when constructing an assessment, more rigorous
methods are needed in order to establish that a test has both validity and reliability. For
this reason, the first purpose of this chapter was to examine the strength of my test’s
validity and reliability in greater depth. I tested for validity by correlating performance
on the magnitude comparison task with a similar computerized version of numerical
magnitude comparison.

84
Reliability was tested by administering the paper-and-pencil assessment to the
same sample of children, at two different time points (known as test-retest reliability).
The definitions of validity and reliability are later described in greater detail, as well as a
description of the methodology I used to investigate these important issues.
In the present chapter, my second goal was to examine the relative variance in
participant’s arithmetic skills explained by the paper-and-pencil test as well as the similar
computerized measure of numerical magnitude comparison to determine if one measure
was more sensitive than the other in capturing individual differences in arithmetic
achievement.
Based on the results of Chapter 2, my third goal was to investigate if the
relationship between performance on my test and children’s arithmetic achievement
could be replicated. Moreover, I also wanted to examine whether I could again find that
children’s symbolic performance on my paper-and-pencil measure accounted for variance
in arithmetic scores over and above nonsymbolic performance and visual spatial working
memory, especially with regards to Grade 1 since this group was represented by a smaller
sample in Chapter 2.
My fourth and final goal was to examine whether performance on the paper-and-
pencil magnitude comparison test would again account for unique variance in children’s
arithmetic competence even when controlling for visual-spatial working memory.
Finally, since the number of Grade 1 students in my first project was considerably
smaller than the older grades, and the use of an assessment tool designed to measure
basic magnitude processing would be most effective at the earlier stages of instruction,
this third chapter focused on students in the first grade only.

85
3.1.1 Constructing a sound test
Sound assessment methods are an essential requirement for best research and
educational practices. From an educational perspective, assessments are critical, as they
allow teachers to evaluate a child’s understanding of certain skills or concepts and also
permit teachers to assess the progress of student learning in the classroom. In recent
years, a number of educators have expressed concerns that testing is harmful to children
and that more progress would be made in our schools if formal assessments of students
were completely removed (Ebel & Frisbie, 1991). However, the evaluation of student
learning is an essential component of education, as currently, it is the only dependable
way by which we have to measure student achievement. Furthermore, it is also the only
means of identifying students who may be at risk for developing difficulties in a certain
subject area. Finally, teachers use student evaluations to make important decisions about
their own teaching. For example, if a teacher is just beginning a new unit in math, he or
she may administer a test before introducing novel subject matter to gauge which
concepts his or her students have already mastered and which concepts may need to be
revised.
Since evaluation devices clearly play a large role in student success, it follows
that any test given to learners should meet certain criteria in order to ensure that it will
truly be a valuable tool for student learning and not a harmful one. The two most
important elements to consider when designing a sound assessment tool of any kind are
the tool’s level of validity and reliability. In the next sections I will introduce both of
these terms in detail and will describe how the validity and reliability of the magnitude
comparison test was examined.

86
3.1.2 Validity
In the document Standards for Educational and Psychological Testing written as
a collaboration between the American Educational Research Association (AERA), the
American Psychological Association (APA) and the National Council on Measurement in
Education (NCME), validity is referred to as:
“the degree to which evidence and theory support the interpretations of test scores entailed by proposed uses of tests…The process of validation involves accumulating evidence to provide a sound scientific basis for the proposed score interpretations. It is the interpretations of test scores required by proposed uses that are evaluated, not the test itself” (AERA, APA, NCME, 1999, p. 9).
In other words, validity is not a characteristic of the test itself but is a property of the test
scores, how they are interpreted and how they are used.
In Standards for Educational and Psychological Testing, several sources of
evidence are outlined that may be used in evaluating and supporting the interpretation of
test scores for a specific purpose. Although these sources of evidence highlight specific
features of validity they should not be regarded as distinct types of validity. This way of
thinking about validity assumes that there are several kinds of validity and that tests can
display some of one kind and not the other. This is a flawed assumption. Instead, validity
should be viewed as a single concept made up of different categories (AERA et al.,
1999). A brief summary of two of these categories is provided below.
Evidence of criterion-related validity. One way to measure the usefulness of the
test scores derived from a particular measure is to use them to predict other variables of
interest, also known as criterion-related validity (Kline, 2005). For instance, it may be
expected that individuals who perform highly on magnitude comparison skills would also
perform highly on other measures of numerical cognitive processing. These types of

87
relationships between variables are called criterion-related because one variable (i.e.,
magnitude comparison skills) is being used as a predictor of another variable of interest,
the criterion (i.e., arithmetic achievement). In Chapter 2 my test demonstrated criterion-
related validity as results demonstrated that children’s performance on symbolic items
significantly predicted their arithmetic scores. In the current chapter, the goal was to
replicate these previous findings.
Evidence of construct validity. Construct validity refers to whether an
assessment measures or correlates with the construct that it claims to measure. One
subtype of construct validity is known as convergent validity, which is defined as
“relationships between test scores and other measures intended to assess similar
constructs” (AERA et. al, 1999, p.14). For example, in several cases, two instruments
may be designed to measure the same construct. When the test scores of one instrument
correlate with the test scores of another instrument designed to measure the same
construct, this provides evidence of convergent validity. Therefore, convergent validity
refers to the extent to which each measure is assessing the same underlying cognitive
process.
While the paper-and-pencil task described in Chapter 2 is designed to measure
magnitude comparison skills in children, previous work has also successfully used
response time measures to assess magnitude comparison skills in children (i.e., Bugden &
Ansari, 2011; Holloway & Ansari, 2009). The fact that response time measures have also
been used to assess magnitude comparison abilities raises the question about the
convergent validity of the magnitude comparison measure presented in this thesis, which
utilizes a different method and presentation format compared to response time measures

88
of the same task. In order to address this issue, I administered the paper-and-pencil test
along with a computerized version of magnitude comparison to a sample of Grade 1
students and investigated whether individual test scores on the computerized version of
the task correlated with test scores on the paper-and-pencil version. A regression analysis
was also performed to investigate which of the magnitude comparison tasks accounted
for unique variability in children’s arithmetic performance. If my task accounted for
unique variability in participants’ scores, over and above the computer task, this would
suggest that the paper-and-pencil test is a more sensitive measure of basic magnitude
processing skills in children compared to the response time measure used here. However,
if the response time measure only were found to account for unique variability, then this
would indicate that the computer task is a more sensitive measure of magnitude
processing. In a final scenario, if both tasks were significant predictors of arithmetic
skills, this would demonstrate that both versions of the magnitude comparison task
account for unique variance in arithmetic performance, and both are valid measures of
basic magnitude processing abilities in children.
3.1.3 Reliability
Along with considering the validity of a measure, one must also consider whether
or not the measure is reliable. Reliability refers to “the consistency of [a measure] when
the testing procedure is repeated on a population of individuals or groups” (AERA et al.,
1999, p. 25). In other words, the reliability of a test refers to the generalizability of the
test’s scores under one set of circumstances, to another set of circumstances. Reliability
is a fundamental property of any psychological measure, and for researchers creating
assessment tools of any kind, reliability is of extreme importance.

89
One way of measuring the reliability of a test is to examine the test-retest
reliability of an assessment. This index of reliability assesses the stability across time of
a set of test scores on a particular test for a given sample. To accomplish this, the same
test is given to the same sample of participants at a particular point in time (T1) and again
at a later time (T2) and the measurements at these two time points are then correlated
with each other to obtain a stability coefficient. The time between testing is usually
recommended to be a short length of time such as two weeks (Salvia, Ysseldyke & Bolt,
2007).
The zero-order correlation between test scores at T1 and T2 is used as the test-
retest reliability index. The main advantage of this index of reliability is that the items are
identical at both testing periods, making certain that the same construct is being measured
in the exact same way at both times of administration (Kline, 2005). However, scores
will unavoidably vary from T1 to T2 due to random measurement error caused by
dissimilarities in testing conditions such as the participant feeling poorly at T1 and
feeling better at the second testing point, thus receiving a higher score at T2.
In recent years, several studies have examined the validity and reliability of
paradigms commonly used in the literature to assess both symbolic and nonsymbolic
magnitude processing. For example, Maloney, Risko, Preston, Ansari and Fugelsang
(2010) examined the reliability and convergent validity of four task variants used to
assess the numerical distance effect (NDE). In the lower/higher than five (L/H5) task,
adult participants were presented with the numbers ranging from 1 to 4 and 6 to 9 and
were asked to indentify whether the presented number was higher than five or lower than
five. In a second task, participants completed the L/H5 task using nonsymbolic stimuli.

90
Here participants were shown a display containing black squares ranging from 1 to 4 and
6 to 9 and were required to indicate whether the number of boxes presented was lower
than five or higher than five. In a third symbolic comparison task, participants were
presented with two Arabic digits ranging from 1 to 4 and from 6 to 9 and were told to
indicate which of the two numbers was numerically greater. For the final nonsymbolic
task participants were shown a display with two arrays of squares ranging from 1 to 4 and
from 6 to 9. Participants were required to indicate which of the two arrays presented
contained the more dots. Stimuli in each task variant were presented in two blocks for a
total of 160 trials per task. An assessment of internal reliability was used whereby
participants’ performance on the first block of trials was correlated with their
performance on the second block of trials (also known as split-half reliability). Results
demonstrated that nonsymbolic stimuli in both tasks were more reliable measures of the
NDE than the symbolic stimuli. Secondly, it was found that the NDE elicited by the
symbolic stimuli was uncorrelated with the NDE that arose from the nonsymbolic
stimuli. These findings demonstrate that symbolic and nonsymbolic NDEs were not
equally reliable and were also uncorrelated with one another, implying that NDEs elicited
by these two tasks index different cognitive processes during basic magnitude processing
that are dependent on stimulus format.
In another similar study of validity and reliability, Sasanguie, Defever, Van den
Bussche and Reynvoet (2011) investigated the reliability and convergent validity of three
basic nonsymbolic magnitude tasks from which the numerical ratio effect (NRE) is
known to be obtained: comparison task, same-different judgment and priming
comparison task. Using an adult sample it was revealed that the comparison and same-

91
different tasks both demonstrated internal reliability, while the priming task did not show
internal reliability. Moreover, the comparison and same-different tasks correlated with
each other but neither correlated with the priming comparison task. For these reasons,
Sasanguie and colleagues suggest that the comparison and same-different tasks are
reliable paradigms for assessing the NRE while the priming comparison task should be
used cautiously.
As seen in the studies reviewed above, not all distance effects found in
comparison tasks are reliable, demonstrating that investigating the validity and reliability
of assessments is crucial, and careful consideration needs to be made in choosing the type
of magnitude comparison task used to measure basic magnitude processing skills.
Furthermore, while examining the reliability of an assessment is accepted as an important
practice, it is especially important for the current study because an unreliable test is
limited in how strongly it can correlate with other measures. Moreover, as stated by
Maloney et al. (2009), because many measures in cognitive psychology are used as
outcomes in studies of individual differences, it is imperative to know the reliability of
these measures. However, if an unreliable measure is used in an experiment, then the
chance of finding differences between groups is low even if those differences are in fact
present (Kopriva & Shaw, 1991). Consequently, the interpretation of a null result
becomes difficult since it is not known how reliable the measure truly is. Therefore,
assessing whether measures of cognitive processes, such as the ones used in the current
thesis, are reliable is not only important on a methodological level but also on a
theoretical one as well, given that important explanations and models are derived from
the data obtained from these variables (Maloney et al., 2009). If my task demonstrated

92
test-retest reliability, it would suggest that this simple measure represents a reliable
assessment of basic magnitude processing in young children.
3.1.4 The Relationship between Symbolic and Nonsymbolic Processing in Grade 1 Children Revisited.
As established in the literature review presented in Chapter 2, the relationship
between basic magnitude processing skills and arithmetic has been demonstrated at the
preschool (Mazzocco, Feigenson & Halberda, 2011), kindergarten (Chard et al., 2005)
and early primary grade levels (De Smedt, Verschaffel & Ghesquière, 2009; Durand,
Hulme, Larkin & Snowling 2005; Holloway & Ansari, 2009). Due to these multiple
empirical findings, my finding in Chapter 2 of no relationship between Grade 1 children’s
performance on the magnitude comparison task and arithmetic achievement was
unexpected. However, recall that in that sample, the number of Grade 1 students was
much smaller than the number of Grade 2 and Grade 3 students. It was proposed that the
comparatively small sample size may be the reason for the nonsignificant relationship
that was found between Grade 1 children’s performance on the paper-and-pencil test and
their arithmetic skills. If a significant relationship between performance on my test and
arithmetic skills was found here, using a larger sample of Grade 1 students, it would help
to confirm that the reason for the null finding in Chapter 2 was an issue of sample size.
Moreover, it would confirm that this important relationship could also be found in this
younger age group using the paper-and-pencil assessment.
While results in Chapter 2 demonstrated that children’s performance on both
symbolic and nonsymbolic items correlated with arithmetic achievement, it was also
demonstrated that symbolic magnitude comparison was found to account for unique,
significant variance in arithmetic skills, while nonsymbolic magnitude comparison did

93
not. This was a key result, as currently there exists conflicting findings in this body of
research where some studies have found that nonsymbolic processing is a significant
predictor of math achievement (Halberda, Mazzocco & Feigenson, 2008; Mazzocco,
Feigenson & Halberda, 2011) while others have not (Holloway & Ansari, 2009). It was
speculated that this important finding suggested that symbolic processing is related to
recognizing numerals and mapping numerals to magnitudes – an essential skill for
manipulating digits during calculation. Therefore, another goal of this chapter was to
investigate whether the current data would yield similar results as those found in Chapter
2, strengthening the notion that the mapping of symbols to numerical magnitudes is a
critical correlate of individual differences in children’s arithmetic achievement.
3.1.5 The Role of Working Memory in Numerical Cognition
While basic magnitude processing skills play a large role in children’s higher-
order math skills, other predictors of individual differences in math achievement exist,
such as working memory. Working memory is broadly defined as a system dedicated to
the active storage and processing of information involved mainly in complex cognitive
activities (Gavens & Barrouillet, 2004). The function of working memory and the role it
plays in children’s math abilities has been the focus of numeracy research in recent years
and has been shown to have an important part in math skills such as solving both simple
and complex arithmetic problems (for a review see DeStefano & LeFevre, 2004).
Furthermore, poor working memory has been related to developmental disabilities in
mathematics (Geary, 1993). Given the role that working memory plays in arithmetic
performance, when studying the relationship between magnitude comparison and math
achievement, it is important to consider working memory and to investigate any unique

94
variance explained by working memory measures.
In Chapter 2, it was found that both symbolic magnitude processing and working
memory accounted for unique variance in Math Fluency scores. Furthermore, symbolic
processing predicted children’s arithmetic skills over and above both visual spatial
working memory and verbal working memory. In light of these findings, I wanted to
examine whether performance on visual-spatial working memory and the paper-and-
pencil measure would again account for unique variance in children’s arithmetic scores.
Based on the findings in Chapter 2 it was hypothesized that children in first grade
would receive higher scores on the non-symbolic items than the symbolic items on the
paper-and-pencil task. A significant relationship was expected between children’s Math
Fluency scores, their performance on the magnitude comparison task and working
memory. Finally, it was hypothesized that the relationship between Math Fluency and
participants’ magnitude comparison scores would account for unique variance in
arithmetic scores over and above performance on the visual-spatial working memory
tasks.
In the current chapter, I chose to focus only on visual-spatial working memory
since findings in Chapter 2 revealed that it was a stronger predictor of Math Fluency than
verbal working memory. Secondly, research has demonstrated that visual-spatial working
memory plays an important role in younger children’s math performance (Krajewski &
Schneider, 2009). Finally, administering all four of these subtests from the Automated
Working Memory Assessment (AWMA) is time consuming and the testing time given for
each child was limited. Therefore, due to these practical constraints, only the visual-
spatial working memory subtests were administered to the participants.

95
In sum, the purpose of this chapter was to a) assess the validity and reliability of
the paper-and-pencil magnitude comparison test, b) investigate the relative variance in
children’s arithmetic performance explained by the paper-and-pencil test as well as a
computerized measure of numerical magnitude comparison, c) identify whether the
finding that symbolic comparison skills accounts for more variability in math
achievement scores than nonsymbolic skills could be replicated from Chapter 2 and, d)
examine whether performance on the paper-and-pencil magnitude comparison test
accounted for unique variance in arithmetic skills even when controlling for visual-spatial
working memory.
3.2 Methods
3.2.1 Participants
A total of 50 students in Grade 1 from two public elementary schools participated
in the current study. One child was removed due to disabilities preventing the proper
completion of the tasks, another child was removed due to unwillingness to complete the
session, two other children were removed due to missing items on the number
comparison task, one child was removed due to inability to reach a basal score on the
Math Fluency and one more child was removed due to malfunction of the computerized
version of the magnitude comparison task. Therefore, my final sample included 44
children (29 females) between the ages of 6 years 5 months and 7 years 4 months (Mage =
6 years 9 months, SD = 3.54 months). All participants spoke English fluently and had
normal or corrected to normal vision. Participants came from various socioeconomic
groups.

96
3.2.2 Materials and Design
All participants were given the paper-and-pencil magnitude comparison used in
Chapter 2, the Odd-One-Out and Spatial Recall tests of the AWMA to measure visual
spatial working memory, the Math Fluency subtest of the Woodcock Johnson III and a
computerized version of the magnitude comparison task. The computerized version of
the magnitude comparison task is described below. The descriptions of the measures of
working memory, Math Fluency and the paper-and-pencil magnitude comparison test can
all be found in the method section of Chapter 2.
3.2.2.1 Magnitude Comparison Task – Computerized Version
In the symbolic condition of this task, participants were presented with two single
digit numbers (ranging from 1 to 9) on a computer screen, and were asked to choose the
numerically larger number as fast as they could without making any errors. Both numbers
were a font size of 58 and appeared on a 13-inch computer screen on either side of a
centrally located dot until the participant made a response. In the non-symbolic condition,
participants were shown two arrays of white dots on a black background separated by a
white line located in the middle of the screen. Participants were instructed to choose the
side that had the more dots as quickly as possible without making any errors. The
magnitude pairs remained on the screen for 800 ms after which a response screen was
presented for 3000 ms. Participants could respond during the task screen or the response
screen.
For both symbolic and nonsymbolic conditions there were a total of 64 trials in
which the ratio between the two numbers were manipulated and fell between .11 and .89
(see Table 3.1 for a list of pairs and ratios). There were 32 levels of ratios for the

97
magnitude comparison task. Each ratio was repeated twice in random order, and each
magnitude was counterbalanced for the side of presentation. Participants completed four
practice items at the beginning of each session followed by a block of 32 trials, a short
break and then a final block of 32 trials making a total of 64 trials in all. Half of the
participants received the symbolic condition first.
Similar tasks have been used in previous behavioural studies with young children
and findings demonstrate that individual differences in these response time tasks correlate
with math achievement (Holloway & Ansari, 2009; Bugden & Ansari, 2011).
Table 3.1 Numerical pairs and ratios for the computerized numerical magnitude comparison task Number pair Ratio
1-9 0.11 1-7 0.14 2-9 0.22 2-8 0.25 2-6 0.33 3-8 0.38 3-7 0.43 4-8 0.50 4-7 0.57 3-5 0.60 4-6 0.67 5-7 0.71 3-4 0.75 4-5 0.80 6-7 0.86 8-9 0.89

98
3.2.3 Procedure
All participants were assessed at their respective elementary school in one 45-
minute session at the end of the school year. Each participant was tested individually by
trained examiners in a quiet area outside of their classroom. Tests were given in the
following order: computerized magnitude comparison, Odd-One-Out, Spatial Recall,
Math Fluency and paper-and-pencil magnitude comparison. Permission was granted from
the Thames Valley District School Board and school principals to recruit students from
elementary schools across London, Ontario and surrounding areas. Letters of
information and consent forms approved by the University of Western Ontario’s
Research Ethics Board were received and completed by parents of the participants before
the study began. Interested parents representing two schools in small communities
outside of London consented to having their child(ren) participate in the current study.
To get a measure of test-retest reliability, participants were retested on the paper-
and-pencil task two to three weeks following the first administration of the assessment.
3.3. Results
3.3.1 Descriptive statistics
Participants’ ages along with the means and standard deviations for each test
administered are shown in Table 3.2.

99
Table 3.2. Means and Standard Deviations (S.D.)
Test N Mean Raw Scores (S.D.) Range (min.-max.) Mean Standard Score (S.D) Range (min.-max.)
Age (months) 44 81.89 (3.51) 77 - 88 N/A N/A
Math Fluency 44 18.45(10.82) 2 - 40 99.91 (10.82) 78 - 117
Spatial Recall 44 13.86 (4.66) 1 - 21 112.20 (14.07) 77 - 132
Odd-One-Out 44 13.88 (4.71) 3 - 24 107.27 (16.02) 79 - 133
Symbolic1 (T1) 44 32.20 (5.63) 20 - 43 N/A N/A
Nonsymbolic1 (T1) 44 33.25 (4.77) 18 - 41 N/A N/A
Symbolic1 (T2) 39 34.77 (6.39) 22 - 46 N/A N/A
Nonsymbolic1 (T2) 39 38.44 (5.89) 28 - 52 N/A N/A
Symbolic RT (ms) 44 924.63 (246.08) 600.07 -1766.68 N/A N/A
Nonsymbolic RT (ms) 44 851.44 (212.09) 572.47- 1400.77 N/A N/A
Symbolic ACC (%) 44 79.50 (13.57) 49.48 - 100 N/A N/A
Nonsymbolic ACC (%) 44 77.78 (11.96) 49.48 - 95.31 N/A N/A
Note. Symbolic - total correct scores on symbolic items of paper-and-pencil test; Nonsymbolic - total correct scores on nonsymbolic items of paper-and-pencil test; Math Fluency – scores received on WJ-III; Odd-One-Out – scores received on AWMA; Spatial Recall – scores received on AWMA; T1 – first administration; T2 – second administration; Symbolic RT- average reaction time in milliseconds for symbolic trials; Nonsymbolic RT- average reaction time in milliseconds for nonsymbolic trials; Symbolic ACC – percent correct on symbolic RT trials; Nonsymbolic ACC – percent correct on nonsymbolic RT trials
1Maximum possible score was 56

100
3.3.2 Convergent Validity
The performance on the paper-and-pencil test was correlated with performance
measures from the computerized task. Performance measures from the computerized task
were determined using an efficiency measure, which was calculated by dividing mean
accuracy rates (percent correct) with mean RT (see Table 3.2 for mean accuracy and
mean RT values). In other words, the measure captures the number of items correctly
solved in the time it took participants to complete the task. The same is true for the paper-
and-pencil task where the outcome measure is the total number of items completed
correctly within the two-minute time limit. This value was calculated, for each
participant, for symbolic and nonsymbolic trials separately. As seen in Table 3.3, results
demonstrated that performance on the computerized task correlated with Math Fluency
raw scores. This relationship with math achievement was seen for both symbolic items (r
= .59, p < .01) and nonsymbolic items (r = .48, p < .01). Efficiency measures for
symbolic items also correlated with symbolic items on the paper-and-pencil test
(r = .61, p < .01), but not with nonsymbolic items on the magnitude comparison paper-
and-pencil task (r = .23, ns). There was also a significant relationship between efficiency
measures for nonsymbolic items and symbolic paper-and-pencil measures (r = .54, p <
.01) and a marginally significant relationship between nonsymbolic efficiency measures
and nonsymbolic paper-and-pencil performance (r = .30, p = .051).

101
Table 3.3. Correlation between response time measures, paper-and-pencil test and Math Fluency Variable 1 2 3 4 5 6 7 8 9 1. MF - .59** .48** .55** .25 -.28 -.21 .48** .37* 2. Eff. sym - .79** .61** .23 -.71** -.61** .46** .28 3. Eff. nonsym - .54** .30 -.72** -.74** .17 .36* 4. Sym paper & pencil - .59** -.27 -.21 .51** .44** 5. Nonsym paper & pencil - -.15 -.16 .11 .13 6. Sym RT - .89** .26 .17 7. Nonsym RT - .29 .32* 8. Sym ACC - .67** 9. Nonsym ACC - __________________________________________________________________________________________________________ Note. MF- Math Fluency; Eff. sym – efficiency measure of symbolic RT; Eff. nonsym – efficiency measure of nonsymbolic RT; Sym paper & pencil – symbolic mean score; Nonsym paper & pencil – nonsymbolic mean score; Sym RT – mean reaction time for symbolic trials on computer task; Nonsym RT – mean reaction time for nonsymbolic trials on computer task; Sym ACC – mean accuracy on symbolic trials on computer task; Nonsym ACC – mean accuracy for nonsymbolic trials on computer task.
** p < .01

102
Mean response time for symbolic trials significantly correlated with symbolic
efficiency measures (r = -.71, p < .01) and nonsymbolic efficiency measures (r = -.72,
p < .01) and mean response time for nonsymbolic trials (r = .89, p < .01). Mean response
time for nonsymbolic trials also significantly correlated with symbolic efficiency
measures (r = -.61, p < .01) and nonsymbolic efficiency measures (r = -.74, p < .01).
Accuracy on symbolic trials of the computer task significantly correlated with Math
Fluency (r = .48, p < .01), efficiency measures of symbolic trials (r = .46, p < .01) and
symbolic performance on the paper-and-pencil test (r = .51, p < .01). Accuracy on
nonsymbolic trials of the computer task significantly correlated with Math Fluency
(r = .37, p < .05), efficiency measures of nonsymbolic trials (r = .36, p < .05), symbolic
scores on the paper-and-pencil test (r = .44, p < .01), mean reaction time on nonsymbolic
trials (r = .32, p < .05) and accuracy on symbolic trials of the computer task (r = .67,
p < .01).
3.3.3 Test-retest Reliability for the Paper-and-pencil Test
In testing for reliability, an analysis was also completed in order to identify
whether there were any differences between formats (i.e., symbolic, nonsymbolic) and
testing point. To do this, a 2 (symbolic, nonsymbolic) x 2 (T1, T2) within-subjects
repeated measures ANOVA was conducted. Analyses revealed a main effect of format
(F(1, 38) = 15.05, p < .001,
η2 = .28) and a main effect of testing point (F(1, 38) = 34.08, p < .001, η2 = .47). There
was also an interaction of format and testing point (F(1, 38) = 7.69, p < .001, η2 = .17)
whereby Grade 1 participants were more accurate on symbolic items at T2 compared to
symbolic items at T1 (t(38) = 3.10, p < .001) and also more accurate on nonsymbolic

103
items at T2 compared to nonsymbolic items at T1 (t(38) = 6.43, p < .001). Furthermore,
children demonstrated significantly greater accuracy on nonsymbolic items at T2
compared to symbolic items at T2 (t(38) = 4.51, p < .001). Although participant mean
scores were higher on nonsymbolic scores at T1 compared to symbolic scores at T1 (as
seen in Fig. 3.1), there was no significant difference between performance on
nonsymbolic and symbolic formats (t(43) = 1.36, ns).
Figure 3.1. Bar graph representing participant performance in each format of the test at
both time periods. Participants’ performance on symbolic items in T1 was not
significantly different from performance on nonsymbolic items in T1. However, their
performance on symbolic items in T2 was significantly lower than their performance on
nonsymbolic items in T2. There was also a significant difference between participant
scores on symbolic items in T1 and T2 as well as a significant difference between
0
5
10
15
20
25
30
35
40
45
Time 1 Time 2
Test scores
symbolic
nonsymbolic

104
nonsymbolic items in T1 and T2. Standard errors are represented by the error bars
attached to each column.
To perform an assessment of test-retest reliability, performance on the first
administration of the paper-and-pencil test was correlated with performance on the
second administration. Only 39 students from the original sample of 44 were included in
this analysis. This is because on the day of the second administration one student was
absent and four other students did not complete the magnitude comparison booklets
correctly due to skipped items. In this analysis, correlations were calculated for the
following variables: symbolic items time 1 and time 2 (total number of correctly solved
symbolic comparison trials), nonsymbolic items time 1 and time 2 (total number of
correctly solved nonsymbolic comparison trials), and overall score (total number of
correctly solved comparison trials across symbolic and nonsymbolic). Results
demonstrated that overall test scores at time point one significantly correlated with
overall test scores at time point two (r = .73, p < .01), indicating that 53% of the variance
of the scores at T1 was shared with the variance at T2. Furthermore, symbolic scores at
T1 significantly correlated with symbolic scores at T2 (r = .67, p < .01) and nonsymbolic
scores at T2 correlated with nonsymbolic scores at T2 (r = .62, p < .01). Each of the
other variables significantly correlated with one another in a range of .59 - .90 (see Table
3.4).

105
Table 3.4 Test-retest stability coefficients Variable 1 2 3 4 5 6
1. Sym T1 - .59** .91** .67** .57** .68** 2. Nonsym T1 - .87** .49** .62** .61** 3. Overall T1 - .65** .66** .73** 4. Sym T2 - .66** .92** 5. Nonsym T2 - .90** 6. Overall T2 - Note. Sym – symbolic mean score; Nonsym – nonsymbolic mean score; Overall – overall mean score; T1 – first administration; T2 – second administration ** p < .01. 3.3.4 Investigating the Relationship Between the Computerized Task, the Paper-and-pencil Task and Student’s Math Fluency Scores. Recall from the correlational analysis above (Table 3.3) that efficiency measures
of symbolic computer trials, efficiency measures of nonsymbolic computer trials and
mean scores of symbolic items of the paper-and pencil test each significantly correlated
with Math Fluency. In order to investigate the variance of both the computer and paper-
and-pencil task in accounting for individual differences in arithmetic achievement, two
linear regressions were conducted. The first regression was conducted in order to
identify if both the symbolic and nonsymbolic efficiency measures of the computer task
were significant predictors of Math Fluency.
To conduct the first linear regression, Math Fluency raw scores were used as the
dependent variable and efficiency measures of symbolic trials and efficiency measures of
nonsymbolic trials were used as predictors. Again, since no hypotheses were made about
the order of predictors, and in an effort to investigate which variables accounted for

106
significant unique variance, predictor variables were entered in one step (see Table 3.5).
Results demonstrated that the linear regression was significant (F(2, 43) = 10.79,
p < .001, R2 = .35). It was also found that symbolic efficiency measures accounted for
significant unique variance in Math Fluency while nonsymbolic efficiency measures did
not.
Table 3.5 Linear regression analyses predicting Math Fluency raw scores with symbolic efficiency measures and nonsymbolic efficiency measures as predictors. Math Fluency
Predictor β t ΔR2
Eff. sym .564* 2.73 .11875 Eff. nonsym .029 .142 .00032 Note. Eff.sym – efficiency measure of symbolic RT; Eff.nonsym – efficiency measure of nonsymbolic RT * p < .05
Due to the results of the first regression and the earlier finding that symbolic
performance on the paper-and-pencil test significantly correlated with Math Fluency
(Table 3.3), a second linear regression was performed to determine which of the symbolic
measures, if any, accounted for greater variance in children’s arithmetic performance. In
this analysis, Math Fluency was the dependent variable while performance on the
symbolic items of the paper-and-pencil test and symbolic efficiency measures of the
computer task were the predictors. Again, each predictor variable was entered in one step
(see Table 3.6). Results demonstrated that the linear regression was significant
(F(2, 43) = 13.91, p < .001, R2 = .40). It was also found that both symbolic measures
accounted for significant unique variance in Math Fluency; however, symbolic efficiency

107
measures accounted for unique variance in children’s arithmetic skills over and above
performance on symbolic items of the paper-and-pencil measure.
Table 3.6. Linear regression analyses predicting Math Fluency raw scores with symbolic efficiency measures and symbolic performance on paper-and-pencil test as predictors. Math Fluency
Predictor β t ΔR2
Eff. sym .400* 2.63 .10080 Sym. paper & pencil .308* 2.03 .05966 Note. Eff. sym – efficiency measure of symbolic RT; Sym. paper & pencil – symbolic mean score on paper-and-pencil test * p < .05
3.3.5 Investigating the Variance Accounted for in Math Fluency Using Symbolic and Nonsymbolic Performance on the Paper-and-Pencil Test as Predictors. In Chapter 2, I demonstrated that while symbolic and nonsymbolic performance
on the paper-and-pencil test both significantly correlated with arithmetic, only symbolic
scores accounted for unique variance in children’s arithmetic abilities. Therefore, the
third goal of this chapter was to investigate whether this finding could be replicated with
the current sample. However, as demonstrated in the correlational analysis above (see
Table 3.3), nonsymbolic performance on the paper-and-pencil test did not significantly
correlate with Math Fluency, making a regression analysis with nonsymbolic
performance as a predictor unnecessary. However, even though the Grade 1 sample size
here of 44 participants is larger than the sample size of 26 Grade 1 children in Chapter 2,
it is still much smaller than the sample size of 56 Grade 2 and 78 Grade 3 participants in
the previous chapter. Therefore, these current null findings may again be due to a lack of

108
power caused by a small sample. For this reason, an additional analysis was made to
investigate the correlation between Math Fluency scores and symbolic and nonsymbolic
performance by combining the Grade 1 participants from both data sets (the one reported
in the present sample and the Grade 1 sample reported in Chapter 2) to create a larger
sample of 70 first grade children. It is important to note that both samples of Grade 1
students were tested at the end of the school year.
From this additional correlational analysis with 70 participants, it was revealed
that children’s Math Fluency raw scores correlated with performance on both symbolic
(r = .45, p < .001) and nonsymbolic (r = .25, p < .05) items of the paper-and-pencil test
and overall sores (r = .41, p < .001; see Fig. 3.2). Symbolic scores significantly
correlated with nonsymbolic scores (r = .55, p < .001; see Table 3.7).
Table 3.7. Correlations between Math Fluency and magnitude comparison as measured by the paper-and-pencil test.
Variable 1 2 3 4
1. MF - .45** .25* .41** 2. Sym. paper & pencil - .55** .90** 3. Nonsym. paper & pencil - .86** 4. Overall - Note. MF - Math Fluency; Sym. paper & pencil – symbolic mean score on paper & pencil test; Nonsym. paper & pencil – nonsymbolic mean score on paper & pencil test; Overall – overall mean score on paper-and-pencil test * p < .05. ** p < .01.

109
Figure. 3.2. Scatterplot showing significant correlation between raw scores on the Math
Fluency subtest of the Woodcock-Johnson III battery and overall mean score of the
magnitude comparison task (symbolic and nonsymbolic combined) for 70 Grade 1
participants. The solid line represents the linear regression line for this relationship.
0
10
20
30
40
50
60
70
80
90
0 5 10 15 20 25 30 35 40 45
Magnitude Comparison Scores
Math Fluency Raw Scores

110
A linear regression was then completed to identify which of these two variables
accounted for greater variance in children’s arithmetic skills. Math Fluency raw scores
was the dependent variable, while symbolic and nonsymbolic scores on the paper-and-
pencil test were the predictor variables. The analysis revealed that the model was
significant (F (2, 69) = 8.48, p < .01, R2 = .20). Results also demonstrated that
performance on symbolic items was a significant predictor of Math Fluency performance
while children’s nonsymbolic scores were not (see Table 3.8).
Table 3.8. Linear regression analyses predicting Math Fluency raw scores with symbolic and nonsymbolic performance on the paper-and-pencil test as predictors. Math Fluency
Predictor β t ΔR2
Sym paper & pencil .446* 3.41 .13829 Nonsym paper & pencil .006 .046 .00003 Note. Sym paper & pencil – symbolic mean score; Nonsym paper & pencil – nonsymbolic mean score * p < .05.
In the previous chapter it was also revealed that Grade 1 students performed
significantly worse on the symbolic compared to the nonsymbolic items of the paper-and-
pencil test. Yet, the current data in this chapter with 44 children do not demonstrate this
finding as indicated in Figure 3.1. Therefore, a t-test was conducted with the larger
sample of 70 students to compare children’s performance on symbolic and nonsymbolic
items (see Fig. 3.3). Results demonstrated that children’s performance on nonsymbolic

111
items (M = 33.39) was significantly greater than performance on symbolic items (M =
31.39; t (69) = 3.16, p < .05).
Figure 3.3. Bar graph representing performance of combined Grade 1 sample in each
format of the paper-and-pencil test. Participants’ performance on nonsymbolic items was
significantly greater than performance on symbolic items. Standard errors are represented
by the error bars attached to each column.
3.3.6 Correlations Between Math Fluency, Working Memory and Magnitude Comparison
As demonstrated in the previous chapter, symbolic magnitude processing, as
measured by the paper-and-pencil test, accounted for unique variance in children’s
performance on Math Fluency over and above their scores on subtests of the AWMA.
0
5
10
15
20
25
30
35
40
symbolic nonsymbolic
Test Scores
Item format

112
Visual-spatial working memory also accounted for unique variance in children’s Math
Fluency scores. One of the goals of the current chapter, therefore, was to investigate
whether performance on the paper-and-pencil measure would again account for unique
variance in children’s Math Fluency scores even when controlling for visual spatial
working memory. To complete this investigation, correlations were first calculated for
the following variables: Math Fluency raw scores, Odd-One-Out raw scores, Spatial
Recall raw scores, symbolic scores (total number of correctly solved symbolic
comparison trials), nonsymbolic scores (total number of correctly solved nonsymbolic
comparison trials) and total scores (total number of correctly solved comparison trials
across both symbolic and nonsymbolic). All scores represent the performance of the 44
grade one children from the current chapter.
As seen from Table 3.9, Math Fluency raw scores significantly correlated with
symbolic scores (r =.55, p < .01), overall scores (r = .46, p < .01), and Odd-One-Out raw
scores (r = .46, p < .01). Spatial Recall scores only correlated with Odd-One-Out scores
(r = .32, p < .05) and symbolic scores correlated with nonsymbolic scores (r = .55, p <
.01) and Odd-One-Out raw scores (r = .42, p < .01).

113
Table 3.9
Correlations between Math Fluency, working memory and magnitude comparison
Variable 1 2 3 4 5 6
1. MF - .46** .15 .55** .25 .46** 2. OOO - .33* .45** .16 .33* 3. SR - -.02 .18 .08 4. Sym - .59** .91** 5. Nonsym - .87** 6. Overall - Note. MF - Math Fluency; OOO – Odd-One-Out; SR – Spatial Recall; Sym – paper-and-pencil symbolic mean score; Nonsym – paper-and-pencil nonsymbolic mean score; Overall – overall mean score on paper-and-pencil test * p < .05. ** p < .01.
Since student performance on the Odd-One-Out task and symbolic items of the
paper-and-pencil test both correlated with Math Fluency, the specificity of the key
relationship between number comparison and arithmetic skills needed to be examined
further. To do so, a linear regression was performed to examine the relationship between
Math Fluency (dependent variable), symbolic scores and Odd-One-Out scores. Since no
hypotheses were made about the order of predictors and, in an effort to investigate which
variables accounted for significant unique variance, both predictor variables were entered
as one step (see Table 3.10). Results demonstrated that the linear regression was
significant (F(2, 43) = 11.61, p < .001, R2 = .36). In this model it was found that
performance on both Odd-One-Out and symbolic items accounted for significant unique
variance in Math Fluency; however, symbolic performance accounted for unique
variance over and above performance on the visual-spatial working memory task.

114
Table 3.10 Linear regression analyses predicting Math Fluency raw scores with Odd-One-Out scores and symbolic scores as predictors.
Math Fluency Predictor β t ΔR2 Odd-One-Out .269* 1.93 .05810 Symbolic .431* 3.10 .14925 Note. OOO – Odd-one-out; Sym – paper-and-pencil symbolic mean score * p < .05.
Because student performance on the Odd-One-Out task and the symbolic and
nonsymbolic trials of the response time measures each correlated with Math Fluency (see
Table 3.3), I also examined the specificity of the relationship between number
comparison, as measured by the computer task, and arithmetic skills. To do so, a linear
regression was performed to examine the variance accounted for by symbolic efficiency
measures, nonsymbolic efficiency measures and Odd-One-Out scores in Math Fluency
scores. Again, each predictor was added as one step for the reasons described above (see
Table 3.11). Results demonstrated that the linear regression was significant
(F(2, 43) = 8.60, p < .001, R2 = .39). In this model it was found that performance on
symbolic items only, accounted for significant unique variance in Math Fluency.

115
Table 3.11 Linear regression analyses predicting Math Fluency raw scores with Odd-One-Out scores and symbolic and nonsymbolic efficiency measures as predictors. Math Fluency Predictor β t ΔR2 Eff. sym. .447* 2.10 .06731 Eff. nonsym. .036 .180 .00049 OOO .244 1.76 .04716 Note. OOO – Odd-one-out; Eff. sym – efficiency measure of symbolic RT; Eff. nonsym – efficiency measure of nonsymbolic RT * p < .05.

116
3.4 Discussion
The goals of the current chapter were to a) assess the validity and reliability of the
paper-and-pencil magnitude comparison test, b) investigate whether performance on the
paper-and-pencil test accounted for greater variability in arithmetic scores compared to
performance on response time measures, c) identify whether the finding that symbolic
comparison skills account for more variability in math achievement scores than
nonsymbolic skills in Chapter 2 could be replicated and d) examine whether performance
on the paper-and-pencil magnitude comparison test accounted for unique variance in
arithmetic skills even when controlling for visual spatial working memory, which was
found to be significantly associated with Math Fluency in the previous chapter.
In regards to the first goal of this chapter, which was to evaluate the validity of
my task, I found that symbolic accuracy scores on the paper-and-pencil test significantly
correlated with symbolic and nonsymbolic accuracy on the computer task and symbolic
and nonsymbolic efficiency measures on the computer task. Nonsymbolic accuracy
scores on the paper-and-pencil test did not significantly correlate with either symbolic or
nonsymbolic accuracy of the computer task or with symbolic or nonsymbolic efficiency
measures. These findings indicate that children who performed well on the symbolic
items of the paper-and-pencil test also performed well on the symbolic and nonsymbolic
trials of the computer task. Moreover, these results suggest that only the symbolic items
of my test demonstrate evidence of convergent validity. Another way to measure the
validity of the test scores belonging to a particular measure is to use them to predict other
variables of interest, also known as criterion-related validity. Recall that in Chapter 2,
performance on symbolic items was a significant predictor of Math Fluency and

117
Calculation scores. In the current chapter it was also found that symbolic scores were a
predictor of Math Fluency scores. Both of these results provide evidence that the
symbolic items of my test demonstrate criterion-related validity in addition to convergent
validity.
The Math Fluency assessment was administered at the same time as my test of
magnitude comparison, therefore my paper-and-pencil test has demonstrated concurrent
validity. Using a longitudinal design, future work should examine the predictive validity
of the magnitude comparison tool as a predictor of math skills across developmental time
(see Chapter 4).
Findings from this chapter also demonstrated that participant scores on the paper-
and-pencil task at time one of test administration significantly correlated with participant
scores at time two of administration, providing evidence that my magnitude comparison
task demonstrates test-retest reliability. Moreover, my test’s reliability allows for greater
confidence when correlating test scores of the paper-and-pencil task with other variables
of interest such as math achievement. As discussed above, the use of unreliable measures
in any experiment leads to the risk of finding no group differences even if those
differences do in fact exist. This scenario would be especially harmful for identifying
individual differences in children’s basic magnitude processing skills. Therefore, it is
imperative that the paper-and-pencil test in this thesis demonstrates evidence of
reliability. Consequently, the finding here of the test-retest reliability of the paper-and-
pencil measure provides verification that this simple assessment may be administered for
its intended use.

118
As mentioned, previous research has shown that children who have strong skills
in arithmetic, also demonstrate strong magnitude processing skills. It follows, therefore,
that a sound assessment of this basic competency is crucial. The validity and reliability
demonstrated by the measurement tool investigated in the current chapter provides
evidence of the test’s soundness. It also indicates that this paper-and-pencil task may be
a good alternative to response time measures where computers and the necessary
software may not be easily accessible to teachers.
The second goal of this chapter was to examine the unique variability accounted
for by the response time measure and paper-and-pencil measure in children’s arithmetic
skills. Results demonstrated that the symbolic efficiency measure of the computerized
task accounted for unique variability in children’s arithmetic abilities over and above
symbolic performance on the paper-and-pencil task. However, while these results
demonstrate a qualitative difference in the variance accounted for by both variables, it is
not known whether this difference in variance is statistically different. For this reason, it
cannot be fully determined that the response time measure used in the current chapter is a
more sensitive measure of magnitude processing skills than the paper-and-pencil test.
Thus, the specific nature of the unique variance accounted for by both variables should be
further considered in future research.
In the present chapter, I found a significant correlation between performance on
the symbolic items of the paper-and-pencil task and individual differences on Math
Fluency scores. This finding suggests that Grade 1 students who scored highly on
arithmetic as measured by Math Fluency also tended to receive high scores on symbolic
magnitude comparison. However, no significant relationship between accuracy of

119
nonsymbolic items and arithmetic performance scores was found. Since results in
Chapter 2 demonstrated a significant relationship between symbolic and nonsymbolic
scores of the paper-and-pencil test and Math Fluency, and the current sample of Grade 1
participants was smaller than the sample of Grade 2 and Grade 3 children in Chapter 2,
an additional correlational analysis was conducted by combining the Grade 1 participants
from Chapter 2 and the current chapter. Results revealed that with this larger sample,
both symbolic and nonsymbolic performance on the paper-and-pencil test correlated with
Math Fluency. These findings replicate the results in Chapter 2 and also correspond with
results in the literature (De Smedt, Verschaffel & Ghesquière, 2009; Durand et al., 2005;
Halberda, Mazzocco & Feigenson, 2008; Holloway & Ansari, 2009; Mazzocco,
Feigenson & Halberda, 2011).
Secondly, a regression analysis performed with the larger sample to examine
which format accounted for greater variance in arithmetic skills revealed that
participant’s scores on symbolic items was a significant predictor of arithmetic abilities
while nonsymbolic scores were not, replicating findings from Chapter 2.
These results also replicate what has been found in earlier studies (i.e., De Smedt,
Verschaffel & Ghesquière, 2009; Durand et al., 2005; Holloway & Ansari, 2009) where
symbolic magnitude processing has been shown to significantly predict math
achievement. These findings diverge from the work of Halberda, Mazzocco and
Feigenson (2008) and Mazzocco, Feigenson and Halberda (2011) who found that
nonsymbolic processing accounts for variance in children’s arithmetic performance.
However, it is important to note that the two studies conducted by this research group did

120
not include a symbolic comparison task; therefore, no claims about unique variance over
and above symbolic processing can be made.
The results from this current chapter also demonstrated that efficiency measures
of symbolic performance on the computerized task accounted for unique variance in
children’s arithmetic performance while nonsymbolic performance did not. These data
again correspond with the findings of Chapter 2, which demonstrated that symbolic
processing only in the paper-and-pencil test accounted for unique variance in arithmetic
skills. Results from the paper-and-pencil test and computer task once more provide
additional support for the premise that the mapping of symbols to numerical magnitudes
is an important correlate of individual differences in children’s arithmetic abilities
(DeSmedt & Gilmore, 2011; Holloway & Ansari, 2009; Rousselle & Noël, 2007).
Similar to Chapter 2, results from this present chapter revealed a correlation
between Math Fluency and magnitude comparison test scores and visual-spatial working
memory. Results from the multiple regression analysis demonstrated that scores on the
Odd-One-Out subtest of the AWMA accounted for unique variance in children’s
arithmetic scores while in Chapter 2, Spatial Recall scores accounted for unique variance
in children’s arithmetic scores. This difference in subtests may be due to the differences
in the samples between chapters such as age range and sample size. Nevertheless, in both
chapters it is revealed that visual-spatial working memory and symbolic processing as
measured by the paper-and-pencil test each account for unique variance in arithmetic.
Since both working memory and symbolic number processing skills account for
unique variance in arithmetic achievement, this finding provides more evidence to
suggest that these competencies are not confounded with one another in predicting

121
individual differences in children’s arithmetic skills (DeStefano & Lefevre, 2004;
Kalaman & LeFevre, 2007), demonstrating that this simple test can identify individual
differences in arithmetic ability that are not explained by visual-spatial working memory.
Instead of being confounded, basic symbolic magnitude processing and visual-spatial
working memory each account for unique variance in young children’s mathematical
fluency.
Results from the sample in the current chapter did not demonstrate a significant
difference between performances on symbolic items compared to nonsymbolic items in
Grade 1 children at the first testing point. However, using the larger sample of 70
children, a significant difference was found whereby participant scores on the
nonsymbolic items were significantly greater than scores on the symbolic items. These
data suggest that children in the first stages of formal math instruction may have a
stronger representation of nonsymbolic magnitudes in place and are still in the process of
developing representation of symbolic magnitudes.
In the current chapter, the test-retest reliability of the paper-and-pencil test was
examined; however, the reliability of the computer task was not. Future studies of this
kind should therefore also examine the test-retest reliability of the response time measure
used. It should also be recognized that in the current chapter only Grade 1 participants
were included in the sample. Consequently, future research would also have to
investigate the validity and reliability of the paper-and-paper test using a larger sample
with more age ranges represented. In addition, to investigate numerical mapping between
symbolic and nonsymbolic processing in more depth, future studies should consider
testing a younger age group such as kindergarten students. This age group is in a

122
sensitive period in their learning where real number sense foundations are being laid and
where the relationship between nonsymbolic and symbolic is beginning to be established
(Griffin & Case, 1997). Forthcoming research should also consider the ability of this
paper-and-pencil test to predict individual differences in math achievement scores in
older grades based on the basic magnitude processing skills of a kindergarten sample.
In sum, the current results indicate that a paper-and-pencil test of magnitude
processing skills demonstrates levels of convergent validity, criterion-related validity and
test-retest reliability. Using a larger sample of Grade 1 students, it was also revealed that
symbolic magnitude processing on the paper-and-pencil test accounted for greater
variance in children’s arithmetic scores, while nonsymbolic magnitude processing did
not. A similar finding was also observed for the computer task where efficiency measures
of symbolic comparison were a significant predictor of arithmetic achievement while
efficiency measures of nonsymbolic performance were not. Results also demonstrated
that performance on the symbolic trials of the computer task and symbolic items of the
paper-and-pencil test accounted for unique variance in arithmetic skills, while
nonsymbolic processing on both tasks did not. Finally, it was found that symbolic
processing skills accounted for unique variance in arithmetic ability over and above
visual-spatial working memory for both the paper-and-pencil task and RT measures.
Findings from this chapter indicate that this simple two-minute paper-and-pencil
test is a valid and reliable measure of basic magnitude processing in young students. This
suggests that a test of this kind would, therefore, be a vital addition to many classrooms
as it would permit teachers to accurately and efficiently assess an important competency
that plays a crucial role in the success of children’s math development.

123
3.5 References
American Educational Research Association, American Psychological Association,
National Council on Measurement in Education (1999). Standards for
Educational &Psychological Testing. Washington, DC: American Educational
Research Association.
Berg, D. H. (2008). Working memory and arithmetic calculation in children: The
contributory roles of processing speed, short-term memory, and reading. Journal
of Experimental Child Psychology, 99, 288-308.
Bugden, S., & Ansari, D. (2011). Individual differences in children’s mathematical
competence are related to the intentional but not automatic processing of Arabic
numerals. Cognition 118(1), 32-44.
Chard, D., Clarke, B., Baker, S.K., Otterstedt J., Braun D., & Katz, R. (2005). Using
measures of number sense to screen for difficulties in mathematics: Preliminary
findings. Assessment for Effective Intervention 30(2), 3-14.
DeSmedt, B. & Gilmore, C. K. (2011). Defective number module or impaired access?
Numerical magnitude processing in first graders with mathematical difficulties.
Journal of Experimental Child Psychology, 108, 278-292.
DeSmedt, B., Verschaffel, L., & Ghesquière, P. (2009). The predictive value of
numerical magnitude comparison for individual differences in mathematics
achievement. Journal of Experimental Child Psychology, 103, 469-479.
DeStefano, D., & LeFevre, J. (2004). The role of working memory in mental arithmetic.
European Journal of Cognitive Psychology, 16, 353-386.

124
Durand, M., Hulme, C., Larkin, R., & Snowling, M. (2005). The cognitive foundations
of reading and arithmetic skills in 7 to 10-year-olds. Journal of Experimental
Child Psychology, 91, 113-136.
Ebel, R., & Frisbie, D. (1991). Essentials of Educational Measurement. Englewood
Cliffs, NJ: Prentice Hall.
Gavens., N., & Barrouillet, P. (2004). Delays of retention, processing efficiency, and
attentional resources in working memory span development. Journal of Memory
and Language, 51, 644-657.
Geary, D. C. (1993). Mathematical disabilities: Cognitive, neuropsychological, and
genetic components. Psychological Bulletin, 114, 345-362.
Griffin,S. & Case, R. (1997). Rethinking the primary school math curriculum: An
approach based on cognitive science. Issues in Education, 3(1), 1-49.
Halberda, J., Mazzocco, M., & Feigenson, L. (2008). Individual differences in non-
verbal number acuity correlate with maths achievement. Nature, 455, 665-668.
Holloway, I., & Ansari, D. (2009). Mapping numerical magnitudes onto symbols: The
distance effect and children’s mathematical competence. Journal of Experimental
Child Psychology, 103(1), 17-29.
Kalaman, D. A., & LeFevre, J. (2007). Working memory demands of exact and
approximate addition. European Journal of Cognitive Psychology, 19, 187-212.
Kline, T. (2005). Psychological Testing: A practical approach to design and evaluation.
Thousand Oaks, CA: Sage Publications, Inc.

125
Koponen, T., Aunola, K., Ahonen, T., & Nurmi, J. (2007). Cognitive predictors of
single-digit and procedural calculation skills and their covariation with reading
skill. Journal of Experimental Child Psychology, 97, 220–241.
Kopriva, R. J., & Shaw, D. G. (1991). Power estimates: The effect of dependent variable
reliability on the power of one-factor anovas. Educational and Psychological
Measurement, 51, 585–595.
Krajewski, K., & Schneider, W. (2009). Exploring the impact of phonological
awareness, visual-spatial working memory, and preschool quantity-number
competencies on mathematics achievement in elementary school: Findings from a
3-year longitudinal study. Journal of Experimental Child Psychology, 103, 516-
531.
Maloney, E.A., Risko, E.F., Preston, F., Ansari, D. & Fugelsang, J. (2010). Challenging
the reliability and validity of cognitive measures: The numerical distance effect.
Acta Psychologia, 134, 154-161.
Mazzocco, M., Feigenson, L., & Halberda, J. (2011). Preschoolers’ precision of the
approximate number system predicts later school mathematics performance.
PloS ONE, 6(9): e23749.
Rousselle L., & Noël, M. (2007). Basic numerical skills in children with mathematics
learning disabilities: A comparison of symbolic vs. non-symbolic number magnitude
processing. Cognition 102(3), 361-95.
Salvia, J., Ysseldyke, J.E, & Bolt, S. (2007). Assessment in Special and Inclusive
Education (10th ed.). Boston, MA: Houghton Mifflin Company.

126
Sasanguie, D., Defever, E., Van den Bussche, E. & Reynvoet, B. (2011). The reliability
of and the relation between non-symbolic numerical distance effects in
comparison, same-different judgments and priming. Acta Psychologica, 136(1),
73-80.

127
Chapter 4
4. Investigating the Predictive Validity of the Paper-and-pencil Task and its Association with Arithmetic Skills in Kindergarten Children.
4.1 Introduction
The first goal of the previous chapter was to investigate the soundness of the
paper-and-pencil test of basic magnitude processing by assessing its convergent validity,
criterion-related validity and test-retest reliability. In order to assess the convergent
validity of the paper-and-pencil test, participants’ scores on the processing measure were
correlated with their performance on a similar computerized version of magnitude
comparison. I found that children’s scores on the symbolic items of the paper-and-pencil
test significantly correlated with performance on the symbolic and non-symbolic trials on
the computer task. However, this same relationship was not significant between
nonsymbolic performance on the paper-and-pencil task and both symbolic and
nonsymbolic performance on the computer task, suggesting that the symbolic items of the
paper-and-pencil test demonstrate higher convergent validity than the nonsymbolic items.
Finally, in order to assess reliability, performance on the paper-and-pencil test at
one time point was correlated with children’s performance at a second time point. I found
that performance on the assessment at both time points significantly correlated with each
other, indicating that this basic measure demonstrates test-retest reliability, yielding
evidence to suggest that it is a reliable measure of children’s basic magnitude processing
skills.
Using a combined sample of Grade 1 participants from Chapter 2 with the Grade
1 sample in Chapter 3, a correlation with arithmetic performance was demonstrated for
both symbolic and nonsymbolic processing, corresponding with previous studies (De

128
Smedt, Verschaffel & Ghesquière, 2009; Durand et al., 2005; Halberda, Mazzocco &
Feigenson, 2008; Holloway & Ansari, 2009; Mazzocco, Feigenson & Halberda, 2011).
Results in Chapter 3, convergent with those reported in Chapter 2, revealed that symbolic
and nonsymbolic performance on the paper-and-pencil task were significant correlates of
children’s arithmetic skills; however, symbolic processing accounted for unique variance
in children’s arithmetic scores while nonsymbolic processing did not, demonstrating the
criterion-related validity of the symbolic items of the paper-and-pencil test. With this
larger sample, it was also shown that Grade 1 performance on the nonsymbolic items of
the paper-and-pencil test was significantly higher than performance on symbolic items,
replicating results found in Chapter 2.
Based on the findings described above, the goals of the current chapter were
fourfold. First, based on the results of Chapter 2 and 3, I wanted to investigate if I could
again find that symbolic processing on the paper-and-pencil test was a significant
predictor of arithmetic skills in a younger sample, specifically kindergarten children. The
previous chapters have only assessed older school age children; however, it is equally
important to look at the value of such measurements before children enter the formal
classroom. Second, I also wanted to examine whether or not kindergartners would
perform better on nonsymbolic items compared to symbolic items as was found to be the
case in Grade 1 children in the previous two chapters. This finding would provide more
support for the theory that across developmental time, children’s magnitude processing
skills shift from strong nonsymbolic processing abilities to more efficient processing of
symbolic magnitudes, potentially due to formal math instruction in school.

129
Third, to extend the investigation of the paper-and-pencil test’s validity from
Chapter 3, in the current chapter I also investigated whether kindergarten children’s
performance on a number line estimation task correlated with their scores on the paper-
and-pencil test. In this task, children have to estimate the location of a symbolic
magnitude on a number line. The number line estimation task has been used in previous
work as a measure of basic magnitude processing (Siegler & Opfer, 2003). Since both the
paper-and-pencil task and the number line estimation task assess basic magnitude
processing, by correlating children’s performance on both measures, the convergent
validity of the paper-and-pencil test was examined further.
In Chapter 3, the paper-and-pencil task and Math Fluency tests were administered
at the same time, providing an estimate of concurrent validity, but not predictive validity.
Therefore, a fourth goal of the present chapter was to expand on findings of the previous
two chapters in order to investigate the predictive validity of the paper-and-pencil
measure. To accomplish this in the current chapter, I investigated whether kindergarten
children’s performance on the paper-and-pencil measure was a significant predictor of
their math performance in Grade 1. To begin my literature review, I describe early
indicators of children’s scholastic achievement and how they relate to future learning
outcomes, motivating the use of assessments in the first years of school.
4.1.1 Early Predictors of Academic Achievement and Success in the Workplace.
Every September across Canada, thousands of children begin their first day of
kindergarten. Since its inception in the 1800s (Prochner, 2000), the kindergarten
classroom in this country has experienced many changes in an effort to provide students
with the most favorable learning environment possible. For example, most recent

130
changes include the introduction of full-day programs versus the traditional half-day
model, and a growing number of school boards are also moving towards play-based
classrooms versus an academic style of instruction. Each change is made with the goal of
better equipping students with the skills and knowledge needed to become successful
learners. A growing body of research is demonstrating that this first year of schooling is
very crucial, as the skills children develop in the classroom at this young age are very
strong predictors of not only their academic achievement in later grades, but their overall
well-being in adulthood as well.
For example, Duncan et al. (2007) completed a meta-analysis of six longitudinal
studies to determine the relationship between school-entry math and reading, attention,
and socioemotional skills - three main elements of school readiness – and later math and
reading achievement. The samples represented in the studies included children from the
United States, Canada and the United Kingdom. Across all six studies, it was found that
the strongest predictors of later school achievement were kindergarten level math,
reading and attention skills. Further analyses revealed that early math skills were the
strongest predictor of later reading and math achievement in children ages 8 – 14 years,
followed by reading skills and attention. The most noteworthy result was that school
entry math skills were a greater predictor of later reading achievement than school entry
reading abilities. Other findings demonstrated that socioemotional behaviours, such as
social skills, were not found to be significant predictors of later academic performance.
In an effort to replicate and extend the findings of Duncan et al. (2007), Romano,
Babchishin, Pagani and Kohen (2010), conducted a study with a nationwide Canadian
data set not included in the Duncan et al. (2007) work. They investigated the influence of

131
kindergarten language/verbal ability, numeracy skills, attention and socioemotional
behaviours on later math and reading performance in the third grade. Results again
demonstrated that kindergarten math skills were the strongest predictor of Grade 3 math
and reading outcomes. Reading and attention skills predicted later achievement while
socioemotional behaviours did not predict later performance. Furthermore, with
extended analyses they found that kindergarten math even predicted socioemotional
behaviours. Specifically, higher kindergarten math performance predicted less physical
aggression and better attention skills in Grade 3. These same findings were not found for
language/verbal ability.
In a third study examining the role of early numeracy skills in later academic
success, Geary, Hoard, Nugent and Bailey (2013) conducted a longitudinal study with a
large sample of students beginning in kindergarten and ending in the seventh grade.
Beginning in Grade 1, the participants received tasks in basic number knowledge such as
basic addition, number matching and number line estimation. In Grade 7 they were tested
using functional numeracy measures, which are employed in studies of labor economics,
employability and other similar outcomes in adulthood. Results revealed that children’s
performance on basic number skills in Grade 1 was a significant predictor of their
functional numeracy in Grade 7 controlling for intelligence, working memory, in-class
attentive behaviour and other demographic factors.
Based on the findings of Duncan et al. (2007), Romano et al. (2010) and Geary et
al. (2013), which demonstrate the predictive ability of school-entry numeracy skills for
later outcomes in academic achievement, socioemotional behaviours and work-related
numeracy skills, it is clear that early childhood educators need to focus as much attention

132
on developing strong numeracy skills in their young students as they do their literacy
skills. Moreover, because the skills children develop in the early grades are so important
to their success in later life, it follows that the use of reliable and valid assessments of
math learning is necessary even at the earliest stages of formal education.
Kindergarten is the period where a child’s number sense foundations are being
laid and it is the age at which the relationship between numerical symbols and the
nonsymbolic magnitudes they represent, is beginning to be established (Griffin & Case,
1997). Assessment at this phase, therefore, has the advantage of allowing teachers to
identify children who may be struggling with understanding the relationship between
symbolic and nonsymbolic magnitudes, which otherwise may place students at risk for
later problems with other number related learning. Therefore, early identification of any
difficulties children may be experiencing in their math learning is highly beneficial to
both students and teachers. Detecting difficulties at an early age allows for intervention
and strengthening of skills, which may be weak, before children continue to higher grade
levels. In addition, correcting concepts that children are struggling with in the first stages
of schooling may also help to avoid the development of negative attitudes and math
anxiety (Wright, Martland & Stafford, 2006).
In the area of reading, assessments administered in the early grades to measure
the foundational competency of phonemic awareness are shown to be valuable in the
early diagnosis of at-risk children (Stanovich, Cunningham & Cramer, 1984; Vellutino &
Scanlon, 1987; Williams, 1984). Furthermore, early phonemic awareness is a strong
predictor of children’s later reading abilities (Stanovich, 1986).

133
The question then remains if a similar approach can be taken in mathematics by
assessing the foundational competency of magnitude comparison in young students. As
reviewed in Chapter 2, De Smedt, Verschaffel and Ghesquière (2009) investigated
whether numerical magnitude comparison has predictive value for individual differences
in mathematical achievement. They found that children’s symbolic magnitude
comparison skills measured in Grade 1 was a significant predictor of their math
achievement in Grade 2.
Similarly, nonsymbolic magnitude comparison skills measured in very young
children have also been found to be a predictor of later math achievement. For example,
using response time measures, Mazzocco, Feigenson and Halberda (2011) found that
individual differences in preschoolers’ performance on nonsymbolic magnitude
comparison was a strong predictor of their later school mathematics performance at age
six.
The evidence presented in the two studies above demonstrates the effectiveness of
testing the magnitude processing skills of young children. However, the relative
predictive validity of symbolic and nonsymbolic comparison is unknown, since both
studies mentioned above only had either a symbolic or nonsymbolic magnitude
comparison measure. Against this background, one aim of the present chapter was to
investigate whether kindergarten children’s scores on both symbolic and nonsymbolic
magnitude processing, measured at the same time by the paper-and-pencil test, could
predict individual differences in arithmetic achievement in Grade 1.
In the previous chapter, it was shown that my test demonstrated concurrent
validity in that individual differences in symbolic magnitude comparison skills predicted

134
individual differences in math achievement scores. However, it is unknown whether or
not scores on my test can predict math performance in later grades, therefore
demonstrating predictive validity. To examine this question, I investigated whether my
paper-and-pencil test could accurately differentiate between children in my kindergarten
sample who were rated as below average, average or above average in Grade 1 math by
their teacher. In addition, this specific investigation allowed me to also identify whether
the paper-and-pencil test could be linked to educational assessments (such as report card
grades).
4.1.2 Number Line Estimation
As previously mentioned, the number line estimation task has been used as
another means of evaluating basic magnitude processing in both adults and children
(Siegler & Opfer, 2003). Previous work using this assessment has shown that the
performance of children in kindergarten to Grade 3 on the number line estimation task
correlates with their proficiency in arithmetic tasks, standardized mathematical
achievement scores and mathematical school grades (Booth & Siegler, 2004; Schneider,
Grabner & Paetsch, 2009). Furthermore, studies have also demonstrated that children’s
number line estimation abilities correlate with their magnitude comparison skills (Laski
& Siegler, 2007). Against this background, a second goal of the current study was to
examine whether kindergarten students’ performance on my paper-and-pencil task
correlated with their performance on number line estimation. If a significant relationship
was revealed between students’ performance on the number line estimation task and their
scores on the magnitude comparison task, it would suggest that young children’s ability
to compare magnitudes is related to their underlying mental representation of number

135
even at this early stage of development, and furthermore, that number line estimation and
magnitude comparison measure similar competencies, thus providing evidence for
convergent validity.
4.1.3 The Relationship Between Symbolic and Nonsymbolic Processing in Kindergarten Children.
Based on the performance of Grade 1 students in Chapters 2 and 3, I expected that
kindergartners would be less accurate on symbolic items than nonsymbolic items. This
finding would suggest that younger children are worse at processing symbolic
magnitudes than nonsymbolic magnitudes and would further demonstrate that this
magnitude comparison task can capture age differences in numerical magnitude
processing. More specifically, these results would indicate that over the course of
developmental time, typically developing children become more proficient with symbolic
number processing as they progress in school and acquire more familiarity and
automaticity with numerical symbols. Moreover, it would also suggest that perhaps
young children have strong pre-existing representations of nonsymbolic numerical
magnitude (that can even be found in infancy i.e., Xu & Spelke, 2000) and only gradually
map these onto symbolic representations.
In this current study, I also anticipated finding a relationship between
kindergarten students’ performance on an arithmetic assessment and their performance on
both symbolic and nonsymbolic magnitude comparison as demonstrated by participants
in the previous two chapters. This would confirm that even at this early age, an
association can be found between basic magnitude processing, as measured by the paper-
and-pencil task, and higher order math skills.

136
In sum, the aim of the current chapter, in order of the analyses described below,
was to a) investigate whether kindergarten children would show a significant difference
in their symbolic and nonsymbolic scores on the paper-and-pencil test as demonstrated by
Grade 1 students in Chapters 2 and 3, b) identify whether the finding that symbolic
comparison skills account for unique variance in concurrently measured arithmetic scores
over and above nonsymbolic skills would be replicated in younger children, c) investigate
whether performance on the paper-and-pencil test correlated with children’s number line
estimation abilities and d) explore whether children’s performance on the paper-and-
pencil assessment in kindergarten could predict their math grades in Grade 1.
4.2 Materials and Method
4.2.1 Participants
This project was a unique collaboration between the Numerical Cognition Lab at
the University of Western Ontario and the Toronto District School Board (TDSB), the
largest school board in Canada. Participants included 349 students in senior kindergarten
representing seven elementary schools in the TDSB. Five students were completely
removed due to missing demographic information such as age and gender, and another
thirteen participants were completely removed due to low scores on the Number Naming
test (see below) for a total sample of 331 (167 females) participants.
This sample is rare in that participants included individuals from several ethnic
and socioeconomic backgrounds making it a highly representative sample of Canadian
kindergarten students. In addition, the TDSB also agreed to provide demographic
information for each student. Permission was granted by the TDSB and seven school
principals gave permission to conduct the following study at their institution.

137
4.2.2 Tests and Materials
4.2.2.1 Number Naming
In this task, children were presented with Arabic numbers 1-9 in random order
and were asked to name each number. They received one point for each number that was
correctly named for a maximum score of nine. This task was administered to measure
children’s knowledge of the symbolic numbers used in the other tasks. This task was
essential as the other tasks using symbolic numbers can only be reliably interpreted if
children know the meaning of the symbols they are shown, therefore any child who
received a score below seven (thus knowing equal to or fewer than 2/3 of the single digit
numerals) was removed from the sample.
4.2.2.2 Magnitude Comparison Task
This is the same paper-and-pencil task described in Chapters 2 and 3. The only
exception is that students were given a two-minute time limit for the symbolic items and
a two-minute time limit for the nonsymbolic items. This extension in testing time was
allowed to take into consideration the young age of the current sample compared to the
older ages tested in the previous chapters.
4.2.2.3 Number Line Estimation
For this task, children were asked to estimate the spatial position of an Arabic
digit on a physical number line. Participants were presented with a number line 25 cm in
length with the Arabic digit 0 at one end the Arabic digit 10 at the other end and a target
number in a large font printed above the line (see Fig. 4.1). The children were presented
with target numbers 1-9, one at a time, in random order and were asked to indicate where
the number would go on the line. Each item was presented on its own sheet of paper.

138
Instructions were given as follows, “This number line goes from 0 at this end to 10 at this
end. If this is 0 and this is 10, where you put N?” (with N being the number specified on
the particular trial). To ensure that participants understood the instructions given, each
child completed one sample item as practice with the experimenter before beginning the
test. To assess number line performance, the individual mean error on the task was
calculated as a percentage. Therefore, students who performed well on this task received
low mean error scores.
Figure 4.1 Example of a test item on the number line estimation task. Here, the hatch
mark represents where an individual may place his or her response to the question “If this
is 0 and this is 10, where would you put 3?”
4.2.2.4 Arithmetic Task
Since I was testing kindergarten students, the math subtests of the Woodcock
Johnson III would not be appropriate because the arithmetic problems are mostly
presented in a vertical fashion and children are generally not taught how to add numbers
in this orientation until Grade 1. Therefore, for the purposes of this chapter, a simple
non-standardized, paper-and-pencil arithmetic measure was administered. Participants

139
were given 5 single-digit addition (1+2, 1+3, 4+1, 3+2, 5+1) and 5 single-digit
subtraction problems (3-1, 2-1, 4-3, 3-2, 4-2). Children received one point for each
correctly answered problem for a maximum score of ten. No time constraints were given
to complete this task.
4.2.2.5 Report Card Grades
In May 2010, as stated in the document Growing Success (2010), the Ontario
Ministry of Education created a new policy for assessing, evaluating and reporting school
grades for students in Grades 1-12. As part of this policy, all elementary school students
(Grades 1-8) now receive a Progress Report Card after the fall term and two Provincial
Report Cards; one in the spring and the other in the summer. The Progress Report Card
does not give a letter grade or percentage mark for subject areas. Instead it provides an
initial indication of a student’s general progress. For subjects like math, the Progress
Report Card indicates whether a student is progressing very well, progressing well or
progressing with difficulty. These terms will be changed to above average, average or
below average respectively for the remainder of the chapter.
4.2.3 Procedure
Students were tested by their classroom teacher in their own classroom or in
another quiet area of their school. Each testing session was approximately 20 minutes.
Teachers were trained by the experimenter on the administration guidelines of each
assessment and were also given detailed manuals with all assessment procedures.
Although teachers administered the assessments, each of the tests were scored by myself
and a trained research assistant. The TDSB provided each student’s Progress Report

140
Card grades in Math after their first three months of Grade 1, which was six months after
they completed the magnitude comparison task in kindergarten.
4.3 Results
4.3.1 Descriptive Statistics
Participants’ ages along with the means and standard deviations for each test
administered are shown in Table 4.1.
Table 4.1.
Means and Standard Deviations (S.D.)
Test N Mean Scores (S.D.) Range (min.-max.)
Age (months) 331 71.52 (3.31) 77-88
Number Knowledge 331 8.94 (.280) 7-9
Arithmetic 291 6.00 (2.93) 1-10
Symbolic1 302 35.40 (12.75) 1-56
Nonsymbolic1 296 37.28 (9.81) 2-55
Overall 282 72.66 (20.23) 8-111
Number line2 255 13.82 (7.82) 1- 44
Note. Arithmetic – total correct scores on arithmetic test; symbolic – total correct scores on symbolic items of paper-and-pencil test; nonsymbolic – total scores on nonsymbolic items of paper-and-pencil test; Overall - total correct scores on symbolic and nonsymbolic items combined; Numberline estimation – mean error given as percentage 1Maximum score on both symbolic and nonsymbolic was 56 2To assess number line performance the mean error on the task was calculated as a percentage.
As seen in Table 4.1, although the final sample included 331 participants, not all
participants completed each test. A description of the missing data is provided below.
In the case of the arithmetic test, 22 students received a score of zero and 18 did
not complete the arithmetic task. In the case of the magnitude comparison task, 5

141
students did not complete the symbolic task correctly (i.e., skipped items or pages) and
30 students did not complete the symbolic task (i.e., the symbolic section of their booklet
was incomplete). For the nonsymbolic task, 10 students did not complete the task
correctly (i.e., skipped items or pages) and 25 participants did not complete the
nonsymbolic items. As seen in Table 4.1, 282 students completed both the symbolic and
nonsymbolic items of the paper-and-pencil test. For the number line task, 7 students’
booklets were incomplete or missing, 41 students placed each of their responses in the
middle of the number line and 28 children did not receive correct test administration by
their teacher (i.e., students received the test items in numerical order rather than a random
sequence).
4.3.2 Investigating Symbolic Compared to Nonsymbolic Performance on the Paper-and-Pencil Test
To investigate whether there was a significant difference between children’s performance on symbolic and nonsymbolic items of the paper-and-pencil assessment, a
paired samples t-test was completed to compare children’s performance on both formats.
As seen in Figure 4.2, results revealed that children performed significantly higher on
nonsymbolic items than symbolic items (t(281) = 2.62, p < .05).

142
Figure 4.2. Bar graph representing participant performance in each format of the paper-
and-pencil test. Participants’ performance on nonsymbolic items was significantly higher
than their performance on symbolic items. Standard errors are represented by the error
bars attached to each column.
4.3.3 Investigating the Relationship Between the Paper-and-Pencil Test, Arithmetic Performance and Number Line Estimation Abilities.
Children’s number line estimation performance was calculated as their percent of
absolute error (PE). This was calculated using the following equation (Siegler & Booth,
2004):
0
5
10
15
20
25
30
35
40
symbolic nonsymbolic
Test scores

143
For example, if a child was asked to estimate the location of 3 on the number line and
placed his/her response at the location that corresponded to 5, percent absolute error
would be 20%: [(5 – 3)/10] x 100.
The next analysis examined the relationship between children’s performance on
the paper-and-pencil test, arithmetic scores and performance on number line estimation
(see Table 4.2). Results demonstrated that arithmetic scores significantly correlated with
symbolic performance (r(291) = .29, p < .01), nonsymbolic performance (r(266) = .22,
p < .01) and number line scores (r(242) = -.21, p < .01). Symbolic performance
significantly correlated with nonsymbolic scores (r(282) = .58, p < .01) and number line
estimation scores (r(239) = -.26, p < .01). Nonsymbolic scores significantly correlated
with number line estimation (r(235) = -.22, p < .01).
Table 4.2. Correlation between children’s number line estimation, paper-and-pencil test and arithmetic scores Variable 1 2 3 4 1. Arithmetic - .29** .22** - .21** 2. Symbolic - .58** - .26** 3. Nonsymbolic - - .22** 4. Number line - Note. Arithmetic – mean score on arithmetic test; Symbolic – symbolic mean score; Nonsymbolic – nonsymbolic mean score; Number line – mean of percent of absolute error on number line estimation task ** p < .01.

144
4.3.4 Investigating the Unique Variance Accounted for in Children’s Arithmetic Skills Using Age, Number Line Estimation Scores, Symbolic Processing and Nonsymbolic Processing as Predictors.
In Chapters 2 and 3, the unique variance accounted for in children’s arithmetic
scores by the symbolic and nonsymbolic items of the paper-and-pencil test was
examined. I found that in first to third grade children, symbolic items were a significant,
unique predictor of participants’ arithmetic scores while nonsymbolic performance was
not. To extend this finding with the current data, I examined the unique variance
accounted for in kindergarten children’s arithmetic scores using age, and symbolic and
nonsymbolic scores on the paper-and-pencil test as predictors. A linear regression was
completed to identify which of these three variables accounted for greater variance in
children’s arithmetic skills. Arithmetic scores were the dependent variable, while age,
symbolic and nonsymbolic scores on the paper-and-pencil test were the predictor
variables. Since no hypotheses were made about the order of predictors, and in an effort
to investigate which variables accounted for significant unique variance, all predictor
variables were entered as one step. The analysis revealed that the model was significant
(F(3, 259) = 8.52, p < .01, R2 = .091). Results also demonstrated that performance on
symbolic items was a significant predictor of arithmetic performance while children’s
nonsymbolic scores were not (see Table 4.3).

145
Table 4.3. Linear regression analyses predicting arithmetic scores with age, symbolic and nonsymbolic performance on the paper-and-pencil test as predictors. Arithmetic
Predictor β t ΔR2
Age .077 1.27 .00573 Symbolic .223* 3.02 .03145 Nonsymbolic .081 1.11 .00103 Note. Age – mean age in months; Symbolic – symbolic mean score; Nonsymbolic – nonsymbolic mean score * p < .05.
Since participants’ number line estimation scores and their performance on the
paper-and-pencil test both significantly correlated with their arithmetic achievement, the
specificity of the relationship between arithmetic and magnitude processing had to be
further examined. To do this, I performed a second regression analysis. Since the results
of the first regression demonstrated that symbolic processing was the only significant
predictor of children’s arithmetic skills, for the second regression I only included
children’s symbolic scores and number line estimation scores as predictors of their
arithmetic performance. The analysis indicated that the model was significant (F(2, 226)
= 12.86, p < .01, R2 = .103). Results also demonstrated that performance on symbolic
items and number line estimation accounted for unique variance in children’s arithmetic
skills (see Table 4.4).

146
Table 4.4. Linear regression analyses predicting arithmetic scores with symbolic performance on the paper-and-pencil test and number line estimation as predictors Math Fluency
Predictor β t ΔR2
Symbolic .248** 3.82 .05788 Number line -.158* - 2.43 .01797 Note. Symbolic – symbolic mean score; Number line – mean percentage error on number line estimation task * p < .05. ** p < .01.
4.3.5 Examining the Predictive Validity of the Paper-and-Pencil Test
In order to investigate whether children’s performance on the paper-and-pencil
test in kindergarten could predict their math ability in Grade 1, a repeated measures
ANOVA using format (symbolic, nonsymbolic) as a within-subjects variable and math
grade (below average, average, above average) as a between-subjects variable was
conducted. It should be noted that I was only provided with Grade 1 math grades for 268
children from the original sample due to many children having changed schools and
teacher labour disruptions. Out of the 268 children in the analysis, 27 students were
below average, 176 were average and 65 were above average. Analysis revealed a main
effect of format (F(1, 265) = 9.36, p < .001, η2 = .034) demonstrating, consistent with the
data reported above, a significant difference between children’s performance on the
symbolic and nonsymbolic items. Results also revealed a main effect of math grade (F(2,
265) = 14.43, p < .001, η2 = .098) which implies that children’s performance on the
magnitude comparison task significantly differed between their level of math

147
performance as reported on their Grade 1 report card. That is, the better participants
performed on the magnitude comparison task in kindergarten, the higher their
achievement in Grade 1 math (see Fig 4.3). I also found an interaction of format and math
grade (F(2, 265) = 3.89, p < .001, η2 = .029), whereby below-average participants
performed significantly better on the nonsymbolic task compared to the symbolic task
(t(26) = 3.07, p <.05). In contrast, there was no significant difference between formats in
average (t(175) = 1.84, ns) or above average (t(64) = .194, ns) participants (see Fig. 4.3).2
2 I also conducted a multinomial logistic regression whereby results demonstrated that the higher a participant’s score on the magnitude comparison task, the less likely he/she would be rated as below average or average by his/her teacher.

148
Figure 4.3. Bar graph illustrating overall performance of participants in each math grade
level for symbolic and nonsymbolic items. Below average participants were significantly
better at nonsymbolic items compared to symbolic items. Participants rated as average
and above average in math did not demonstrate any difference between formats. The bar
graph also illustrates that the higher students’ achievement level in Grade 1 math, the
better their overall scores on the paper-and-pencil test in kindergarten. Standard errors are
represented by the error bars attached to each column.

149
4.4 Discussion
The goal of the current chapter was to a) investigate whether kindergarten
children would show a significant difference in their symbolic and nonsymbolic scores on
the paper-and-pencil test as demonstrated by Grade 1 students in Chapters 2 and 3,
b) identify whether the finding that symbolic comparison skills account for unique
variance in arithmetic scores over and above nonsymbolic skills could be replicated from
Chapter 2 and 3, c) investigate whether performance on the paper-and-pencil test
correlated with children’s number line estimation abilities and d) explore whether
children’s performance on the paper-and-pencil assessment in kindergarten could predict
their math grades in Grade 1.
In both Chapter 2 and Chapter 3, it was revealed that Grade 1 students earned
significantly lower scores on symbolic items of the paper-and-pencil test compared to the
nonsymbolic items. The first goal of the current chapter was to extend these findings by
exploring whether the results of the previous two chapters could be replicated using data
from a younger sample. Results from the current data set revealed that kindergarten
children received significantly higher scores on nonsymbolic items compared to symbolic
items of the paper-and-pencil processing measure. These findings correspond with the
results of Chapters 2 and 3, giving more evidence to suggest that young students who are
just being introduced to number symbols through formal math instruction may have a
more solid representation of nonsymbolic magnitudes while their representation of
symbolic magnitudes is still in the process of developing.
The second purpose of the current chapter was to identify if symbolic processing,
as measured by the paper-and-pencil test, accounted for greater variance in kindergarten
children’s arithmetic performance compared to their nonsymbolic processing as found in

150
Chapter 2 and 3 with first, second and third grade children. I first performed a correlation
analysis, which revealed that both children’s symbolic and nonsymbolic scores were
significantly related to their scores on the arithmetic test. In other words, children who
performed well on the paper-and-pencil task also received high scores on the non-
standardized arithmetic measure. A linear regression analysis revealed that kindergarten
children’s performance on symbolic items was a significant unique predictor of
arithmetic skills while nonsymbolic scores were not, replicating results from the previous
two chapters.
Again, these findings replicate what has been demonstrated in earlier studies
(i.e., DeSmedt, Verschaffel & Ghesquière, 2009; Durand et al., 2005; Holloway &
Ansari, 2009) which established that symbolic magnitude processing is significantly
correlated with math achievement as well as findings by Halberda, Mazzocco and
Feigenson (2008) and Mazzocco, Feigenson and Halberda (2011) who found that
nonsymbolic processing also correlates with children’s arithmetic performance. Findings
in the current chapter also provide more data to support the criterion-related validity of
the paper-and-pencil measure given that symbolic processing was a significant correlate
of arithmetic achievement.
The third goal of Chapter 4 was to further assess the convergent validity of the
paper-and-pencil test by investigating the relationship between children’s performance on
the number line estimation task and their performance on the paper-and-pencil measure.
Results demonstrated that kindergartners’ performance on both symbolic and
nonsymbolic items correlated with their number line estimates. This data provides
further evidence for the convergent validity of the paper-and-pencil assessment.

151
Secondly, results also indicated that children’s performance on the number line
estimation task was related to their arithmetic achievement replicating what has been
found in previous work (Booth & Siegler, 2006; Laski & Siegler, 2007; Schneider,
Grabner & Paetsch, 2009; Siegler & Booth, 2004). Taken together, these data suggest
that children with more precise representations of numerical magnitude as measured by
the number line task and paper-and-pencil test, are those who have relatively higher
arithmetic scores.
Finally, a linear regression analysis was conducted to investigate the unique
variance accounted for in children’s arithmetic skills using children’s number line
estimation abilities and symbolic processing skills as predictors. I found that children’s
performance on the symbolic items of the paper-and-pencil test and the number line task
accounted for unique variance in arithmetic achievement.
The final aim of the current chapter was to examine whether kindergarten scores
on the paper-and-pencil assessment could predict children’s math performance as
assessed by their teachers in Grade 1, six months after they completed the magnitude
comparison task in kindergarten. Results revealed an effect of math grade whereby
children who performed poorly on the magnitude comparison task in kindergarten also
received poor math grades in Grade 1. Furthermore, results showed that children who
were rated as below average by their teacher in Grade 1 math demonstrated significantly
higher scores in nonsymbolic items as compared to symbolic items (with the performance
on both symbolic and nonsymbolic in this group being lower than that of their peers who
were rated as average or above average). No significant difference was found between
formats in children rated as average and children rated as below average. This finding

152
provides evidence to suggest that weak performance on symbolic comparison in
kindergarten indicates that a child is a risk for receiving a low math grade in Grade 1.
However, the same conclusion cannot be equally drawn from children’s nonsymbolic
performance in kindergarten.
In conclusion, results of the current chapter demonstrate that kindergarten
children received significantly higher scores on the nonsymbolic items compared to the
symbolic items of the paper-and-pencil test. Secondly, results of the current chapter
indicate that a relationship exists between kindergartners’ performance on the paper-and-
pencil test and their arithmetic skills. Moreover, using the paper-and-pencil assessment,
it was found that children’s symbolic processing was a significant concurrent correlate of
their arithmetic skills, while their nonsymbolic comparison skills were not. The current
data also revealed that the paper-and-pencil test significantly correlated with children’s
number line performance, and children’s symbolic processing accounted for unique
variance in arithmetic over and above their estimation skills as measured by the number
line task. Finally, it was found that children’s performance on the paper-and-pencil test
in kindergarten was a predictor of their math performance in Grade 1 as measured by
their first term report card.
There are some limitations that are worth noting. First, in order to test the large
number of children in the current sample, teacher assistance in data collection was
necessary. Although teachers received training on all the tasks, not all tasks were
administered correctly and therefore had to be removed from the final analyses. There
were also many incomplete packages with no information provided by the teacher to
explain the missing data, although they were asked to do so. Additionally, in scoring the

153
data, it was revealed that the number line estimation task was difficult for some children
to understand as many children placed their responses in the middle of the line.
Secondly, only children’s first term grades were included in the analysis. Future research
should also include children’s math grades from their second and third term report cards.
This will permit a clearer picture of each student’s performance over the long term.
As mentioned above, the set of participants in the current study is a very diverse
sample representing a variety of socioeconomic backgrounds. Previous research has
shown that there is an association between a child’s socioeconomic status and their math
achievement. Specifically, children from low-income homes are most at risk for
experiencing difficulties in math (Campbell & Silver, 1999). Moreover, even as early as
kindergarten, children from low-income families demonstrate significantly poorer
numeracy skills compared to their peers from more advantaged homes (Jordan,
Huttenlocher & Levine, 1992). As such, I would expect to find a relationship between
socioeconomic status and performance on my paper-and-pencil task such that children
from low-income families would receive lower scores in comparison to their high-income
peers. If this result were found, it would suggest that my task is capable of distinguishing
between the basic magnitude processing skills of children from different socioeconomic
statuses. The research department of the TDSB is interested in exploring this line of
investigation and will be providing this information allowing this analysis to be
performed.
The research department of the TDSB is also interested in conducting a
longitudinal study and following the same cohort of students in this study for the next
several years. Their research department will examine whether performance on my task

154
at kindergarten correlates with students’ math achievement in upper grades, which
includes their report card grades and scores on the Education Quality and Accountability
Office (EQAO) test. The EQAO is a province-wide test administered to students in
Grade 3 to assess their literacy and math skills at the end of the primary division
(Education Quality and Accountability Office, 2012). If this relationship were found, it
would suggest that my test is capable of predicting student math achievement as
measured by teacher evaluation and standardized tests, suggesting that this tool can
possibly be used as a means of identifying students at risk for developing later difficulties
in math.
In Chapters 2 and 3, participants included children who had already received at
least one year of formal math lessons. In the present chapter, kindergarten children were
assessed, an age group who receive comparatively less formal instruction in math
compared to first, second and third graders. The data set from this chapter demonstrated
that the paper-and-pencil measure could identify individual differences in the symbolic
and nonsymbolic magnitude processing abilities of kindergarten children. This evidence
indicates that a test of this kind is appropriate for assessing school entry knowledge of
magnitude comparison. Furthermore, it reveals the importance of the competencies
measured by the magnitude comparison task, demonstrating that magnitude processing is
as foundational to numeracy as phonemic awareness is to reading.
Recall from the literature review presented earlier, that studies by Duncan et al.
(2007), Romano et al. (2010) and Geary et al. (2013), each demonstrated the importance
of early math skills for later outcomes in students’ academic success. The results of the
current chapter extend these findings by demonstrating, more specifically, that an early

155
understanding of magnitude processing, especially symbolic comparison, is a strong
predictor of future math competencies. Finally, the findings in the current chapter are the
first to show the predictive validity of a joint assessment measuring both symbolic and
nonsymbolic processing. This is a key finding as it also suggests that an assessment of
this kind may be very beneficial in helping to identify children at risk for later learning
difficulties in mathematics at the very beginning of their formal math education, thus
reducing the chance of student failure.

156
4.5 References
Booth J., & Siegler, R.S. (2006). Developmental and Individual Differences in Pure
Numerical Estimation, Developmental Psychology, 41(6), 189-201.
Campbell, P.F., & Silver, E. A. (1999). Teaching and learning mathematics in poor
communities. Reston, VA: National Council of Teachers in Mathematics.
De Smedt, B., Verschaffel, L., & Ghesquiere, P. (2009). The predictive value of
numerical magnitude comparison for individual differences in mathematics
achievement. Journal of Experimental Child Psychology, 103, 469-479.
Duncan, G.J., Dowsett, C.J., Classens, A., Magnuson, K., Huston, A.C., Klebanov,
P.,……Japel, C. (2007). School readiness and later achievement. Developmental
Psychology, 43, 1428-1446.
Durand, M., Hulme, C., Larkin, R., & Snowling, M. (2005). The cognitive foundations
of reading and arithmetic skills in 7 to 10-year-olds. Journal of Experimental
Child Psychology, 91, 113-136.
Education Quality and Accountability Office. (2012). Retrieved from
http://www.eqao.com/categories/home.aspx?Lang=E.
Ebel, R., & Frisbie, D. (1991). Essentials of Educational Measurement. Englewood
cliffs, NJ: Prentice Hall.
Geary, D.C, Hoard, M.K., Nugent, L., & Bailey, D.H. (2013). Adolescents’ functional
numeracy in predicted by their school entry number system knowledge. PLoS
ONE, 8(1): e5461.
Griffin, S. & Case, R. (1997). Rethinking the primary school math curriculum: An
approach based on cognitive science. Issues in Education, 3(1), 1-49.

157
Halberda, J., Mazzocco, M., & Feigenson, L. (2008). Individual differences in non-
verbal number acuity correlate with maths achievement. Nature, 455, 665-668.
Holloway, I., & Ansari, D. (2009). Mapping numerical magnitudes onto symbols: The
distance effect and children’s mathematical competence. Journal of Experimental
Child Psychology, 103(1), 17-29.
Jordan, N.C., Huttenlocher, J., & Levine, S.C. (1992). Differential calculation abilities in
young children from middle- and low-income families. Developmental
Psychology, 28, 644-653.
Laski, E.V., & Siegler, R.S. (2007). Is 27 a big number? Correlational and ausal
connections among numerical categorization, number line estimation, and
numerical magnitude comparison, Child Development, 78(6), 1723-1743.
Mazzocco, M., Feigenson, L., & Halberda, J. (2011). Preschoolers’ precision of the
approximate number system predicts later school mathematics performance.
PloS ONE, 6(9): e23749.
Ontario Ministry of Education. (2010). Growing Success : Assessment, evaluation,
and reporting in Ontario Schools. www.edu.gov.on.ca.
Prochner, L. (2000). A history of early education and child care in Canada, 1820-
1966" in Early Childhood Care and Education in Canada (eds. L. Prochner
& N. Howe), Vancouver: UBC Press.
Romano,G., Babchishin,L., Pagani, L.S., & Kohen, D. (2010). School readiness and
later achievement: Replication and extension using a nationwide Canadian survey,
Developmental Psychology, 46(5), 995-1007.

158
Schneider, M., Grabner, R.H., & Paetsch, J. (2009). Mental number line, number line
estimation, and mathematical school achievement: Their interrelations in Grades 5
and 6. Journal of Educational Psychology, 101, 359–372.
Siegler, R.S., & Opfer, J.E. (2003). The development of numerical estimation: Evidence
for multiple representations of numerical quantity. Psychological Science, 14(3),
237-243.
Stanovich, K. E. (1986). Matthew Effects in reading: some consequences of individual
differences in the acquisition of literacy. Reading Research Quarterly, 21(4), 360-
407.
Stanovich, K.E., Cunningham, A.E., & Cramer, B.B. (1984). Assessing phonological
awareness in kindergarten children: Issues of task comparability. Journal of
Experimental Child Psychology, 38(2), 175-190.
Vellutino, F.R., & Scanlon, D.M. (1987). Phonological coding, phonological
awareness and reading ability: Evidence from a longitudinal and experimental
study. Merrill-Palmer Quarterly, 33, 321-363.
Williams, J. (1984). Phonemic analysis and how it relates to reading. Journal of
Learning Disabilities, 17, 240-5.
Wright, R.J., Martland, J., & Stafford, A.K. (2006). Early Numeracy: Assessment for
Teaching & Intervention. Thousand Oaks, CA: SAGE Publications.

159
Chapter 5
5. Conclusion
5.1 Summary of Results
Research has repeatedly demonstrated that the basic magnitude processing skills
of children are related to their higher-order math skills, especially arithmetic (De Smedt,
Verschaffel & Ghesquière, 2009; Durand et al., 2005; Halberda, Mazzocco & Feigenson,
2008; Holloway & Ansari, 2009; Mazzocco, Feigenson & Halberda, 2011). However,
the formal assessment of this foundational competency in primary school-aged children
has largely been overlooked in the domain of numeracy. The intention of this thesis,
therefore, was to design a simple paper-and-pencil measure of numerical magnitude
comparison with the purpose of assessing both symbolic (i.e., Arabic numerals) and
nonsymbolic (i.e., arrays of dots) magnitude processing skills in children. This thesis
presented three studies designed to investigate children’s performance on the paper-and-
pencil measure, its concurrent relationship to arithmetic achievement, its reliability and
validity and its ability to predict math performance over time.
The evidence presented in Chapter 2 demonstrated that children’s performance on
both the symbolic and nonsymbolic items of the paper-and-pencil test correlated with
individual differences in arithmetic achievement. However, only symbolic processing
accounted for unique variance in arithmetic scores while nonsymbolic processing did not.
Results also demonstrated that children’s performance on the symbolic items of the
paper-and-pencil test correlated with arithmetic skills even when controlling for other
factors such as age, visual-spatial working memory, verbal working memory, IQ and
reading. Additionally, Grade 1 students received higher scores on nonsymbolic items

160
compared to symbolic items on the paper-and-pencil test while second and third grade
children did not show this difference in performance across formats.
Results in Chapter 3 revealed that the paper-and-pencil test demonstrated
significant convergent validity, criterion validity and test-retest reliability. Using a
sample of Grade 1 children, it was found that symbolic but not nonsymbolic processing,
as measured by the paper-and-pencil test, correlated with symbolic and nonsymbolic
trials of a computer task of magnitude comparison. Findings also showed that children’s
performance on both the symbolic and nonsymbolic items of the paper-and-pencil test
and the computer task correlated with their arithmetic achievement. Consistent with the
results reported in Chapter 2, only symbolic processing accounted for unique variance in
arithmetic performance while nonsymbolic processing did not. This was true for both the
computerized and paper-and-pencil versions. Additionally, children in Grade 1 again
performed significantly better on nonsymbolic items than they did on symbolic items in
the paper-and-pencil test. In addition, further replicating the data presented in Chapter 2,
it was found that symbolic processing accounted for unique variance in arithmetic scores
over and above visual-spatial working memory. Finally, results demonstrated that
children’s scores on the paper-and-pencil test at the first time point of testing correlated
with their scores at the second time point of testing, thus, demonstrating test-retest
reliability.
In Chapter 4, kindergarten children’s performance on the paper-and-pencil test
was found to correlate with their arithmetic performance. Again, symbolic processing
accounted for unique variance in children’s arithmetic skills over and above nonsymbolic
processing. Like the Grade 1 participants in Chapters 2 and 3, it was also found that

161
participants performed significantly better on nonsymbolic items compared to symbolic
items. Finally, results revealed that children’s performance on the paper-and-pencil test
correlated moderately with individual differences on the number line estimation task.
This finding provided further evidence of the convergent validity of the paper-and-pencil
test. The last finding of this chapter revealed that participants’ performance on the paper-
and-pencil test in kindergarten was a significant predictor of their math grade on their
first term report card in Grade 1 (recorded around 6 months after the paper-and-pencil
test results).
Together, these three studies give evidence to suggest that a simple two-minute
paper-and-pencil test is a reliable and valid way to assess basic magnitude processing in
children from kindergarten to the third grade. The next section of this chapter will
explore what the results of these studies can reveal about the role of symbolic and
nonsymbolic processing in children’s higher-level math abilities, the importance of
assessing this skill in young children and the educational implications of these findings.
This chapter will conclude with an outline of the limitations of these studies and future
possible directions for this line of research.
5.2 The Role of Symbolic and Nonsymbolic Processing in the Development of Children’s Numerical Abilities
Data from all three studies of this thesis converge to reveal a relationship between
children’s symbolic and nonsymbolic processing skills, a correlation between children’s
symbolic processing and arithmetic skills and, finally, an association between
nonsymbolic processing and arithmetic achievement. In other words, children with high
accuracy on both formats of the paper-and-pencil test also tended to receive high scores
on tests of arithmetic achievement, and this was observed for participants in kindergarten

162
through Grade 3. In addition, results from the first two studies conducted in this thesis
demonstrated that in Grades 1-3 symbolic processing accounted for unique variance in
children’s arithmetic skills even when controlling for working memory, reading ability,
age and IQ, whereas children’s performance on nonsymbolic items of the paper-and-
pencil measure was not a unique predictor of arithmetic skills.
Previous and current studies in this area of research have produced mixed findings
regarding the relationship between nonsymbolic and symbolic magnitude processing in
general and also the association between magnitude processing and children’s math
achievement (Bonny & Lourenco, 2013; Halberda, Feigenson & Mazzocco, 2008;
Holloway & Ansari, 2009; Libertus, Feigenson & Halberda, 2013; Mazzocco, Feigenson
& Halberda, 2011; Mundy & Gilmore, 2009; Sasanguie, Defever, Maertens & Reynvoet,
2013). Thus, the evidence regarding the importance of these processing skills in
children’s math development remains inconclusive. The contribution of this thesis to this
debate will be discussed here in more detail.
5.2.1 The Relationship Between Symbolic and Nonsymbolic Magnitude Processing As presented several times in this thesis, evidence suggests that as infants we
demonstrate the ability to represent approximate magnitudes, and then with explicit
instruction we learn to represent these quantities more precisely with number words and
other numerical symbols, such as Arabic numerals. Questions that arise from this
observation include, how do these systems of symbolic and nonsymbolic processing
interact throughout development? Does symbolic number knowledge progress
independently of nonsymbolic comparison skills, or do the two systems work together in
the development of one’s mathematical capabilities?

163
In answering these questions, the results of the current thesis demonstrated a
relationship between children’s symbolic and nonsymbolic processing skills in each of
the grade levels examined. Thus, these findings suggest that both symbolic and
nonsymbolic magnitude processes share variance associated with core magnitude
processing, giving evidence to suggest that exact and approximate representations of
magnitude may not develop independently of each other, but are perhaps linked in
childhood.
These findings diverge from the results of Holloway and Ansari (2009) who
found no significant relationship between children’s symbolic and nonsymbolic
processing abilities. They interpreted their results to suggest that symbolic skills develop
independently of nonsymbolic skills which present the possibility of different underlying
representations for symbolic and nonsymbolic numerical magnitude.
Further evidence of which comes from recent research by Sasanguie, Defever,
Maertens and Reynvoet (2013). In their study, 43 kindergarten children completed a
response time measure of nonsymbolic magnitude comparison and 6 months later they
completed a different version of the nonsymbolic task along with a symbolic comparison
task. Results demonstrated that children’s accuracy on the nonsymbolic magnitude
comparison at the first time point did not correlate with their performance on the
symbolic task half a year later. Moreover, children’s performance on the nonsymbolic
task at the second time point also did not correlate with their symbolic processing skills
measured at that same time. Due to the absence of the association between performances
on the nonsymbolic and symbolic tasks, the authors suggest, like Holloway and Ansari
(2009), that this finding provides evidence for two separate representational systems,

164
again indicating that symbolic number knowledge may develop independently of
nonsymbolic processing skills. As such, the nonsymbolic system is believed to play a
subordinate role in children’s development of higher-level math abilities.
There are noticeable differences between my findings and those from the studies
presented above which may have led to a conflict in the results obtained. First, Holloway
and Ansari (2009) correlated children’s symbolic NDE with their nonsymbolic NDE,
whereas, in my work I correlated children’s symbolic accuracy with their nonsymbolic
accuracy on the paper-and-pencil test. Therefore, the differences between findings might
stem from the different measures used. Although Sasanguie, Defever, Maertens and
Reynvoet (2013) correlated the accuracy of children’s symbolic processing skills with
their nonsymbolic skills, their sample size of 43 kindergarten students was substantially
smaller than my sample of 282 kindergarten children. This difference may account for
the discrepancy in both our findings as my work may have benefitted from greater power
due to my larger sample. Furthermore, in their study, Sasanguie and colleagues
mentioned that they did not test children’s knowledge of the number symbols before
testing began; therefore, it may be possible that the lack of a relationship between
children’s symbolic and nonsymbolic processing skills could be due to the fact that some
children may not have recognized all of their symbolic numbers.
5.2.2 The Relationship Between Magnitude Processing and Children’s Math Achievement
In the literature, there is a group of studies showing that nonsymbolic magnitude
processing in child participants is found to correlate with individual differences in math
achievement even when controlling for variables such as general intelligence, working
memory and speed of processing (e.g., Bonny & Lourenco, 2013; Halberda, Feigenson &

165
Mazzocco, 2008; Libertus, Feigenson & Halberda, 2013; Mazzocco, Feigenson &
Halberda, 2011). In contrast, however, the works of other research groups demonstrate
that children’s symbolic processing correlates with math achievement and is a significant
predictor of math performance (e.g., Chard et al., 2005; De Smedt, Verschaffel &
Ghesquière, 2009; Durand et al., 2005). The results of this dissertation are in line with
these two groups of findings, in that, both nonsymbolic and symbolic processing was
found to correlate with math achievement. One important observation to note here,
however, is that in both groups of studies mentioned above, only one form of processing
at a time was investigated in children. In other words, participants were not given tasks
of nonsymbolic and symbolic processing in each study; therefore, the unique contribution
of both kinds of processing in children’s math achievement cannot be properly
determined.
Work by Holloway and Ansari (2009) and Rousselle and Noël (2007) in which
children received both symbolic and nonsymbolic tests of magnitude comparison
demonstrated that only symbolic processing correlated with individual differences in
children’s math achievement. I found a significant correlation between both symbolic
processing and arithmetic achievement and nonsymbolic processing and arithmetic
achievement. My results may have diverged from those of Holloway and Ansari (2009)
due to differences in sample size. Holloway and Ansari (2009) had a sample size of 87
children ages 6-8, whereas, my work had a sample of 535 children from 5-9 years old.
This larger sample size and age range may have afforded more power and a better chance
of capturing greater individual differences in student performance. Second, as previously
mentioned, Holloway and Ansari (2009) used the NDE to measure children’s magnitude

166
processing skills, whereas, in the current study children’s processing abilities were
measured using accuracy. Again, the differences between findings may be due to the
different measures used.
However, like Holloway and Ansari (2009), all three studies in this thesis
converge to reveal that symbolic processing accounts for unique variance in children’s
arithmetic skills while nonsymbolic processing does not. This result gives further
evidence to suggest that the mapping of symbols to numerical magnitudes is an important
correlate of individual differences in children’s arithmetic achievement as it allows for
precise representation of quantities which is necessary for accurate responses in
arithmetic.
The finding that nonsymbolic processing does not account for unique variance in
children’s arithmetic performance may be interpreted to mean that its variance is entirely
shared with symbolic processing, or that its variance is shared with symbolic non-
numerical variance (i.e., attention, response selection, etc.). Future research is needed to
further examine this line of investigation.
One important finding from the current thesis was that my data demonstrated that
the youngest children in the sample, those in kindergarten and Grade 1, performed more
strongly (i.e., higher levels of performance accuracy) on nonsymbolic processing as
compared to symbolic processing. These data provide evidence to support the notion that
perhaps symbolic representations are only gradually mapped on to nonsymbolic
representations and demonstrate that mapping is a process that becomes more refined
over the course of development and learning. The results demonstrated here suggest that
young children are still reliant on their nonsymbolic system when processing magnitude;

167
however, with more formal math instruction the symbolic system becomes stronger,
indicating that children’s mapping skills become more efficient with time. Moreover,
results in Chapter 4 revealed that children rated as below average in Grade 1 math
performed significantly worse on symbolic magnitude comparison versus nonsymbolic
magnitude comparison, as measured by the paper-and-pencil test in kindergarten. Thus,
being poor at symbolic magnitude processing in kindergarten appears to be a good
indicator of future difficulties in higher-level mathematics.
Clearly, more research is needed to determine exactly how symbolic and
nonsymbolic systems interact and further examination is required to answer the question
of the nature and origin of their relationship. Investigations of this kind may shed more
light on the exact role that nonsymbolic processing plays in the development of
children’s symbolic representation and magnitude processing abilities. Moreover, future
studies should also continue to examine what seems to be the specialized role of symbolic
magnitude processing in the development of children’s math learning and how this can be
fostered in a classroom setting.
5.3 Educational Implications
As stated in the introduction of this thesis, there is currently a lack of formal
assessment tools available to measure both symbolic and nonsymbolic basic magnitude
processing skills in children, despite a considerable number of studies that demonstrate a
significant relationship between children’s magnitude processing abilities and their math
achievement. The findings of this thesis converge with the results of Chard et al. (2005)
who also found that a paper-and-pencil test of symbolic magnitude processing correlated
with children’s math achievement. By including nonsymbolic items, the findings in this

168
study extend work by Chard et al. (2005) by demonstrating that both nonsymbolic and
symbolic magnitude processing correlate with children’s arithmetic performance.
As discussed in Chapter 4, school entry skill in mathematics is a strong predictor
of a child’s later academic achievement and success in the workplace; therefore, sound
measures of basic numeracy are necessary in the modern-day classroom. In Chapter 3
and Chapter 4, the validity and reliability of the paper-and-pencil test designed for this
thesis project were assessed and results indicated that this simple two-minute evaluation
demonstrates levels of validity and reliability in the measurement of basic magnitude
processing skills in primary school children. Furthermore, results in Chapter 4 also
demonstrated that performance in kindergarten is a significant indicator of how well a
child will perform in Grade 1 math. This suggests that my paper-and-pencil test is related
to educational assessment and can predict school grades in math after the first few
months of formal math instruction.
There are several educational implications that can be drawn from the findings
discussed above. First, there is obvious merit in evaluating children’s basic magnitude
skills, even as early as kindergarten. Seeing that performance on the paper-and-pencil
test in kindergarten can predict children’s math performance in Grade 1, a test of this
kind has the potential to be used as a screener by teachers in kindergarten classrooms to
identify students who may be at risk for developing more serious difficulties in number
related learning.
Second, since children’s symbolic magnitude processing accounted for unique
variance in their arithmetic achievement, this suggests that teachers, especially in
preschool and kindergarten, should place great emphasis on helping their students to

169
understand the meaning of numerical symbols, thereby enhancing children’s ability to
map number symbols unto nonsymbolic quantities. Learning to accurately map symbolic
magnitudes onto nonsymbolic magnitudes is a crucial step toward performing more
complex mathematics such as arithmetic operations (Booth & Siegler, 2008; Geary,
Hoard, Nugent & Byrd-Craven, 2008; Siegler & Booth, 2004).
5.4 Limitations
There were a few limitations in the current thesis which will be mentioned here.
The first limitation was that participants did not receive a non-numerical control task
having the same task demands as the paper-and-pencil test. By including a control task
such as a speed of processing measure, for example, more information could have been
obtained about the number specificity of the relationships observed. However, in Chapter
2, general intelligence and working memory were controlled, making it unlikely that the
variance explained by the paper-and-pencil test was not related to children’s magnitude
processing abilities.
The second limitation was the layout of the items within the booklet itself which
may have added a component of visual complexity to the task. There were many items
per page in the booklet and the items themselves were not large which may have been
difficult for participants to complete, especially the youngest children. In addition, due to
the motor component of the task in crossing out responses, individual differences in fine
motor skills may have played a role in student outcomes. However, if this were a factor,
since my test included both symbolic and nonsymbolic items, I would not have expected
differences between these conditions. Yet, differences were found in the youngest
participants where these children performed significantly better on the nonsymbolic items

170
compared to the symbolic items, and overall only symbolic performance predicted unique
variance in children’s arithmetic scores. Again, this suggests that the variability in scores
explained by the paper-and-pencil test was related to magnitude processing and was not
confounded by other factors.
5.5 Future Directions
The paper-and-pencil test used in the current thesis was designed for use on a
global scale and to accommodate classroom settings where access to technology may not
be feasible. One line of future research, therefore, could involve the investigation of
individual differences on the performance of the paper-and-pencil test across cultures and
systems of education. For instance, results from this thesis demonstrated that Canadian
children’s performance on the magnitude comparison task was related to individual
differences in arithmetic. Thus, one future question would be to investigate if these
findings are generalizable to other cultural settings. In the same vein, class sizes in many
developing countries are large, with 50 students or more. Meanwhile in Canada, some
classrooms can have up to 25 students. Assessing students on a one-on-one basis is a
time-consuming procedure for teachers having many students and can take away time
which would be better used in classroom instruction. Therefore, it would be important for
forthcoming research to assess the efficiency of the paper-and-pencil test administered in
a group setting.
Based on the findings of the current thesis, an assessment such as the paper-and-
pencil test would be ideally used as a screener, preferably in the earliest years of
schooling. However, before this can be accomplished, norms of this test would first have
to be established to gain a true picture of the developmental changes captured by this

171
simple measure. Along these same lines, further assessments of this test’s validity and
reliability across different age groups are also needed.
Future investigations can also be used to examine how reliable magnitude
processing skills, as measured by the paper-and-pencil test, are in predicting increasingly
advanced mathematical processing such as high school math (i.e., algebra and geometry).
This will allow for a greater understanding of how far-reaching the foundational basis of
these critical skills truly is.
Finally, forthcoming research on number processing assessments should continue
to be examined using rigorous, empirical methods of investigation. In this way, coming
assessments of the foundational competencies of mathematics can be as effective as those
used in the domain of literacy, and children around the globe can be assured of a brighter
future.
5.6 General Conclusion
In conclusion, the studies outlined in this thesis have presented evidence that a
simple two-minute assessment of children’s symbolic and nonsymbolic magnitude
processing skills holds promise as a reliable and valid method of assessing magnitude
processing in the first years of school. While much is still left to be learned about how
these two systems of representation interact and develop, future studies can begin to
apply what is already known and can build on this knowledge. In so doing,
improvements can be made in the way students are assessed in school, which will also
lead to improvements in curriculum design and classroom instruction.

172
5.7 References
Bonny, J.W., & Lourenco, S.F. (2013). The approximate number system and its relation
to early math achievement: Evidence from the preschool years. Journal of
Experimental Child Psychology, 114(3), 375-388.
Booth, J.L., & Siegler, R.S. (2008). Numerical magnitude representations influence
arithmetic learning. Child Development, 79, 1016-1031.
Chard, D., Clarke, B., Baker, S.K., Otterstedt J., Braun D., & Katz, R. (2005). Using
measures of number sense to screen for difficulties in mathematics: Preliminary
findings. Assessment for Effective Intervention 30(2), 3-14.
DeSmedt, B., Verschaffel, L., & Ghesquière, P. (2009). The predictive value of
numerical magnitude comparison for individual differences in mathematics
achievement. Journal of Experimental Child Psychology, 103, 469-479.
Durand, M., Hulme, C., Larkin, R., & Snowling, M. (2005). The cognitive foundations
of reading and arithmetic skills in 7 to 10-year-olds. Journal of Experimental
Child Psychology, 91, 113-136.
Geary, D.C., Hoard, M.K., Nugent, L., & Byrd-Craven, J. (2008). Development of
number-line representations in children with mathematical learning disability.
Developmental Neuropsychology, 33, 277-299.
Halberda, J., Mazzocco, M., & Feigenson, L. (2008). Individual differences in non-
verbal number acuity correlate with maths achievement. Nature, 455, 665-668.
Holloway, I., & Ansari, D. (2009). Mapping numerical magnitudes onto symbols: The
distance effect and children’s mathematical competence. Journal of Experimental
Child Psychology, 103(1), 17-29.

173
Libertus, M.E., Feigenson, L., & Halberda, J. (2013). Is approximate number precision a
stable predictor of math ability? Learning and Individual Differences, 25, 126-
133.
Mazzocco, M., Feigenson, L., & Halberda, J. (2011). Preschoolers’ precision of the
approximate number system predicts later school mathematics performance. PloS
ONE, 6(9): e23749.
Mundy, E., & Gilmore, C.K. (2009). Children’s mapping between symbolic and
nonsymbolic representations of number. Journal of Experimental Child
Psychology, 103, 490-502.
Rousselle, L., & Noël, M. (2007). Basic numerical skills in children with mathematics
learning disabilities: a comparison of symbolic vs. non-symbolic number
magnitude processing. Cognition, 102(3), 361-95.
Sasanguie, D., Defever, E., Maertens, B., & Reynvoet, B. (2013). The approximate
number system is not predictive for symbolic number processing in
kindergartners. The Quarterly Journal of Experimental Psychology,
http://www.tandfonline.com/doi/abs/10.1080/17470218.2013.803581?journalCod
e=pqje20#.UbfcB-v7Cuw
Siegler, R.S., & Booth, J.L. (2004). Development of numerical estimation in young
children. Child Development, 75, 428-444.

174
APPENDIX A

175
APPENDIX B

176
Curriculum Vitae
Name: Nadia Nosworthy Post-secondary University of Ottawa Education and Ottawa, Ontario, Canada Degrees: 1998-2002 B.A. Psychology (Honours)
Queens University Kingston, Ontario, Canada 2002-2003 B.Ed. The University of Western Ontario London, Ontario, Canada 2007-2009 M.Ed. The University of Western Ontario London, Ontario, Canada 2009-2013 Ph.D.
Honours and Queen Elizabeth the Second Scholarship in Science and Awards: Technology
2011-2012
Related Work Elementary School Teacher Experience: Ottawa Adventist School
Ottawa, Ontario 2004-2007
Teaching Assistant
The University of Western Ontario 2007-2013