Embed Size (px)
Citation preview

Am J Health Behav.™™™™™ 2011;35(3):257-268 257
An Investigation of Exercise and thePlacebo EffectDixie Stanforth, PhD; Mary Steinhardt, EdD, LPC; Michael Mackert, PhD;Philip R. Stanforth, MS; Christian T. Gloria, MA
Dixie Stanforth, Mary Steinhardt, Philip R.Stanforth, and Christian T. Gloria, all from TheUniversity of Texas at Austin, Kinesiology andHealth Education, Austin, TX. Michael Mackert,The University of Texas at Austin, Departmentof Advertising, Austin, TX.
Address correspondence to Dr Stanforth, TheUniversity of Texas at Austin, Kinesiology and HealthEducation D3700, 1 University Station, Austin, TX78712. E-mail: [email protected]
Objective: To replicate previousresearch that concluded exerciseaffects health via a placebo effect:simply telling workers with physi-cally active jobs that their “work isexercise” improves health. Method:A convenience sample of univer-sity building service workers (n=53)learned “their work is exercise” orabout job safety. Results: Groupsdemonstrated similar outcomes at4 and 8 weeks for weight, percentfat, waist circumference, and be-
havioral measures. Both groups in-creased self-perception as “regu-lar exercisers”; blood pressure wasreduced only in the interventiongroup. Conclusion: This researchdid not support the placebo effect.Although enticing, simply chang-ing mind-set does not alter therelationship between exercise andhealth.
Key words: exercise, mind-set,placebo, work
Am J Health Behav. 2011;35(3):257-268
The health benefits of exercise arewell documented and include a de-creased risk for obesity, heart dis-
ease, hypertension, diabetes, certain can-cers, and premature mortality. Numer-ous organizations recommend that adultsengage in at least 30 minutes of moder-ate physical activity on most or preferablyall days.1 Despite the known benefits ofregular exercise, most Americans arenot physically active. The Department ofHealth and Human Services estimatesthat 38% of adults engage in no leisure-time activity of any kind, and only 23% ofadults perform vigorous physical activity(sufficient to promote cardiovascular fit-
ness) at least 3 times a week for morethan 20 minutes.2 Despite the imple-mentation of promising evidence-basedintervention strategies3 and community-based approaches for promoting increasedphysical activity,4 the rate of obesity con-tinues to rise, along with the associatedeconomic and health costs.5
The search for solutions to the obesityepidemic has expanded beyond the pre-scription of exercise6 to include the psy-chological benefits of physical activity.7
An interesting segment of the psychologi-cal research has considered how self-perceptions of health affect subsequenthealth outcomes. For example, one groupof researchers demonstrated that self-rated health is a significant predictor ofmortality in the elderly,8 whereas an-other group showed similar results forolder individuals with diabetes.9 Evolvingfrom this work is the question of whatdrives physiological changes: is it biologyor simply a placebo effect, which is basedon one’s expectations in the positive out-comes of the treatment? Lundh10 demon-strated that medical and psychologicaltreatments have the potential to create a
Exercise and the Placebo Effect
258
belief system that “this treatment is go-ing to cure me,” which is similar toBandura’s model of self-efficacy and out-come expectancies.11
In his classic article, Bandura11 ad-dressed this issue of a potential placeboeffect, questioning whether it is possibleto “instill outcome expectations in peoplesimply by telling them what to expect” (p.198). In addition, Bandura11 stated that“simply informing participants that theywill or will not benefit from treatmentdoes not mean that they will necessarilybelieve what they are told, especially whenit contradicts their personal experiences”(p. 198). Over the years, the placebo effecthas been questioned,12 deconstructed,13
and hotly debated from both scientific andethical perspectives.14-16 Only recently hasthe placebo effect been analyzed to deter-mine whether mind-set affects the rela-tionship between exercise and health.
There is some evidence to indicatethat a placebo effect may be operative inthe psychological benefits associated withexercise. Plante et al17 note that althoughmost reviews and even the position paperon the psychological benefits of exerciseby the International Society of SportsPsychology state that exercise reducesstress, depression, state anxiety, andneuroticism for both genders at any age,the biological and psychosocial mecha-nisms are not fully understood. Theirstudy investigating how perceived versusactual aerobic fitness influences psycho-logical and physical functioning wasgrounded in the hypothesis that exercisemay act as a placebo and that suggestionplays a major role in the psychologicalbenefits of exercise. They concluded thatthe association between perceived fit-ness and psychological functioning maybe as important as, or even more impor-tant than, aerobic fitness, highlightingthe power of beliefs over physiology.
Desharnis et al18 used an expectancymodification procedure in which half ofthe participants in a 10-week exerciseprogram were told that their program wasdesigned to improve psychological well-being as well as aerobic fitness. The con-trol group was informed throughout thetraining period only of the biological as-pects of the program and the expectedgains in aerobic fitness. There were nodifferences in self-perceived physical orpsychological fitness following the exer-cise program, and both groups demon-
strated significant increases in aerobiccapacity as measured by maximal oxygenuptake (VO2max). The intervention group,however, showed significant increasesin self-esteem compared to the controls,which the authors attributed to a strongplacebo effect whereby exercise enhancedpsychological well-being. Despite a grow-ing body of evidence in the field of psychol-ogy, the question of whether individualperceptions and beliefs have a measur-able effect on physiological markers ofhealth or fitness has received little atten-tion.
In a provocative article, Crum andLanger19 considered whether work-basedphysical activity affects health, and towhat extent, via the placebo effect. Theycompared a group of hotel maids whoreceived information regarding the healthbenefits of their “work as exercise” withothers who received no information. Injust 4 weeks, they found that the groupwho learned that their jobs “counted” asexercise had significant increases intheir perceived amount of exercise andself-ratings as “regular exercisers.” Fur-ther, they reported that the informed groupalso decreased body weight, percent bodyfat, body mass index (BMI), waist-to-hipratio, and blood pressure. In addition tocalling for further research, Crum andLanger19 concluded their findings mightbe particularly relevant when addressinghealth issues associated with a seden-tary lifestyle, because changing beliefsmay be easier than changing actual be-haviors. A greater understanding of therole of mind-set and its relationship tohealth warrants further exploration andholds promise for the development of ascientifically grounded model for substan-tiating this relationship.
In this study, we attempted to replicatethe work of Crum and Langer19 usingbuilding service employees at a majorpublic university, because their jobs re-quire a level of activity and tasks through-out the day similar to those of hotel work-ers, such as cleaning and taking outtrash. The goal of the study was to deter-mine whether increasing perceived lev-els of exercise, without altering activitylevels, would result in improved healthmeasures, which is indicative of a pla-cebo effect. Based on the work of Crumand Langer,19 we hypothesized that build-ing service workers who received infor-mation about the caloric expenditure of

Stanforth et al
Am J Health Behav.™™™™™ 2011;35(3):257-268 259
their work activities would demonstrateimprovements in specific health mea-sures (blood pressure, body weight, bodyfat, and abdominal girth), compared toworkers who did not receive that informa-tion.
Crum and Langer19 detailed the rea-sons for choosing a population whose oc-cupation involves at least the minimumamount of physical activity necessary tomeet the “30 minutes or more of moder-ate-intensity physical activity on most,preferably all, days of the week” recom-mended for health.20 Building serviceworkers are similar to the hotel workersinvolved in their study, as both jobs re-quire that they walk, bend, push, pull, lift,and climb stairs throughout the workday.Additionally, if they do not initially per-ceive their work as exercise, shiftingbeliefs to reflect an understanding thatsimply performing everyday work activi-ties results in health benefits has thepotential to produce health improvements.Every attempt was made to duplicate thebehavioral survey information as reportedin Crum and Langer’s original paper,19
and the same physiological measureswere assessed, with the exception of waist-to-hip ratio. Waist circumference wasselected as a simpler and potentially su-perior measure for this population.21 Onesignificant difference between the stud-ies is that the groups in the Crum andLanger study19 were not treated equally:the intervention group received the at-tention associated with an educationalsession, whereas the control group par-ticipated only in the health screenings.To avoid that potential bias, we providedthe control participants with an equiva-lent educational session on an unrelatedtopic, along with an equivalent amountand type of related educational materialsthroughout the study. In addition, althoughCrum and Langer19 collected data at 4weeks, we felt it would be valuable todetermine not only if we saw similarchanges at 4 weeks, but also whether anyfurther changes occurred after 8 weeks.
METHODSDesign and ParticipantsAll experimental procedures were re-
viewed and approved by the InstitutionalReview Board of The University of Texasat Austin. Participants were recruitedfrom the Division of Housing and FoodService (DHFS) during 2 separate build-
ing service employee meetings on eitherthe north or south end of campus. Allemployees in attendance performed iden-tical jobs, albeit on opposite sides of cam-pus. Employees were invited to partici-pate based on their campus job locations,which were randomly assigned as eitherintervention (north-end workers) or con-trol (south-end workers). Job activities fordifferent work positions were the same,regardless of campus location, and theamount and type of activities performedwere consistent throughout the data col-lection period. Both groups were told thatwe wanted to learn more about ways toimprove employee health, and they wereinvited to participate in a series of healthscreenings in which they would receivepersonal health information and educa-tional materials.
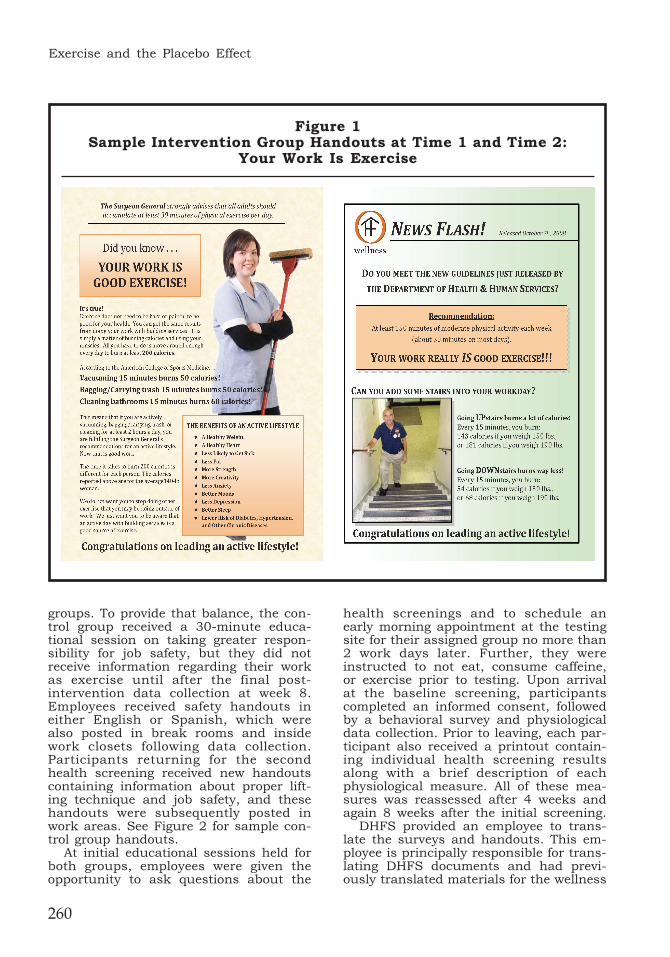
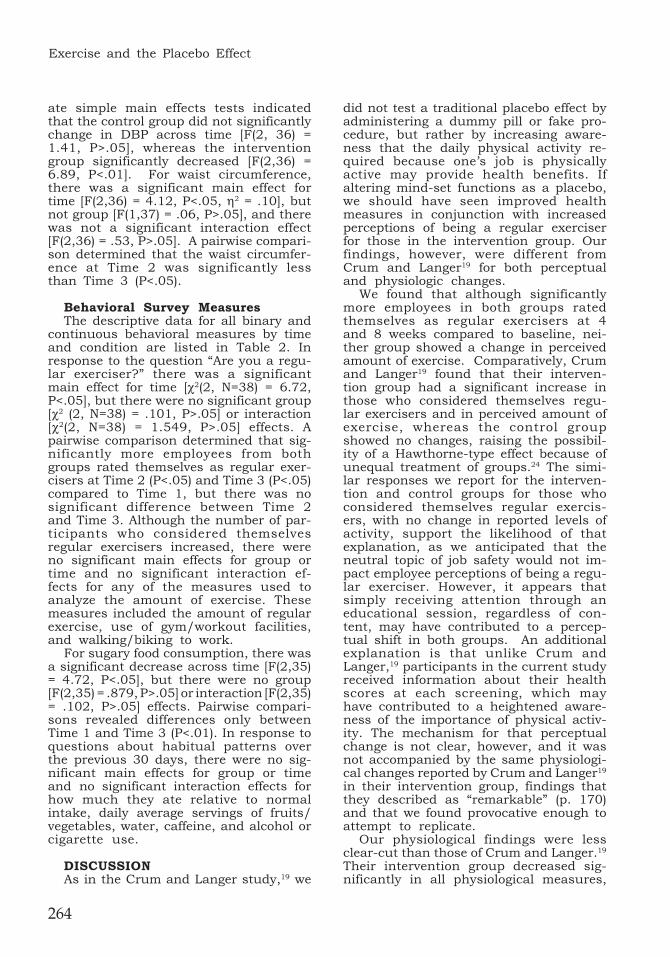
Following the design of Crum andLanger,19 the intervention group receiveda 30-minute educational session regard-ing the potential health benefits of theirjob-related duties and information thattheir work satisfied the Centers for Dis-ease Control (CDC) recommendations foran active lifestyle. Participants receiveda handout detailing the average caloricexpenditure for typical tasks, such asvacuuming, bagging/carrying trash,cleaning bathrooms, and carpet extrac-tion.22 In addition, the handout containedgeneral information regarding the healthbenefits of low-level activities to increasecaloric expenditure, such as “activity doesnot have to be hard to have value.” Thetext included on the initial handouts wasidentical to that used by Crum and Langer;the graphics were updated to enhancevisual appeal. Separate handouts werecreated based on 190-lb males and 140-lbfemales and offered to all participants ineither English or Spanish. Handouts werealso posted in break rooms and insidearea work closets following participantrecruitment and data collection. Partici-pants returning for the second healthscreening received new handouts, whichwere also posted in work areas, contain-ing information about caloric expendi-ture during stair climbing. See Figure 1for sample intervention group handouts.
Unlike the original study in which noinformation was provided to the controlgroup, we felt it was important to providethe same amount and type of educationon a neutral topic in order to control forattention bias between treatment of the 2
Exercise and the Placebo Effect
260
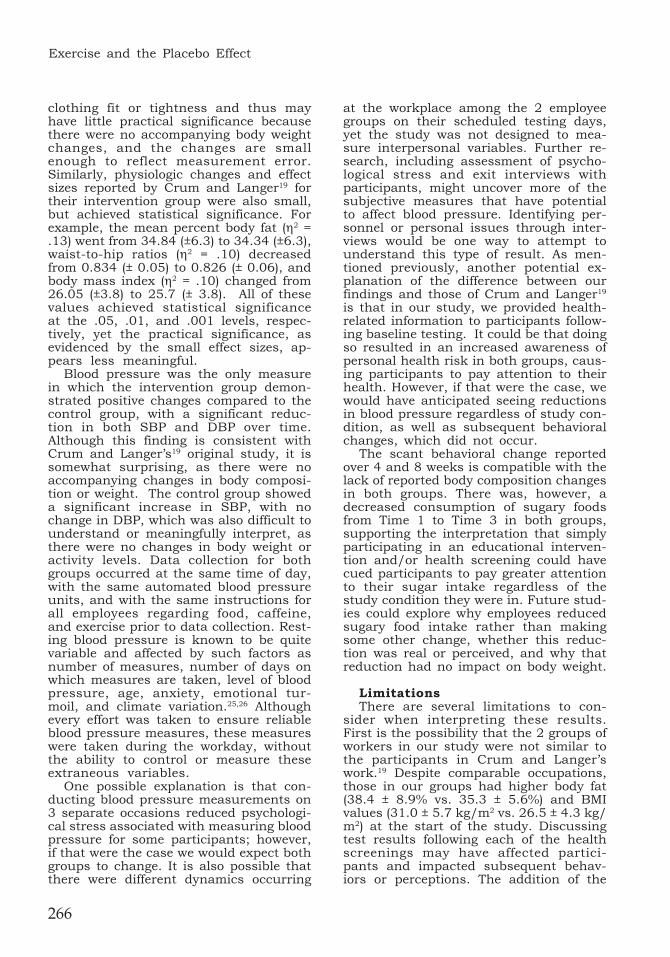
groups. To provide that balance, the con-trol group received a 30-minute educa-tional session on taking greater respon-sibility for job safety, but they did notreceive information regarding their workas exercise until after the final post-intervention data collection at week 8.Employees received safety handouts ineither English or Spanish, which werealso posted in break rooms and insidework closets following data collection.Participants returning for the secondhealth screening received new handoutscontaining information about proper lift-ing technique and job safety, and thesehandouts were subsequently posted inwork areas. See Figure 2 for sample con-trol group handouts.
At initial educational sessions held forboth groups, employees were given theopportunity to ask questions about the
health screenings and to schedule anearly morning appointment at the testingsite for their assigned group no more than2 work days later. Further, they wereinstructed to not eat, consume caffeine,or exercise prior to testing. Upon arrivalat the baseline screening, participantscompleted an informed consent, followedby a behavioral survey and physiologicaldata collection. Prior to leaving, each par-ticipant also received a printout contain-ing individual health screening resultsalong with a brief description of eachphysiological measure. All of these mea-sures was reassessed after 4 weeks andagain 8 weeks after the initial screening.
DHFS provided an employee to trans-late the surveys and handouts. This em-ployee is principally responsible for trans-lating DHFS documents and had previ-ously translated materials for the wellness
Figure 1Sample Intervention Group Handouts at Time 1 and Time 2:
Your Work Is Exercise

Stanforth et al
Am J Health Behav.™™™™™ 2011;35(3):257-268 261
team. Following all translations, 2 fitnessprofessionals who were conversant inSpanish were asked to read the docu-ments to ensure that the Spanish ver-sions were as clear and unambiguous aspossible. Spanish speakers were alsoavailable at all data collections to presentinformation, answer questions, and clarifyanything about the surveys or healthscreenings that participants did not un-derstand.
A total of 53 participants completed theinitial health screening (intervention=33;control=20), 50 completed the secondhealth screening (intervention=31; con-trol=19), and 39 completed all 3 assess-ments (intervention=25; control=14). Bothgroups were predominantly Hispanic andfemale, although some males (n=9) andother ethnicities (n=8) completed all 3assessments.
MeasuresPhysiological measures. Blood pres-
sure and resting heart rate were mea-sured using an Omron HEM-780N3 Auto-matic Blood Pressure Monitor (Omron Co,Tokyo, Japan), which takes 3 consecu-tive readings one minute apart and dis-plays the average. Participants wereseated for at least 10 minutes prior totesting, and investigators recorded theaverage value displayed after 3 readings.
Height was measured to the nearest0.1 cm using a portable stadiometer (PE-AIM-101 Portable Adult/Infant Measur-ing Unit, Perspective Enterprises, Inc,Portage, MI). Two readings were takenwith the participant standing on the plat-form without shoes or socks and steppingoff between readings. A third measure-ment was taken if the values differed bymore than 0.5 cm, and the final valueused for analysis was the mean of the 2closest values.
Body weight and percentage of body fatwere measured using leg-to-leg bioelec-trical impedance with the professional
Figure 2 Sample Control Group Handouts at Time 1 and Time 2:
Neutral Topics
Exercise and the Placebo Effect
262
grade Tanita BF 350 Professional DigitalScale (Tanita Manufacturing Co, Tokyo,Japan). Two measures were recorded. Ifbody fat differed by more than 1%, a thirdmeasurement was recorded. The finalvalue used for analysis was the mean ofthe 2 closest values.
BMI (kg/m2) was calculated from finalweight and height values. Waist circum-ference was taken to the nearest 0.1 cmat the level of the umbilicus with a profes-sional grade plastic tape. Two measure-ments were recorded. If they differed bymore than 0.5 cm, a third measurementwas recorded. The final value used foranalysis was the mean of the 2 closestvalues. Employees wore required workuniforms for each of the assessments,and clothing was lifted and/or lowered sothe measurement was always takenagainst skin.
Behavioral survey measures. Partici-pants completed a written questionnairewith 11 items in either Spanish or En-glish. Survey questions included infor-mation regarding perceived exercise leveland dietary and smoking behaviors (seeTable 2), as reported in Crum and Langer’soriginal paper.19
Self-reported exercise. Subjects indi-cated if they were a regular exerciser(no/yes) and the amount of exercise theyget on a scale ranging from 0 (none) to 10(a lot). They were asked to describe theirexercise by listing specific types andamounts of activities performed eachweek, as well as whether they use a gym/workout facility (no/yes) and if they walk/bike to work (no/yes).
Dietary and smoking behaviors. Par-ticipants responded to all questions inthis section based on average daily con-sumption and habitual choices over theprevious 30 days. Categories includedhow much they consumed relative to theirnormal intake and serving ranges of fruitsand vegetables, sugary foods, water, drinkscontaining caffeine, and alcohol. Partici-pants also indicated if they smoked and, ifso, how many cigarettes or number ofpacks per day.
Statistical AnalysesWe had both continuous and binary
outcome variables. Descriptive statistics,including means and standard deviations,were calculated for all continuous vari-ables; proportions and confidence inter-vals were calculated for binary variables.
All dependent variables were examinedusing a 3 (Time: baseline, 4 weeks, 8weeks; within subjects) x 2 (Condition:control, intervention; between subjects)repeated-measures analysis of variance(ANOVA). Because of the attrition ratebetween 4 and 8 weeks, those partici-pants completing the first 2 assessmentswere examined using a 2x2 repeated-measures ANOVA. The 2x2 and 3x2 re-peated-measures ANOVA yielded similarresults despite the reduction in samplesize; therefore, only data from partici-pants completing all 3 assessments isgiven. A generalized estimating equation(GEE) model was used for noncontinuousvariables, including regular exercise, useof gym, walk/bike to work, and smoking.The structure of the model with GEE wasthe same as with the ANOVAs. The testsof model effects for time (baseline, 4 weeks,8 weeks), group (control, intervention),and interaction were determined usingWald chi-square values from the GEE.
Power analysis using G*Power,23 a soft-ware program for sample-size estima-tion, indicates that the sample size nec-essary to find significant large (.5), mod-erate (.3), or small (.15) effects for re-peated-measures ANOVA (within-be-tween interaction) would require samplesizes of 10, 20, and 74, respectively. Thefinal sample size of N=39 should be suffi-cient to detect moderate to large statisti-cal effects, and supports the choice ofexamining those participants who com-pleted all 3 screenings, as there were notsufficient numbers at any of the timepoints to detect small effects. The onlyavailable power analysis technique forGEE is an approximate method, based onthe same technique used in meta-analy-sis. The analysis involved determiningthe effect size (index f) for the GEE toassess whether the study was poweredadequately to conclude that the effect sizewas significant. Consistent with the find-ings for the continuous variables, analy-sis revealed 84 participants would havebeen necessary to get a significant P-value from the GEE (f = .14). SPSS 15.0was used for all analyses, with an alphalevel set at 0.05 and 2-sided hypotheses.
RESULTSThe 2x2 and 3x2 repeated-measures
analyses yielded similar results despitethe reduction in sample size; therefore,only data from participants completing all
Stanforth et al
Am J Health Behav.™™™™™ 2011;35(3):257-268 263
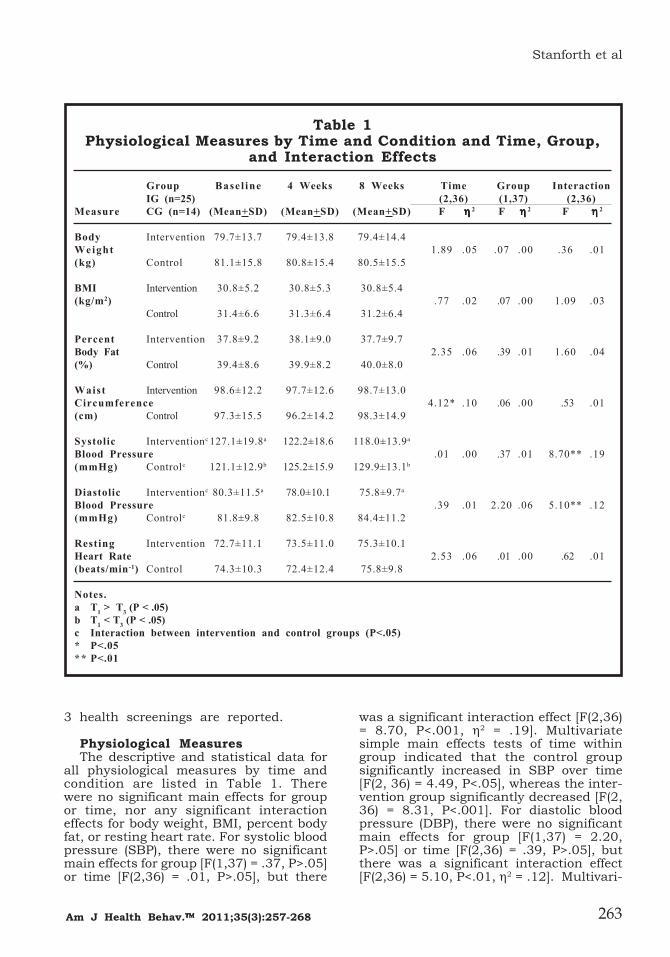
3 health screenings are reported.
Physiological MeasuresThe descriptive and statistical data for
all physiological measures by time andcondition are listed in Table 1. Therewere no significant main effects for groupor time, nor any significant interactioneffects for body weight, BMI, percent bodyfat, or resting heart rate. For systolic bloodpressure (SBP), there were no significantmain effects for group [F(1,37) = .37, P>.05]or time [F(2,36) = .01, P>.05], but there
was a significant interaction effect [F(2,36)= 8.70, P<.001, η2 = .19]. Multivariatesimple main effects tests of time withingroup indicated that the control groupsignificantly increased in SBP over time[F(2, 36) = 4.49, P<.05], whereas the inter-vention group significantly decreased [F(2,36) = 8.31, P<.001]. For diastolic bloodpressure (DBP), there were no significantmain effects for group [F(1,37) = 2.20,P>.05] or time [F(2,36) = .39, P>.05], butthere was a significant interaction effect[F(2,36) = 5.10, P<.01, η2 = .12]. Multivari-
Table 1Physiological Measures by Time and Condition and Time, Group,
and Interaction Effects
Group Basel ine 4 Weeks 8 Weeks Time Group InteractionIG (n=25) (2,36) (1,37) (2,36)
Measure CG (n=14) (Mean+SD) (Mean+SD) (Mean+SD) F ηηηηη 2 F ηηηηη 2 F ηηηηη 2
Body Intervention 79.7±13.7 79.4±13.8 79.4±14.4Weight 1.89 .05 .07 .00 .36 .01(kg) Control 81.1±15.8 80.8±15.4 80.5±15.5
BMI Intervention 30.8±5.2 30.8±5.3 30.8±5.4(kg/m2) .77 .02 .07 .00 1.09 .03
Control 31.4±6.6 31.3±6.4 31.2±6.4
Percent Intervention 37.8±9.2 38.1±9.0 37.7±9.7Body Fat 2.35 .06 .39 .01 1.60 .04(%) Control 39.4±8.6 39.9±8.2 40.0±8.0
Waist Intervention 98.6±12.2 97.7±12.6 98.7±13.0Circumference 4.12* .10 .06 .00 .53 .01(cm) Control 97.3±15.5 96.2±14.2 98.3±14.9
Systolic Interventionc 127.1±19.8a 122.2±18.6 118.0±13.9a
Blood Pressure .01 .00 .37 .01 8.70** .19(mmHg) Controlc 121.1±12.9b 125.2±15.9 129.9±13.1b
Diastolic Interventionc 80.3±11.5a 78.0±10.1 75.8±9.7a
Blood Pressure .39 .01 2.20 .06 5.10** .12(mmHg) Controlc 81.8±9.8 82.5±10.8 84.4±11.2
Resting Intervention 72.7±11.1 73.5±11.0 75.3±10.1Heart Rate 2.53 .06 .01 .00 .62 .01(beats/min-1) Control 74.3±10.3 72.4±12.4 75.8±9.8
Notes.a T1 > T3 (P < .05)b T1 < T3 (P < .05)c Interaction between intervention and control groups (P<.05)* P<.05** P<.01
Exercise and the Placebo Effect
264
ate simple main effects tests indicatedthat the control group did not significantlychange in DBP across time [F(2, 36) =1.41, P>.05], whereas the interventiongroup significantly decreased [F(2,36) =6.89, P<.01]. For waist circumference,there was a significant main effect fortime [F(2,36) = 4.12, P<.05, η2 = .10], butnot group [F(1,37) = .06, P>.05], and therewas not a significant interaction effect[F(2,36) = .53, P>.05]. A pairwise compari-son determined that the waist circumfer-ence at Time 2 was significantly lessthan Time 3 (P<.05).
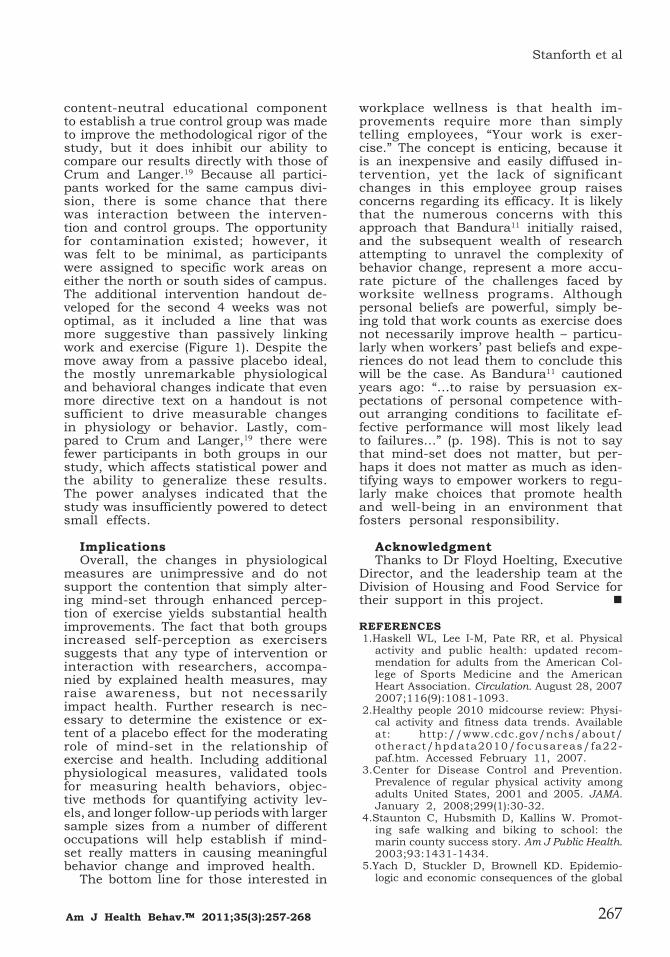
Behavioral Survey MeasuresThe descriptive data for all binary and
continuous behavioral measures by timeand condition are listed in Table 2. Inresponse to the question “Are you a regu-lar exerciser?” there was a significantmain effect for time [χ2(2, N=38) = 6.72,P<.05], but there were no significant group[χ2 (2, N=38) = .101, P>.05] or interaction[χ2(2, N=38) = 1.549, P>.05] effects. Apairwise comparison determined that sig-nificantly more employees from bothgroups rated themselves as regular exer-cisers at Time 2 (P<.05) and Time 3 (P<.05)compared to Time 1, but there was nosignificant difference between Time 2and Time 3. Although the number of par-ticipants who considered themselvesregular exercisers increased, there wereno significant main effects for group ortime and no significant interaction ef-fects for any of the measures used toanalyze the amount of exercise. Thesemeasures included the amount of regularexercise, use of gym/workout facilities,and walking/biking to work.
For sugary food consumption, there wasa significant decrease across time [F(2,35)= 4.72, P<.05], but there were no group[F(2,35) = .879, P>.05] or interaction [F(2,35)= .102, P>.05] effects. Pairwise compari-sons revealed differences only betweenTime 1 and Time 3 (P<.01). In response toquestions about habitual patterns overthe previous 30 days, there were no sig-nificant main effects for group or timeand no significant interaction effects forhow much they ate relative to normalintake, daily average servings of fruits/vegetables, water, caffeine, and alcohol orcigarette use.
DISCUSSIONAs in the Crum and Langer study,19 we
did not test a traditional placebo effect byadministering a dummy pill or fake pro-cedure, but rather by increasing aware-ness that the daily physical activity re-quired because one’s job is physicallyactive may provide health benefits. Ifaltering mind-set functions as a placebo,we should have seen improved healthmeasures in conjunction with increasedperceptions of being a regular exerciserfor those in the intervention group. Ourfindings, however, were different fromCrum and Langer19 for both perceptualand physiologic changes.
We found that although significantlymore employees in both groups ratedthemselves as regular exercisers at 4and 8 weeks compared to baseline, nei-ther group showed a change in perceivedamount of exercise. Comparatively, Crumand Langer19 found that their interven-tion group had a significant increase inthose who considered themselves regu-lar exercisers and in perceived amount ofexercise, whereas the control groupshowed no changes, raising the possibil-ity of a Hawthorne-type effect because ofunequal treatment of groups.24 The simi-lar responses we report for the interven-tion and control groups for those whoconsidered themselves regular exercis-ers, with no change in reported levels ofactivity, support the likelihood of thatexplanation, as we anticipated that theneutral topic of job safety would not im-pact employee perceptions of being a regu-lar exerciser. However, it appears thatsimply receiving attention through aneducational session, regardless of con-tent, may have contributed to a percep-tual shift in both groups. An additionalexplanation is that unlike Crum andLanger,19 participants in the current studyreceived information about their healthscores at each screening, which mayhave contributed to a heightened aware-ness of the importance of physical activ-ity. The mechanism for that perceptualchange is not clear, however, and it wasnot accompanied by the same physiologi-cal changes reported by Crum and Langer19
in their intervention group, findings thatthey described as “remarkable” (p. 170)and that we found provocative enough toattempt to replicate.
Our physiological findings were lessclear-cut than those of Crum and Langer.19
Their intervention group decreased sig-nificantly in all physiological measures,

Stanforth et al
Am J Health Behav.™™™™™ 2011;35(3):257-268 265
whereas our groups showed no change inbody weight, BMI, percent body fat, orresting heart rate at either time point.Although there was no significant differ-ence in waist circumference betweentimes 1 and 2 or 1 and 3, both groups weresignificantly lower at Time 2 than Time
3. Although these values were signifi-cantly different, they ranged from only alow of 97.1 cm (± 13.0) at Time 2 to a highof 98.6 cm (± 13.5) at Time 3. Thesefigures represent a statistically signifi-cant (P<.05) change in girth that may notregister in one’s conscious awareness of
Table 2Self-reported Binary and Continuous Behavioral Measures by
Time and Condition
Group Baseline 4 Weeks 8 WeeksIG (n = 25)CG (n = 14) Mean (CI) Mean (CI) Mean (CI)
Binary VariablesRegular exercise Intervention 0.32 [.12, .52]a 0.52 [.31, .73]a 0.56 [.35, .77]a
(N = 0; Y = 1) Control 0.46 [.19, .74]a 0.54 [.25, .83]a 0.54 [.25, .83]a
Use of gym/workout facility Intervention 0.20 [.02, .38] 0.28 [.09, .47] 0.24 [.05, .43](N = 0; Y = 1) Control 0.33 [.08, .59] 0.33 [.06, .61] 0.42 [.15, .69]
Walk/bike to work Intervention 0.12 [-.03, .27] 0.08 [-.07, .23] 0.12 [-.02, .26](N = 0; Y = 1) Control 0.25 [.03, .47] 0.33 [.12, .54] 0.17 [-.04, .37]
Smoking Intervention 0.08 [-.06, .22] 0.12 [-.03, .27] 0.12 [-.03, .27](N = 0; Y = 1) Control 0.23 [.04, .42] 0.23 [.02, .44] 0.23 [.02, .44]
Continuous Variables (Mean ± SD) (Mean ± SD) (Mean ± SD)Perceived amount of exercise Intervention 4.68 ± 2.53 5.00 ± 1.94 5.24 ± 2.05(0 10 = a lot) Control 3.92 ± 3.50 4.46 ± 2.73 4.38 ± 2.87
Food intake Intervention 1.56 ± 0.82 1.44 ± 0.65 1.36 ± 0.70(Less=0; Same=1, More usual=2) Control 1.69 ± 0.86 1.54 ± 0.66 1.31 ± 0.48
Fruit/vegetables Intervention 2.96 ± 1.74 2.16 ± 1.28 2.44 ± 1.36(servings/day) Control 3.08 ± 1.61 3.08 ± 1.38 2.69 ± 1.75
Sugary foods Intervention 3.00 ± 2.00b 2.32 ± 1.77 1.92 ± 1.35b (servings/day) Control 2.46 ± 1.94b 2.08 ± 1.61 1.46 ± 1.56b
Water Intervention 4.16 ± 2.54 3.76 ± 2.07 3.20 ± 1.61(servings/day) Control 4.31 ± 2.56 4.08 ± 1.75 4.00 ± 2.31
Caffeine Intervention 2.88 ± 2.30 2.64 ± 2.10 2.12 ± 1.59(servings/day) Control 3.31 ± 2.14 2.69 ± 1.89 2.31 ± 1.60
Alcohol consumption Intervention 0.48 ± 0.82 0.68 ± 1.11 0.40 ± 0.76(servings/day) Control 0.31 ± 0.63 0.31 ± 0.63 0.00 ± 0.00
Notes.CI = 95% confidence intervala T1 < T2 , T3 (P < .05)b T1 > T3 (P < .05)
Exercise and the Placebo Effect
266
clothing fit or tightness and thus mayhave little practical significance becausethere were no accompanying body weightchanges, and the changes are smallenough to reflect measurement error.Similarly, physiologic changes and effectsizes reported by Crum and Langer19 fortheir intervention group were also small,but achieved statistical significance. Forexample, the mean percent body fat (η2 =.13) went from 34.84 (±6.3) to 34.34 (±6.3),waist-to-hip ratios (η2 = .10) decreasedfrom 0.834 (± 0.05) to 0.826 (± 0.06), andbody mass index (η2 = .10) changed from26.05 (±3.8) to 25.7 (± 3.8). All of thesevalues achieved statistical significanceat the .05, .01, and .001 levels, respec-tively, yet the practical significance, asevidenced by the small effect sizes, ap-pears less meaningful.
Blood pressure was the only measurein which the intervention group demon-strated positive changes compared to thecontrol group, with a significant reduc-tion in both SBP and DBP over time.Although this finding is consistent withCrum and Langer’s19 original study, it issomewhat surprising, as there were noaccompanying changes in body composi-tion or weight. The control group showeda significant increase in SBP, with nochange in DBP, which was also difficult tounderstand or meaningfully interpret, asthere were no changes in body weight oractivity levels. Data collection for bothgroups occurred at the same time of day,with the same automated blood pressureunits, and with the same instructions forall employees regarding food, caffeine,and exercise prior to data collection. Rest-ing blood pressure is known to be quitevariable and affected by such factors asnumber of measures, number of days onwhich measures are taken, level of bloodpressure, age, anxiety, emotional tur-moil, and climate variation.25,26 Althoughevery effort was taken to ensure reliableblood pressure measures, these measureswere taken during the workday, withoutthe ability to control or measure theseextraneous variables.
One possible explanation is that con-ducting blood pressure measurements on3 separate occasions reduced psychologi-cal stress associated with measuring bloodpressure for some participants; however,if that were the case we would expect bothgroups to change. It is also possible thatthere were different dynamics occurring
at the workplace among the 2 employeegroups on their scheduled testing days,yet the study was not designed to mea-sure interpersonal variables. Further re-search, including assessment of psycho-logical stress and exit interviews withparticipants, might uncover more of thesubjective measures that have potentialto affect blood pressure. Identifying per-sonnel or personal issues through inter-views would be one way to attempt tounderstand this type of result. As men-tioned previously, another potential ex-planation of the difference between ourfindings and those of Crum and Langer19
is that in our study, we provided health-related information to participants follow-ing baseline testing. It could be that doingso resulted in an increased awareness ofpersonal health risk in both groups, caus-ing participants to pay attention to theirhealth. However, if that were the case, wewould have anticipated seeing reductionsin blood pressure regardless of study con-dition, as well as subsequent behavioralchanges, which did not occur.
The scant behavioral change reportedover 4 and 8 weeks is compatible with thelack of reported body composition changesin both groups. There was, however, adecreased consumption of sugary foodsfrom Time 1 to Time 3 in both groups,supporting the interpretation that simplyparticipating in an educational interven-tion and/or health screening could havecued participants to pay greater attentionto their sugar intake regardless of thestudy condition they were in. Future stud-ies could explore why employees reducedsugary food intake rather than makingsome other change, whether this reduc-tion was real or perceived, and why thatreduction had no impact on body weight.
LimitationsThere are several limitations to con-
sider when interpreting these results.First is the possibility that the 2 groups ofworkers in our study were not similar tothe participants in Crum and Langer’swork.19 Despite comparable occupations,those in our groups had higher body fat(38.4 ± 8.9% vs. 35.3 ± 5.6%) and BMIvalues (31.0 ± 5.7 kg/m2 vs. 26.5 ± 4.3 kg/m2) at the start of the study. Discussingtest results following each of the healthscreenings may have affected partici-pants and impacted subsequent behav-iors or perceptions. The addition of the
Stanforth et al
Am J Health Behav.™™™™™ 2011;35(3):257-268 267
content-neutral educational componentto establish a true control group was madeto improve the methodological rigor of thestudy, but it does inhibit our ability tocompare our results directly with those ofCrum and Langer.19 Because all partici-pants worked for the same campus divi-sion, there is some chance that therewas interaction between the interven-tion and control groups. The opportunityfor contamination existed; however, itwas felt to be minimal, as participantswere assigned to specific work areas oneither the north or south sides of campus.The additional intervention handout de-veloped for the second 4 weeks was notoptimal, as it included a line that wasmore suggestive than passively linkingwork and exercise (Figure 1). Despite themove away from a passive placebo ideal,the mostly unremarkable physiologicaland behavioral changes indicate that evenmore directive text on a handout is notsufficient to drive measurable changesin physiology or behavior. Lastly, com-pared to Crum and Langer,19 there werefewer participants in both groups in ourstudy, which affects statistical power andthe ability to generalize these results.The power analyses indicated that thestudy was insufficiently powered to detectsmall effects.
ImplicationsOverall, the changes in physiological
measures are unimpressive and do notsupport the contention that simply alter-ing mind-set through enhanced percep-tion of exercise yields substantial healthimprovements. The fact that both groupsincreased self-perception as exerciserssuggests that any type of intervention orinteraction with researchers, accompa-nied by explained health measures, mayraise awareness, but not necessarilyimpact health. Further research is nec-essary to determine the existence or ex-tent of a placebo effect for the moderatingrole of mind-set in the relationship ofexercise and health. Including additionalphysiological measures, validated toolsfor measuring health behaviors, objec-tive methods for quantifying activity lev-els, and longer follow-up periods with largersample sizes from a number of differentoccupations will help establish if mind-set really matters in causing meaningfulbehavior change and improved health.
The bottom line for those interested in
workplace wellness is that health im-provements require more than simplytelling employees, “Your work is exer-cise.” The concept is enticing, because itis an inexpensive and easily diffused in-tervention, yet the lack of significantchanges in this employee group raisesconcerns regarding its efficacy. It is likelythat the numerous concerns with thisapproach that Bandura11 initially raised,and the subsequent wealth of researchattempting to unravel the complexity ofbehavior change, represent a more accu-rate picture of the challenges faced byworksite wellness programs. Althoughpersonal beliefs are powerful, simply be-ing told that work counts as exercise doesnot necessarily improve health – particu-larly when workers’ past beliefs and expe-riences do not lead them to conclude thiswill be the case. As Bandura11 cautionedyears ago: “…to raise by persuasion ex-pectations of personal competence with-out arranging conditions to facilitate ef-fective performance will most likely leadto failures…” (p. 198). This is not to saythat mind-set does not matter, but per-haps it does not matter as much as iden-tifying ways to empower workers to regu-larly make choices that promote healthand well-being in an environment thatfosters personal responsibility.
AcknowledgmentThanks to Dr Floyd Hoelting, Executive
Director, and the leadership team at theDivision of Housing and Food Service fortheir support in this project.
REFERENCES1.Haskell WL, Lee I-M, Pate RR, et al. Physical
activity and public health: updated recom-mendation for adults from the American Col-lege of Sports Medicine and the AmericanHeart Association. Circulation. August 28, 20072007;116(9):1081-1093.
2.Healthy people 2010 midcourse review: Physi-cal activity and fitness data trends. Availableat: http://www.cdc.gov/nchs/about/otheract/hpdata2010/focusareas/fa22-paf.htm. Accessed February 11, 2007.
3.Center for Disease Control and Prevention.Prevalence of regular physical activity amongadults United States, 2001 and 2005. JAMA.January 2, 2008;299(1):30-32.
4.Staunton C, Hubsmith D, Kallins W. Promot-ing safe walking and biking to school: themarin county success story. Am J Public Health.2003;93:1431-1434.
5.Yach D, Stuckler D, Brownell KD. Epidemio-logic and economic consequences of the global
Exercise and the Placebo Effect
268
epidemics of obesity and diabetes. Nat Med.2006;12(1):62-66.
6.Pollock ML, Gaesser GA, Butcher JD, et al.ACSM position stand: the recommended quan-tity and quality of exercise for developing andmaintaining cardiorespiratory and muscularfitness, and flexibility in healthy adults. MedSci Sports Exerc. 1998;30(6):975-991.
7.Scully D, Kremer J, Meade MM, et al. Physicalexercise and psychological well being: a criti-cal review. Br J Sports Med. June 11998;32(2):111-120.
8.Mossey JM, Shapiro E. Self-rated health: apredictor of mortality among the elderly. Am JPublic Health. 1982;72(8):800-808.
9.Dasbach EJ, Klein R, Klein BE, et al. Self-rated health and mortality in people withdiabetes. Am J Public Health. 1994;84(11):1775-1779.
10.Lundh L-G. Placebo, belief, and health. Acognitive-emotional model. Scand J Psychol.1987;28(2):128-143.
11.Bandura A. Self-efficacy: toward a unifyingtheory of behavioral change. Psychol Rev.1977;84(2):191-215.
12.Hrobjartsson A, Gotzsche PC. Is the placebopowerless? An analysis of clinical trials com-paring placebo with no treatment. N Engl JMed. 2001;344(21):1594-1602.
13.Moerman DE, Jonas WB. Deconstructing theplacebo effect and finding the meaning re-sponse. Ann Intern Med. 2002;136(6):471-476.
14.Spiegel D, Harrington A. What is the placeboworth? BMJ. 2008;336(7651):967-968.
15.Spiegel D, Kraemer H, Carlson RW, et al. Isthe placebo powerless? N Engl J Med.2001;345(17):1276-1279.
16.Bailar JC, III. The powerful placebo and theWizard of Oz. N Engl J Med. 2001;344(21):1630-1632.
17.Plante TG, Lantis A, Checa G. The influenceof perceived versus aerobic fitness on psycho-logical health and physiological stressresponsivity. Int J Stress Manage.1998;5(3):141-156.
18.Desharnais R, Jobin J, Cote C, et al. Aerobicexercise and the placebo effect: a controlledstudy. Psychosom Med. 1993;55(2):149-154.
19.Crum AJ, Langer EJ. Mind-set matters: exer-cise and the placebo effect. Psychol Sci.2007;18(2):165-171.
20.Pate RR, Pratt M, Blair S, et al. Physicalactivity and public health. A recommendationfrom the Centers for Disease Control andPrevention and the American College of SportsMedicine. JAMA. 1995;273(5):402-407.
21.Janssen I, Katzmarzyk PT, Ross R. Body massindex, waist circumference, and health risk:evidence in support of current national insti-tutes of health guidelines. Arch Intern Med.October 14, 2002;162(18):2074-2079.
22.Ainsworth BE, Haskell WL, Leon AS, et al.Compendium of physical activities: classifi-cation of energy costs of human physicalactivities. Med Sci Sports Exerc. 1993;25(1):71-80.
23.Buchner A, Erdfelder E, Faul F. How to useg*power [www document]. Available at: http://www.psycho.uni-duesseldor f .de/aap/projects/gpower/how_to_use_gpower.html1997: Accessed June 18, 2009.
24.Holden JD. Hawthorne effects and researchinto professional practice. J Eval Clin Pract.2001;7(1):65-70.
25.Nieman D. Exercise Testing and Prescrip-tion. 6th ed. New York: McGraw Hill; 2007.
26.Stanforth PR, Gagnon J, Rice T, et al. Repro-ducibility of resting blood pressure and heartrate measurements: the heritage family study.Ann Epidemiol. 2000;10(5):271-277.