Embed Size (px)
Citation preview

An Introduction toUtility Software for Data
Processing (USDP)Sinan Akkar
Earthquake Engineeri ng Research Center
Middel East Technical University Earthquake Engineering Earthquake Engineering Research CenterResearch Center
Middle East Technical Middle East Technical UniversityUniversity
Utility Software for Data Utility Software for Data ProcessingProcessing
4th BSHAP Project Workshop16-17 December 2008, Budva, Montenegro
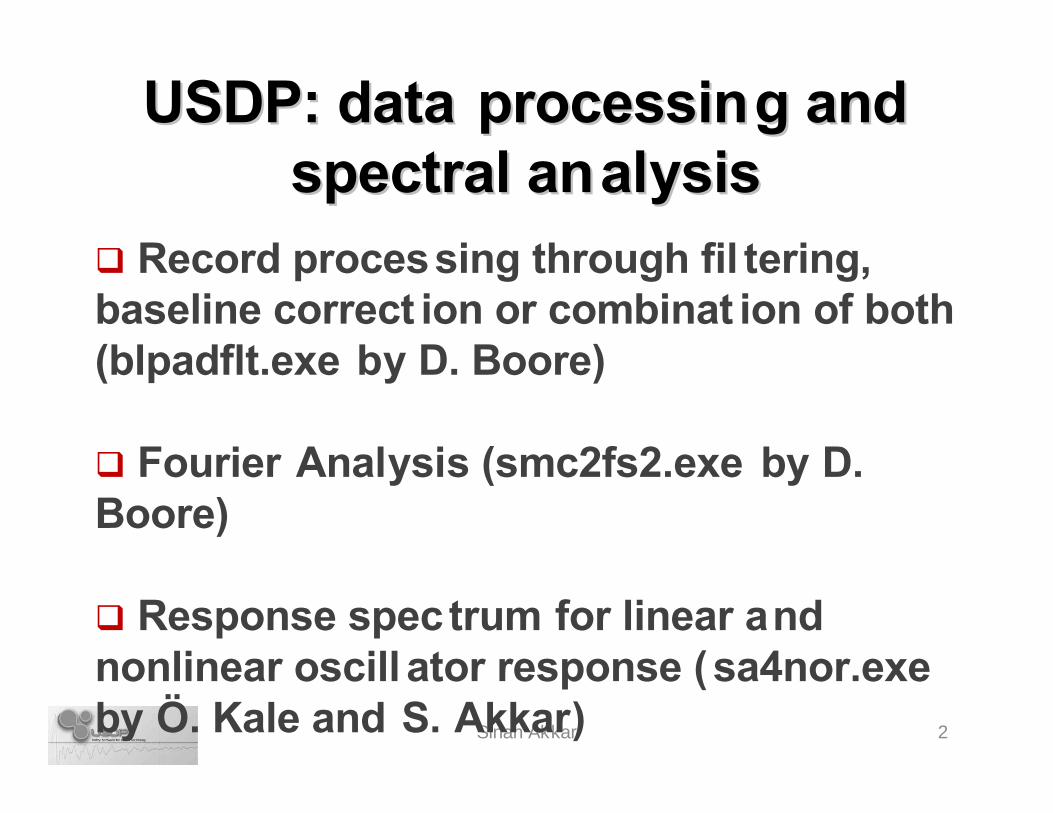
USDP: data processing and USDP: data processing and spectral analysisspectral analysis
2Sinan Akkar
q Record processing through fil tering, baseline correct ion or combinat ion of both (blpadflt.exe by D. Boore)
q Fourier Analysis (smc2fs2.exe by D. Boore)
q Response spec trum for linear and nonlinear oscill ator response (sa4nor.exe by Ö. Kale and S. Akkar)
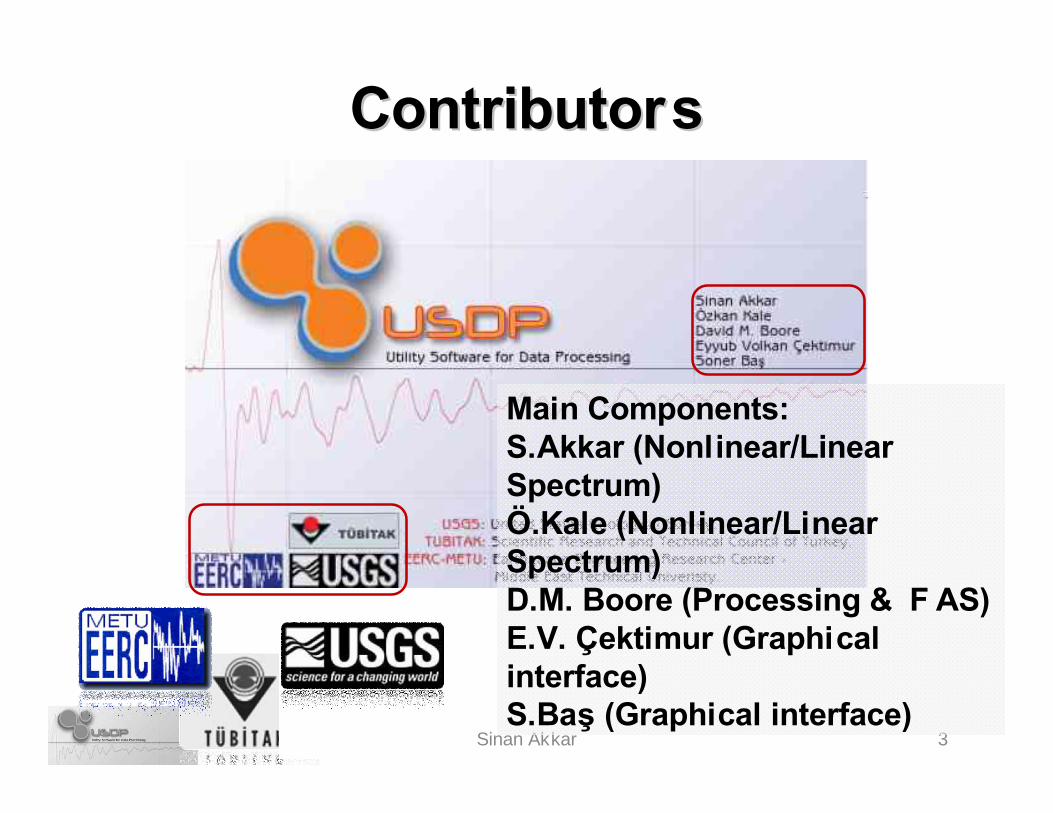
ContributorsContributors
3Sinan Akkar
Main Components:S.Akkar (Nonlinear/Linear Spectrum)Ö.Kale (Nonlinear/Linear Spectrum)D.M. Boore (Processing & F AS)E.V. Çektimur (Graphical interface)S.Baş (Graphical interface)

Outline of this presentationOutline of this presentation
Sinan Akkar 4
o Basic USDP str uctureo Main features (including its i terative character) using simple case s tudies
Ø data processing (*)
Ø Fourier spectrumØ nonlinear spect rum
(*) Discussions on optimum data proc essing parameters are out of scope of this presentation

Acknowledgment
Sinan Akkar 5
o Data processing and FAS case studies discussed in this presentation are taken from TSPP manual (http://quake.wr.usgs.gov/~boore/software_online.htm).
o Record used for the nonlinear response spectrum case study is taken from the dataset compiled for the Turkish strong-motion data project (T-NSMP, TUBITAK 105G016)
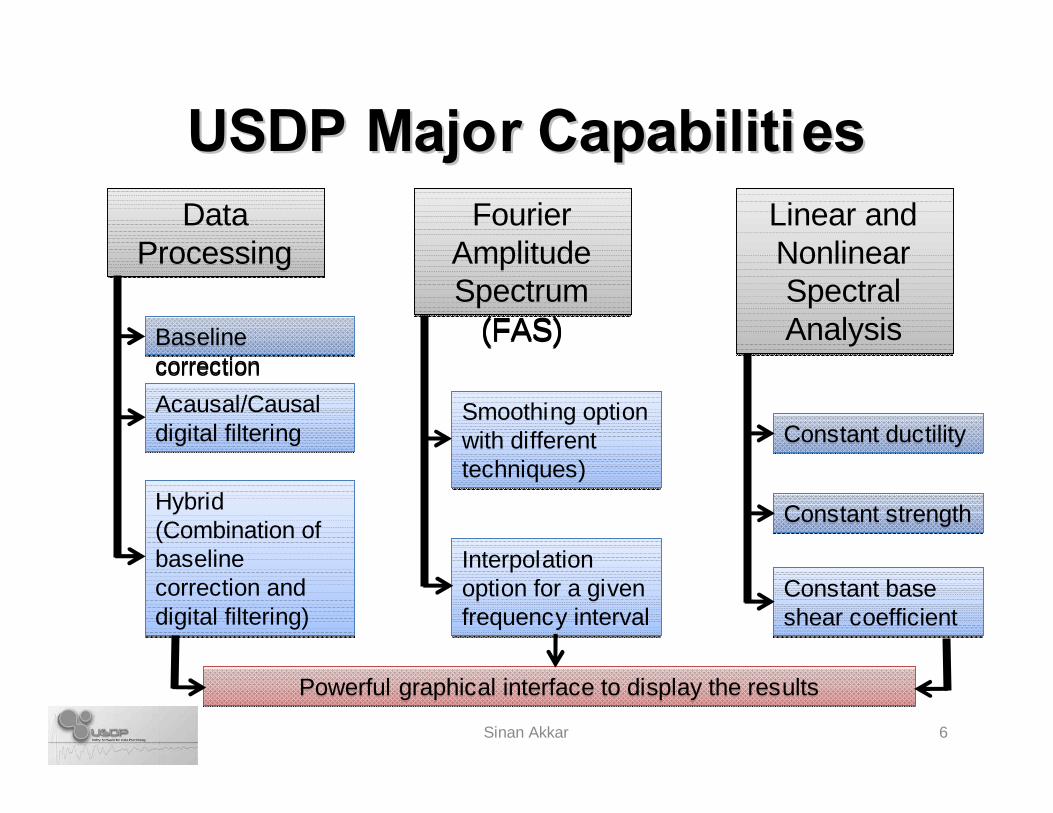
USDP Major CapabilitiesUSDP Major Capabilities
Sinan Akkar 6
Data Processing
Data Processing
Fourier Amplitude Spectrum
(FAS)
Fourier Amplitude Spectrum
(FAS)
Linear and Nonlinear Spectral Analysis
Linear and Nonlinear Spectral AnalysisBaseline
correctionBaseline correction
Acausal/Causal digital filteringAcausal/Causal digital filtering
Hybrid (Combination of baseline correction and digital filtering)
Hybrid (Combination of baseline correction and digital filtering)
Constant ductilityConstant ductility
Constant strengthConstant strength
Constant base shear coefficientConstant base shear coefficient
Smoothing option with different techniques)
Smoothing option with different techniques)
Interpolation option for a given frequency interval
Interpolation option for a given frequency interval
Powerful graphical interface to display the resultsPowerful graphical interface to display the results

Data processingData processing(Basic filtering with / without (Basic filtering with / without
tapering)tapering)
Sinan Akkar 7

Start Data Processing Wizard Start Data Processing Wizard
Sinan Akkar 8
Two records to process
Two records to process
Records can be viewed by clicking on “Quick view”
Records can be viewed by clicking on “Quick view”

Remove preRemove pre --event mean (zerothevent mean (zeroth --orderorder--correction, zoc) correction, zoc)
Sinan Akkar 9
Step #1:Remove mean of first 8 sec from the entire lengths of both records
Step #2:Click “next” until the “spectrum”window appears
Step #3:100 log-spaced period values between 0.01 sec to 50 sec for 5% damping spectrum
Step #4:Hit “Skip to Last Page” to finalize the wizard

Results of zoc for Example 1
Sinan Akkar 10
After h
itting
“close”

Illustrations (zoc displacements)
Sinan Akkar 11
Artifacts that Artifacts that result in longresult in long--period period fluctuationsfluctuations

High-pass (acausal) filtering of zoc record
Sinan Akkar 12
You can duplicate the folders and drag-and-drop the outputs of one folder into the other
High-pass acausal filter with 0.02 Hz. Filter roll-of is such that filter decays as f8 at low frequencies
Choose “Acausal”filtering option and click on “Next”
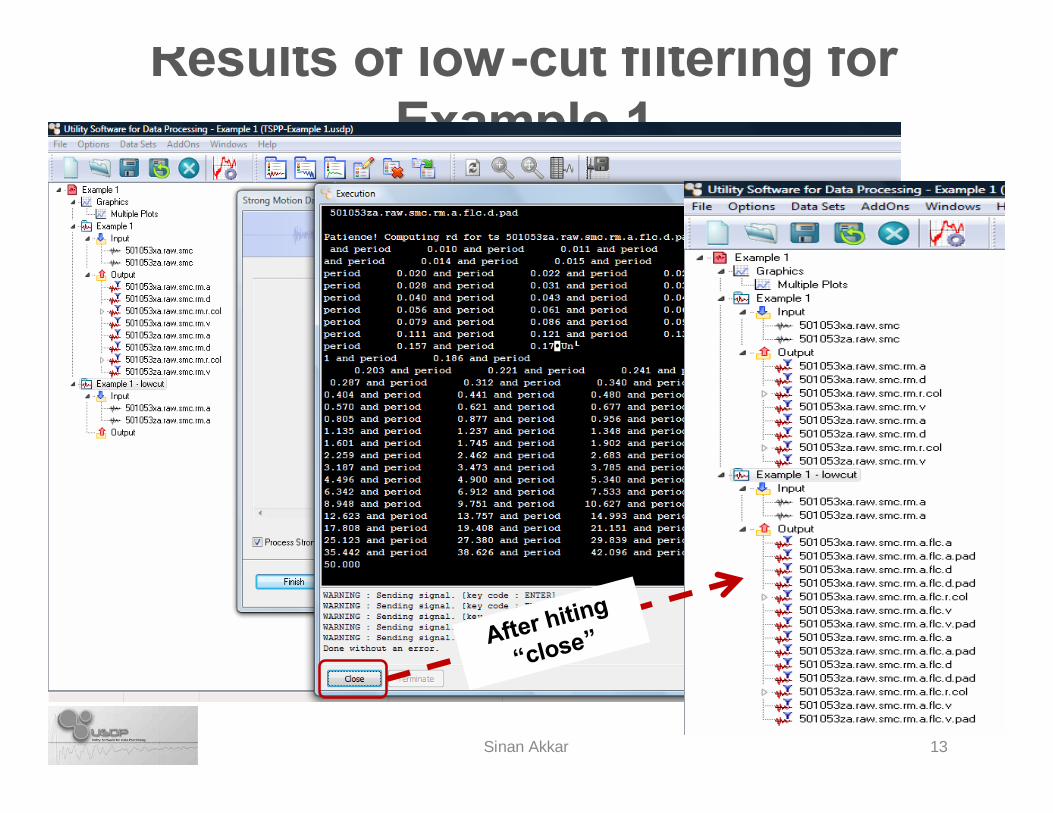
Results of low-cut filtering for Example 1
Sinan Akkar 13
After hiting
“close”

Illustrations (low -cut filtered records)
Sinan Akkar 14
Filter transients due to acausal filtering. Apply tapering to reduc e their effects
Filter transients due to acausal filtering. Apply tapering to reduc e their effects

Tapering and Acausal filteringTapering and Acausal filtering
Sinan Akkar 15
Duplicate the previous folder
Apply tapering to the last 20 sec of the record
Click on “Skip to Last Page” to finalize the wizard

Results of low-cut filtering and tapering for Example 1
Sinan Akkar 16
After hiting
“close”
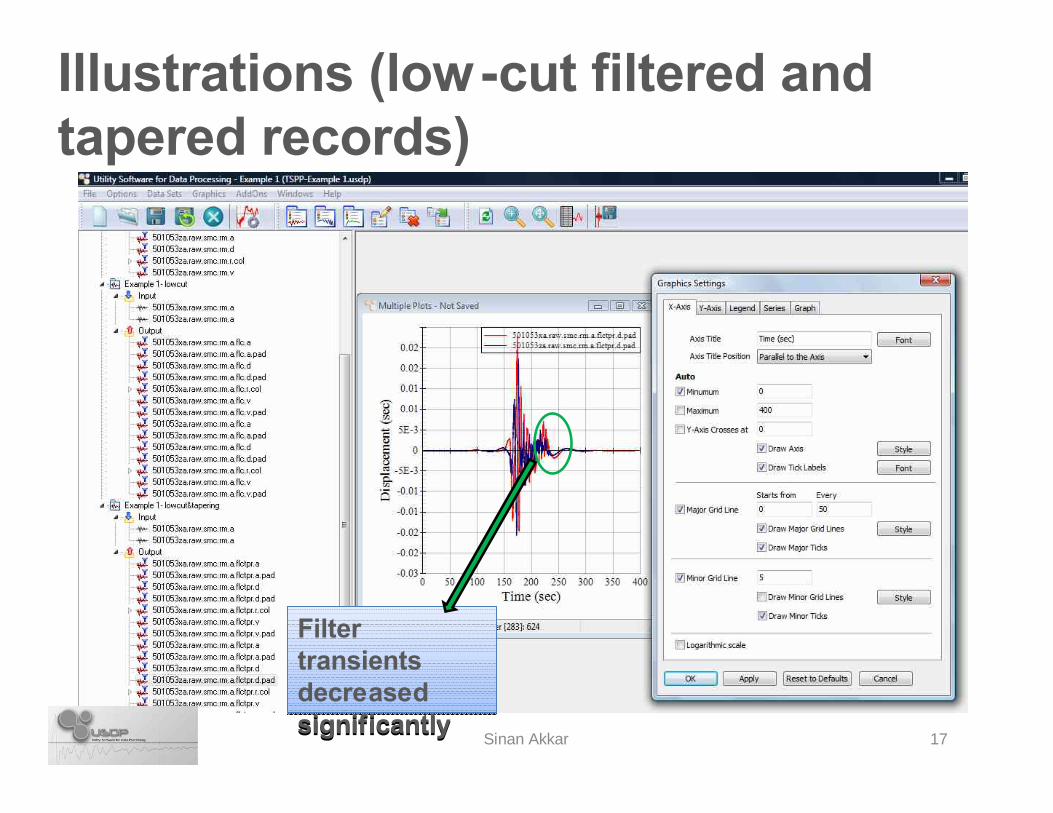
Illustrations (low -cut filtered and tapered records)
Sinan Akkar 17
Filter transients decreased significantly
Filter transients decreased significantly

Compare Spectral Compare Spectral DisplacementsDisplacements
Sinan Akkar 18
Plot the spectral curves of “zoc” (red) and acausally filtered data with (green) and without (blue) tapering
Plot the spectral curves of “zoc” (red) and acausally filtered data with (green) and without (blue) tapering
Filtering with and without tapering makes a di fference in SD at periods relatively smaller than filter cut-off period (Tc = 50 sec). This indicates filter transients are influential on SD calculations for this particular record
Filtering with and without tapering makes a di fference in SD at periods relatively smaller than filter cut-off period (Tc = 50 sec). This indicates filter transients are influential on SD calculations for this particular record

Fourier Amplitude Spe ctrumFourier Amplitude Spe ctrum(Unsmoothed / smoothed FAS) (Unsmoothed / smoothed FAS)
Sinan Akkar 19

FAS – no smoothing
Sinan Akkar 20
The FAS of zoc and acausally f iltered (with/without tapering )accelerograms are calculated. Click on “Next” after adding these files.
The FAS of zoc and acausally f iltered (with/without tapering )accelerograms are calculated. Click on “Next” after adding these files.

Specify “no smoothing” in the calculations
Sinan Akkar 21
No smoothing
No smoothing
DC comp. is removed
DC comp. is removed
Click on “Next”
Click on “Next”

Illustrations (FAS – no smoothing)
Sinan Akkar 22
Click on “Close” when the runs finish
Filter cut-off frequency (0.02 Hz)
Choose a fi lter cut-off higher than 0.02 Hz to have faster decay at low frequencies
Choose a fi lter cut-off higher than 0.02 Hz to have faster decay at low frequencies
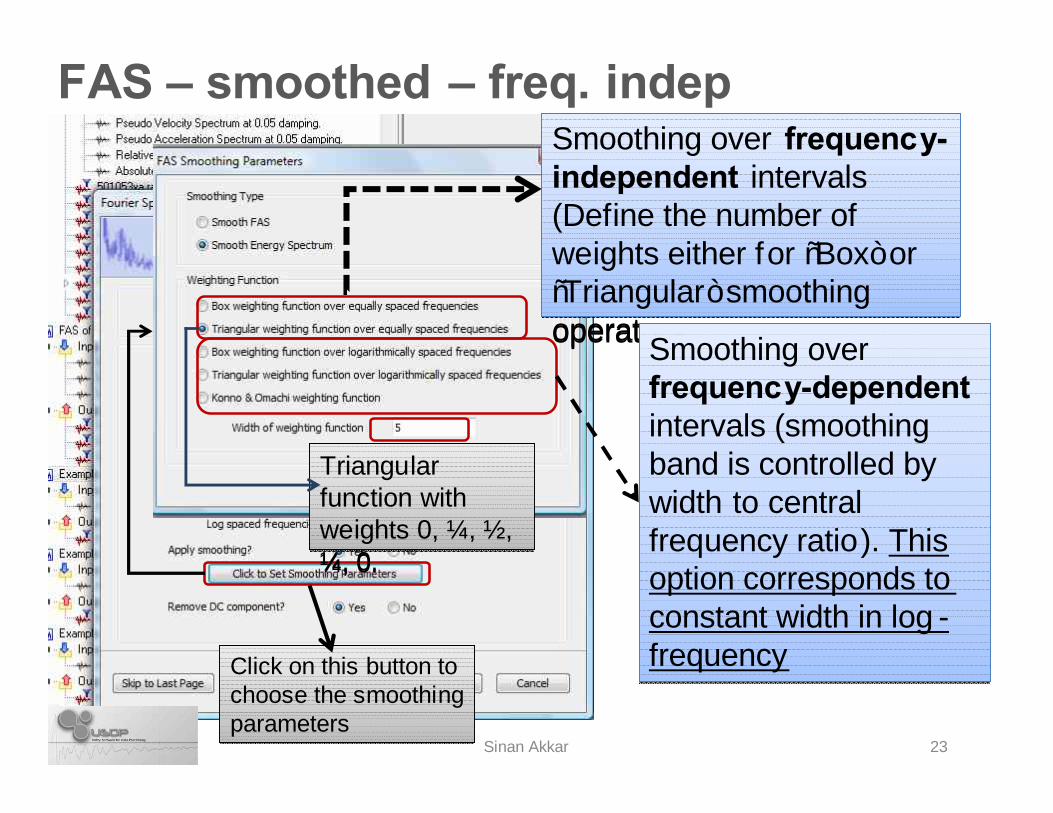
FAS – smoothed – freq. indep
Sinan Akkar 23
Click on this button to choose the smoothing parameters
Click on this button to choose the smoothing parameters
Smoothing over frequency-independent intervals (Define the number of weights either for “Box” or “Triangular” smoothing operators.
Smoothing over frequency-independent intervals (Define the number of weights either for “Box” or “Triangular” smoothing operators.
Smoothing over frequency-dependentintervals (smoothing band is controlled by width to central frequency ratio). This option corresponds to constant width in log -frequency
Smoothing over frequency-dependentintervals (smoothing band is controlled by width to central frequency ratio). This option corresponds to constant width in log -frequency
Triangular function with weights 0, ¼, ½, ¼, 0.
Triangular function with weights 0, ¼, ½, ¼, 0.

FAS – smoothed – freq. dep
Sinan Akkar 24
Same exercise but this time with log -spaced triangular smoothing operator.
Same exercise but this time with log -spaced triangular smoothing operator.

Comparison between different smoothing options
Sinan Akkar 25
Freq. indep smoothing
Freq. indep smoothing
Freq. dep smoothing
Freq. dep smoothing
Sinan Akkar 26
Nonlinear SpectrumNonlinear Spectrum(Constant ducti lity, strength and base(Constant ducti lity, strength and base --
shear coefficient) shear coefficient)

Data Input and Running Nonlinear Spectra
Sinan Akkar 27
Data input is similar to the previously shown processing and FAS wizards.
Data input is similar to the previously shown processing and FAS wizards.
The options either for running spectral analysis or performing response history analysis of a particular oscillator are given in this window.
The options either for running spectral analysis or performing response history analysis of a particular oscillator are given in this window.
In this example, nonlinear spectral analysis are conducted for a period interval of 0.05s - 3.0s. There are linearly-spaced 31 discrete period values.
In this example, nonlinear spectral analysis are conducted for a period interval of 0.05s - 3.0s. There are linearly-spaced 31 discrete period values.

Hysteretic models and rele vant input
Sinan Akkar 28
There are 10 hysteretic models ranging from elastoplastic to Takeda stiffness and strength degrading.
There are 10 hysteretic models ranging from elastoplastic to Takeda stiffness and strength degrading.
Some of these models require additional input parameters
Some of these models require additional input parameters

Constant-strength spectra for an elastoplastic system
Sinan Akkar 29
Click “Next” to finish the runClick “Next” to finish the run
Necessary parameters to define EPP behavior with R = 1,…,6
Necessary parameters to define EPP behavior with R = 1,…,6

Illustration of Results
Sinan Akkar 30
Inelastic to elastic spectral displacement ratios for a set of R values
Inelastic to elastic spectral displacement ratios for a set of R values
Spectral dispalcements for a set of R values
Spectral dispalcements for a set of R values

Conclusions
Sinan Akkar 31
o USDP is a user-friendly data processing and spectral analysis sof tware. The software makes use of a set of executable codes of D.M Boore, Ö. Kale and S. Akkar and combines them under a powerful graphical interf ace.
o A given ground motion can be analyzed for different processing options in a rapid manner. T his can be advantageous for research.
o This is also the case for elastic and inelastic spectral analysis.
o A built-in help menu can show the effective use of this software to the users. A handbook is also in preperation that discusses processing techniques as well as spectral calculations.