Embed Size (px)
Citation preview
Intell Ind Syst (2016) 2:253–267DOI 10.1007/s40903-016-0057-6
ORIGINAL PAPER
An Intelligent Approach to Predict Vibration Rate in a Real GasTurbine
Amin Zadeh Shirazi1,3 · Majid Hatami2 · Mehdi Yaghoobi3 ·Seyyed Javad Seyyed Mahdavi Chabok3
Received: 7 July 2016 / Revised: 26 August 2016 / Accepted: 29 August 2016 / Published online: 20 September 2016© Springer Science+Business Media Singapore 2016
Abstract Bearings vibration in gas turbines is considered asan injurious event, which results in incidents such as emer-gency shutdown or damages in turbine blades and imposesexpensive costs to the system. Thus, measuring and analyz-ing of vibration rate in gas turbines is very important andknowing about its operational conditions and prediction ofthis phenomenon can help a lot in reducing vibration, avoid-ing damage to the blades and eventually financial savings. Inthis paper, we are modelling the vibration rate of a real dou-ble shaft 25MW gas turbine, located in Iran, by making useof a hybrid intelligent model based onmulti-layer perceptronneural network and cuckoo optimization algorithm; so, themodel in this paper is abbreviated asMLP-COA. It should benoted that this work is an absolutely novel work and the ideais implemented in a real turbine for first time. We have useda real dataset with 161 samples which are collected during ayear from a gas turbine in a gas pressure booster station. Fur-thermore, to obtain the effect of each input parameter on thevibration rate, we have applied sensitivity analysis using the
B Amin Zadeh [email protected]; [email protected]
Majid [email protected]
Mehdi [email protected]
Seyyed Javad Seyyed Mahdavi [email protected]
1 Department of Information & Communication Technology(ICT), Khorasan Razavi Gas Company, National Iranian GasCompany (NIGC), Mashhad, Iran
2 Department of Electrical and Computer Engineering,Artificial Intelligence Group, Tabriz University, Tabriz, Iran
3 Department of Artificial Intelligence, Islamic AzadUniversity, Mashhad Branch, Mashhad, Iran
cosine amplitude technique. Evaluation of predicted vibra-tion rates was performed and prove satisfactory efficiency ofthis model than other predictive models such as radial basisfunction and multi-layer perceptron. The model can also beused for prediction of online vibration rate without any con-straint in selection of data points in training phase.
Keywords Industrial intelligence · Gas turbine ·Neural networks · Cuckoo optimization algorithm ·Intelligent system · Prediction · Vibration rate
1 Introduction
Nowadays, it is very often to use gas and steam turbines indifferent branches of industry and jetmotors to generate elec-tricity or load booster. One of the most important threats tosuch an equipment is vibration which results huge financialloses. Damage of turbine blades and emergency shutdown(ESD) of the unit are another of the most serious resultsof such a phenomenon. In general, turbines are designedto work in a static and risk-free place. Many researchersbelieve turbine vibrations should be continuously monitoredto make sure they are working correctly; consequently, aproper method should be chosen based on different damages.Basically, there are four levels of observing and monitoringturbine vibration. At the first level, measuring is done man-ually in the case it is needed (old turbines). At the secondlevel, vibration is continuously observed using the installedsensors on the related places. At this level, when the con-trol room operators observe emergency state, they shouldtrip the unit if it is needed. The third level is similar to thesecond level, while a module is automatically trips the unit.Finally, in the fourth level by collecting various data, predict-ing and analyzing turbine vibration spectrum, the unit will
123
254 Intell Ind Syst (2016) 2:253–267
tripwhenever it is needed.Gas turbines are considered as sen-sitive and spare-less equipment. This important equipmentshould be equipped with at least the second level monitor-ing system. Recently, some accelerometers are proposed byproducers of vibration transducers with 4–20mA current asoutput which is useful for control system. These transducerscould be installed on bearings with their output connectedto the distributed control system (DCS) so that the vibra-tion could be shown permanently. Among these methods,employing vibration analysis is known as a reliable method,in which the vibration sensors output are received by expertsin the control room at a far place from powerhouse. Expertsanalyze these data to measure turbine blades damage andestimate their lifetime.
Generally, the main factors of vibration in turbines areconsists of mass unbalancing, non-coaxially, over-loosenessof bearing, unstable operation environment and variableinside turbine. To recognize the reason of a turbine vibra-tion, forth level of vibration analysis is needed. Powerhousesand stations personnel could prevent inopportune failureof turbine by monitoring turbine vibration continuously. Inaddition, vibration prediction could be a good guidance andappropriate troubleshooter to recognize, control or removevibration reason, before serious problems happen.
Usually, the vibration is caused by very fast spiral move-ment of rotor which continue from several seconds to severalminutes, resulting severe damages such as shaft fracture andturbine blades cracking [1]. Based on researches that aredone, 42% of gas turbine damages is caused by the dam-age of turbine blades, which among all vibration-induceddamage modes has the maximum damage rate [2]. Since tur-bine blades work in an unstable operating conditions withinthe enclosure of the turbine such as heterogeneous distrib-ution of pressure, different conditions of bearings oil leveland their vibrations, knowing about operational conditionsand predicting unseen conditions can help a lot in reduc-ing vibration, avoiding damage to the blades and eventuallyfinancial savings. In general, lifetime of a turbine and itsequipment depends on forces applied to it such as centrifugaland dynamic forces [3]. It should be noted that the results ofvibration analysis are used tomakeCampbell diagram,whichdepicts natural frequency of turbine blades that are derivedfrom rotor speed (RPM) [4].Analysis of vibration and naturalfrequency of blades along with analyzing their derived stressis done in a laboratory mode using a finite element softwarecalled analysis system (ANSYS) [5–8]. Researchers in recentresearches on modelling gas and steam turbines blades life-time use statistical and analytical methods [9–16]. As statedin [17] practical parameters such as vibration rate of gas tur-bine, bearings temperature, oil level, etc. are used to predictgas turbine damages, and using data mining techniques suchas preprocessing data, sampling, feature selection and dimen-sion reduction is very common to predict power and speed
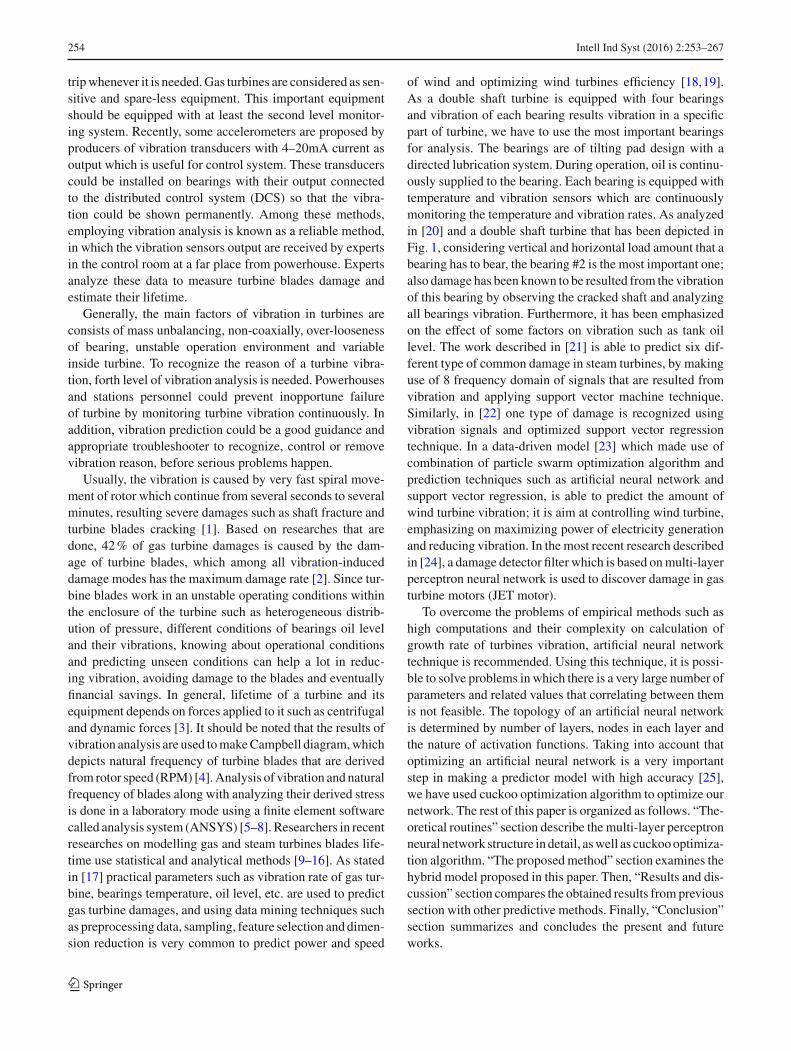
of wind and optimizing wind turbines efficiency [18,19].As a double shaft turbine is equipped with four bearingsand vibration of each bearing results vibration in a specificpart of turbine, we have to use the most important bearingsfor analysis. The bearings are of tilting pad design with adirected lubrication system. During operation, oil is continu-ously supplied to the bearing. Each bearing is equipped withtemperature and vibration sensors which are continuouslymonitoring the temperature and vibration rates. As analyzedin [20] and a double shaft turbine that has been depicted inFig. 1, considering vertical and horizontal load amount that abearing has to bear, the bearing #2 is the most important one;also damage has been known to be resulted from the vibrationof this bearing by observing the cracked shaft and analyzingall bearings vibration. Furthermore, it has been emphasizedon the effect of some factors on vibration such as tank oillevel. The work described in [21] is able to predict six dif-ferent type of common damage in steam turbines, by makinguse of 8 frequency domain of signals that are resulted fromvibration and applying support vector machine technique.Similarly, in [22] one type of damage is recognized usingvibration signals and optimized support vector regressiontechnique. In a data-driven model [23] which made use ofcombination of particle swarm optimization algorithm andprediction techniques such as artificial neural network andsupport vector regression, is able to predict the amount ofwind turbine vibration; it is aim at controlling wind turbine,emphasizing on maximizing power of electricity generationand reducing vibration. In the most recent research describedin [24], a damage detector filter which is based onmulti-layerperceptron neural network is used to discover damage in gasturbine motors (JET motor).
To overcome the problems of empirical methods such ashigh computations and their complexity on calculation ofgrowth rate of turbines vibration, artificial neural networktechnique is recommended. Using this technique, it is possi-ble to solve problems in which there is a very large number ofparameters and related values that correlating between themis not feasible. The topology of an artificial neural networkis determined by number of layers, nodes in each layer andthe nature of activation functions. Taking into account thatoptimizing an artificial neural network is a very importantstep in making a predictor model with high accuracy [25],we have used cuckoo optimization algorithm to optimize ournetwork. The rest of this paper is organized as follows. “The-oretical routines” section describe the multi-layer perceptronneural network structure in detail, aswell as cuckoooptimiza-tion algorithm. “The proposedmethod” section examines thehybrid model proposed in this paper. Then, “Results and dis-cussion” section compares the obtained results fromprevioussection with other predictive methods. Finally, “Conclusion”section summarizes and concludes the present and futureworks.
123
Intell Ind Syst (2016) 2:253–267 255
Fig. 1 A real double shaft25MW gas turbine along withits equipments (Iran—Gasbooster station)
2 Theoretical Routines
2.1 Artificial Neural Networks
ANNis used as an efficient tool to simulate the human’s brain.Nowadays, it has a wide range of applications in science,engineering [26,27]. Also, it has been used widely in gasand oil industries [28,29].
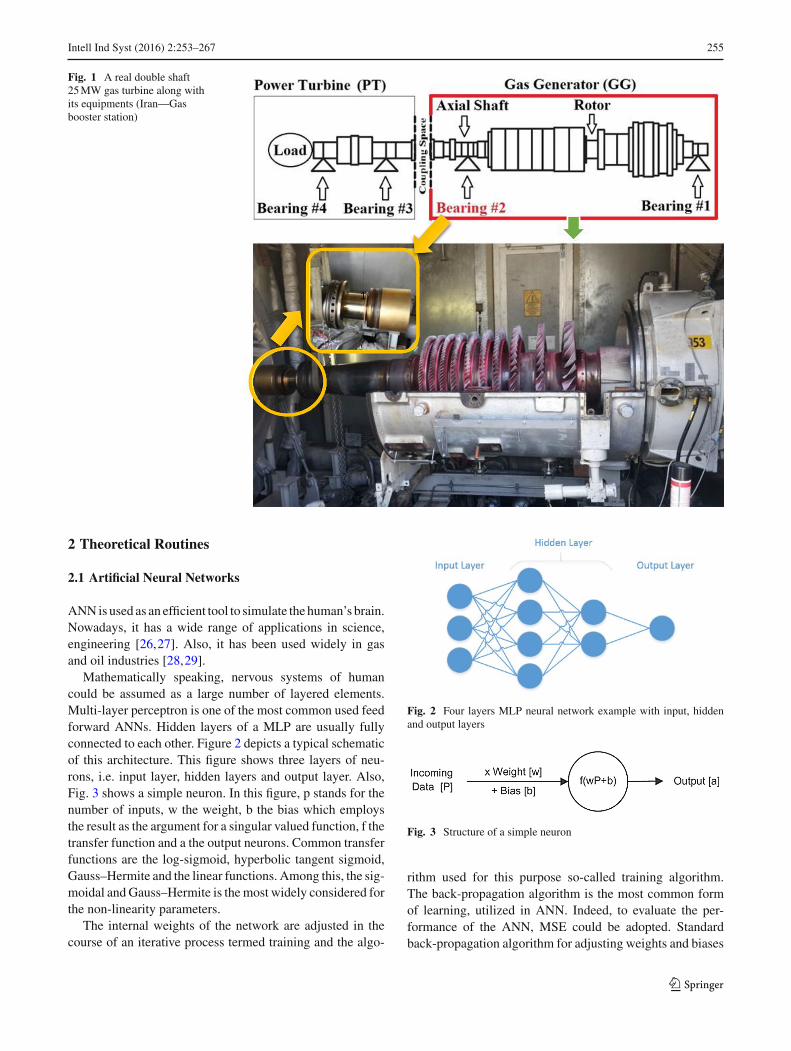
Mathematically speaking, nervous systems of humancould be assumed as a large number of layered elements.Multi-layer perceptron is one of the most common used feedforward ANNs. Hidden layers of a MLP are usually fullyconnected to each other. Figure 2 depicts a typical schematicof this architecture. This figure shows three layers of neu-rons, i.e. input layer, hidden layers and output layer. Also,Fig. 3 shows a simple neuron. In this figure, p stands for thenumber of inputs, w the weight, b the bias which employsthe result as the argument for a singular valued function, f thetransfer function and a the output neurons. Common transferfunctions are the log-sigmoid, hyperbolic tangent sigmoid,Gauss–Hermite and the linear functions. Among this, the sig-moidal andGauss–Hermite is themost widely considered forthe non-linearity parameters.
The internal weights of the network are adjusted in thecourse of an iterative process termed training and the algo-
Fig. 2 Four layers MLP neural network example with input, hiddenand output layers
Fig. 3 Structure of a simple neuron
rithm used for this purpose so-called training algorithm.The back-propagation algorithm is the most common formof learning, utilized in ANN. Indeed, to evaluate the per-formance of the ANN, MSE could be adopted. Standardback-propagation algorithm for adjusting weights and biases
123
256 Intell Ind Syst (2016) 2:253–267
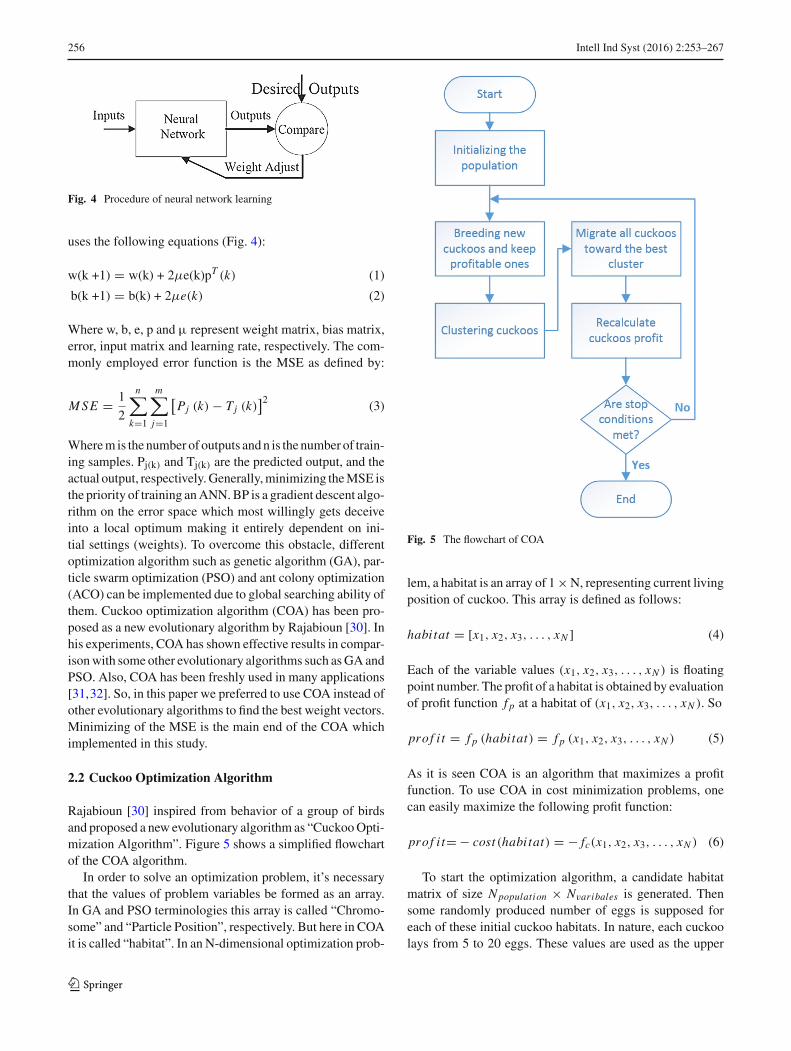
Fig. 4 Procedure of neural network learning
uses the following equations (Fig. 4):
w(k +1) = w(k) + 2μe(k)pT (k) (1)
b(k +1) = b(k) + 2μe(k) (2)
Where w, b, e, p and µ represent weight matrix, bias matrix,error, input matrix and learning rate, respectively. The com-monly employed error function is the MSE as defined by:
MSE = 1
2
n∑
k=1
m∑
j=1
[Pj (k) − Tj (k)
]2 (3)
Wherem is the number of outputs andn is the number of train-ing samples. Pj(k) and Tj(k) are the predicted output, and theactual output, respectively.Generally,minimizing theMSE isthe priority of training anANN.BP is a gradient descent algo-rithm on the error space which most willingly gets deceiveinto a local optimum making it entirely dependent on ini-tial settings (weights). To overcome this obstacle, differentoptimization algorithm such as genetic algorithm (GA), par-ticle swarm optimization (PSO) and ant colony optimization(ACO) can be implemented due to global searching ability ofthem. Cuckoo optimization algorithm (COA) has been pro-posed as a new evolutionary algorithm by Rajabioun [30]. Inhis experiments, COA has shown effective results in compar-isonwith some other evolutionary algorithms such asGAandPSO. Also, COA has been freshly used in many applications[31,32]. So, in this paper we preferred to use COA instead ofother evolutionary algorithms to find the best weight vectors.Minimizing of the MSE is the main end of the COA whichimplemented in this study.
2.2 Cuckoo Optimization Algorithm
Rajabioun [30] inspired from behavior of a group of birdsand proposed a new evolutionary algorithm as “CuckooOpti-mization Algorithm”. Figure 5 shows a simplified flowchartof the COA algorithm.
In order to solve an optimization problem, it’s necessarythat the values of problem variables be formed as an array.In GA and PSO terminologies this array is called “Chromo-some” and “Particle Position”, respectively. But here in COAit is called “habitat”. In an N-dimensional optimization prob-
Fig. 5 The flowchart of COA
lem, a habitat is an array of 1×N, representing current livingposition of cuckoo. This array is defined as follows:
habitat = [x1, x2, x3, . . . , xN ] (4)
Each of the variable values (x1, x2, x3, . . . , xN ) is floatingpoint number. The profit of a habitat is obtained by evaluationof profit function f p at a habitat of (x1, x2, x3, . . . , xN ). So
prof i t = f p (habitat) = f p (x1, x2, x3, . . . , xN ) (5)
As it is seen COA is an algorithm that maximizes a profitfunction. To use COA in cost minimization problems, onecan easily maximize the following profit function:
prof i t= − cost (habitat) = − fc(x1, x2, x3, . . . , xN ) (6)
To start the optimization algorithm, a candidate habitatmatrix of size Npopulation × Nvaribales is generated. Thensome randomly produced number of eggs is supposed foreach of these initial cuckoo habitats. In nature, each cuckoolays from 5 to 20 eggs. These values are used as the upper
123
Intell Ind Syst (2016) 2:253–267 257
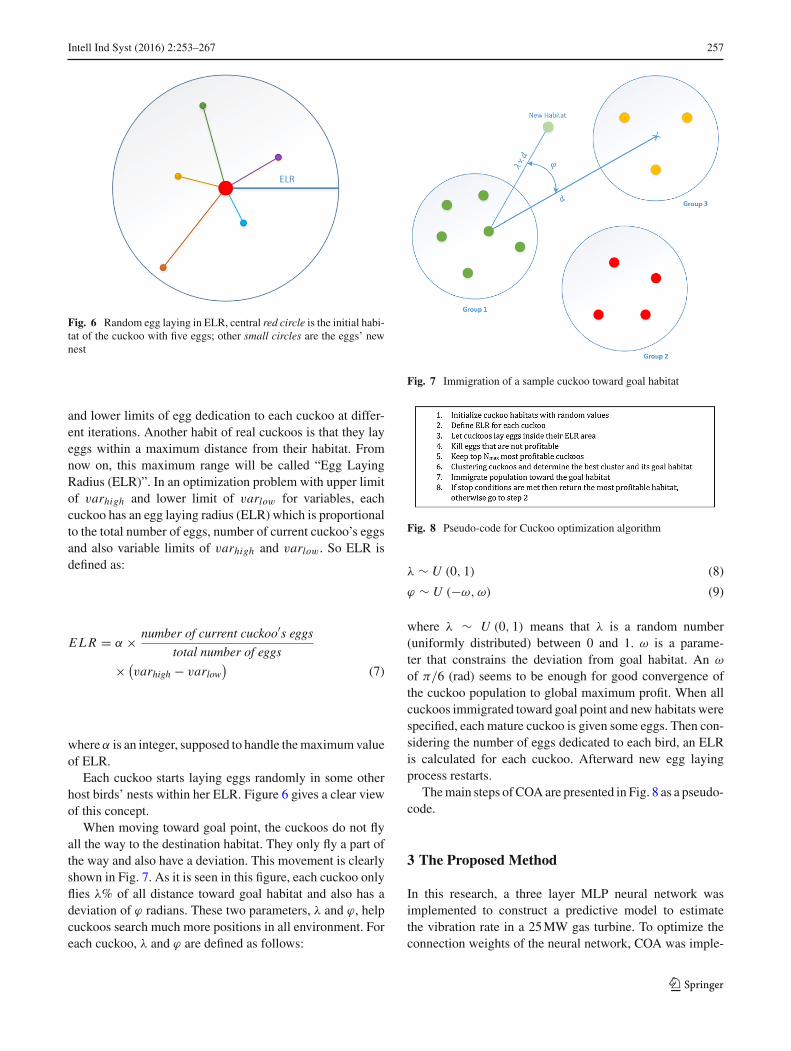
Fig. 6 Random egg laying in ELR, central red circle is the initial habi-tat of the cuckoo with five eggs; other small circles are the eggs’ newnest
and lower limits of egg dedication to each cuckoo at differ-ent iterations. Another habit of real cuckoos is that they layeggs within a maximum distance from their habitat. Fromnow on, this maximum range will be called “Egg LayingRadius (ELR)”. In an optimization problem with upper limitof varhigh and lower limit of varlow for variables, eachcuckoo has an egg laying radius (ELR) which is proportionalto the total number of eggs, number of current cuckoo’s eggsand also variable limits of varhigh and varlow. So ELR isdefined as:
ELR = α × number of current cuckoo′s eggstotal number of eggs
× (varhigh − varlow
)(7)
whereα is an integer, supposed to handle themaximumvalueof ELR.
Each cuckoo starts laying eggs randomly in some otherhost birds’ nests within her ELR. Figure 6 gives a clear viewof this concept.
When moving toward goal point, the cuckoos do not flyall the way to the destination habitat. They only fly a part ofthe way and also have a deviation. This movement is clearlyshown in Fig. 7. As it is seen in this figure, each cuckoo onlyflies λ% of all distance toward goal habitat and also has adeviation of ϕ radians. These two parameters, λ and ϕ, helpcuckoos search much more positions in all environment. Foreach cuckoo, λ and ϕ are defined as follows:
Fig. 7 Immigration of a sample cuckoo toward goal habitat
Fig. 8 Pseudo-code for Cuckoo optimization algorithm
λ ∼ U (0, 1) (8)
ϕ ∼ U (−ω,ω) (9)
where λ ∼ U (0, 1) means that λ is a random number(uniformly distributed) between 0 and 1. ω is a parame-ter that constrains the deviation from goal habitat. An ω
of π/6 (rad) seems to be enough for good convergence ofthe cuckoo population to global maximum profit. When allcuckoos immigrated toward goal point and new habitats werespecified, each mature cuckoo is given some eggs. Then con-sidering the number of eggs dedicated to each bird, an ELRis calculated for each cuckoo. Afterward new egg layingprocess restarts.
Themain steps of COAare presented in Fig. 8 as a pseudo-code.
3 The Proposed Method
In this research, a three layer MLP neural network wasimplemented to construct a predictive model to estimatethe vibration rate in a 25MW gas turbine. To optimize theconnection weights of the neural network, COA was imple-
123

258 Intell Ind Syst (2016) 2:253–267
mented. The connection weights of the neural network werechosen as variables of an optimization problem.As discussedearlier, in COA each individual is called “habitat”. Each indi-vidual has a profitability value which is defined as ‘profit’ inCOA. As we want to make more accurate predictions, wehave to find individuals which have less MSE when they areused as weights in the MLP. So, we have used inversed MSEfor our profit function (i.e. the less MSE of our MLP meansthe more profit of that individual which is used as weights inthe MLP).
Our profit function is as follows:
prof i t = MSE =∑n
i=1(pi − ri )
2 /n (10)
Where n is the number of training samples, pi representsour prediction of vibration rate with the ith sample as input,and ri stands for the actual vibration rate. Based on consid-ered profit function, the best ANN architecture was: 5–10–1(5 input parameters, 10 hidden neurons, 1 output neuron).As MLP is a fully connected network, we have 60 connec-tions in our network ((layer1 × layer2) + (layer2 × layer3)= 5×10 + 10×1= 60). Each connection has a weight value,which multiplies the input and transfer it to the next neuron.A habitat is an array of floating point numbers. Thus, we canuse weight vectors directly as our habitats. As we need tofind 60 optimum weights for our MLP, the habitats look likethe following:
w1 ∈ [−2, 2] w2 ∈ [−2, 2] . . . w59 ∈ [−2, 2] w60 ∈ [−2, 2]
It should be mentioned that in this network each weightwas firstly set in the range of [−2, 2] (initial populationis made completely with random values from −2 to 2 forweights). Also, bias value in all stages was considered con-stant value 1. Furthermore, the transfer functions i.e. sigmoidand linear functions were assigned in hidden and output lay-ers, respectively. These functions are shown below:
LogSig (x) = 1/ (1 + EX P (−x)) (11)
Lin (x) = x (12)
Also, as orthogonal basis functions of the feed-forwardneural network, Gauss–Hermite activation functions are con-sidered. The function is shown below [33]:
ψ (x) = [2k� 12 k!]Hk(x)e
−x22 , k = 0, 1, 2, ... (13)
where Hk(x) are the Hermite orthogonal functions.As all evolutionary algorithms,COAhas different parame-
ters which needs to be tuned to work best with our situation.We have set all these parameters as follows.
• Initial Cuckoos count = 20
The population size in the beginning.
• Population size = 30
The population size during each generation.
• Cluster count = 1
Number of clusters that should bemade usingK-Means algo-rithm.
• Cuckoos minimum eggs = 7
Minimum eggs that each cuckoo could lay.
• Cuckoos maximum eggs = 15
Maximum eggs that each cuckoo could lay.
• Migration coefficient = 0.7
The coefficient which is used in migration formula.
• Egg laying radius = 0.8
Maximum distance that all eggs should be laid within.These values are obtained by performing different exper-
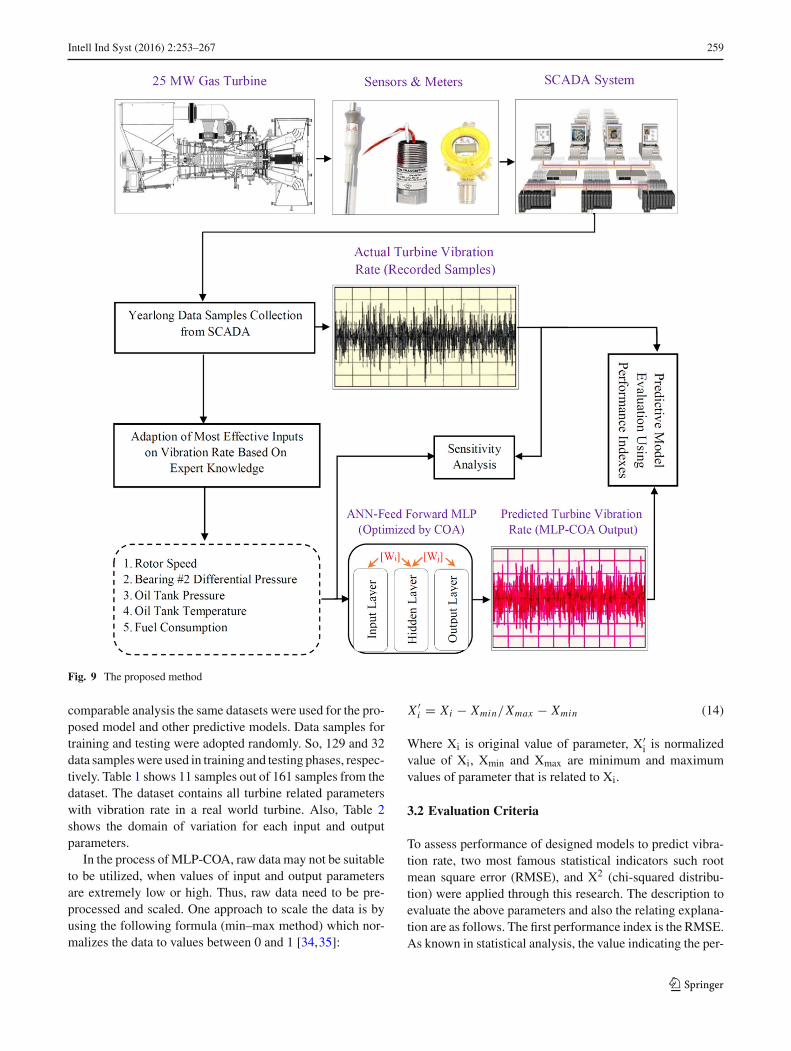
iments, even though COA is almost stable against slightvariation in these parameters. In each generation, we havekept the top 30 suitable individuals as the population of thenext generation. Additionally, the modeling and predictingwere progressed by using the 161 samples. There are dif-ferent parameters which influence vibration on the bearing#2. In this paper, we have chosen the most important onesunder the supervision of experts, such as rotor speed, bearing#2 differential pressure, oil tank temperature, oil tank pres-sure, and fuel consumption inside the turbine enclosure. Theflowchart of proposed method is depicted in Fig. 9.
3.1 Dataset and Data Normalization
In this paper, a total number of 161 data samples were accu-mulated during one year from a 25MW double shaft gasturbine andobtained fromsupervisory control anddata acqui-sition system located in a gas pressure booster station, Iran.Fig. 10 depicts position of all materials that are consideredin this research and have obtained from Supervisory Controland Data Acquisition System (SCADA)-embedded Human-Machine Interface (HMI). Indeed, in order to maintain thestatistical consistency, the dataset was divided into trainingand testing parts. It should be mentioned that to establish a
123
Intell Ind Syst (2016) 2:253–267 259
Fig. 9 The proposed method
comparable analysis the same datasets were used for the pro-posed model and other predictive models. Data samples fortraining and testing were adopted randomly. So, 129 and 32data sampleswere used in training and testing phases, respec-tively. Table 1 shows 11 samples out of 161 samples from thedataset. The dataset contains all turbine related parameterswith vibration rate in a real world turbine. Also, Table 2shows the domain of variation for each input and outputparameters.
In the process of MLP-COA, raw data may not be suitableto be utilized, when values of input and output parametersare extremely low or high. Thus, raw data need to be pre-processed and scaled. One approach to scale the data is byusing the following formula (min–max method) which nor-malizes the data to values between 0 and 1 [34,35]:
X ′i = Xi − Xmin/Xmax − Xmin (14)
Where Xi is original value of parameter, X′i is normalized
value of Xi, Xmin and Xmax are minimum and maximumvalues of parameter that is related to Xi.
3.2 Evaluation Criteria
To assess performance of designed models to predict vibra-tion rate, two most famous statistical indicators such rootmean square error (RMSE), and X2 (chi-squared distribu-tion) were applied through this research. The description toevaluate the above parameters and also the relating explana-tion are as follows. The first performance index is the RMSE.As known in statistical analysis, the value indicating the per-
123

260 Intell Ind Syst (2016) 2:253–267
Fig. 10 Position of allequipments in a real doubleshaft 25MW gas turbine (inputsand output) in HMI system
Table 1 11 data samples out of 161 accumulated during one year, consists of five inputs and an output
No. Rotor speed Fuelconsumption
Bearing #2 Differen-tial pressure (DP)
Oil tanktemperature
Oil tankpressure
Vibration rate
1 8909 29.1 173 60 544 1.5
2 8770 26.8 175 59 544 1.6
3 8888 27.9 191 61 530 2.8
4 8750 28 194 59 531 2.9
5 8794 28 174 59 544 1.7
6 8882 27 175 59 544 1.8
7 8850 28 173 60 544 1.7
8 8922 28.2 204 59 529 3
9 8862 27.2 192 59 530 2.9
10 8836 28.6 191 60 531 2.9
11 8862 25.1 220 60 531 3.2
Table 2 Input and output parameters used for vibration prediction modeling and their ranges
No. Parameters Type Unit Range (min–max)
1 Rotor speed (S) Input Round per minute (.RPM) 0–9770
2 Oil tank temperature (T) Input Centigrade (C) 0–150
3 Oil tank pressure (P) Input Kilo Pascal (kPa) 0–600
4 Bearing #2 differential pressure (D) Input Kilo Pascal (kPa) 0–300
5 Fuel consumption (F) Input Mega Joule per second (MJ/S) 0–70
6 Vibration rate (Rate) Output Millimeter per second (mm/s) 0–11
123

Intell Ind Syst (2016) 2:253–267 261
Fig. 11 Cross-correlation graphs between the predicted and target vibration rate for: a RBFmodel, bMLPmodel, cMLP-COAmodel, dGH-MLPmodel and e LM model (Training & Validating Phase)
123
262 Intell Ind Syst (2016) 2:253–267
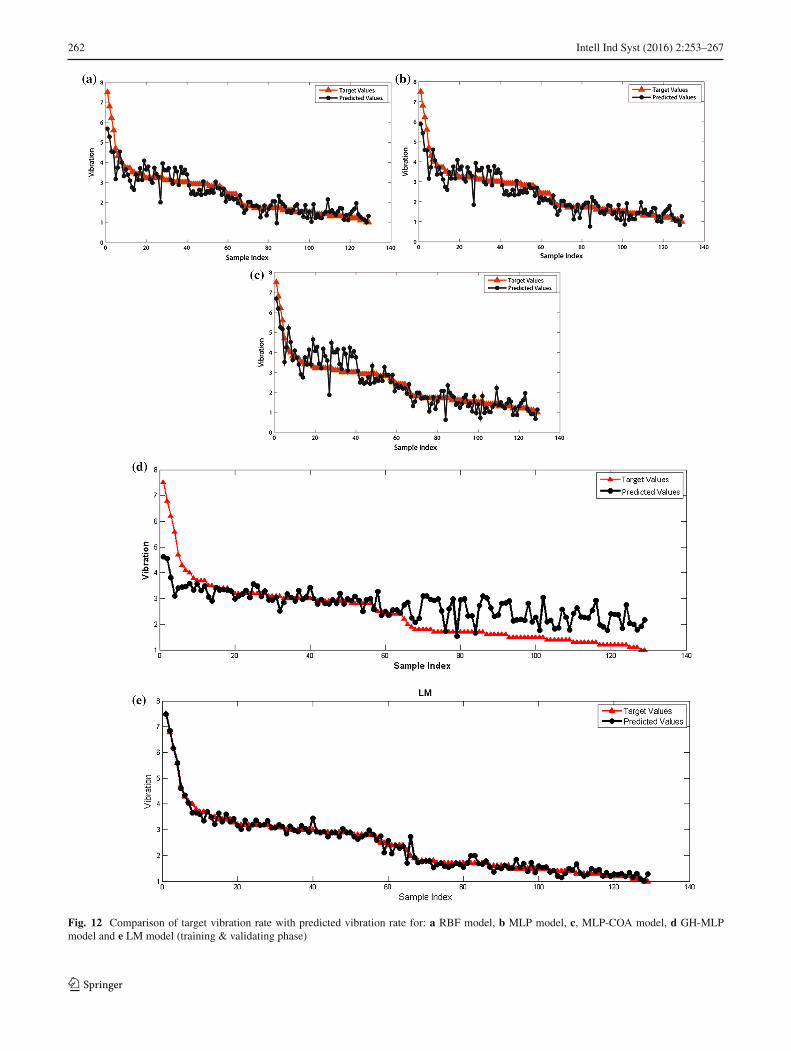
Fig. 12 Comparison of target vibration rate with predicted vibration rate for: a RBF model, b MLP model, c, MLP-COA model, d GH-MLPmodel and e LM model (training & validating phase)
123

Intell Ind Syst (2016) 2:253–267 263
Fig. 13 Cross-correlation graphs between the predicted and actual vibration rate for: a RBFmodel, bMLPmodel, cMLP-COAmodel, dGH-MLPmodel and e LM model (testing phase)
123
264 Intell Ind Syst (2016) 2:253–267
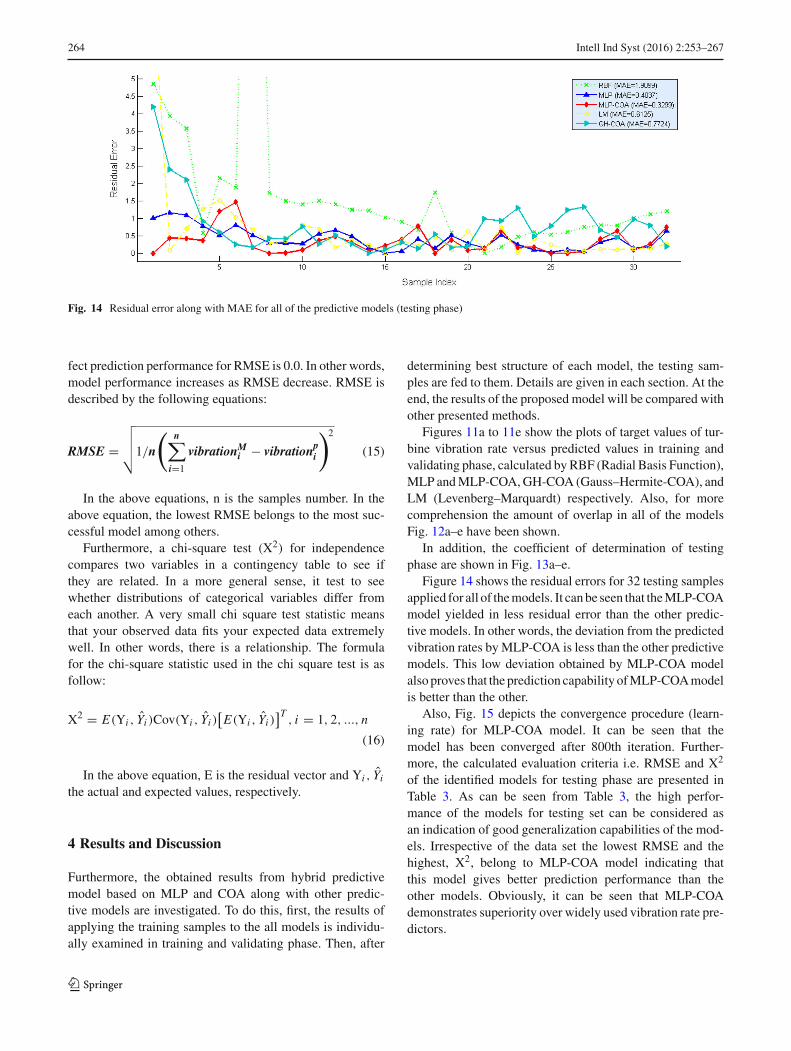
Fig. 14 Residual error along with MAE for all of the predictive models (testing phase)
fect prediction performance for RMSE is 0.0. In other words,model performance increases as RMSE decrease. RMSE isdescribed by the following equations:
RMSE =√√√√1/n
(n∑
i=1
vibrationMi − vibrationpi
)2
(15)
In the above equations, n is the samples number. In theabove equation, the lowest RMSE belongs to the most suc-cessful model among others.
Furthermore, a chi-square test (X2) for independencecompares two variables in a contingency table to see ifthey are related. In a more general sense, it test to seewhether distributions of categorical variables differ fromeach another. A very small chi square test statistic meansthat your observed data fits your expected data extremelywell. In other words, there is a relationship. The formulafor the chi-square statistic used in the chi square test is asfollow:
X2 = E(Yi , Yi )Cov(Yi , Yi )[E(Yi , Yi )
]T, i = 1, 2, ..., n
(16)
In the above equation, E is the residual vector and Yi , Yithe actual and expected values, respectively.
4 Results and Discussion
Furthermore, the obtained results from hybrid predictivemodel based on MLP and COA along with other predic-tive models are investigated. To do this, first, the results ofapplying the training samples to the all models is individu-ally examined in training and validating phase. Then, after
determining best structure of each model, the testing sam-ples are fed to them. Details are given in each section. At theend, the results of the proposed model will be compared withother presented methods.
Figures 11a to 11e show the plots of target values of tur-bine vibration rate versus predicted values in training andvalidating phase, calculated byRBF (Radial Basis Function),MLP andMLP-COA,GH-COA (Gauss–Hermite-COA), andLM (Levenberg–Marquardt) respectively. Also, for morecomprehension the amount of overlap in all of the modelsFig. 12a–e have been shown.
In addition, the coefficient of determination of testingphase are shown in Fig. 13a–e.
Figure 14 shows the residual errors for 32 testing samplesapplied for all of themodels. It canbe seen that theMLP-COAmodel yielded in less residual error than the other predic-tive models. In other words, the deviation from the predictedvibration rates byMLP-COA is less than the other predictivemodels. This low deviation obtained by MLP-COA modelalso proves that the prediction capability ofMLP-COAmodelis better than the other.
Also, Fig. 15 depicts the convergence procedure (learn-ing rate) for MLP-COA model. It can be seen that themodel has been converged after 800th iteration. Further-more, the calculated evaluation criteria i.e. RMSE and X2
of the identified models for testing phase are presented inTable 3. As can be seen from Table 3, the high perfor-mance of the models for testing set can be considered asan indication of good generalization capabilities of the mod-els. Irrespective of the data set the lowest RMSE and thehighest, X2, belong to MLP-COA model indicating thatthis model gives better prediction performance than theother models. Obviously, it can be seen that MLP-COAdemonstrates superiority over widely used vibration rate pre-dictors.
123

Intell Ind Syst (2016) 2:253–267 265
Fig. 15 The convergence diagram for the proposed intelligent model(COA-MLP)
Table 3 Comparison of the obtained values for evaluation criteria intesting phase for all predictive models
Model name
Index RBF MLP MLP-COA LM GH-COA
RMSE 4.067506 0.508225 0.4763252 1.396914 1.126101
X2 3.1893 0.3204 0.2568 0.5248 0.4797
4.1 Sensitivity Analysis Using Cosine AmplitudeMethod (CAM)
There are several methods in order to extract the strengthof relationships between the vibration rate as single outputand the five input parameters. Thus, we applied the CAMas a good technique for evaluating the relations. As can be
seen in Fig. 16, sensitivity analysis was done for all the 5input parameters to understand the relative significance ofeach parameter on vibration rate. To apply this method, byconsidering n data samples in the dataset, we specify an arraynamely X:
X = {x1, x2, ..., xi , ..., xn} (17)
Which each data sample have m dimension as follows:
xi = {xi1, xi2, xi3, ..., xim} (18)
So that each dimension of xi j have a strength of rela-tionship with another dimension of x jk . Consequently, thestrength of the relation between the dimension of xi j anddimension of x jk is given by the following equation:
Si j =[
n∑
k=1
xi j,n × x jk,n
]/
√√√√n∑
k=1
(xi j,n)2 ×n∑
k=1
(x jk,n)2
(19)
In this paper, n data samples and dimension numbers are161 and 6 respectively. Figure 16 shows that vibration rate ismainly influenced by bearing #2 DP, fuel consumption, androtor speed whereas, oil temperature and oil pressure are theleast effective parameter in this regard.
5 Conclusion
It is obvious to use gas turbines in gas pressure booster sta-tions in order tomeet the requirements of compressors. In the
Fig. 16 Sensitivity analysis ofvibration rate
123

266 Intell Ind Syst (2016) 2:253–267
meantime, as the cost of purchasing and maintaining such anequipment are very high, it is very important to keep themfar from any damage. The most significant risks that threatenmentioned equipment and as a result the overall pressurebooster system are incident of internal vibrations of gas tur-bines, because the failure of a turbine, results in disruptingthe compressor and all its associated equipment and undergo-ing huge cost to the whole system. Vibrations up to a certainthreshold could be ignored, but in the case of resonance vibra-tions we will face unpleasant and even irreparable events.
In this paper, the most important motivations to establishof a precise predictor model and a correct analysis of a gasturbine vibration consists of:
1. Online usage of prediction model to increase the systemreliability (comparing with the output of installed vibra-tion sensors or using as an alternative equipment in caseof sensors failure.)
2. Informing the operator of control room about the effectof parameters on the vibration by varying their operationrange (discovering the main factor of vibration among alleffective factors and controlling it).
3. Calculating lifetime of blades in an unpredicted condi-tions by analyzing their vibration frequency (using thepredictive model).
4. To prevent turbine blades from damage and erosion,so that their lifetime could be increased (increasing theworking performance of the turbine).
5. To prevent from turbine emergency shutdown (ESD).6. Economizing the time and cost of repairing damages
resulted from vibration (such as blades cracking).7. Using theproposedmodel to predict steam turbines vibra-
tion by considering proper operational parameters.
Also, we applied a hybrid intelligent and practical modelwith a low computational complexity and acceptable preci-sion in order to predict gas turbine vibration using effectiveinput parameters such rotor speed, bearing #2 oil differen-tial pressure, oil tank pressure, oil tank temperature, and fuelconsumption. Four criteria of X2, RMSE, and were adoptedto evaluate the proposed hybrid method and their valueswere obtained as much as 0.25 and 0.47, respectively. Theobtained results were compared with predicted values fromother predictivemethods such RBF,MLP, GH-MLP and LM.Accordingly, the superiority of the proposed method wasproved. Indeed, we applied cosine amplitude technique inorder to determine the effect of each effective parameterson the vibration (sensitivity analysis). Based on this analy-sis importance of each parameter obtained and among all ofthe inputs was specified that the bearing #2 DP is influenc-ing factor on vibration rate. It should be noted that to makethis model, we have considered input parameters in an idealenvironment and free of any excess solidmaterial in the inner
space of turbine (isolate environment). Also it is assumed thatthe turbine blades are free from any kind of damage.
Compliance with Ethical Standards
Funding This study is a completely autonomous research and has notbeen funded by any company.
Conflict of Interest Amin Zadeh Shirazi (Author A) declares that hehas no conflict of interest. Majid Hatami (Author B) declares that hehas no conflict of interest. Mehdi Yaghoobi (Author C) declares thathe has no conflict of interest. Seyyed Javad Seyyed Mahdavi Chabok(Author D) declares that he has no conflict of interest.
Ethical Approval This article does not contain any studies with humanparticipants or animals performed by any of the authors.
Informed Consent Informed consent was obtained from all individualparticipants included in the study.
References
1. Dorfman L.S., Trubelja, M.: Torsional monitoring of turbine-generators for incipient failure detection. In: Sixth EPRI SteamTurbine Generator Workshop, Citeseer, St. Louis, MO, pp. 17–20,August (1999)
2. Meher-Homji, C.B.: Blading vibration and failures in gas turbines:Part A—Blading dynamics and the operating environment. In:ASME 1995 International Gas Turbine and Aeroengine Congressand Exposition, pp. V004T011A014–V004T011A014. AmericanSociety of Mechanical Engineers (1995)
3. Trumpler Jr., W., Owens, H.: Turbine-blade vibration and strength.Trans. Am. Soc. Mech. Eng. 77, 337–341 (1955)
4. Logan Jr., E.: Handbook of Turbomachinery. CRC Press,Boca.Raton (2003)
5. Garcia, J.: Determination of induced forces by steam flow in tur-bines. Doctoral thesis. CIICAp, Cuernavaca, Morelos (2008)
6. Kubiak, J.: Diagnostic of fracture of the blade of the steam turbine.Internal report of EM-CIICAp,(2002)
7. Kubiak, J., Rodríguez, J., Segura, J., García, J.: The effect of cracksin the steam turbineL-0 blades on their natural frequencies and theirremaining life. In: Proceedings of the International Conference onElectric Power, Rosemont (2007)
8. Rodríguez, J.: Experimentation and simulation of fracture in bladesof the last stage in steam turbines. Doctoral thesis. CIICAp, Cuer-navaca, Morelos (2009)
9. Abad, A., Hahn, M., Es-Said, O.: Corrosion of 15-5PH H1025stainless steel due to environmental conditions. Eng. Fail. Anal.17(1), 208–212 (2010)
10. Azevedo, C., Sinátora, A.: Erosion-fatigue of steam turbine blades.Eng. Fail. Anal. 16(7), 2290–2303 (2009)
11. Sz, J.K., Segura, J., García, J., Rodriguez, J.: Failure analysis of the350 MW steam turbine blade root. Eng. Fail. Anal. 16(4), 1270–1281 (2009)
12. Kubiak, J., Urquiza, G., Rodriguez, J., González, G., Rosales, I.,Castillo, G., Nebradt, J.: Failure analysis of the 150MWgas turbineblades. Eng. Fail. Anal. 16(6), 1794–1804 (2009)
13. Otegui, J., Kunert, H., Booman, J., Barcia, P., Guidi, G.: Two com-peting crack growthmechanisms in very high pressures tubes. Eng.Fail. Anal. 18(2), 564–571 (2011)
123
Intell Ind Syst (2016) 2:253–267 267
14. Piskoty, G., Zgraggen, M., Weisse, B., Affolter, C., Terrasi, G.:Structural failures of rope-based systems. Eng. Fail. Anal. 16(6),1929–1939 (2009)
15. Molent, L., Barter, S., Main, B.: Life assessment and repair offatigue damaged high strength aluminium alloy structure using apeening rework method. Eng. Fail. Anal. 15(1), 62–82 (2008)
16. Azevedo, C.R.: Failure analysis of a crude oil pipeline. Eng. Fail.Anal. 14(6), 978–994 (2007)
17. Kusiak, A., Li, W.: The prediction and diagnosis of wind turbinefaults. Renew. Energy 36(1), 16–23 (2011)
18. Kusiak, A., Zheng, H., Song, Z.: Short-term prediction of windfarm power: a data mining approach. IEEE Trans. Energy Convers.24(1), 125–136 (2009)
19. Kusiak, A., Li, W., Song, Z.: Dynamic control of wind turbines.Renew. Energy 35(2), 456–463 (2010)
20. Pennacchi, P.,Vania,A.:Diagnostics of a crack in a load coupling ofa gas turbine using the machine model and the analysis of the shaftvibrations. Mech. Syst. Signal Process. 22(5), 1157–1178 (2008)
21. Sun, H.-C., Huang, Y.-C.: Support vector machine for vibrationfault classification of steam turbine-generator sets. Proc. Eng. 24,38–42 (2011)
22. Zhang, C., Liu, L.: Prediction of turbine vibration trend based onsmooth Support Vector Regression. In: 2010 Sixth InternationalConference on Natural Computation, pp. 3388–3392 (2010)
23. Kusiak, A., Zhang, Z.: Control of wind turbine power and vibrationwith a data-driven approach. Renew. Energy 43, 73–82 (2012)
24. Tayarani-Bathaie, S.S., Vanini, Z.S., Khorasani, K.: Dynamicneural network-based fault diagnosis of gas turbine engines. Neu-rocomputing 125, 153–165 (2014)
25. Hamzaoui, Y.E., Hernández, J., Silva-Martínez, S., Bassam, A.,Álvarez, A., Lizama-Bahena, C.: Optimal performance of CODremoval during aqueous treatment of alazine and gesaprim com-mercial herbicides by direct and inverse neural network. Desalina-tion 277(1), 325–337 (2011)
26. Ong, B., Sugiura, K., Zettsu, K.: Dynamically pre-trained deeprecurrent neural networks using environmental monitoring datafor predicting PM2.5. Neural Comput. Appl. 1–14 (2015). doi:10.1007/s00521-015-1955-3
27. Zadeh Shirazi, A., Mohammadi, Z.: A hybrid intelligent modelcombining ANN and imperialist competitive algorithm for pre-diction of corrosion rate in 3C steel under seawater envi-ronment. Neural Comput. Appl. 1–10 (2016). doi:10.1007/s00521-016-2251-6
28. Rodger, J.A.: A fuzzy nearest neighbor neural network statisti-cal model for predicting demand for natural gas and energy costsavings in public buildings. Expert Syst. Appl. 41(4, Part 2), 1813–1829 (2014). doi:10.1016/j.eswa.2013.08.080
29. Ahmadi,M., Shadizadeh, S., Goudarzi, A.: Retracted article: Com-bining artificial neural network and unified particle swarm opti-mization for oil flow rate prediction: case study. Neural Comput.Appl. 23(2), 565–565 (2013). doi:10.1007/s00521-012-0955-9
30. Rajabioun,R.: Cuckoooptimization algorithm.Appl. SoftComput.11(8), 5508–5518 (2011)
31. Yang, X.-S., Deb, S.: Cuckoo search: recent advances and applica-tions. Neural Comput. Appl. 24(1), 169–174 (2014)
32. Zhang, Q., Wang, L., Cheng, J., Pan, R.: Retracted article:Improved cuckoo search algorithm using dimensional entropygain. Neural Comput. Appl. 26(3), 745–745 (2015). doi:10.1007/s00521-014-1756-0
33. Rigatos, G., Siano, P., Zervos, N.: An approach to fault diagno-sis of nonlinear systems using neural networks with invariance toFourier transform. J. Ambient Intell. Human. Comput. 4(6), 621–639 (2013)
34. Shirazi, A.Z., Tofighi, M., Ganjefar, S., Mahdavi, S.J.S.: An opti-mized adaptive-neuro fuzzy inference system (ANFIS) for reliableprediction of entrance length in pipes. Int. J. Enhanc. Res. Sci.Technol. Eng. 3(9), 79–89 (2014)
35. Mohebi, J., Zadeh Shirazi, A., Tabatabaeec, H.: Adaptive-neurofuzzy inference system (ANFIS) model for prediction of blast-induced ground vibration. Sci. Int. 27(3), 2079–2091 (2015)
123