Embed Size (px)
Citation preview

An Inexpensive Method for Evaluating the LocalizationPerformance of a Mobile Robot Navigation System
Harsha Kikkeri and Gershon Parent and Mihai Jalobeanu and Stan BirchfieldMicrosoft Robotics, Redmond, WA 98052
{harshk, gershonp, mihaijal, stanleyb}@microsoft.com
Abstract— We propose a method for evaluating the localiza-tion accuracy of an indoor navigation system in arbitrarily largeenvironments. Instead of using externally mounted sensors, asrequired by most ground-truth systems, our approach involvesmounting only landmarks consisting of distinct patterns printedon inexpensive foam boards. A pose estimation algorithmcomputes the pose of the robot with respect to the land-mark using the image obtained by an on-board camera. Wedemonstrate that such an approach is capable of providingaccurate estimates of a mobile robot’s position and orientationwith respect to the landmarks in arbitrarily-sized environmentsover arbitrarily-long trials. Furthermore, because the approachinvolves minimal outfitting of the environment, we show thatonly a small amount of setup time is needed to apply the methodto a new environment. Experiments involving a state-of-the-artnavigation system demonstrate the ability of the method tofacilitate accurate localization measurements over arbitrarilylong periods of time.
I. INTRODUCTION
Quantifying the performance of a robotic system is im-portant for the purpose of being able to objectively comparedifferent systems, measure the progress of the researchendeavor, and determine whether a system is qualified fora given application. While performance metrics and bench-marks are common in other engineering domains as wellas other branches of robotics (e.g., industrial manipulators),autonomous navigation lacks such established metrics andmethods. Even though there are multiple reasons why quan-tifying the performance of a navigation system is difficult,ranging from theoretical (what exactly should be measured?)to practical (what should the environment look like?), oneremaining barrier is the lack of a simple, inexpensive,and non-intrusive method of accurately and independentlydetermining the actual position of the robot (ground truth).
For such a method to scale to real environments of manytypes and sizes (factory floors, office buildings, warehouses,stores, etc.), the simplicity of the system is key. First, thesetup time required should be at most linear in the size ofthe environment. Second, there should be nothing about thetechnology used by the system that prevents its deploymentin large environments. Furthermore, the system must beinexpensive to allow wide deployment in many environ-ments, including environments of various sizes. Finally, thesystem needs to be non-intrusive to enable deployment inreal environments without disrupting any daily activity takingplace. Being non-intrusive is critical in enabling performancetesting over long periods of time (e.g., days or weeks).
We propose a method for measuring the localizationperformance of a navigation system that satisfies these re-quirements. The approach requires very simple outfitting ofan environment, namely placing foam boards with printedpatterns at specified waypoints on the ceiling along with anupward facing camera on the robot. For practical reasons wefocus on indoor environments and wheeled robots, thoughthe method could be adapted to remove these restrictions.The localization performance is determined by measuringthe accuracy and precision of position and orientation at thesequence of waypoints chosen in a task- and environment-specific manner. Because the system is both inexpensiveand easy to set up, it scales well and is thus applicable toreal indoor environments of virtually any size and any type,as well as to essentially any mobile robot system. Equallyimportant, the limited impact of the foam boards on theindoor environment enables measuring localization accuracyover arbitrarily long running times. Moreover, automaticallydetermining the location of the robot over long periods oftime is critical for measuring other aspects of navigation per-formance, such as speed, safety, and reliability. We describethe procedure for using this method and evaluate its accuracy,as well as validate its use by measuring the performance ofa state-of-the-art navigation system.
II. PREVIOUS WORK
Over the past decade the robotics community has begunto devote more attention to developing means of comparingand benchmarking algorithms. This shift mirrors a trendin computer vision that began with work in face detectionand stereo [8], [9]. For the most part, the focus has beenon validating system components like path planning andtracking, as in the case in [2], where an external camerasystem covering an area of 25 m2 provided ground truthinformation with an accuracy of 3 cm. In the case of SLAM,one of the earliest attempts is the Radish dataset,1 which isan open collection of data shared by researchers all overthe world for the purpose of evaluating and comparingalgorithms. The repository enables qualitative assessment ofSLAM results (e.g., visual aspect of the resulting map), butthe lack of ground-truth information prevents a quantitativeassessment. Similar collections can be found online [10],2,3
1http://radish.sourceforge.net/2http://www.robots.ox.ac.uk/NewCollegeData3http://www.informatik.uni-freiburg.de/˜stachnis/datasets.html

as well as open-source algorithms to aid comparison;4 andsome attempts have been made at defining methods forcomparison [1].
More recently, significant effort has been put towardcreating SLAM benchmark datasets with ground truth in-formation, enabling quantitative evaluation of algorithms.The Rawseeds project [3], [5]5 contains multisensor datasets,along with benchmark problems and solutions; ground truthwas obtained via a set of fixed lasers and cameras throughoutthe environment, all calibrated together. The vision systemachieves an accuracy of 112 mm and -0.8 degrees, whilethe laser system achieves an accuracy of 20 mm and 0.2degrees. The SLAM benchmark at the University of Freiburg[4], [7] proposes to measure the performance of SLAMsystems using “relative relations” between poses, basing allcomputation on the corrected trajectory of the robot withoutregard to a global coordinate system or environment model.The authors validate the benchmark on Radish datasetsaugmented with ground truth generated by manually aligningsensor data. More recently, Sturm et al. [12], [11] present theTechnical University of Munich’s RGB-D SLAM dataset andbenchmark,6 for which ground truth was obtained using amotion capture system with an accuracy of 10 mm and 0.5degrees.
All of these benchmarks rely on pre-recorded data pairedwith ground-truth information. Since data is recorded withparticular equipment in a particular environment, it is dif-ficult to compare solutions that use a different sensor suiteor are optimized for a different environment. Additionally,while existing benchmarks cover the problem of creatingmaps (SLAM), they cannot be used to compare naviga-tion performance. Furthermore, the methods used to gatherground truth are time and cost prohibitive to reproduce inother labs, and they do not scale well to larger environments.These are some of the problems that our method is designedto address.
Another set of efforts revolves around qualitative evalu-ation of indoor navigation systems through contests, suchas RoboCupRescue [6]7 or RoboCupHome [15],8 where thefocus is on achieving a particular task such as finding victimsor successfully navigating to a set of learned locations. Whilethere has been a series of efforts to define benchmarksfor robotics in general and navigation in particular, suchas the EURON Benchmarking Initiative9 and its relatedworkshops,10 the Robot Standards and Reference Architec-tures (RoSta) project,11 and the Performance Metrics forIntelligent Systems (PerMIS) workshop12 organized by theNational Institute of Standards and Technology (NIST), these
4http://openslam.org5http://www.rawseeds.org6http://vision.in.tum.de/data/datasets/rgbd-dataset7http://wiki.robocup.org/wiki/Robot League8http://wiki.robocup.org/wiki/Home League9http://www.euron.org/activities/benchmarks10http://www.robot.uji.es/EURON/en11http://www.robot-standards.eu12http://www.nist.gov/el/isd/ks/permis.cfm
efforts have not yet generated a definitive set of performancemetrics and benchmarks for navigation. Two years agoNIST conducted navigation performance tests at the AlabamaRobot Technology Park (RTP) near Huntsville, Alabama,13
but correspondence with the organizers has revealed thatwhile the project was successful at comparing a number ofsystems qualitatively, no results have been shared with thecommunity yet.
The remotely accessible Teleworkbench [13] has a similaraim as ours, namely to facilitate comparison of mobilerobot algorithms. In that work, small robots navigate asmall 13 m2 space, and robot positions are determined byreading barcodes mounted on the top of the robots usingoverhead cameras. Like the other approaches, this systemdoes not have the ability to scale to large environmentswithout significant investment in infrastructure.
Tong and Barfoot [14] describe a system which involvesplacing large retroreflective markers on walls throughoutan environment. A 360-degree 3D laser is used to detectthe markers, whose positions are determined via a SLAMalgorithm. Like our approach, this retroreflective systemis scalable to large environments and, once set up, canbe used to continuously measure the robot’s location. Thesystem achieves relative accuracy on the order of tens ofmillimeters in position and half a degree in orientation.To our knowledge, this is the only other published workfor benchmarking navigation systems on large scales in aquantitative way. Our approach is arguably simpler to deploy(since it does not require a scanning 3D laser) and is lesslikely to be affected by occlusion, at the expense of notcomputing absolute position throughout the space.
III. APPROACH
A. Overview
Our method requires placing landmarks, namely printedpatterns on foam boards, throughout the environment. Acalibration procedure is performed to determine the tilt ofthe floor underneath each landmark. A separate calibrationprocedure is used to determine the transformation betweenthe coordinate system of the camera (which is mounted onthe robot) and the coordinate system of the robot. After thesesteps, the system is in place and can be used to evaluate theperformance of a robot navigation system automatically andfor indefinite periods of time. We now describe these stepsin more detail.
B. Landmarks
The landmarks are foam boards on which are printed apattern that allows a pose estimation algorithm to determinethe pose of the camera with respect to the landmark. Possiblechoices for patterns include various AR (augmented reality)tags or otherwise unique configurations of monochrome orcolor shapes to facilitate detection and pose estimation. Weuse a custom pattern consisting of a black-and-white checker-board with a grid of 14 squares by 10 squares; the inner 4×4
13https://sites.google.com/site/templearra/Welcome

Fig. 1. The checkerboard pattern used for pose estimation.
area replaced by four circles centered with respect to each ofthe four quadrants of this inner area, as shown in Figure 1.Beyond the radius of each circle are four arcs of varyinglength and spacing, enabling the circles to be distinguishedfrom one another. This pattern is easily detectable, even whena significant portion of the checkerboard is occluded from thefield of view, and it enables the orientation of the pattern tobe determined. The landmarks are oriented horizontally andattached to the ceiling (or otherwise mounted on a stand) sothat they can be viewed by an upward-facing camera.
C. Estimating camera pose
When at least one quadrant of the landmark is visiblein the current field-of-view of the camera, pose estimationsoftware computes the 6 degree-of-freedom pose of thecamera in 3D space. The software that we use [16] returnsthe landmark’s pose in camera-centric coordinates, which wethen convert to find the camera’s pose in landmark-centriccoordinates. We ignore the yaw and pitch angles, since theyare too noisy to be of any use for our application. Althoughthe robot drives on a relatively flat floor, the z value (alongthe optical axis) is needed, because the ceiling height is notguaranteed to be constant throughout an environment. As aresult, we retain the x, y, and z coordinates, along with theroll θ of the camera about its optical axis, which is directlyrelated to the orientation of the robot.
D. Calibration
There are four coordinate systems that are relevant toour problem. The image coordinate system is placed atthe upper-left of the image plane and oriented along theimage axes. The camera coordinate system is centered atthe focal point and oriented in the same direction as theimage coordinate system. The robot coordinate system iscentered with the robot and aligned with the robot drivingdirection. The landmark coordinate system is centered on thelandmark and aligned with the checkerboard. Except for theimage coordinate system, which is measured in pixels, allmeasurements are in millimeters.
Calibrating the image-to-camera transformation involvesestimating the internal camera parameters, which is doneusing the well-known algorithm of Zhang [16]. Calibratingthe camera-to-robot transformation involves estimating 6parameters: the tilt φc of the camera with respect to thefloor normal, the azimuth θc of this camera tilt plane (i.e.,
Fig. 2. Side view of a simplified camera-to-robot calibration process.Considering only the vertical plane shown, the pose estimation softwareyields the pose (x1, z1) of the camera with respect to the landmark. Thenthe robot is rotated 180 degrees, and the software yields the pose (x2, z2).From these measurements, the quantities of interest, namely φc and φf canbe computed. Note that the image plane (not shown) is perpendicular to theoptical axis and is not (in general) parallel to the floor.
the plane containing the gravity vector and the optical axis)with respect to the forward direction of the robot, the tilt φfof the floor (in the immediate vicinity below the landmark)with respect to gravity, the azimuth θf of the floor tilt plane(i.e., the plane containing the gravity vector and the normalvector to the floor) with respect to the positive x axis of thelandmark coordinate system, and the lateral offset of the focalpoint from the robot center, expressed in polar coordinatesas drc and θrc.
To determine these 6 parameters, we place the cameradirectly under the landmark using a self-leveling line laserso that the vertical laser beams (we ignore the horizontalbeams) intersect the center of the image and the center ofthe landmark, as shown in Figure 2. We then rotate the robotby fixed increments, being careful to ensure that the axis ofrotation passes through the focal point (i.e., camera center).The figure shows a side view of the geometry of the systemas the camera is rotated by 180 degrees, sliced by the xz-plane. The pose estimation software measures the (x, y, z)coordinates of the landmark with respect to the camera bothbefore and after the rotation, leading to (x1, y1, z1) and(x2, y2, z2). From the figure, the camera tilt is given byφc = sin−1((x2 − x1)/2z), and the floor tilt is given byφf = sin−1((x1 + (x2− x1)/2)/z) = sin−1((x2 + x1)/2z),where z = (z1 + z2)/2. In the case of zero floor tilt wehave φf = 0, x1 = −x2, and φc = sin−1(x2/z). Noticethat, since the pose estimation software yields the pose ofthe landmark in the camera coordinate system, the angle ofthe landmark does not matter in any case.
When the camera tilt is non-zero, rotating the robotin the manner described causes the optical axis to tracethe shape of a cone about the axis of rotation, which isassumed to be perpendicular to the floor. Therefore, as therobot is rotated, the (x, y) coordinates returned by the pose

Fig. 3. Noisy circles traced by the optical axis underneath two differentlandmarks. The robot was rotated in 15-degree increments, leading to 24data points. The red data point is the one for which the robot was alignedwith the landmark at θ = 0.
Fig. 4. Left: The circle traced by the optical axis yields 4 of the 6 calibrationparameters. Right: The 2 additional parameters capture the robot-to-cameraoffset. (The gray circle is the robot, the black I represents the wheels andaxle, and the blue circle is the camera.)
estimation software trace a circle, two examples of whichare shown in Figure 3.
If we let (xi, yi, zi), i = 1, . . . , n, be the read-ings taken as the robot is rotated, then the center ofthe circle is estimated as the mean of the coordinates:(cx, cy) = 1
n
∑ni=1(xi, yi); the radius of the circle is esti-
mated by the average Euclidean distance to the center: rc =1n
∑ni=1
√(xi − cx)2 + (yi − cy)2; and the distance from
the circle center to the origin is given by rf =√c2x + c2y .
We use n = 4 readings, rotating the robot to each of 0◦, 90◦,180◦, and 270◦ positions. In theory only two readings 180◦
apart are sufficient, but more readings provide additionalrobustness to noise.
Note from Figure 2 that the radius of the circle is alsogiven by rc = (x2 − x1)/2, and the distance from thelandmark center to the circle center is rf = (x2 + x1)/2.Therefore, the camera tilt is given by φc = sin−1(rc/z),the floor tilt is φf = sin−1(rf/z), and the floor azimuthis θf = atan2(cy, cx), where z = 1
n
∑ni=1 zi, as shown in
Figure 4. Assuming that (x1, y1) corresponds to θ = 0 (robotis aligned with the landmark), then the camera azimuth isθc = atan2(y1−cy, x1−cx), and the camera-to-robot offset ismeasured manually on the ground to determine the distancedrc between the robot and camera centers, as well as theangle θrc.
Once the system has been calibrated, the tilt-corrected 2Dcamera pose in the ground plane (that is, corrected for floor
tilt) for a given 3D pose (x, y, z) and θ is given by
θ′ = θ (1)x′ = x− z sinφc cos(θc + θ)− z sinφf cos θf (2)y′ = y − z sinφc︸ ︷︷ ︸
rc
sin(θc + θ)− z sinφf︸ ︷︷ ︸rf
sin θf . (3)
Note that the heading is not affected by tilt. The robot poseis then calculated as a simple pose transformation:
θr = θ′ + θrc (4)xr = x′ + drc cos θrc (5)yr = y′ + drc sin θrc. (6)
E. Measuring performance
After mounting the landmarks, mounting the upward-facing camera to the robot, and calibrating, the system isready to be used to measure the performance of a naviga-tion system automatically and for arbitrary lengths of time.First the robot is driven around the environment to build amap. The nature of the map is completely irrelevant to theproposed evaluation method, thus enabling different typesof approaches to be compared; the robot is free to generatea 2D metric map, 3D metric map, topological map, topo-geometric map, or otherwise, or to operate purely reactively.The robot can be driven manually, or it can autonomouslyexplore. Whenever the robot is under a landmark for thefirst time, the user clicks a button (or something similar) toremember the location. This button press causes the systembeing evaluated to store the location of the robot with respectto the map being constructed. Simultaneously, the buttonpress triggers the pose estimation algorithm to analyze theimage from the upward-facing camera and, with calibration,to determine the robot’s pose with respect to the landmark.Note that this approach completely decouples the internalmap representation of the system being evaluated from theevaluator.
Once the map has been built, the system being evaluatedcontains a set of locations with respect to its internal map,while the evaluator also contains a set of locations with re-spect to the landmarks. Each landmark has an ID, and this IDis the same in both sets of locations to enable correspondenceto be made between the system being evaluated and theevaluator. To evaluate the system, the evaluator generates asequence of waypoints (IDs), and the robot is commanded tovisit these waypoints in sequence. When the robot system de-termines that it has reached the desired location (waypoint),it notifies the evaluator, which then analyzes the image fromthe upward-facing camera to determine the robot’s pose withrespect to the landmark. The discrepancy between the poseof the robot during map-building and the pose of the robotduring evaluation yields an indication of the accuracy of thenavigation system.
IV. EXPERIMENTAL RESULTS
We divide the experimental results into two parts. First weevaluate the accuracy of the pose estimation system, then we

validate the proposed method by measuring the performanceof a state-of-the-art navigation system.14
A. Evaluating accuracy of pose estimation
To evaluate the accuracy of the pose estimation, weattached a 14 × 10 inch checkerboard pattern printed ona 470 × 336 mm foam board to the ceiling of our lab.Each square of the checkerboard was 33.6 × 33.6 mm.The landmark was placed 2200 mm above a CNC machine(Fireball Meteor,15 1320 × 640 × 127 mm) capable of xyztranslation with a precision of 0.0635 mm. To the carriage ofthe CNC machine we attached a Microsoft LifeCam Cinemacamera, facing upward, with a 73 degree field of view,capable of capturing images at a resolution of 1280 × 720.The camera could see the landmark from a distance of 300to 3000 mm; at the distance of 2200 mm the checkerboardoccupied a space of 300×220 pixels in the image and couldbe seen within an area approximately 1500 × 1500 mm onthe ground. To reduce effects due to the low contrast causedby ceiling lights, we turned off the automatic gain controland reduced the exposure level.
The camera was rotated on the CNC until the pose estima-tion software indicated zero degree pan (and independentlyvalidated by making sure that the checkerboard edges wereparallel to the image edge in the captured image). The longedge of the CNC was aligned with the long end of thecheckerboard. To align the CNC axis with the landmark axis,the camera was moved along one direction and the CNC wasrotated until the pose estimation software showed change inonly one direction.
The CNC was calibrated by moving it to the homelocation. The CNC carriage was then moved in the x andy directions until the pose estimation software indicatedthe (x, y, θ) offset to be (0, 0, 0). This was consideredas the origin and the CNC carriage position was noted.Once calibrated, the CNC carriage was moved within the1320× 640 mm area at 5 mm increments. At each positionthe machine was stopped for 1 to 2 seconds to remove anyvibration, then an image was taken by the camera, and thepose estimation software estimated the pose of the camera.Figure 5 shows the results. The average position error was5 mm (σ = 2 mm), and the average orientation error was0.3 degrees (σ = 0.2 degrees). Within the entire area theposition error never exceeded 11 mm, and the orientationerror never exceeded 1 degree. In a followup experiment theCNC carriage was moved within the same area at 40 mmincrements, but at each position 360 images were taken (at 1degree intervals) using a dynamixel MX-64 servo mechanismto rotate the camera. The pose was estimated for each image,and the results were consistent.
From perspective projection, it is easy to see that themaximum error due to pixel quantization is
quantization error =pz
f, (7)
14We use the latest version of Adept MobileRobots’ navigation software:Active ARNL Laser Localization Library 1.7.5 for Windows.
15http://www.probotix.com/FireBall Meteor cnc router
Fig. 5. Euclidean error of the pose estimation algorithm over a 1320 ×640 mm area, obtained via motions generated by a CNC machine.
Fig. 6. Robot with upward-facing camera attached.
where f is the focal length of the camera (4.8 mm), zis the distance to the landmark (2200 mm), and p is thepixel size (5 µm). Given these values, the error due to pixelquantization is approximately 2 mm, which is consistent withthese results.
We then evaluated the accuracy of the system with thecamera mounted on the Adept Pioneer 3DX mobile robotshown in Figure 6. After placing 15 landmarks across 2buildings (described below), we arbitrarily chose one of thelandmarks and placed the robot at 20 random positions /orientations underneath it, as shown in Figure 7a. The actual(rx, ry, rθ) of the robot was measured manually on theground and compared with the values calculated as describedabove. The resulting Euclidean distance and orientation er-rors were computed, shown in Figure 8.
At each of these landmarks the robot was then placedat 5 canonical locations (units are mm): (x, y, θ) =(0, 0, 0◦), (400, 0, 0◦), (0, 400, 90◦), (−400, 0, 180◦), and(0,−400, 270◦), as shown in Figure 7b. The Euclideandistance and orientation errors were calculated at all thelandmarks for these five canonical locations by comparing

Fig. 7. 20 random (left) and 5 canonical (right) positions / orientationsused for evaluating the accuracy of pose estimation.
Fig. 8. Position and orientation error for 20 random positions / orientations.
with manually obtained values. The results are shown inFigure 9. Since the results were similar for both experiments,we only report the combined mean position error, 15.2 mm(σ = 9.1 mm), and mean orientation error, −0.4◦ (σ = 0.8◦).The maximum errors were 52.9 mm and 2.8◦.
Table I compares our landmark-based system with sev-eral existing ground-truth systems.16 Our system yields anaverage of 15 mm position error, with an average angularerror of −0.4◦, over an area approximately 1.5×1.5 m. TheRawseeds GTvision system [5] yields an order of magnitudemore error in position, and about twice as much error inorientation, but over an area nearly two orders of magnitudelarger. The Rawseeds GTlaser system [5], the mocap systemat TUM [11], and the retroreflective SLAM system [14] yield
16Data for Rawseeds, TUM’s mocap system, and the retroreflectivesystem are from [5, §7.3], [11, §VI-C], and [14, §V-A], respectively.
Fig. 9. Position and orientation error for the five canonical positions forBuilding 99 (top) and Building 115 (bottom). Shown are the error bars(blue) for one standard deviation, along with all the data (black circles).
dist. (mm) ang. (deg.) environmentmean s. d. mean s. d. big size (m)
GTvision 112 90 -0.8 2.2 N 10× 14GTlaser 20 11 0.2 1.6 N 10× 14mocap 10∗ − 0.5∗ − N 10× 12
retroreflective 21∗ 14∗ 0.5∗ 0.3∗ Y 7× 5our system 15 9 -0.4 0.8 Y 1.5× 1.5
TABLE ICOMPARISON OF MEAN AND STANDARD DEVIATION ERROR OF OUR
SYSTEM WITH OTHER GROUND-TRUTH SYSTEMS. ONLY OURS AND THE
RETROREFLECTIVE SYSTEM SCALE TO LARGER ENVIRONMENTS. THE
ASTERISKS INDICATE THAT THE RETROREFLECTIVE SYSTEM ONLY
REPORTS ERRORS RELATIVE TO OTHER ROBOT POSITIONS, AND THAT
THE NUMBERS FOR THE MOCAP SYSTEM ARE MAXIMUM (NOT MEAN)ERRORS.
errors that are less than ours, also over much larger areas.It is difficult to compare these results, since the purpose ofthe systems is different: Motion capture and Rawseeds workover a larger area, whereas the accuracy of our system islimited to a fairly narrow field of view. On the other handour method (as well as the retroreflective system) apply overarbitrarily large environments, whereas the other techniquesare generally limited to a single room due to the cost anddifficulty of installation and maintenance.
B. Verifying the methodology using an existing robot navi-gation system
We used an existing robot navigation system to verify theease of deployment, ease of use, and accuracy of the pro-posed method. To verify the ease of deployment, we trackedthe time and expense involved in setting up the system foruse in two environments, Building 115 and Building 99,shown in Figures 10 and 11. Building 115 is approximately55 m by 23 m consisting of mostly uniform hallwayswith 10 foot drywall ceilings. The Building 99 space isapproximately 57 m by 52 m and contains a combinationof open space and hallways with ceilings made of a varietyof materials including drywall, acoustic tile, and decorativewood paneling. We installed seven landmarks in Building 99,and eight landmarks in Building 115. Installation of eachlandmark required about 25 minutes, including surveying theavailable space, affixing the landmark to the ceiling, andperforming the landmark calibration procedure. The robotcamera calibration was calculated at the same time as thelandmarks. We used a professional printing service to createour foam-core landmarks, which were attached with 3MDamage Free Hanging strips, for a total cost of less than$200 USD. In each case the landmark position was chosento provide ample coverage of the building. The landmarks inBuilding 115 were positioned at hallway junctions, while thelandmarks in Building 99 were positioned at points of interestaround the building (see Figure 12). One of the challengesin Building 99 were locations where flooring changed fromcarpet to tile, and where floor vents and floor access panelswere present, since an uneven floor under the landmarkreduces accuracy in position measurement. Such locations

Fig. 10. Map of Building 99. The landmarks were placed at the elevators(1), cafe (2), lounge (3), workshop (4), copy room (5), kitchen (6), andsupply room (7).
could still be used to provide a binary result (i.e., whetherthe robot is under the landmark), but to enable accuratemeasurement we only chose areas with uniform floor levelin the vicinity of the landmark.
To verify the ease of use, Building 115 was used toconduct automated navigation tests over two days duringwhich the robot navigated to a 108-sequence of waypoints(landmarks) in random order. The position measurementsystem operated entirely autonomously and provided detailedposition and orientation error information for the durationof the 8 hours of testing without any manual interventionand could continue to do so as long as the landmarks donot move, and the camera remains calibrated. In fact, theselandmarks have been in continuous use for the past severalmonths in our lab, providing daily metrics information forautonomous robot navigation. One advantage of the systemis that, once deployed, no further maintenance is needed:There are no cables or power cords, and the landmarks donot interfere with occupants’ daily activities.
To verify the accuracy, the Building 99 space was usedto conduct automated navigation tests during which thesame Adept Pioneer 3DX robot was used to map the spaceand record goals at each landmark, then navigate a ran-domly generated 15-waypoint sequence. During mapping,the position and orientation of the robot was recorded bythe landmark system, and at the same time its positionand orientation was marked manually on the floor usingcolored duct tape. After the sequence had been travered,the Euclidean distance between the original mapped positionand each visited position was measured manually, as well asthe difference in orientation. The manual measurement wasconducted very carefully, introducing errors no more than
Fig. 11. Map of Building 115, with the 8 landmarks identified.
a few millimeters. Results are shown in Figure 13, wherethe close agreement between the manually obtained valuesand automatically obtained values is evident. These resultsare consistent with the measurements presented above. Notethat the focus of this paper is not on the performance ofthe navigation system itself, but rather on the ability of ourground truth system to accurately monitor the navigationsystem.
V. CONCLUSION
We have presented a method for evaluating the localiza-tion performance of a mobile robot navigation system. Themethod consists of attaching landmarks, namely foam boardson which checkerboard patterns are printed, to the ceiling atvarious locations around an environment. An upward-facingcamera on the robot, along with pose estimation software, isthen used to estimate the robot’s pose with respect to thelandmark. Contrary to previous approaches, the approachis inexpensive, easy to deploy, very low maintenance, andhighly accurate. The system enables automatic performanceevaluation of arbitrarily sized environments for arbitrarylengths of time. We have performed a thorough evaluation ofthe system, showing that accuracies on the order of 15 mmand 0.4 degrees can be obtained with proper calibration.Future work will be aimed at using such a method to performlong-term comparison of state-of-the-art navigation systemsin a variety of environments.
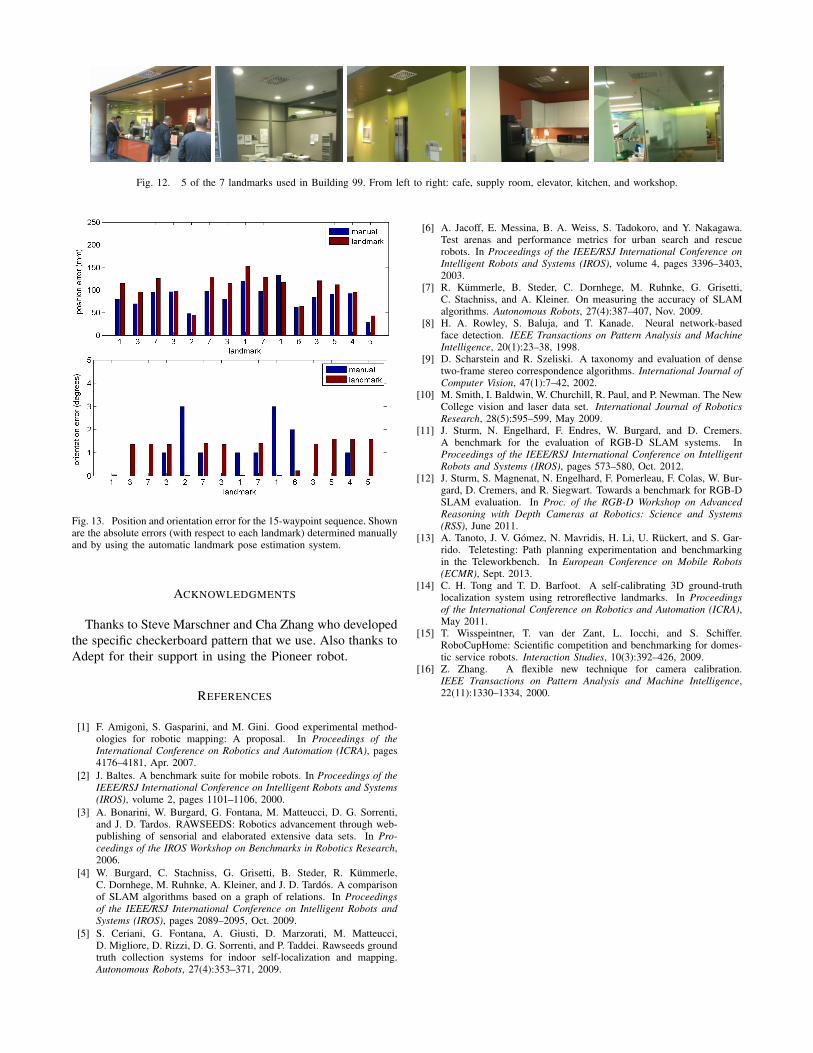
Fig. 12. 5 of the 7 landmarks used in Building 99. From left to right: cafe, supply room, elevator, kitchen, and workshop.
Fig. 13. Position and orientation error for the 15-waypoint sequence. Shownare the absolute errors (with respect to each landmark) determined manuallyand by using the automatic landmark pose estimation system.
ACKNOWLEDGMENTS
Thanks to Steve Marschner and Cha Zhang who developedthe specific checkerboard pattern that we use. Also thanks toAdept for their support in using the Pioneer robot.
REFERENCES
[1] F. Amigoni, S. Gasparini, and M. Gini. Good experimental method-ologies for robotic mapping: A proposal. In Proceedings of theInternational Conference on Robotics and Automation (ICRA), pages4176–4181, Apr. 2007.
[2] J. Baltes. A benchmark suite for mobile robots. In Proceedings of theIEEE/RSJ International Conference on Intelligent Robots and Systems(IROS), volume 2, pages 1101–1106, 2000.
[3] A. Bonarini, W. Burgard, G. Fontana, M. Matteucci, D. G. Sorrenti,and J. D. Tardos. RAWSEEDS: Robotics advancement through web-publishing of sensorial and elaborated extensive data sets. In Pro-ceedings of the IROS Workshop on Benchmarks in Robotics Research,2006.
[4] W. Burgard, C. Stachniss, G. Grisetti, B. Steder, R. Kummerle,C. Dornhege, M. Ruhnke, A. Kleiner, and J. D. Tardos. A comparisonof SLAM algorithms based on a graph of relations. In Proceedingsof the IEEE/RSJ International Conference on Intelligent Robots andSystems (IROS), pages 2089–2095, Oct. 2009.
[5] S. Ceriani, G. Fontana, A. Giusti, D. Marzorati, M. Matteucci,D. Migliore, D. Rizzi, D. G. Sorrenti, and P. Taddei. Rawseeds groundtruth collection systems for indoor self-localization and mapping.Autonomous Robots, 27(4):353–371, 2009.
[6] A. Jacoff, E. Messina, B. A. Weiss, S. Tadokoro, and Y. Nakagawa.Test arenas and performance metrics for urban search and rescuerobots. In Proceedings of the IEEE/RSJ International Conference onIntelligent Robots and Systems (IROS), volume 4, pages 3396–3403,2003.
[7] R. Kummerle, B. Steder, C. Dornhege, M. Ruhnke, G. Grisetti,C. Stachniss, and A. Kleiner. On measuring the accuracy of SLAMalgorithms. Autonomous Robots, 27(4):387–407, Nov. 2009.
[8] H. A. Rowley, S. Baluja, and T. Kanade. Neural network-basedface detection. IEEE Transactions on Pattern Analysis and MachineIntelligence, 20(1):23–38, 1998.
[9] D. Scharstein and R. Szeliski. A taxonomy and evaluation of densetwo-frame stereo correspondence algorithms. International Journal ofComputer Vision, 47(1):7–42, 2002.
[10] M. Smith, I. Baldwin, W. Churchill, R. Paul, and P. Newman. The NewCollege vision and laser data set. International Journal of RoboticsResearch, 28(5):595–599, May 2009.
[11] J. Sturm, N. Engelhard, F. Endres, W. Burgard, and D. Cremers.A benchmark for the evaluation of RGB-D SLAM systems. InProceedings of the IEEE/RSJ International Conference on IntelligentRobots and Systems (IROS), pages 573–580, Oct. 2012.
[12] J. Sturm, S. Magnenat, N. Engelhard, F. Pomerleau, F. Colas, W. Bur-gard, D. Cremers, and R. Siegwart. Towards a benchmark for RGB-DSLAM evaluation. In Proc. of the RGB-D Workshop on AdvancedReasoning with Depth Cameras at Robotics: Science and Systems(RSS), June 2011.
[13] A. Tanoto, J. V. Gomez, N. Mavridis, H. Li, U. Ruckert, and S. Gar-rido. Teletesting: Path planning experimentation and benchmarkingin the Teleworkbench. In European Conference on Mobile Robots(ECMR), Sept. 2013.
[14] C. H. Tong and T. D. Barfoot. A self-calibrating 3D ground-truthlocalization system using retroreflective landmarks. In Proceedingsof the International Conference on Robotics and Automation (ICRA),May 2011.
[15] T. Wisspeintner, T. van der Zant, L. Iocchi, and S. Schiffer.RoboCupHome: Scientific competition and benchmarking for domes-tic service robots. Interaction Studies, 10(3):392–426, 2009.
[16] Z. Zhang. A flexible new technique for camera calibration.IEEE Transactions on Pattern Analysis and Machine Intelligence,22(11):1330–1334, 2000.


![& 451] : —000 HDMI 1) STB STB Hi-vision STB ACM] STB 121](https://img.dokumen.tips/doc/110x75/61b24614aa01dd6d2408663d/amp-451-000-hdmi-1-stb-stb-hi-vision-stb-acm-stb.jpg)


![STB & 451] : : HDMI STB STB 01 STB STB 7-690-0825 CATV IN](https://img.dokumen.tips/doc/110x75/61b247cbf155562f227eb91c/stb-amp-451-hdmi-stb-stb-01-stb-stb-7-690-0825-catv-in-.jpg)


![EVALUATION OF MULTI CORE ARCHITECTURES FOR MAGE …cecas.clemson.edu/~stb/students/trupti_thesis.pdfCanny edge detector [5]. This algorithm has remained a standard in edge finding](https://img.dokumen.tips/doc/110x75/5ec998a801883b2354447e43/evaluation-of-multi-core-architectures-for-mage-cecas-stbstudentstruptithesispdfcanny.jpg)