Embed Size (px)
Citation preview

University of Massachusetts Amherst University of Massachusetts Amherst
ScholarWorks@UMass Amherst ScholarWorks@UMass Amherst
Doctoral Dissertations 1896 - February 2014
1-1-1986
An external control study of diagram drawing skills for the An external control study of diagram drawing skills for the
solution of algebra word problems by novice problem solvers. solution of algebra word problems by novice problem solvers.
Martin A. Simon University of Massachusetts Amherst
Follow this and additional works at: https://scholarworks.umass.edu/dissertations_1
Recommended Citation Recommended Citation Simon, Martin A., "An external control study of diagram drawing skills for the solution of algebra word problems by novice problem solvers." (1986). Doctoral Dissertations 1896 - February 2014. 4230. https://scholarworks.umass.edu/dissertations_1/4230
This Open Access Dissertation is brought to you for free and open access by ScholarWorks@UMass Amherst. It has been accepted for inclusion in Doctoral Dissertations 1896 - February 2014 by an authorized administrator of ScholarWorks@UMass Amherst. For more information, please contact [email protected].


AN EXTERNAL CONTROL STUDY OF DIAGRAM THE SOLUTION OF ALGEBRA WORD PROBLEMS
SOLVERS
DRAWING SKILLS FOR BY NOVICE PROBLEM
A Dissertation Presented
By
MARTIN A. SIMON
Submitted to the Graduate School of the University of Massachusetts in partial fulfillment
of the requirements for the degree of
DOCTOR OF EDUCATION
September 1986
Education

(c) Copyright by Martin Allen Simon 1986
All Rights Reserved
^cEcI^?okC0NTR0L STUDY 0F diagram drawing skills for THE SOLUTION OF ALGEBRA WORD PROBLEMS BY NOVICE PROBLEM
SOLVERS
A Dissertation Presented
By
MARTIN A. SIMON
Approved as to style and content by
Portia Elliott, Chairperson of Committee
Mario Fantini, Dean School of Education

ACKNOWLEDGEMENT
It is not often in the fast paced, competetive world
of academia that, I appreciate the important people who
contribute to my learning and achievement. I sincerely
appreciate this opportunity to do so.
I would like to thank my dissertation committee:
Portia Elliott for the encouragement, help, and
support throughout the dissertation process.
Jack Lochhead for including me in an exciting research
group, for offering me ass istantsh i p support for my work,
and for giving me a valuable mix of colleageship,
supervision and independence for doing my research.
Arnie Well for his encouragement and statistical
expertise.
I am indebted to Deborah Schifter for her excellent
work as a scorer of diagrams drawn by experimental
subjects. Her expertise in drawing diagrams and her
ongoing support of and interest in my project were truly
valued.
Professors Dick Konicek and Klaus Schultz and fellow
graduate students, Tom Murray and Tom Bassarear have my
sincere appreciation for their friendship and support.

Most people would be unlikely to choose a career in
mathematics education because of their dislike for and lack
of success in mathematics. I believe that I owe my
positive experiences in mathematics primarily to my
parents, Eric and Irene, who patiently engaged me in
"playing" with mathematics before and during my first years
of school. Their commitment to understanding prepared me
to look
deeper than the rote procedures that were generally taught
in school .
I appreciate my family for their love and unwavering
belief in me.
Finally, my love and appreciation to Kim, my best
friend and emotional support, who helps me remember to
smell the flowers along the way.
I dedicate my dissertation to the memory of my
grandfathers, Abe Ronis and Joseph Simon.
v

PREFACE
In order to avoid the use of gender biased pronouns
and to avoid the awkwardness of 11 he/she,11
himse1f/herse1f ," etc., the author has attempted to
balance the use of male and female pronouns in this
do cument.

ABSTRACT
cn. CONTROL STUDY OF DIAGRAM DRAWING SKILLS FOR THE SOLUTION OF ALGEBRA WORD PROBLEMS BY NOVICE PROBLEM SOLVERS
SEPTEMBER, 1986
MARTIN A. SIMON, B.A., NEW YORK UNIVERSITY
M.A.T. , ST. MARY'S COLLEGE
Ed.D., UNIVERSITY OF MASSACHUSETTS
Directed by: Dr. Portia Elliott
Diagram drawing is generally accepted as an important
heuristic strategy for solving mathematical problems.
However, novice problem solvers do not frequently choose to
use this strategy. Further, when asked to draw a diagram,
their attempts often do not result in a useful
representation of the problem.
The exploratory study, which used individual
interviews with remedial mathematics students at the
University of Massachusetts, identified five factors that
influence whether a diagram is used and whether its use is
successful :
1. Understanding of the mathematics involved in the
problem and of basic arithmetic concepts (i.e.
fractions , ratio)
2. Diagram drawing skills and experience
3. Conceptions of mathematics
4. Self-concept in mathematics
v i i

5. Motivation to solve the problem correctly
The interviews also generated a set of diagram drawing
subskills.
The main study focused on factor two. It attempted to
experimentally verify the importance of the subskills
identified in the exploratory study. The list of subskills
was translated into a series of external control
suggestions for guiding the subjects' work during
individual interviews. Subjects were precalculus students
at the University of Massachusetts. These suggestions were
provided by the experimenter as appropriate. Subjects who
received these suggestions drew significantly higher
quality diagrams than did subjects in the control group.
The enhanced quality was particularly apparent in the area
of completeness of the diagram. In addition, the study
indicated several important metacognitive skills necessary
for successful diagram drawing as well as a number of
specific difficulties encountered by the subjects.
v i i i

TABLE OF CONTENTS
ACKNOWLEDGEMENT . iv
PREFACE. vi
ABSTRACT. vii
LIST OF TABLES. xii
LIST OF FIGURES.xiii
Chapter
I. THE PROBLEM. 1
Introd uct ion. 1 Definition of Terms . 2 Background of the Problem . 3 Statement of the Problem . 4
Research Questions . 4 Assumptions on Which the Study is Based . 7 Significance of the Study . 7
Overview of the Study. 8 Exploratory Study . 8 Main Study. 8 Delimitations of the Study. 12
Outline of the Dissertation. 12
II. REVIEW OF RELATED LITERATURE . 14
Overview of the Chapter. 14 Advantages and Disadvantages of Diagram Drawing. 14
Advantages in Problem Solving . 14 VisualThinking . 20 Disadvantages of Diagram Drawing .... 23 Benefits of Diagram Drawing in the
Mathematics Classroom . 23 Advantages Versus Disadvantages . 25
Characteristics of Diagrams . 25 Research on Diagrams . 28
Observational Research on Diagram Drawing. 28
Diagrams in Problem Presentation .... 30 Research Studies Involving Instructional
Interventions . 21 Spatial Abilities and Diagram Drawing . . 34
Conclusions Drawn from the Literature .... 36 Difficulties of Diagram Drawing

Research. 36
Implications for Further Research .... 42 Implications for Present Study . 43
III. METHODOLOGY. 46
The Exploratory Study . 45
Purpose.. | | | | | | 46
Subjects.|| 47
Procedure.| 43
Instrumentation.| | 49
Prob 1 em Sets. 49
Interview Questions . 49 Results. 49
Model One. 50 Model Two. 52
Main Study. 54
Purpose. 54
Subjects. 55
Procedure. 56 Experimental Hypotheses . 59
Instrumentation . 62 Pretest and Treatment Problem Sets . 62 Criteria for Evaluation of Diagram Quality. 63
External Control Suggestions .... 63 Methods of Data Analysis. 63
Analysis of Experimental Study ... 63 Analysis of Treatment Interviews . . 64
Methodological Assumptions . 65 Limitations of the Study. 66
IV. DATA ANALYSES AND RESULTS. 68
Results of Statistical Analyses . 68
Preliminary Analyses . 68
Equivalence of Test Forms. 68
Interscorer Reliability . 68
Equivalence of Groups . 69 Research Question A . 71 Research Question B . 72 Research Question C . 73
Observations from Videotapes . Research Question D . 75 Research Question E . 75 Other Observations. 84
Interpretations of Results. Subskills of Diagram Drawing: Model Two. 88
Algebraic Versus Geometric Problem Contexts . 91
x

Other Important Skills . 93
The Need for Metacognitive Skills . . 93 Specific Metacognitions . 97 General Metacognitions . 99
Difficulties in Diagram Drawing . 101 Modeling Real World Events with Diagrams. 101
Difficulties with Mathematical Concepts . 105
Indications of Lack of Preparation for Algebra. 106
V. SUMMARY, CONCLUSIONS, RECOMMENDATIONS .... 108
Summary. 108 Background. 108 The Exploratory Study . 109 The Main Study. 110
Conclusions and Recommendations . 114 Conclusions and Implications for Mathematics Instruction. 114
Suggestions for Future Research . 117
REFERENCES. 119
APPENDICES. 126
A. Problems Used in Exploratory Study. 126
B. Problems Used in Main Study. 129
C. External Control Suggestions . 130
D. Evaluation of Diagrams and Sample Diagrams . 132
E. Correlations of Scores by the Two Scorers . 137
F. Sample Protocols . 139
x i

LIST OF TABLES
TABLE Page
3.1 Schedule of the Experiment.57
4.1 Comparison of Test Form A and Form B.69
4.2 Mean Scores, Standard Deviations and Range of Possible Scores . 70
4.3 Group I Versus Group III.72
4.4 Comparison of Performance on Geometric Versus Algebraic Problem Contexts . 74
4.5 Frequency of Use of Individual Suggestions .... 85
E.l Correlations of Scores by the Two Scorers .... 137
xi i

LIST OF FIGURES
Figure Page
2.1 Answer Determined Directly from Diagram . 21
2.2 Non-integrated Diagram . 27
2.3 Integrated Diagram . 28
4.1 Unlabeled Parts (Problem 3, Form A) .76
4.2 Unlabeled Parts (Problem 1, Form B) .76
4.3 Implicit Rather than Explicit Representation . . 77
4.4 Discrete Versus Continuous Diagrams . 78
4.5 Additive Versus Multiplicative Relationships . . 79
4.6 Difficulties with Fraction Concepts . 80
4.7 Scale Drawing Versus Sketch . 81
4.8 Unequal Number of Equal Parts . 82
4.9 New Diagram for Each Step.86
4.10 Drawing from the Concrete.104
4.11 Drawing from the Abstract.105
D.l Sample Diagrams .135
xi i i

CHAPTER I
THE PROBLEM
Introduction
Within the field of mathematics education, in recent
years, no skill or topic has received as much attention as
problem solving. The National Council of Supervisors of
Mathematics (1977) stated that problem solving is a basic
skill of mathematics and that "learning to solve problems
is the principal reason for studying mathematics." (page 2)
The National Council of Teachers of Mathematics has
made problem solving one of its priority items in its
Agenda for Action (1980) and emphasized that "Problem
Solving must be the focus of school mathematics in the
1980's."
Problem solving has become a priority for education
because American industries are suffering from scarcity of
students with well developed problem solving skills and
because tests of American school children reveal
substantial weaknesses in this area. The National
Assessment of Educational Progress (1979) demonstrated that
students in the United States are skilled at basic
computational algorithms and the solution of word problems
that require simply the selection of one arithmetic
algorithm. However, these same students are very weak in
1

dealing with problems containing irrelevant information,
problems with insufficient information, problems which
require two or more steps, and non-routine problems.
Definition of Terms
In this study, problem refers to non-routine
mathematical problems, problems for which the subject, at
the outset, has no known methods with which to solve the
problem. In contrast, a mathematical task for which the
subject has only to practice a known method or algorithm i
referred to as an exercise.
Metacoqnition, also referred to as control knowledge
or managerial skills, is the ability to use the knowledge
and problem solving strategies that one posesses. It
involves knowing the limitations and domain of particular
strategies, thinking to use strategies when they are
appropriate, monitoring work using the strategy, and
evaluating the results produced.
A diagram refers to a spatial representation of the
problem situation. It includes, but is not limited to,
area diagrams, number lines, and graphs. In the
literature, diagrams are also referred to as figures and
pictures.
Spatial visualization refers to the ability to "see"
and manipulate mental images of two and three dimensional
relationships .
3
A geometric context (McKee 1983) is a problem which
involves distance, height: quantities that are
instinctively represented by a diagram. An algebraic
context such as age, amount of money, the amount of work
done in a particular amount of time, is less likely to
suggest a diagram and requires the ability to take a
non-spatial quantity and model it spatially.
Background of the Problem
The drawing of diagrams has traditionally been used by
individuals as an aid in solving mathematics and science
problems. Polya's How to Solve It (1945), which classified
"draw a figure" as a heuristic strategy for problem
solving, focused attention on the use of diagrams by
experienced problem solvers. Although mathematics
education researchers have not been able to consistently
show a link between the use of diagrams and improved
problem solving (see Chapter II), there is evidence (McKee
1983) of a link between the ability to draw high quality
diagrams and the successful solution of problems. A number
of studies have looked at whether high spatial
visualization abilities contribute to a greater tendency to
draw diagrams (Landau 1984). However, here also the
results are less than clearcut. Chapter II looks at some
of the difficulties in investigating the link between

4
diagram drawing and problem solving performance and between
spatial abilities and tendency to draw diagrams.
Instructional interventions, which attempted to
improve students' diagram drawing abilities have been
largely unimpressive. Such studies have been of short
duration, one to six weeks, and have lacked a theory of
what skills, knowledge, beliefs and affective factors
contribute to the successful use of diagrams in problem
solving.
Statement of the Problem
Mathematics educators have described the multiple
advantages of diagram drawing in the problem solving
process. However, novice problem solvers, although
encouraged at times by their instructors to draw diagrams,
seem to use diagrams infrequently to solve mathematical
problems and with little success. In order to assist
students in becoming effective problem solvers, teachers
must understand the processes of learning to use diagrams
and of choosing to use diagrams in a problem situation.
Research Questions Remedial mathematics students at the
University of Massachusetts, despite frequently being
encouraged and at times required to draw diagrams, seem to
consistently choose not to draw diagrams in problem
situations for which diagrams would be appropriate.

5
Observations of this phenomenon led to the following
questions which motivated this project:
1. What factors affect whether a student chooses to
draw a diagram when a diagram could be helpful?
2. What skills and knowledge are required to draw
useful diagrams for solving mathematical problems?
Research questions 1 and 2 lead to exploratory
investigations. They were open questions, not constrained
by particular hypotheses, which were best answered by
observing novice problem solvers solving problems and
drawing diagrams and by questioning them on their choices,
beliefs, feelings, and difficulties.
The exploratory study lead to the development of two
models (described in Chapter III) which were created to
organize the preliminary findings relevant to questions 1
and 2. Model One specified the factors which influence the
choice to draw a diagram and the usefulness of the
resulting diagram. Model Two added detail to one of those
factors, subskills of diagram drawing.
The main study focused in on these diagram drawing
subskills. The research questions were refocused as
fo11ows:
A. Are the subskills identified in the exploratory
study (Model Two in Chapter Three) important in the
creation of useful diagrams?
6
B. How important are control (metacognitive) skills
to the creation of high quality diagrams, particularly the
ability to think to use the various subskills and to choose
appropriately among available subskills?
C. What effect does the problem context (geometric
versus algebraic) have on the quality of the diagrams that
are drawn?
D. What important skills and knowledge were not
identified during the exploratory study?
E. What are the difficulties which prevent successful
diagram drawing?
Questions A, B and C motivated an experimental design
and the following research hypotheses.
HI. The subskills identified in the exploratory study
lead to improved diagram drawing.
H2. An important factor in the successful
implementation of the diagram subskills outlined in Model
Two is the metacognitive ability to decide when to use each
skill.
H3. Higher quality diagrams are created for problems
with geometric contexts than for problems with algebraic
contexts .
These research hypotheses are stated in the null form
in Chapter III.
Questions D and E were investigated by including in
the main study the type of open-ended analysis of

7
videotapes which had been so informative in the exploratory
s t udy .
Assumptions on Which the Study is Based The study is based
on the following assumptions which will need to be verified
in future research. These assumptions do not conflict with
the current diagram drawing literature.
1. Diagram drawing is a useful strategy in solving a
wide range of mathematical problems (although not the
majority of problems).
2. All college students, who have no relevant
handicaps, regardless of previous mathematical experience
can learn to use diagrams effectively.
3. Learning to use diagrams to represent mathematical
problems is beneficial for all students even if they do not
tend to be predominantly visual learners.
Significance' of the Study If we believe that the ability
to draw a diagram to represent the mathematical structure
of a problem is important, then teachers must be prepared
to teach diagram drawing. In order to do so effectively,
they must understand the prerequisite skills and
understandings, the subskills which make up the larger
skills, and the affective variables and beliefs that affect
diagram drawing choice and success. They also must be
aware of many of the difficulties that students encounter
when they attempt to draw diagrams. This study was

8
designed to begin the process of providing information in
this relatively unexplored area.
Overview of the Study
Exploratory Study An exploratory study was conducted to
investigate the two research questions. A clinical
interview approach was used in order to investigate, not
only the problem solving and diagram work of the subjects,
but also the subjects' explanations for their work and
their feelings and attitudes about mathematics, problem
solving, and the use of diagrams. Observations from the
exploratory study generated a model of diagram drawing
subskills as well as a model of the factors which influence
the use of diagrams. These are presented in Chapter III.
Main Study The main study was designed to answer five
res earch q uestions :
A. Are the subskills identified in the exploratory
study (Model Two in Chapter Three) important in the
creation of useful diagrams?
B. How important are control (met acognitive) skills
to the creation of high quality diagrams, particularly the
ability to think to use the various subskills and to choose
appropriately among available subskills?

9
C. What effect does the problem context (geometric
versus algebraic) have on the quality of the diagrams that
are drawn?
D. What important skills and knowledge were not
identified during the exploratory study?
E. What are the difficulties which prevent successful
diagram drawing?
The main study was composed of two parts: an
experimental design and an analysis of videotaped diagram
drawing interviews. The experimental component was a three
group design which tested the effect of the subskills
identified in the exploratory study on diagram quality
(research questions A and B) and investigated the effect of
problem context on diagram quality (research question C).
Initially the external control paradigm of Heller and
Reif (1984) was selected to begin to check out whether the
model that had been created is a useful description of
diagram drawing skills. Heller and Reif had developed a
prescriptive model for the development of "theoretical
problem descriptions" (representations) for mechanics
problems in physics. They considered the development of
these representations, which involved diagrams, to be a key
step in the problem solving process, a step in which
specific knowledge of mechanics is brought to bear on the
problem. Their study assumed that students who had
successfully completed a first course in basic physics had
10
the necessary knowledge to solve the mechanics problems,
but were often unable to apply and exploit that knowledge
in problem solving.
Heller and Reif's experimental model was an attempt at
describing an effective process for applying knowledge in
mechanics to create useful theoretical descriptions. It
was not an attempt to model the performance of experts who
seem to be able to do much of what is necessary
automatically. No attempt was made to teach the subjects.
The model, which was translated into a set of external
control directions, a set of directions that guided the
subject through the problem solving process, was tested to
see if it indeed specified procedures and control knowledge
which were necessary and sufficient for creating useful
representat i ons. Control knowledge or met acognition
(defined above) refers to knowing when to use particular
strategies or knowledge, thinking to use them when
appropriate, and monitoring their correctness and
us efulness.
Preliminary trials of the main study revealed that the
Heller and Reif experimental paradigm would not be
applicable without some modifications. The preliminary
trials indicated lack of discrete and ordered steps in the
development of diagrams for algebraic problems. Thus, the
use of step by step directions as in the Heller and Reif
design was not appropriate. In this study, therefore,
11
rather than using the directions to direct a sequence of
steps, these directions were given as needed, without
regard to order of use.
The main study was designed to examine whether the
control knowledge and skills, identified during the
exploratory study, significantly improve the quality of
student-drawn diagrams created to solve algebra word
problems. In order to do so, a set of external control
directions were created which "suggest" that the subject
carry out particular behaviors deemed helpful in creating
useful diagrams. Rather than presenting these directions,
then, in a step-by-step fashion, the experimenter read
these directions in response to particular behaviors of the
subject.
Subjects were asked not to solve the problems, only to
create the diagramatic representation. This allowed the
study to focus on just that part of the problem solving
process and reduced the pressure on the subjects to get the
"right" answer.
In addition to the experimental component of the main
study, which focused on questions A,B and C, video tapes of
the problem solving sessions were analyzed by the
experimenter to continue the exploratory nature of the
study and to focus on questions D and E.
12
Delimitations of the Study
1. The study focused on the solution of typical
algebra problems only.
2. Subjects were remedial and precalculus students at
the University of Massachusetts which represented the lower
level mathematics students.
3. Interviews all involved individual subjects and
the experimenter only.
4. The main study took place during a six week
period.
5. The main study was not an instructional
intervention; it focused on the benefits of using the
subskills. No assumption was made that because a subskill
was used during the study that it had been learned by the
subject.
A section, "Limitations of the Study," is included in
Chapter III.
Outline of the Dissertation
Chapter II offers a review of the literature on
diagram drawing which serves as a background for this
study. It includes the advantages and disadvantages of
diagram drawing, research relating diagram drawing to
problem solving and to spatial abilities, and research
involving instructional interventions. The chapter

13
concludes with a discussion of some of the inherent
difficulties in investigating diagram drawing and the
relationship of the literature to the research questions
posed in this study.
Chapter III describes the design of the exploratory
study and then the results of that study since the main
study is based on those results. The chapter than
describes the'design of the main study, the data analysis,
and the limitations of the study. It also includes
operational statements of the hypotheses.
Chapter IV examines the results and interpretations of
the results with respect to research questions A through E.
Chapter V begins with a summary of the first four
chapters. It than focuses on the conclusions that can be
drawn from the findings and recommendations for future
res ear ch .

CHAPTER II
REVIEW OF RELATED LITERATURE
Overview of the Chapter
This review of the literature begins with a look at
the advantages and disadvantages of diagram drawing, the
basis for the assumption (stated in Chapter I) that diagram
drawing is a useful strategy in mathematical problem
solving. This section is followed by a description of
mathematics researchers' efforts to characterize the
different types of diagrams that are drawn by students.
Work reviewed in this section implies some of the skills
involved in diagram drawing. The following section looks
at previous experimental attempts to study diagram drawing.
The author closes the chapter with a discussion of
conclusions that can be drawn from the literature and
implications for further research, focusing particularly on
connections between the literature and the research
questions which motivate this study.
Advantages and Disadvantages of Diagram Drawing
Advantages in Problem Solving Since Polya's work is
generally accepted as a cornerstone of modern problem
solving education, it seems appropriate to begin with
Polya's widely quoted four steps (1945). Polya divided the
14

15
process of problem solving into four steps or stages
through which the problem solver procedes sequentially.
1. Understanding the problem
2. Devising a plan
3. Carrying out the plan
4. Looking back
It is common, however, that the information generated
in a particular step sends the problem solver back to one
of the earlier steps. For example, in "carrying out the
plan" (step 3), results may be generated which cast a new
light on the solver's understanding of the problem. The
solver then goes back to step one and procedes
sequentially. This cycling back through the steps may
occur many times at different stages of solving the
problem.
The first step, understanding the problem, an
essential step, has received little attention in
traditional mathematics teaching (O'Regan 1984). Routine
textbook "problems" are usually exercises for practicing
algorithmic skills. They provide a vehicle for the numbers
which the student must plug into the learned algorithm. In
such a process involving known computational methods and
one or two step problems, skill in understanding the
problem is not challenged or developed. In addition, the
16
misconception that problem solving is nothing more than
choosing and using the appropriate algorithm is reinforced.
Hayes (1981) and Mason (1984b) contend that an
important part of understanding the problem is the creation
of an internal representation of the problem. Thus, the
learner develops a mental picture of the problem. Hayes
and Mason emphasize that it is often helpful to make an
external representation (diagram, model, etc.) to capture
the internal representation.
Mason insists that making sense of a problem or
concept requires manipulation of objects. These objects
may be diagrams, symbols, or images, as well as physical
objects, if the learner is confident of "these things as
objects." This relationship of internal representation
leading to external representation can sometimes be
reversed. Building an external representation by
diagraming the problem information can help to generate an
internal representation of the problem as the diagram takes
shape.
In step one, then, drawing a diagram can help in
understanding the problem (Tanaka 1982, Reif, Larkin &
Brackett 1976). Bell (1981) and Lester (1977) pointed out \
that the diagram reduces the dependence on words and gives
a concise translation of the problem. Kinsella (1970,
cited in McKee 1983), Mayer and Revlin (1978), and Simon
(1975) have pointed out that students' greatest difficulty

17
in solving a problem is the selection of useful
representations. Newell and Simon (1972) noted that
understanding is tied to the construction of effective
representations. They pointed out that representations
have not been well studied. Greeno (1983) stated, "it
seems very likely that students success in solving word
problems could be improved by instruction focused on the
process of representing problems." He observed that such
instruction currently is, at most, an implicit part of the
educational process.
Difficulties in problem solving are, in part, a result
of the gap that students perceive between their concrete
experience of the world and the abstract nature of
mathematics. Diagrams help bridge this gap (Botsmanova
1972a). A diagram may provide a concrete representation of
the problem situation which clearly portrays the relevant
relationships in the problem. These relationships can be
connected to the necessary mathematical abstractions
(Herring 1980, Tanaka 1982, Hooper 1981).
The diagram can further contribute to "understanding
the problem" by providing a context for estimation of the
answer (Bell 1981) or, in more complex problems, an
opportunity to characterize the answer or determine how to
recognize when the problem has been solved.
18
Herring (1980) noted that the process of creating the
pictorial representation of a problem demands certain
aspects of understanding. The solver must:
1. eliminate distracting details
2. clarify her thoughts
3. identify relevant attributes of the problem
4. identify relationships in the problem situation.
Diagrams also serve as extensions of memory (McKee
1983, Newell and Simon 1972). Mayer (1976) asserts that
diagrams improve performance when they replace complex
verbal representations. The result is better access to the
problem's information.
In addition to pencil and paper diagrams, computer
graphics has provided a more dynamic, mutable medium for
representing problems. Luerhman (1982) observed that
students who explore science problems through interactive
computer graphics obtain a richer understanding of the
problem's dynamic properties. He concluded, "The ability
to change the picture and see how it looks when you change
your premises enables the student to perform at a higher
cognitive level." (p. 3)
In addition to the value of diagrams for
"understanding the problem", diagrams are significant in
step two, "devising a plan". Seeing the pictorial
representation of a problem and its key relationships,
leads to strategies for solving the problem (Bell 1981).
19
Larkin (1983) specified that problem solving expertise
involves searching the problem space effectively, and that
the creation of a representation reduces the size of the
problem space to be searched.
Landau (1984) pointed out that creating an image of a
problem "permits a conceptual (i.e. 'how should I think
about this problem?') rather than a procedural (i.e. 'what
should I d_o next?') approach" (p. 6). She refers to
evidence from the Applied Problem Solving Project (Lesh et
al. 1983) which suggested that problem solvers who take a
conceptual approach are more often successful than the
problem solvers who take a procedural approach.
Besides facilitating the 1ogica1/sequentia 1 mode of
thinking, valued in mathematics problem solving, diagams
also lend themselves, better than verbal descriptions or
mathematical symbols, to engaging the intuition (Hooper
1981). Although largely absent from the problem solving
literature, intuitive thinking plays a key role in the
solving of complex mathematics problems. Intuition is
observed in the "intuitive leaps" made by expert problem
solvers and are often the source of creative approaches to
non-routine problems. Elliott, (1980, p. 218) noted that
"creative thinking and problem solving in mathematics are
just as much unconscious and intuitive as they are logical
and formal." (See the discussion of "Visual Thinking"
below.)

20
In some problems, the diagram can be manipulated
directly to obtain an answer, thus functioning in Polya's
step three. See Figure 2.1 (O'Regan 1984).
Polya's step four can also be enhanced by fitting
answers obtained back into the diagram to check the
reasonableness of the answers.
Visual Thinking One of the areas which has been linked to
pictorial solutions of problems is the area of visual
thinking. Many educators insist that there are two
distinct but complementary types of thought that go on in
the human brain, (i.e. 1 og i ca1/sequentia 1 and
wholistic/intuitive) and that they are both essential to
maximize problem solving potential. Much of the work on
brain-hemisphere specialization supports this notion
(Ornstein 1972, Hendricks and Wills 1975, Levy 1983).
Moses (1982) describes visual thinking as a
non-analytic and non-a 1gorithmic process. It is a
"whol i stic" process, referring to the fact that it involves
a perception of the whole rather than a sequential look at
the parts. In this process, creative insights emerge as
mental images. Often, these images are then recorded as
drawings which allows the images to be examined, analyzed
and manipulated. Moses suggested the need for instruction
designed to help students develop their abilities for
mental imagery. .
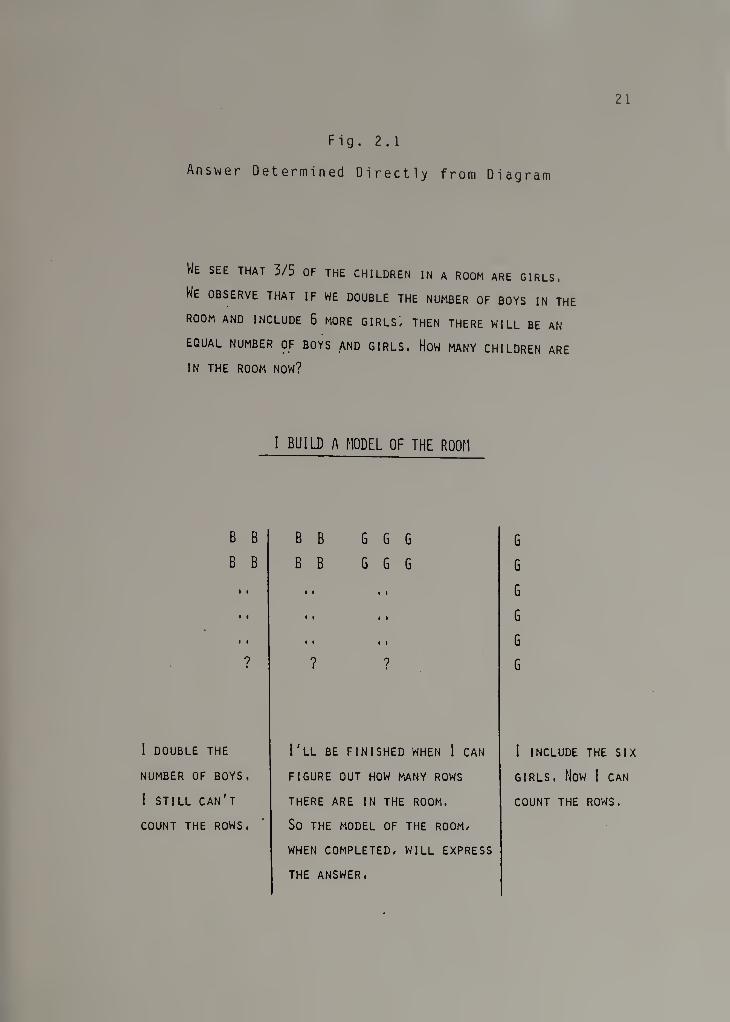
Fig. 2.1
Answer Determined Directly from Diagram
21
We see that 3/5 of the children in a room are girls,
We observe that if we double the number of boys in the
ROOM AND INCLUDE 6 MORE GIRLS/ THEN THERE WILL BE AN
EQUAL NUMBER OF BOYS AND GIRLS, HOW MANY CHILDREN ARE
IN THE ROOM NOW?
I BUILD A MODEL OF THE ROOM
B B B B G 6 G
B B B B G G G
i i
?
G
G
G
G
G
G
I DOUBLE THE
NUMBER OF BOYS,
I STILL CAN'T
COUNT THE ROWS,
I'll be finished when I can
FIGURE OUT HOW MANY ROWS
THERE ARE IN THE ROOM.
So THE MODEL OF THE ROOM/
WHEN COMPLETED/ WILL EXPRESS
THE ANSWER.
I INCLUDE THE SIX
GIRLS, HOW I CAN
COUNT THE ROWS.

22
Mason (1984b) wrote that attempting to get students to
draw diagrams before they have learned to create mental
pictures is useless. Instruction is too often focused on
the external behaviors of students rather than on the
internal construction of images and knowledge. Mason
contended that diagrams are a recording of mental imagery
which may not be pictorial until the diagram is created.
De Groot (1966, cited in Herring 1980) has shown that
expert chess players remember a large number of chess board
situations. Egan and Schwartz (1979, cited in Herring 1980)
found that electronic technicians had a similar memory for
schematic diagrams of electrical components. This memory
of meaningful "chunks" may be evidence for the existence of
a visual or wholistic memory.
Hooper (1981) suggests that diagram drawing helps to
engage the problem solver's intuition. Maier (1983) offers
the following description of physicist, Richard Feynman:
Dick just wrote down the solutions out of his head without ever writing down the equations. He had a physical picture of the way things happen, and the picture gave him the solution directly, with a minimum of calculations (p. 2).
Maier advocated the developmet in our students of a
balance of visual and analytical thinking and quotes Robert
Sommers, University of California at Davis, "New math
failed because of its bias towards abstraction and its
devaluation of imagery." (p. 5)

23
Disadvantages of Diagram Drawing Although the literature
strongly supports the value of drawing diagrams for solving
mathematical problems, there are disadvantages, too, in the
use of diagrams. A diagram that represents the solvers
preconceptions of the problem can fix a particular
inappropriate image in the mind of the solver and inhibit
his flexibility in creating alternative representations
(Wicker, Weinstien, Yelick, and Brooks 1978). Sheri 11
(1973) and Webb and Sherrill (1974) showed that inaccurate
diagrams in the problem presentation resulted in poorer
problem solving than for the case where no diagram was
presented.
The section below, "Spatial Abilities and Diagram
Drawing," describes evidence that requiring students to
draw diagrams may interfere with problem solving
performance depending on the spatial abilities of the
problem solver.
Although diagram drawing may not be a learned or a
preferred mode of problem representation for many students,
thus not advantageous, this lack of advantage is different
than a disad vantage.
Benefits of Diagram Drawing in the Mathematics Classroom
McKee (1983, p.6) described the importance to the teacher
of diagram drawing .
Drawing a figure not only serves as a helpful strategy [for problem solving], but can show that
24
a student understands the problem (Cooney, Davis, and Henderson 1975 p. 248) since it requires identifying the structure of the problem (Johnson and Rising , 1967 p . 124).
McKee observed that a student who draws literal
representations of problems is not at the same level of
mathematical development as the student who uses "highly
abstract, schematized figures." Vest and Congleton (1978)
advocated the teaching of diagram drawing as a way to help
students learn to build mathematical models. Involving
students in diagram drawing encourages them to work in a
medium that demands thought and understanding as well as
creativity. This is in contrast to most algorithmic work
which requires only the imitation of learned procedures.
The teaching of diagram drawing may have affective
payoffs as well:
'poor problem solvers do not strongly believe that persistent analysis is an effective way (in fact the only way) to deal with academic reasoning problems.' (Whimbey and Lochhead, 1980 p. 29) Thus these 'one-shot' thinkers are less limited by their capabilities than by their habits and beliefs. (Lochhead 1981, p. 20)
However, the teaching of diagram drawing may result in
"working on" the problem (Mason 1984b); that is in
increased activity by the student as he sees how it works
and tries things when a solution is not readily apparent.
The manipulation of diagrams may not only cause the student
to be more active in problem solving, but may also

25
contribute to a shift in the student's beliefs about
mathematics and about himself as a problem solver.
Advantages Versus Disadvantages The literature clearly
describes many more advantages than disadvantages for the
use of diagrams. The assumption, therefore, that diagram
drawing is a useful general problem solving strategy seems
reasonable. What remains to be answered, however, is what
are the component skills which contribute to a student's
ability to use diagram drawing successfully and what are
the factors which determine whether students make use of
this strategy.
Characteristics of Diagrams
McKee (1983) chose to investigate four characteristics
of drawn diagrams:
1. type the literalness versus the abstractness
of the diagram
2. comp!eteness: how much of the relevant
information is represented in the diagram, and whether it
is done in one integrated diagram rather than several
separate diagrams
3. labelin g: extent to which the parts of the
diagram are appropriately labeled
4. accuracy: correctness of the representation
of problem information.

26
Although it is sometimes difficult to judge individual
diagrams, the general criteria for completeness, labeling,
and accuracy are easily agreed on by expert observers
(McKee 1983). Even with respect to "type", the
classification of the diagrams into categories, where
various criteria could be used, there seems to be fairly
close agreement. Botsmanova (1972a) classified student
diagrams similarly to McKee:
1. Object illustrative refers to a diagram of
the objects and or setting of the problems. Such diagrams
do not reflect the mathematical structure of the problem.
2. Object analytical refers to a diagram of the
objects that uses a spatial arrangement to represent
relationships. Such diagrams do reflect the mathematical
structure and the essential data of the problem.
3. Abstract spatial refers to a diagram that
reflects only the relevant mathematical relationships of
the data (schematic representation).
Larkin's (1983) observations were consistent with the
classification schemes above. She stated that experts tend
to represent physical and mathematical relationships while
novices represent objects as described. She suggested that
this distinction may be the major cause of observed
differences between novices and experts.

27
Schultz (1983) also focused on the literalness of
representations, calling them:
1. meaningfu1 (i.e. pictures of coins for a coin
problem)
2. indirect meaningful (i.e. rectangles to
represent beds)
3. non-meaningful (i.e. circles for odd and even
numbers) .
With regard to completeness, Paige and Simon (1966,
cited in McKee 1983) noted the importance of representing
all the problem information in one "integrated" diagram as
opposed to a series of diagrams, each showing only part of
the problem situation. See Figures 2.2 and 2.3 below which
were drawn for the following problem:
A rabbit is eighty of her own leaps ahead of a dog. She takes three leaps for every two that the dog takes, but he covers as much ground in one leap as she does in two. How many leaps will the rabbit have taken before she is caught?
FIG. 2.2
Non-integ rated Diagram
3 rabbit leaps rY~\ rm
rr\ for every
2 dog leaps
2 rabbit
leaps equal
1 dog leap
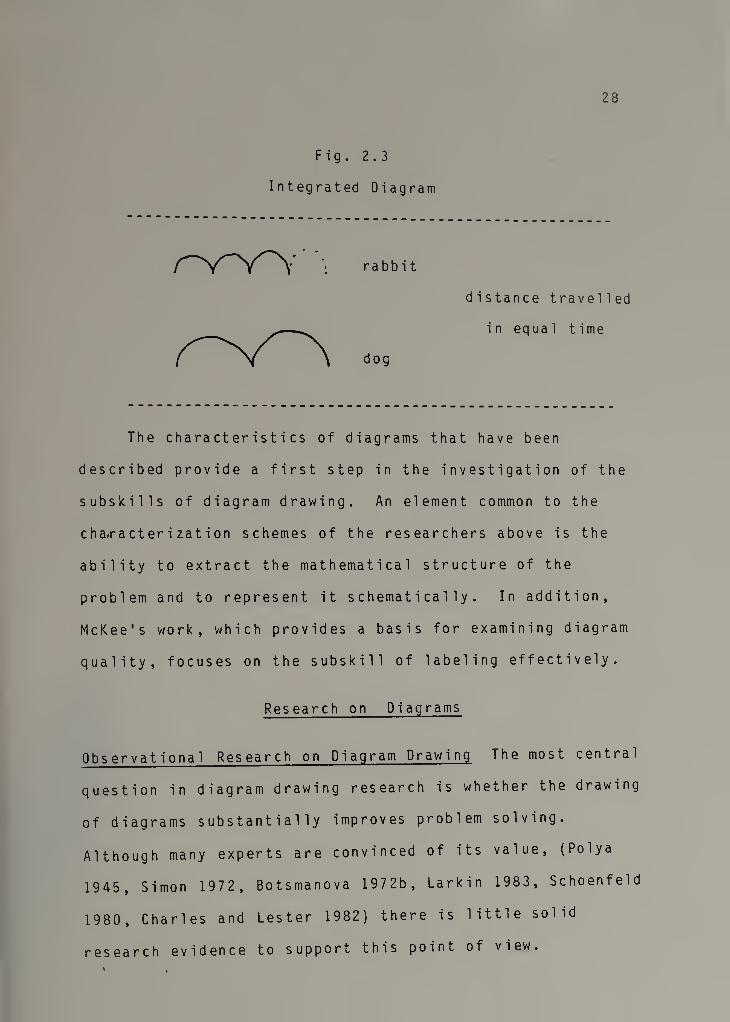
Fig. 2.3
Integrated Diagram
28
rabbit
distance travelled
in equal time
The characteristics of diagrams that have been
described provide a first step in the investigation of the
subskills of diagram drawing. An element common to the
characterization schemes of the researchers above is the
ability to extract the mathematical structure of the
problem and to represent it schematically. In addition,
McKee's work, which provides a basis for examining diagram
quality, focuses on the subskill of labeling effectively.
Research on Diagrams
Observational Research on Diagram Drawing The most central
question in diagram drawing research is whether the drawing
of diagrams substantially improves problem solving.
Although many experts are convinced of its value, (Polya
1945, Simon 1972, Botsmanova 1972b, Larkin 1983, Schoenfeld
1980, Charles and Lester 1982) there is little solid
research evidence to support this point of view.

29
Webb (1979) found some improvement in problem solving
when students used visual representations. Swart (1970)
found that students who were drawing diagrams to aid in
problem solving out-performed those who were taught to use
an analytic/abstract symbol approach.
On the other hand, Kilpatrick (1967, cited in Landau
1984) observed above average eighth graders and found that
drawing diagrams was not related to success in problem
solving. Lean and Clements (1981), testing engineering
students in New Guinea, found that students who used a
verba 1-analyt i ca 1 approach to problem solving outperformed
the students who took a visual approach.
McKee (1983) found that the tendency to draw diagrams
was not significantly related to problem solving
performance. She observed, however, that student diagrams
were generally of low quality on all four criterea; type,
completeness, labeling, and accuracy. Her measure of
diagram drawing ability, which reflected the quality of the
diagrams drawn, was significantly correlated with problem
solving performance. This may indicate that the drawing of
diagrams is only helpful if the diagrams are of high
quality, or that students with more problem solving ability
are able to draw better diagrams.
McKee suggested that:
The lack of association between drawing a figure and getting the problem correct might be attributed to the difficulty of the problem, the
30
low quality and number of figures drawn, or a combination of all three, (p. 106)
McKee's results were consistent with those of Schwartz
(1971) and Schonberger (1976) who found that a correlation
did exist between the drawing of higher quality diagrams
and solving the problems correctly.
Reasons for the seemingly contrad i ctory nature of
these results are discussed later in the section,
"Conclusions Drawn from the Literature".
Diagrams in Problem Presentation The inclusion of diagrams
in the problem presentation seems to increase solution
success. Research has shown that these diagrams must be
accurate and represent the mathematical structure of the
problem to be effective. Sherrill (1973) presented
problems to tenth grade students with accurate diagrams,
inaccurate diagrams, and no diagrams. Accurate diagrams
improved performance over no diagrams, while inaccurate
diagrams resulted in worse performance. Sherrill and Webb
(1974) repeated these results with pre-service elementary
teachers.
The National Assessment of Educational Progress (1979)
demonstrated that diagrams were an aid in problem solving.
Threadgi11-Sowder and Sowder (1982) found that diagrams in
the presentation of problems led to significantly higher
rates of successful solution.
31
Ehr (1980) made diagrams, hints, facts, and formulas
available to students and found that students most often
selected diagrams.
Botsmanova (1972a) found that good students selected
diagrams that showed the mathematical, rather than the
physical, characteristics of the problem. Their use of
these diagrams resulted in shorter solution times.
Improved problem solving success seems to have been
more convincingly linked to the use of diagrams in the
problem presentation than to the drawing of diagrams by the v
problem solvers. The lack of clear relationship in the
latter case may be a function of the poor diagram drawing
skills of the populations being studied. Drawing poor
diagrams does not aid and may detract from problem solving.
The more clearcut evidence of the improvement in problem
solving that results from the use of diagrams in the
problem presentation may give us a peek at the potential
benefits that students might derive if they could create
effective diagrams .
This potential suggests the importance of learning how
to teach diagram drawing and motivates a study such as this
one which can contribute foundational information for such
teaching.
Research Studies Involving Instructional Interventions A
number of researchers have attempted to improve diagram
32
drawing through instruction. The results are inconclusive,
leading to the observation that diagram drawing is a
complex skill which likely requires a lengthy developmental
process .
Nelson (1974) provided sixth grade students with eight
hours of instruction which included instruction in
/
diagraming word problems and in translating diagram-posed
problems to word form. He found no significant improvement
by the total group of students receiving this instruction.
He did observe, however, that this group of students (who r
had been instructed in diagraming) drew more diagrams for
problems which lend themselves to diagrams. He also found
that when he looked at those students who actually
benefited from the instruction in diagraming (those
students who used diagrams to solve problems), he observed
that they did significantly better than students who did
not diagram.
Schultz (1983) provided a brief instruction period
followed by structured practice which encouraged the use of
concrete manipu1 atives and computer graphics as well as
diagrams. She found that average students used such models
more frequently than the above or below average students
and that increased use led to increased problem solving
success .
Threadgi11-Sowder and Juilfs (1980) created two
instruction groups; one which focused on manipulative
33
models for problem solving, and a second which focused on
symbolic solutions. They found that those that scored low
on math concepts and problem solving pretests did
significantly better in the manipulative models group,
while the high scorers on the pre-tests did better with
symbolic solutions.
Botsmanova (1972b) provided ten lessons over a three
month period to third graders in the Soviet Union. He
found that comparison of a "sub-analytical" diagram and a
' graphic diagram was an effective instructional technique.
Students were able to focus on mathemtical relationships in
the problem which had been hidden from them before. The
group receiving the instruction in graphic representation
did significantly better than the control group. He and
his colleagues also identified three stages in the use of
diagrams for problem solving.
1. The stage of unanalyzed reflection of the problem's subject situation: As a rule, this broad reflection of the situation, general in an undifferentiated way, is accompanied by the isolation of one or two essential elements. 2. The stage of specification [is characterized by] the isolation of all or almost all of the basic elements and relationships, without a final
synthesis. r. _ . , 3. The stage of an adequate diagram [is] based on a complete analysis and synthesis of the problem's situation. (Botsmanova 1972b, p. 121)
He observed that the use of diagrams involves analysis
of the problem which is closely related to abstraction. As

34
one analyzes the partially drawn diagram, one sees new
mathematical relations in the problem text.
S£atial Abilities and Diagram Drawinn A number of studies
(Schonberger 1976, Guay and Me Daniel 1977, Moses 1978)
have linked spatial abilities to problem solving success.
Educational theorists have speculated that diagram drawing
may be the link between these two areas (Landau 1984).
Several investigators have tried to determine whether
students with a high level of spatial reasoning skills are
better able to draw diagrams and/or more likely to do so in
problem solving. The results have been inconsistent and
seemingly contradictory from one study to the next.
Khoury and Behr (1982) found that high spatial
visualizers did significantly better than low spatial
visualizers on pictorial modes of representing problems,
while they showed no significant advantage in symbolic and
mixed modes (pictorial and symbolic together).
Schonberger (1976) found a positive correlation
between problem solving performance and visual spatial
abilities. She concluded that high spatial ability is a
better predictor of the correctness of diagramatic
representations than whether a diagram is drawn. She
concluded that more spatial training is needed in schools.
Moses (1978) found no correlation between visual
approaches to problem solving and problem solving

35
performance. She concluded that students with high spatial
ability frequently are able to represent the problem and
manipulate it mentally, thus showing no written diagrams.
Landau (1984) found significant correlation between
problem solving and spatial abilities. She created four
groups. The first group was asked to assess whether a
diagram would be helpful before solving each problem. The
second group was instructed to draw a diagram for each
problem. The third group was presented with two diagrams
for each problem and was asked to work with one of them to
solve the problem. The fourth group, the control, was
given the same problems to solve with no special
instructions. .The results of these four conditions on both
high and low spatial ability students did not lead Landau
to a- simple explanation of the relationship of spatial
abilities and diagram drawing. She found that encouraging
low spatial ability students to draw diagrams resulted in
worse performance in problem solving, but presenting them
with diagrams improved their problem solving.
High spatial ability students were hampered by
Landau's experimental condition instructing them to draw
diagrams. She concluded, similarly to Moses, that the high
spatial ability students would have manipulated internal
images and were hampered by having to externalize them.

36
Conclusions Drawn from the Literature
Difficulties of Diagram Drawing Research The
inconclusiveness and often contradictory nature of most of
the research on diagram drawing suggests that a number of
difficulties may be inherent in this work. Many of these
difficulties are present in the field of problem solving
research in general. Some of the difficulties in diagram
drawing research are discussed below.
1. Great variability and lack of standardization of
problem solving tasks: Researchers in problem solving work
with a great variety of problems while attempting to study
the same phenomena. Their problems range from standard
textbook word problems to real world problems and
non-routine problems. These problems also vary in
difficulty, number of possible solutions, and amount of
insight required. In addition, research problems range
from problems requiring no mathematical knowledge to those
that require a sophisticated mathematical background. Much
of the variability of the results is more a function of the
tasks selected than of the experimental conditions that
have been created.
In diagram drawing research, an additional variable is
introduced since certain types of problems lend themselves
more to diagram drawing then others. In an attempt to look
at this issue in her research, McKee (1983) used the work

37
of Goldin and McClintock (1979) and Caldwell and Goldin
(1979) to create two sets of parallel problems. One set of
problems had a "geometric" context (i.e. distance, area)
while the second set had an "algebraic" context (i.e.
money, age). The problems were matched with respect to
nine other characteristics. McKee found that students drew
more and higher quality diagrams for the geometric problems
than for the algebraic ones, but students showed no
significant difference in their ability to solve problems
from the two sets. Schonberger (1976) obtained similar
results.
Differences in problem solving tasks could also
partially explain the variability of research results with
respect to spatial abilities. Schwartz (1971), conceding
the possibility that high spatial ability students were
creating mental images but no diagrams, suggested that
tasks be created in which the memory load is too great to
permit successful solution with internal representations
only.
2. Visual strategies are only applicable for problems
of a certain difficulty: Researchers have been unable to
show conclusively that the drawing of diagrams leads to
improved problem solving performance. One of the factors
that clouds these results is the level of problem
difficulty. For a given problem, some students will find
it routine; that is they know immediately how to go about

38
solving it. They have either solved similar problems
before or they possess an appropriate algorithm or method
for solving such a problem. These students have no need to
draw a diagram since they can procede directly to an
answer.
Other students will find the problem beyond their
abilities and fail to solve the problem even if they draw
diagrams. This leaves a narrow range of students who can
solve the problem, but find the problem to be non-routine
and challenging enough to warrant the drawing of a diagram.
Therefore, the majority of students, on any given problem
will either not draw a diagram, but solve it correctly, or
draw a diagram and fail to solve it, which results in a
decreased chance of obtaining statistically significant
correlations when problem solving performance is related to
diagram drawing.
3. The populations being studied are unskilled in
diagram drawing: It is difficult to assess the advantages
of diagram drawing if the students lack the skill to draw
effective diagrams. Most populations being studied are
products of educational systems that have not valued or
taught diagram drawing for problem solving. Therefore,
even if these students draw diagrams, the diagrams very
often lack the quality to be of real benefit. McKee (1983)
who rated high school algebra and geometry students'
diagrams on type, completeness, labeling, and accuracy
39
(discussed above under "Characteristics of Diagrams"),
pointed out that the lack of correlation between drawing a
diagram and solving the problem correctly, might be
explained by the fact that the diagrams drawn were of such
poor quality. She characterized the diagrams as lacking
... information essential to solving the problems; there was evidence of misunderstanding the problems, and the figures were not labeled as well as they might have been. Few figures were schematic, more were illustrative, and most tended to be somewhere in between, (p. 100)
Because of the mathematical experience and
instructional backgrounds (devoid of diagram drawing) of
most students, researchers are much more likely to see
successful problem solving when students use symbol
manipulation approaches than when they use diagramatic
approaches. These results, however, tell us little of the
potential benefits of long term, quality instruction in
diagram drawing.
Clement, Lochhead, and Monk's (1981) work with
translation difficulties pointed out that being able to
create an accurate diagram is not always sufficient.
Students must also develop the ability to translate from
diagrams to algebraic symbols to make full use of diagram
drawing skills.
4. Instructional interventions require substantial
duration to be successful: Many of the attempts at
improving diagram drawing have included only one to twelve

40
hours of instruction (Nelson 1975, Shoecraft 1972, Frandsen
and Holder 1969 and Heseman 1977). Diagram drawing is far
too complex a skill to be influenced significantly in such
a short period of instruction. McKee (1983) concluded,
As with many problem solving skills, diagram drawing needs to be promoted and encouraged over a period of time in order for students to adopt it as part of their repertoire of strategies and to be skilled in the use of a diagram, (p. 25)
Schoenfeld (1979) listed three prerequisites for using
a heuristic strategy:
1. Know how to use it. 2. Understand the problem sufficiently to apply
the heuristic correctly. 3. Think to apply the heuristic.
To draw effective diagrams the student must learn all
three of these skills. Learning to, not only draw
effective representations, but to adapt these skills to a
wide variety of problems, requires considerable experience
with diagrams .
Schoenfeld's second prerequisite opens up a whole
other area of concern. Students, who do not have a
conceptual understanding of the mathematical ideas which
are being manipulated, cannot represent them pictorially in
an accurate and usable manner. The inability to draw an
effective diagram, therefore, may be only the tip of an
iceberg that lies deep in the past mathematics education of
the student, a mathematics education that has stressed
procedural knowledge far more than conceptual knowledge.

41
5. Students have conceptions of mathematics which are
antagonistic to the idea of drawing diagrams: Peck (1984),
describing an above average student, wrote:
This student (lacking proper conceptual referents for the symbols and operations in fractions) perceives math as a collection of rules whose attachment to reality is vague, at best, and that such an attachment is unimportant. Furthermore, the student does not perceive a necessary underlying logic for the rules -- they just are. (p. 166)
He listed five counterproductive perceptions which he
has repeatedly encountered in students over the years:
1. Mathematics is a collection of rules which are chained together to provide answers in narrowly specified circumstances.
2. Mathematics is not helpful in solving real prob1ems.
3. Mathematics was invented by geniuses. Most ordinary people cannot be expected to understand it.
4. Right or wrong cannot be decided by the learner, but is the province of the answer key or the teacher.
5. The learner's role is to be told specifically what to do, then follow instructions precisely .
Schoenfeld (1983) has identified a similar list.
Students who have the conceptions of mathematics, described
above, will not see diagram drawing as even potentially
useful. In fact, the suggestion "draw a diagram" only
creates an additional problem which they feel unequipped to
handle. In order to see diagram drawing as a useful
activity, students must see mathematics as connected to the
"real world", feel that they can create mathematical
understandings and feel that they can invent problem
42
solutions. These conceptions of mathematics need not be
developed prior to instruction in diagram drawing. In fact,
such instruction can contribute significantly to the
development of these conceptions. However, the effect of
such conceptions and their opposites cannot be ignored.
6. Both high spatial ability and low spatial ability
students may not draw diagrams: High spatial ability
students may not draw diagrams because they are working
from an internal image (Schwartz 1971). On the other hand,
low spatial ability students may not possess sufficient
spatial skills to become good diagramers unless they are
given an opportunity to enhance their spatial skills.
Implications for Further Research Even with all the
difficulties inherent in diagram drawing research, two
preliminary conclusions seem to merit further
investigation. 1. The drawing of high quality diagrams for
problems which lend themselves to diagram drawing improves
problem solving. 2. Diagram drawing ability and diagram
drawing tendency can be improved through instruction.
Large scale paper-and pencil correlational studies,
which attempt to relate diagram drawing frequency and
quality to problem solving success, will probably fail to
provide much additional information for the reasons noted
above. Short term instructional interventions also have
little hope of significant impact (see discussion above).
f
43
Diagram drawing research can possibly be better served, at
the present time, by clinical interview examinations of
diagram drawing behaviors and attitudes, and by longer
term, intensive instructional interventions for the
teaching of diagram drawing.
Clinical interviews can focus more directly on the
individual, working on problems of relevant difficulty (see
discussion of problem difficulty above). The interview can
focus on the skills and attitudes of the problem solver and
attempt to identify sub-skills and prerequisites of diagram
drawing proficiency. In addition, the clinical approach
can allow for characterization of the student who works
more readily and more effectively with a visual approach to
prob1ems.
Longer term, instructional interventions, of one
semester to several years, hold the key to learning more
about improving diagram drawing ability. If successful,
these instructional programs will give us new populations
of students to study who have developed their diagram
drawing abilities.
Implications for Present Study The research on diagrams in
problem presentations, more so than the research examining
the effect of student diagram drawing on problem solving
performance, has indicated the potential benefits of the
drawing of high quality diagrams. Instructional

44
interventions which attempted to improve students abilities
in diagram drawing have been uninformed as to the
components of such abilities and to appropriate
instructional methodologies. As the two initial research
questions, set forth in Chapter I, are reexamined in light
of the research reviewed in this chapter, it becomes clear
that few studies have addressed these questions even
indirectly .
1. What factors affect whether a student chooses to
draw a diagram when a diagram could be helpful? Although
this question is not addressed directly, McKee's study
(1983) found evidence that students created poor quality
diagrams. This might suggest that their inability to
create useful diagrams may restrict their making a choice
to draw a diagram when a diagram is indicated. Whimbey
(Whimbey & Lochhead 1980), Schoenfeld (1983) and Peck's
(1984) discussions of student conceptions of mathematics
suggest another area to examine in investigating factors
that affect student choices.
2. What skills and knowledge are required to draw
useful diagrams for solving mathematical problems? This
question has also not been addressed directly. McKee
(1983), Schultz (1983), Botsmanova (1972a) and Larkin
(1983) in their descriptions of characteristics of
effective diagrams imply that students must be able to
identify the mathematical relationships in a problem and %
i

45
then to represent them schematically. This does not go
very far in breaking down such abilities.
McKee also focuses attention on the skill of labeling
the diagram effectively.
Schoenfeld (1979), in writing about heuristic
strategies in general, of which diagrm drawing is one,
identified three components of being able to use a
s trat egy :
1. Know how to use it. 2. Understand the problem sufficiently to apply
the heuristic correctly. 3. Think to apply the heuristic.
His work also suggests a focus on the importance of
metacognitive skills in diagram drawing.

CHAPTER III
METHODOLOGY
As seen in Chapter II, the literature review found
little past work which bears directly on the two research
questions which motivated this study. Therefore, it was
important, at the outset of this study, to explore the
domain in an open-ended manner. The research consisted of
two phases; an exploratory study, involving individual
interviews, followed by a main study which featured a three
group experimental design.
The Exploratory Study
Purpose The purpose of the exploratory study was to
investigate the following research questions
1. What factors affect whether a student chooses to
draw a diagram when a diagram could be helpful?
2. What skills and knowledge are required to draw
useful diagrams for solving mathematical problems?
It had been a consensus observation of the instructors
and researchers in the Cognitive Processes Research Group
at the University of Massachusetts that students in the
remedial Math 010 course made extremely infrequent use of
diagrams to help them solve problems. If diagram drawing
46
47
is considered a useful strategy for problem solving, than
it is important to know to what extent students are
choosing not to make use of this strategy and to what
extent they are unable (i.e. do not have the skills) to use
the strategy as well as what other factors contribute to
their choice.
Past studies had attempted to relate diagram drawing
to spatial abilities, to mathematical abilities, and to
problem solving success. However, research had not looked
at the specific skills that are necessary to represent
mathematical problems spatially.
The two research questions were open questions, not
constrained by particular hypotheses, which were best
answered by observing novice problem solvers solving
problems and drawing diagrams and by questioning them on
their choices, beliefs, feelings, and difficulties.
Subjects Eleven student volunteers from Math 010 at the
University of Massachusetts were paid to participate in the
study. The Math 010 course is the lowest level mathematics
course taught at the University. Its emphases are the
development of problem solving skills, the remediation of
arithmetic concepts and skills, and the improvement of
study skills. The course carries no graduation credit.
Students were told that the study had to do with
problem solving and that they would be required to attend

48
two sessions; the first, a two hour session involving
written problem solving and the second, a one-hour
video-taped interview. No level of competence was
required. We were only interested in how they approached
and thought about the problems.
Procedure Each student, who knew only that the research
would relate to problem solving, was given two sets of
problems to be solved as paper and pencil tasks. The first
set asked the studet to show all work, while the second set
asked that all problems be solved by drawing a diagram.
The second set was administered only after the first set
had been collected. The student had an hour to do each
set. The student, then, returned on another day for a one
hour video-taped interview.
In the videotaped interview, students were asked to
explain their written work and were asked to draw diagrams
for problems from the first set which had not been
previously solved using diagrams. They were asked to
explain their choices to use or not to use diagrams.
Attention was paid to affective factors and
student-reported effects of past mathematics instruction.
Affective factors included mathematics confidence or
anxiety and motivation in problem solving.

49
Inst r umentation
Problem Sets: Problems used in the exploratory study
(see Appendix A) had been collected from various sources
and could all be solved by manipulating a diagram or by
manipulating a diagram and doing some routine calculations
which were generated by the diagram. Several of the
problems were taken from those used by McKee (1983).
Interview Questions: Interview questions were
basically free-form. Students were asked to explain their
choices (to draw or not draw a diagram), think out loud,
and to describe the difficulties that they encountered.
When a subject's work seemed blocked, the experimenter
tried out suggestions that seemed appropriate.
Questions on affect and beliefs included:
1. How do you feel about mathematics? Why do you
think you feel this way?
2. What makes someone a good mathematics student?
3. Do you tend to draw diagrams when you solve
mathematics problems (why or why not)?
4. Describe your experiences of drawing diagrams in
this study?
Results The analysis of students' written work, as well as
videotapes of the interviews resulted in the creation of
two descriptive models of diagram drawing for problem
solving.

50
Model One: Five characteristics of problem solvers
seem to affect whether they choose to draw a diagram and
whether they draw useful diagrams. They are:
1. Conceptual understanding of the mathematics involved in
the problem: In order for students to recognize and
represent schematically the mathematical structure of the
problem, they must have an understanding of the mathematics
involved. Rote algorithms, which can often be applied even
when such understanding is lacking, are generally not
helpful in creating a diagrammatic representation. (E.g.
Fraction operations can be computed with little
understanding, however, an understanding of basic fraction
concepts is often required in diagram drawing.)
2. Diagram drawing skills and experience: There are
specific skills which are important to successfully create
and manipulate a diagram. Some of these skills are also
applicable when using other problem solving strategies
while others are particular to diagram drawing. Particular
skills are identified in Model Two, below.
In addition to diagram drawing skills, the experience
that the student has with diagram drawing gives the student
a sense of how diagram drawing works and what its benefits
are. This experience leads to the "metacognitive" skill
(Schoenfeld 1983) of thinking to draw a diagram. For
example, experienced geometry problem solvers, when faced
51
with problems that ask them to find the size of an angle, \
procede to label all of the known angles with numbers or
variables, as well as all congruent line segments in hopes
of "seeing" the value of the angle in question or a key
relationship to it. Without the expectations of how a
diagram might help, they would be unlikely to procede in
this way.
3. Conceptions of mathematics: The beliefs that students
have about mathematics strongly influence the likelihood of
their using a diagram. For some students, attempting to
draw a pictorial representation makes no sense. If
students believe that mathematics is unrelated to the real
world, that it is a "black box" which can never be
understood, and that there is one correct way to do a math
problem, then they are unlikely to try to represent the
problem diagrammatica11y in order to explore solution
possibilities.
4. Self-concept in mathematics: Strongly tied to the
students' beliefs about mathematics are their beliefs about
themselves as mathematics students. Key to choosing to use
diagrams is a belief that "I can figure out math problems
and understand each step of the solution . To the extent
that the student feels a sense of personal power, a sense
of control in mathematics, she is more likely to try to
represent the problem in a diagram. If the student feels

52
that the power lies outside of herself, "the teacher hasn't
shown me how to do that", or helpless in solving problems,
"I'm just not good at word problem", she is unlikely to see
any value in drawing a diagram. In fact, the challenge to
draw a diagram becomes another frustrating problem to be
avoided.
*s
5. Motivation to solve the problem correctly: Seemingly
obvious, but important to mention, is the student's
motivation to solve the problem correctly. For the low
ability student, who is anxious when solving a-math
problem, the motivation may be to finish with the problem
(ending the anxiety) and move on, rather than to figure out
how to solve it correctly. For this student diagram
drawing appears to be an unnecessary, time consuming step
which only increases the struggle with the problem.
Finding a neat algorithm, even if it yields incorrect
solutions, more directly serves the goal of finishing with
the problem.
Model Two: The following are skills and procedures
which seem to contribute to successful diagram drawing.
1. Represent all relevant information.
a. Determine relevant aspects of the problem
situation (relevant concepts as well as given
information).

53
b. Represent everything spatial1y if possible.
(Avoid the use of arithmetic symbols in the
diagram (+ - x / =)).
c. Draw unknown quantities into the diagram keeping
track of the unknown (arbitrary) aspects of the
diagram. %
2. Create one integrated diagram with related parts.
a. Avoid creating several unrelated diagrams for
different aspects of the information.
b. Operate on the diagram so that the diagram
reflects the changes in the problem situation.
c. As each new piece of information is represented,
relate it as much as possible to the already
represented information.
3. Label completely.
a. Label each part of the diagram descriptively (what
does it repres ent) .
b. Label all known quantities (include those which
become known as you label others).
c. Create and label equal parts wherever possible.
4. Draw multiple representations.
a. Create alternative representations
(1) when unsure how to represent the
information.

54
(If unable to decide on an appropriate
representation, draw something.)
(2) when the figure introduces a specificity
that has not yet been determined (e.g. do
two areas overlap?)
b. The introduction of new information may
necessitate a new diagram.
c. The diagram evolves
(1) to make a more effective/he 1pfu1 diagram.
(2) to give the diagram more accurate
proportions.
5. Verbalize about what is represented in the diagram and
what needs to be represented.
6. Check the accuracy of your diagram.
Main Study
Purpose The purpose of the main study was to verify and
extend findings that were produced in the exploratory
study. It focused on factor #2 of Model One, the subskills
of diagram drawing. The choice to focus on just one of the
five factors permitted more in depth work in that area.
The other four factors of Model One deserve to be studied,
as well, in future studies. The main study was designed to
55
investigate the following, modified set of research
questions:
A. Are the subskills identified in the exploratory
study (Model Two above) important in the creation of useful
diagrams?
B. How important are control (metacognitive) skills
to the creation of high quality diagrams, particularly the
ability to think to use the various subskills and to choose
appropriately among available subskills?
C. What effect does the problem context, geometric
versus algebraic, (defined in Chapter One) have on the
quality of the diagrams that are drawn?
D. What important skills and knowledge were not
identified during the exploratory study?
E. What are the difficulties which prevent successful
diagram drawing?
The research hypotheses which correspond to these
questions, are presented in the section following the
description of the "Procedure."
Subjects Eighteen volunteers from precalculus classes at
the University of Massachusetts were paid to participate in
this study. The remedial mathematics population used in
the exploratory study was not used because some diagram
drawing is done in the remedial classes which could
interfere with the results of this study.

56
Procedure As in the exploratory study, standard algebra
problems which can be solved with a diagram approach were
used. (See Appendix B .)
The structure of the Heller and Reif (1984) paradigm,
which had been introduced in the area of physics mechanics
problems, provided the' basis for the methodology employed.
The Heller/Reif design, began with a pretest of each
subject in an individual interview format. The subjects
were randomly assigned to one of three groups: an
experimental group, a modified experimental group, and a
control group. The control group repeated the pretest
procedure, using a parallel form of the test, one week
later while the other two groups received experimental
treatments.
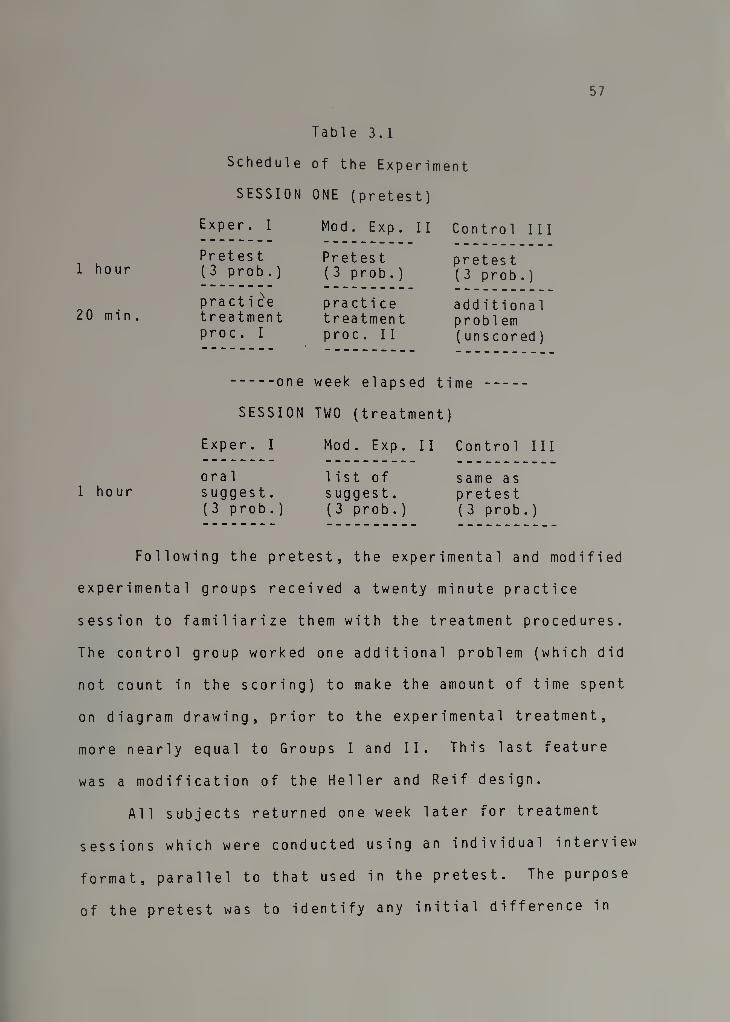
57
1 hour
20 min.
1 hour
Schedule
SESSION
Exper. I
Pretest (3 prob .)
practice treatment proc. I
.one
SESSION
Exper. I
oral suggest. (3 prob.)
Table 3.1
of the Experiment
ONE (pretest)
Mod. Exp . II
Pretest (3 prob .)
practice treatment proc. 11
Control III
pretest (3 prob .)
additional problem (unscored)
week elapsed time -
TWO (treatment)
Mod. Exp. II Control III
list of same as suggest. pretest (3 prob .) (3 prob .)
Following the pretest, the experimental and modified
experimental groups received a twenty minute practice
session to familiarize them with the treatment procedures.
The control group worked one additional problem (which did
not count in the scoring) to make the amount of time spent
on diagram drawing, prior to the experimental treatment,
more nearly equal to Groups I and II. This last feature
was a modification of the Heller and Re if design.
All subjects returned one week later for treatment
sessions which were conducted using an individual interview
format, parallel to that used in the pretest. The purpose
of the pretest was to identify any initial difference in

58
skill among the three groups and to permit a measurement of
improvement for each group. The three groups could than be
compared to look for different effects of the experimental
treatments on diagram drawing.
During the pretest and treatment sessions, all
subjects were giv^n a set of three problems for which they
were asked to draw the most complete and useful diagrams
that they could. Subjects were asked to "think out loud"
and reminded to do so during the interviews.
As mentioned in chapter one, Heller and Reif used
external control directions to guide the subjects' work in
a step by step fashion. Since successful diagram drawing
for algebra problems does not seem to follow a particular
sequence, the step by step directions were replaced with
"suggestions" that were made at what the experimenter
deemed appropriate times. The list of external control
suggestions was created based on Model Two (see Appendix
C).
During the treatment sessions, Group I was given the
above control suggestions orally by the experimenter. In
so doing the experimenter made use of his own control
knowledge, knowledge of when the particular suggestions
might be appropriate. His interventions were limited to
those listed in Appendix C.
Group II subjects received a written list of the
suggestions and were reminded, during their work on each
59
problem, to refer to the list for help. They received the
same suggestions as Group I but did not benefit from the
control knowledge of the experimenter who made decisions of
when to use each suggestion for Group I.
Group III, the control group, received no
interventions or assistance of any kind. Their treatment
interview was identical to the pretest interviews.
Subjects were not asked to get an answer to the
problem. Emphasis was always on creating complete and
useful representations of the problem. The lack of focus
on the answer was designed to take the pressure off the
subjects that exists when work is either "right" or "wrong"
and to allow subjects to focus on the task of drawing an
effective diagram. Pressure to obtain an answer might have
increased subjects resistance to giving up the more
familiar algebraic algorithms and mental calculations to
comply with requests that they attempt a less familiar
approach, diagrams.
Experimental Hypotheses In this section, research
questions A, B, and C are listed with the hypotheses which
correspond to each question. From these general statements
of the hypotheses, null hypotheses were created as a basis
for statistical analyses. Research questions D and E are
not included in this section since they led to open ended
videotape analysis rather than specific hypotheses.

60
Investigation of research questions D and E are discussed
in the section below, "Analysis of Treatment Interviews."
1. Research Question A: Are the subskills identified
in the exploratory study (Model Two above) important in the
creation of useful diagrams?
HI. The subskills identified in the exploratory study
lead to improved diagram drawing.
According to hypothesis 1, subjects in treatment Group
I should show greater improvement from pretest problems to
treatment problems, than subjects in the control group
(Group III). This result is based on the predicted benefit
of the oral suggestions which encourage the use of
subskills from Model Two. The null hypothesis, therefore
i s :
Hoi: Group I and Group III will show no differences
in improvement (treatment scores minus pretest scores)
for the measures of diagram quality: type,
completeness, labeling, and accuracy and the scores
representing the total of the four measures.
2. Research Question B: How important are control
(metacognitive) skills to the creation of high quality
diagrams, particularly the ability to think to use the
various subskills and to choose appropriately among
available subskills?

61
H2. An important factor in the successful
implementation of the diagram subskills outlined in Model
Two is the metacognitive ability to decide when to use each
skill.
Experimental hypothesis 2 suggests that improvement in
diagram drawing performance requires both the skills
outlined in Model Two and the metacognitive ability to
decide when to use each skill. Based on this hypothesis,
Group I, who received not only the oral suggestions but
also the metacognitive decisions of the experimenter,
should draw higher quality diagrams than Group II, which
had access to the suggestions (the written list) but not
the decisions of the experimenter as to when to use each
skill. The corresponding null hypothesis is:
Ho2: Group I and Group II will show no differences in
improvement (treatment scores minus pretest scores)
for the measures of diagram quality: type,
completeness, labeling, and accuracy and the scores
representing the total of the four measures.
3. Research Question C: What effect does the problem
context (geometric versus algebraic) have on the quality of
the diagrams that are drawn?
H3. Higher quality diagrams are created for problems
with geometric contexts than for problems with algebraic
contexts.

62
Based on McKee's work (1983), it was predicted that
subjects would draw better quality diagrams for problems
with geometric formulations than for problems with
algebraic formulations. Statistical analysis was based on
the null hypothesis:
H°3: Measures of type, completeness, labeling, and
accuracy of diagrams, as well as the total score for
these four criteria, are not affected by whether the
problem is formulated in an algebraic or geometric
context.
Instrumentation
Pretest and Treatment Problem Sets: The six pretest
and treatment problems (see Appendix B) were selected from
McKee's study (1983). McKee's problems were used for the
following reasons:
1. Data existed on the relative difficulty of the
problems (from McKee's research) which was useful in
creating two parallel forms of the problem sets.
2. McKee had developed criteria for evaluation of the
quality of diagrams drawn for these diagrams.
3. McKee had developed "geometric" and "algebraic"
formulations for each problem (see Chapter Two) which
allowed for further analysis of the effect of these
formulations.
63
All of these problems were standard algebra problems,
which subjects taking college precalculus could be expected
to solve algebraically. Two matched sets of problems were
created (sets A and B) based on problem difficulty
according to McKee's data, and controling for algebraic
versus geometric problem formulations. Half the subjects
in each group received set A for the pretest and set B for
the treatment. The other half of the subjects received the
sets in the reverse order.
Criteria for Evaluation of Diagram Quality: The
scoring criteria were based on McKee's four categories.
However, two of her categories, completeness and labeling
were scored on a 0 to 4 scale rather than McKee's 1 to 3
scale to allow for more sensitive scoring in these areas.
Samples of diagrams for the six problems were collected and
analyzed by the experimenter in order to specify particular
criteria for awarding points for each category for each
problem. These criteria are described in Appendix D.
External Control Suggestions: The list of external
control suggestions (Appendix C) was created by the
experimenter from Model Two which resulted from the
exploratory study.
Methods of Data Analysis
Analysis of Experimental Study (Questions A,B, and C)
The quality of each diagram was scored by the experimenter

64
and another graduate student using a modification of the
point system developed by McKee (1983). (See Appendix D
for a detailed description of the scoring.) A correlation
of the scores of the two scorers was computed to determine
the reliability of the scoring system. Scoring resulted in V
scores for each subject on both the pretest and treatment
problems for each measure on each problem. Pretest scores
were compared to determine whether the groups were
equivalent at the outset.
Difference scores (treatment score - pretest score)
were computed for each group on each measure, reflecting
improvement from the first session to the second. The
differences for each group were compared on each measure
and the total score. Analysis of variance (ANOVA) was used
to compare the three groups. Where significant F values
were obtained, Student t-tests were used to compare the
groups two at a time.
Analysis of Treatment Interviews (Questions D and E)
The second part of the analysis was a study of the
videotapes from the treatment sessions to determine the
frequency of the various suggestions given to Group I and
the types of difficulties which existed despite the
assistance provided by the external control suggestions
(Appendix C). Such difficulties reveal weaknesses of the
experimental model and/or highlight other important factors
65
(i.e. affective factors and the effects of past experience)
that contribute to diagram drawing success.
The open-ended investigation, begun in the exploratory
study, was continued in the main study in response to
questions D and E. This investigation was not based on
particular hypotheses.
Research question D: What important skills and
knowledge were not identified during the exploratory study?
Research question E: What are the difficulties which
prevent successful diagram drawing?
The investigation consisted of analysis of the
videotapes of the treatment sessions from the experimental
part of the study. Analysis was done by the experimenter
and focused on the critical points of each diagram attempt.
A critical point was when a subject came up against an
obstacle in creating his representation and either overcame
it, failed to negotiate the obstacle, or created an
inaccurate diagram as a result of attempting to negotiate
the obstacle. These points focused the experimenter on
skills used as well as the difficulties encountered by the
subjects. These observations were then examined for skills
and difficulties that were common to more than one subject.
Methodological Assumptions The research design was based
on the following assumptions:
66
1. Improvement due to the oral suggestions indicates a
verification of at least some of the subskills contained in
Model Two.
2. Differences in scores between treatment Groups I
and II are due to the metacognitive information provided by
the experimenter.
3. Subjects' performance on the tasks given accurately
reflect their diagram drawing abilities.
Limitations of the Study The following limitations were
inherent in the design of the study:
1. All interviews were analyzed by the experimenter
only, thus observations were restricted by the
experimenters perceptions and influenced by his biases.
2. The number of subjects in each group was limited
to permit the use of pre and treatment interviews and the
examination of three treatment groups. As a result, the
statistical results are less sensitive than they would have
been with a larger sample.
3. The questions asked during the treatment
interviews were considerably restricted. In depth probing
into the thought processes of the subject could have
positively affected the clarity of the subject's thinking,
thus interfering with the experimental (statistical)
results.
67
4. The experimenter's oral suggestions to Group I may
have had some additional affects. Subjects may have spent
more time on each problem as a result of the suggestions.
They also may have felt more supported and therefore more
confident. Suggestions towards the end of their work on a
given problem may have signaled them that they could still
improve the diagram.
Correspondingly, to the extent that subjects in the
control group (III) experienced the pretest as anxiety
provoking, they had no external help on which to base hope
that their second diagram session would be more successful.
5. Subjects had only limited time to become familiar
with diagram drawing, the pretest and the treatment
session. For most of them this was the first time that
they were engaged in diagram drawing tasks.
CHAPTER iv
DATA ANALYSES AND RESULTS
This chapter focuses on the results of the main study
and interpretations of those results in light of the five
research questions which motivated the study. The results
of the experimental study are treated first followed by the
results of the analysis of the videotaped interviews.
Results of Statistical Analyses
Statistical analyses were done using BMDP Statistical
Software ( 1983) .
Preliminary Analyses
Equivalence of Test Forms: Although possible
differences in the difficulty of Form A and Form B problem
sets were controled for in the design of the study by
staggering their use within each group, the scores on the
two forms were compared for all subjects using t-tests (see
Table 4.1). No significant difference in student
performance was found on any of the four measures of
diagram quality nor on the total score, suggesting that
Form A and Form B were indeed closely matched.
Interscorer Reliability: The consistency of scores
given by the two scorers was checked using a Pearson-r.
The mean of correlations for all variables was .868
68

69
(standard deviation of .110 and range of .661 to 1.000)
indicating that scores assigned by both the experimenter
and the second scorer were very close (see Appendix E for
r-values). All scores reported in this chapter are based
on the mean score'for the two scorers.
Table 4.1
Comparison of Test Form A and Form
Measure p-va1ues
M (total) . 695 Ml (type) .119 M2 (completeness) . 643 M3 (labeling) .153 M4 (accuracy) .213
Equivalence of Groups: Table 4.2 gives the mean
scores and range of possible scores for each treatment
group for the total (M) and separately for each measure of
diagram quality.
An analysis of variance was used to evaluate the null
hypothesis that there was no difference between groups on
the pretest. This hypothesis was rejected on the basis of
an F-score of 6.32 (p = .008). A two-tailed t-test was
used to find where those differences occured. Group II,
compared to each of the other groups, was significantly
different (I vs.II -- p < .01, II vs. Ill -- p < .05).
There was no significant difference between Group I and
Group III. This indicated that differences in treatment']

70
scores or in impro v emen t scores for Group II could not be
meaningfully compared to those for the other two groups.
The analysis therefore reflects only a two group
comparison, the experimental (Group I) versus the control
TABLE 4.2
Mean Scores, Standard Deviations and Range of Possible Scores
PRETEST SCORES
Measure Group I Group II Group III Possible
M (total) 9.02 (0.86)
11.00 (1.29)
9.60 (1.03)
2-14
Ml 2.64 (0.50)
2.90 (0.25)
2.76 (0.45)
1-3
M2 2.17 (0.55)
2.83 (0.71)
2.29 (0.48)
0-4
M3 2.07 (0.43)
2.52 (0.63)
2.05 (0.42)
0-4
M4 2.14 (0.31)
2.73 (0.42)
2.50 (0.30)
1-3
TREATMENT SCORES
M 12.43 (1.15)
12.17 (1.59)
11.05 (0.94)
2-14
Ml 3.00 (0.00)
3.00 (0.00)
2.79 (0.39)
1-3
M2 3.57 (0.32)
3.62 (0.34)
2.83 (0.55)
0-4
M3 3.26 (0.64)
2.79 (1.06)
2.79 (0.39)
0-4
M4 2.60 (0.27)
2.76 (0.32)
2.64 (0.31)
1-3
group (Group III).

71
Research Question A Are the subskills identified in the
exploratory study (Model Two in Chapter Three) important in
the creation of useful diagrams?
\
Hoi: Group I and Group III will show no differences
in improvement (treatment scores minus pretest scores)
for the measures of diagram quality: type,
completeness, labeling, and accuracy and the scores
representing the total of the four measures.
The effect of the experimental treatment was analyzed
by comparing the improvement scores (treatment score minus
the pretest score) for the experimental and control groups.
Table 4.3 shows the comparison of total score and scores on
each measure (Groups I vs. Ill) using a one-tailed t-test.
Table 4.3 indicates a significantly greater
improvement for the experimental group (I) than for the
control group (III), based on total scores (p <.01).
Looking at individual measures, we find that the only
significant difference exists in the category of diagram
completeness (p <.01). Therefore, the null hypothesis is
rejected for the total score and for diagram completeness.

72
TABLE 4.3
Group I Versus Group 111
Measure Group I Group III p-va1ue s i g n i f
M (total) 3.40 1.45 .005 * * (1.35) (1.04)
Ml .38 .02 .054 (.50) (.06)
M2 1.40 .55 . 008 ** (.74) (.30)
M3 1.19 .74 .166 (.94) (.71)
M4 .45 .14 .058 (.33) (.35)
* = significant, p < .05 * * = highly significant, p < .01
Research Question B How important are control
(metacognitive) skills to the creation of high quality
diagrams, particularly the ability to think to use the
various subskills and to choose appropriately among
available subskills?
Ho2: Group I and Group II will show no differences in
improvement (treatment scores minus pretest scores)
for the measures of diagram quality: type,
completeness, labeling, and accuracy and the scores
representing the total of the four measures.
Null hypothesis 2 (Ho2) could not be evaluated
reliably due to the lack of equivalent groups at the outset

73
(Group I versus Group II). The greater improvement of
Group I is not meaningful since they were weaker than Group
II on the pretest (see M total in Table 4.2 above).
Research Question C What effect does the problem context
(geometric versus algebraic) have on the quality of the
diagrams that are drawn?
Ho3: Measures of type, completeness, labeling, and
accuracy of diagrams, as well as the total score for
these four criteria, are not affected by whether the
problem is formulated in an algebraic or geometric
context.
T-tests were used to compare the measures of diagram
quality for geometric context problems with those for
algebraic context problems. Only the two problems in each
problem set which had parallel problems in the other set
were used in the analysis (Form A problems 1 and 2 and. Form
B prob1ems 2 and 3) .
Form A Form B
1. The sum of the measures of the sides of a triangle is 35 inches. One of the sides is 4 times longer than the second side and 1 inch longer than the third side. What are the lengths of the sides?
2. The sum of the ages of three children is 26. One of the children is 3 times older than the second child and 2 years older than the third child. What are the ages of the children?
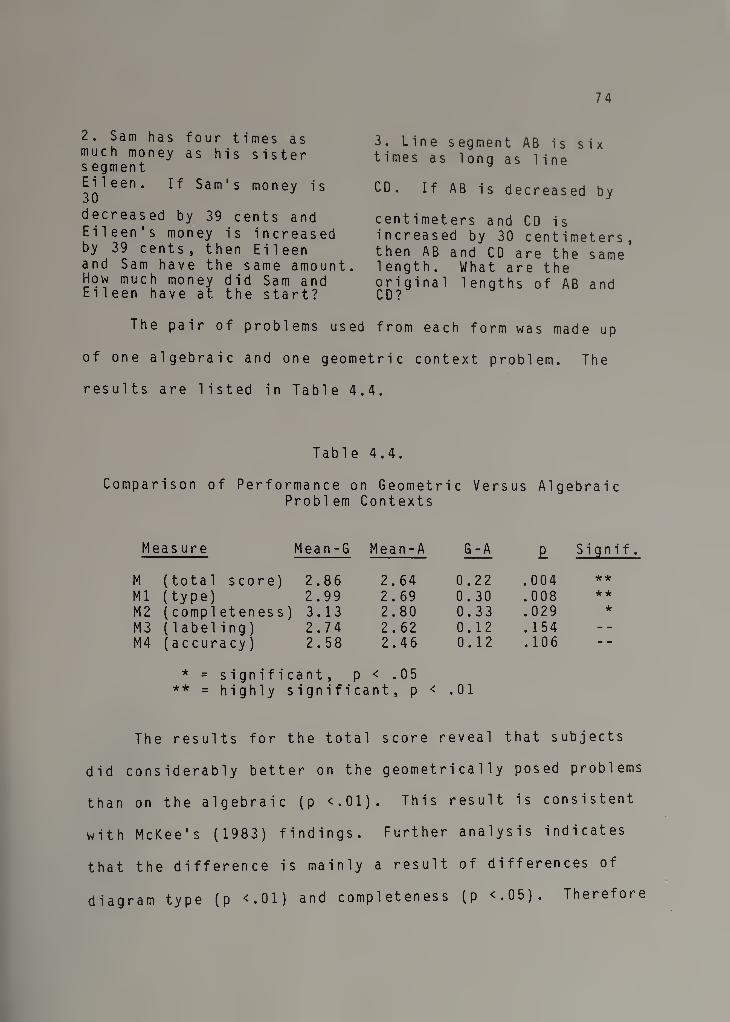
2. Sam has four times as much money as his sister s egment Eileen. If Sam's money is 30 decreased by 39 cents and Eileen's money is increased by 39 cents, then Eileen and Sam have the same amount. How much money did Sam and Eileen have at the start?
3. Line segment AB is six times as long as line
CD. If AB is decreased by
centimeters and CD is increased by 30 centimeters, then AB and CD are the same length. What are the original lengths of AB and
The pair of problems used from each form was made up
of one algebraic and one geometric context problem. The
results are listed in Table 4.4.
Table 4.4.
Comparison of Performance on Geometric Versus Algebraic Problem Contexts
Measure Mea n -G Mea n-A G-A £ S i g n i f
M (total score) 2.86 2.64 0.22 .004 * * Ml (type) 2.99 2.69 0.30 .008 * *
M2 (comp 1eteness ) 3.13 2.80 0.33 .029 *
M3 (labeling) 2.74 2.62 0.12 .154 M4 (accuracy) 2.58 2.46 0.12 .106 “ “
* = significant, p < .05 ** = highly significant, p < .01
The results for the total score reveal that subjects
did considerably better on the geometrically posed problems
than on the algebraic (p <.01). This result is consistent
with McKee's (1983) findings. Further analysis indicates
that the difference is mainly a result of differences of
diagram type (p <. 01) and completeness (p <.05). Therefore
75
the null hypothesis is rejected for the total measure,
diagram type and diagram completeness.
Observations from Videotapes
Research Question D What important skills and knowledge
were not identified during the exploratory study?
This question is not addressed in this section since
answers to it cannot be directly observed. Important
skills and knowledge must be inferred from the
observations. Therefore, it is treated in the next major
section "Interpretations of Results."
Research Question E What are the difficulties which
prevent successful diagram drawing?
1. Subjects in Group I continued to have the following
difficulties with labeling which were common to the other
groups as well as all groups in the pretest situation:
a. When encouraged to label parts descriptively, they
often focused on numerical labels instead.
b. Descriptive labels, when used, were often
incomplete (e.g. "books" instead of "Jack's books" or
"Barb's age" instead of "Barb's age now."
c. They omitted labels for parts of the diagram that
were either not contained in the given or that were not the
part(s) to be found. Figures 4.1 and 4.2 show examples of
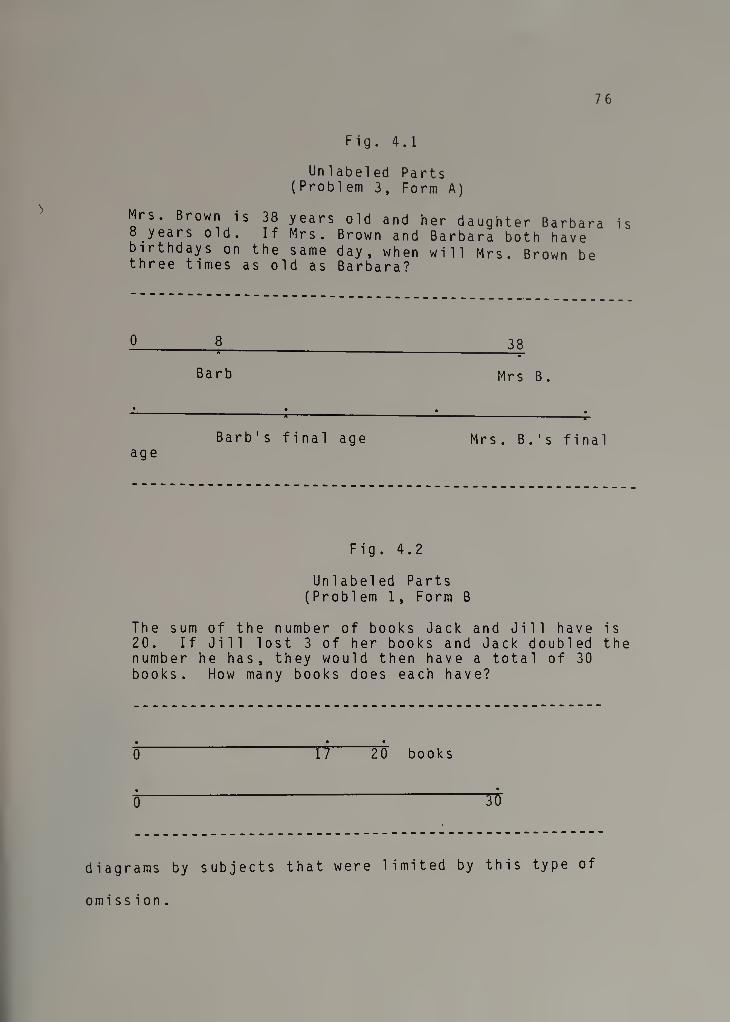
Fig. 4.1
7 6
Unlabeled Parts (Problem 3, Form A)
Mrs. Brown is 38 years old and her daughter Barbara is 8.yearS old. If Mrs. Brown and Barbara both have birthdays on the same day, when will Mrs. Brown be three times as old as Barbara?
Barb Mrs B.
age Barb's final age Mrs. B.'s final
Fig. 4.2
Unlabeled Parts (Problem 1, Form B
The sum of the number of books Jack and Jill have is 20. If Jill lost 3 of her books and Jack doubled the number he has, they would then have a total of 30 books. How many books does each have?
0 • •
IT 20 books
0 IT)
diagrams by subjects that were limited by this type of
omission.

77
The subject who drew the diagram in Figure 4.1
neglected to label the difference between Barb's age and
\ Mrs. Brown's age, which might have provided the key to a
solution. Likewise, the subject who drew the diagram in
Figure 4.2 might have benefited by labeling the difference
between the 17 books that Jack and Jill had (after Jill
lost three) and the 30 books that they had in the end.
2. Subjects represented information implicitly rather than
explicitly.
Fig . 4.3
Implicit Rather than Explicit Representation (Problem 1, Form A)
The sum of the measures of the sides of a triangle is 35 inches. One of the sides is 4 times longer than the second side and 1 inch longer than the third side. What are the 1engths of the sides?
side one side three
The 1" is represented by a difference in length but
does not explicitly appear in the diagram. This seemed to
reduce the likelyhood that the subject would make use of
the 1" as the problem solution proceded.
3. The representing of unknown quantities was difficult for
many of the subjects. They often wanted to try particular
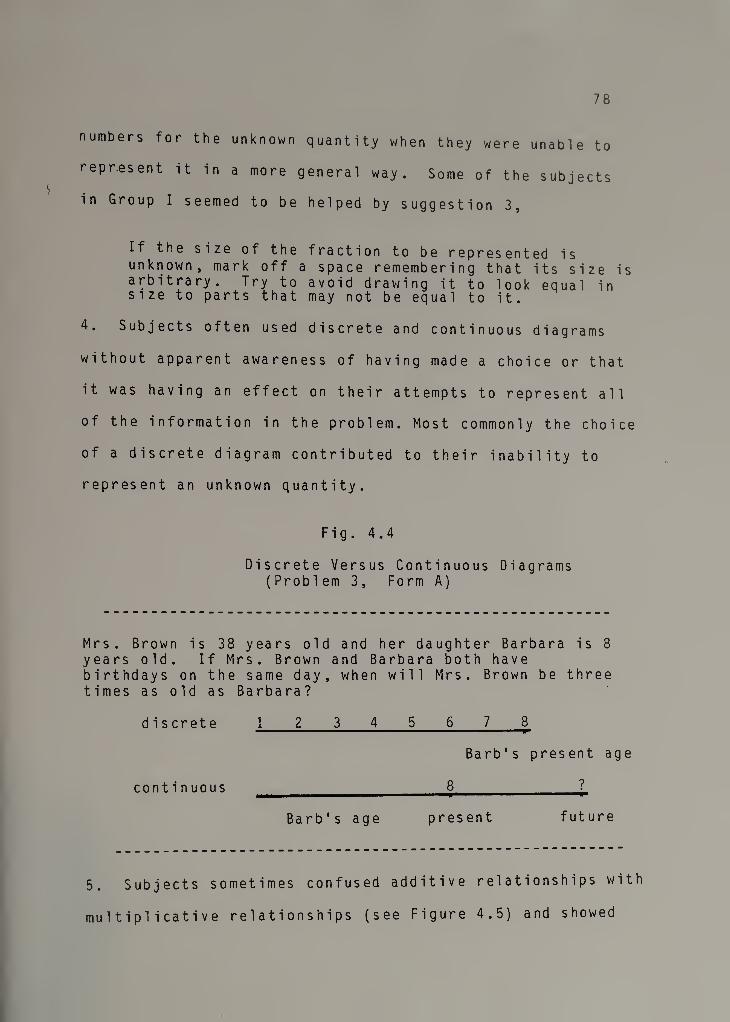
78
numbers for the unknown quantity when they were unable to
represent it in a more general way. Some of the subjects
in Group I seemed to be helped by suggestion 3,
If the size of the fraction to be represented is unknown, mark off a space remembering that its size is arbitrary. Try to avoid drawing it to look equal in size to parts that may not be equal to it.
4. Subjects often used discrete and continuous diagrams
without apparent awareness of having made a choice or that
it was having an effect on their attempts to represent all
of the information in the problem. Most commonly the choice
of a discrete diagram contributed to their inability to
represent an unknown quantity.
Fig. 4.4
Discrete Versus Continuous Diagrams (Prob1em 3, Form A)
Mrs. Brown is 38 years old and her daughter Barbara is 8 years old. If Mrs. Brown and Barbara both have birthdays on the same day, when will Mrs. Brown be three times as old as Barbara?
discrete 1_2 3 4 5 6 7 8
continuous
Barb's present age
8 ?
Barb's age present future
5. Subjects sometimes confused additive relationships with
multiplicative relationships (see Figure 4.5) and showed

79
evidence of difficultly with fraction concepts (see Figure
4.6).
In Figure 4.5 the subject was drawing a diagram to
show that the first child was three times older than the
second child and two years older than the third child.
The multiplicative relationship between the first
child and the second child is represented by three segments
and one segment. However, when she attempts to show that
the first child is two years older than the third child.
Fig. 4.5
Additive Versus Multiplicative Relationships (Problem 2 , Form B)
The sum of the ages of three children is 26. One of the children is 3 times older than the second child and 2 years older than the third child. What are the ages of the children?
First child: _._._._ Second child: _._._ Third child:
she draws the third child's age as one segment (two
segments less than the first child's). The resulting
equivalent representations for the second child's and third
child's ages did not seem to be particularly significant to
the subject.
Figure 4.6 shows an example of the types of
difficulties with fractions that hampered subjects'

80
abilities to draw useful diagrams. Note that the spatial
representation is accurate, however, the labeling of
fractions does not show an apreciation that "one whole"
must be identified and kept constant in order for the
fractions to be meaningful.
Fig. 4.6
Difficulties with Fraction Concepts (Problem 1, Form A)
The sum of the measures of the sides of a triangle is 35 inches. One of the sides is 4 times longer than the second side and 1 inch longer than the third side. What are the 1engths of the sides?
first side
third side
6. Subjects reported at times that they were unclear about
whether it is important that the diagram look accurate. In
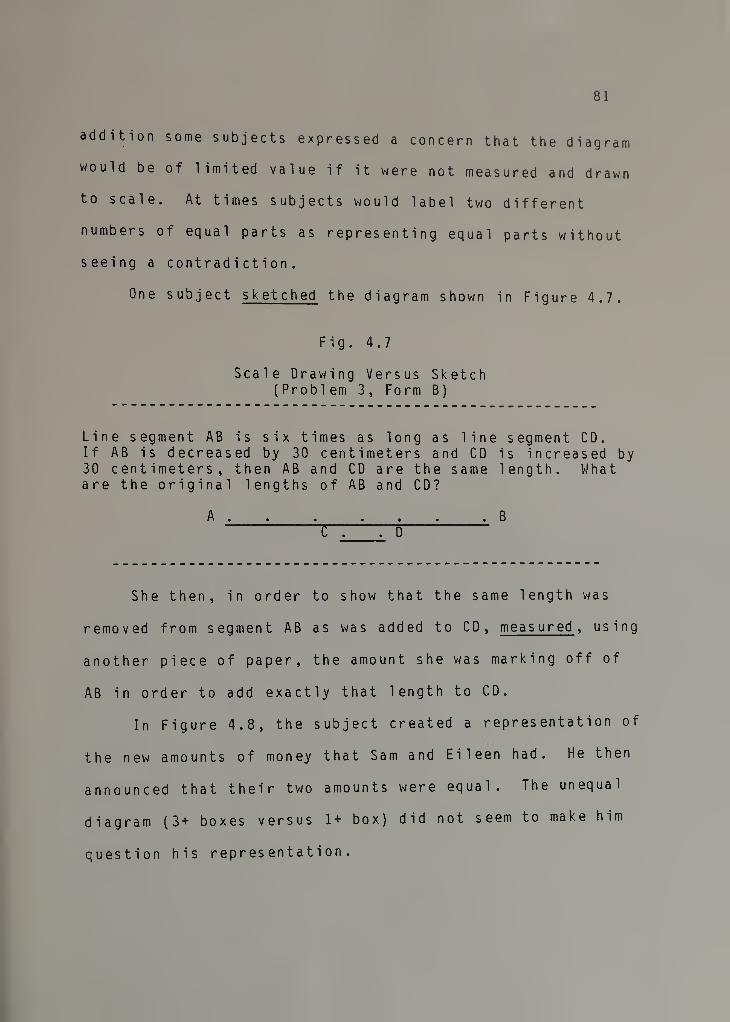
81
addition some subjects expressed a concern that the diagram
would be of limited value if it were not measured and drawn
to scale. At times subjects would label two different
numbers of equal parts as representing equal parts without
seeing a contradiction.
One subject sketched the diagram shown in Figure 4.7.
Fig. 4.7
Scale Drawing Versus Sketch (Problem 3, Form B)
Line segment AB is six times as long as line segment CD. If AB is decreased by 30 centimeters and CD is increased by 30 centimeters, then AB and CD are the same length. What are the original lengths of AB and CD?
A R td
She then, in order to show that the same length was
removed from segment AB as was added to CD, measured, using
another piece of paper, the amount she was marking off of
AB in order to add exactly that length to CD.
In Figure 4.8, the subject created a representation of
the new amounts of money that Sam and Eileen had. He then
announced that their two amounts were equal. The unequal
diagram (3+ boxes versus 1+ box) did not seem to make him
question his representation.

82
Fig. 4.8
Unequal Number of Equal Parts ( Problem 2 , Form A)
Sam^has four times as much money as his sister Eileen. If Sam's money is decreased by 39 cents and Eileen's money is increased by 39 cents, then Eileen and Sam have the same amount. How much money did Sam and Eileen have at the start?
7. Subects failed to make use of information about age that
they could be expected to know. Specifically:
a. Two people's ages increase by the same number of
years during any given time period.
b. The difference between two people's ages remains
constant as they get older.

83
When as a follow-up question at the end of the second
interview, some subjects were asked to write equations for
problem 3 of Form A, many were unable to do so.
Mrs. Brown is 38 years old and her daughter Barbara is 8 years old. If Mrs. Brown and Barbara both have birthdays on the same day, when will Mrs. Brown be three times as old as Barbara?
Commonly they wrote:
x = Mrs. Brown's age y = Barb's age
x = 3y
At this point they would try to substitute in either 8
for y or 38 for x or both. The subjects rejected the
results of these substitutions but proved unable to
identify the source of their difficulties.
8. A number of the subjects came into the study with no
sense of how to represent the four basic arithmetic
operations spatially. For example they did not realize
that they could show the sum of two line segments by
putting them together to form one longer segment or that
the difference between two quantities could be represented
by putting them both on the same segment starting from a
common origin and labeling the lack of overlap as the
difference .
9. Subjects at times repeated strategies that were not
working for them, seemingly unaware that they were making a

84
choice, that it was causing difficulty and that an
alternative might work better.
10. Subjects seemed unaware of what relationships would
lead to the desired information. For example, a subject
who had six equal segments, of which he wanted to know the
length of one segment, seemed to not be aware that if he
could find the length of the six segments together that he
would be able to then determine the length of one segment.
Other Observations
1. The suggestions given most often by the experimenter to
Group I subjects encouraged them to label numerically
(7a,b), label descriptively (6a), check that all
information has been represented (lid), and to check that
the problem has been accurately represented (lie). See
Table 4.5.
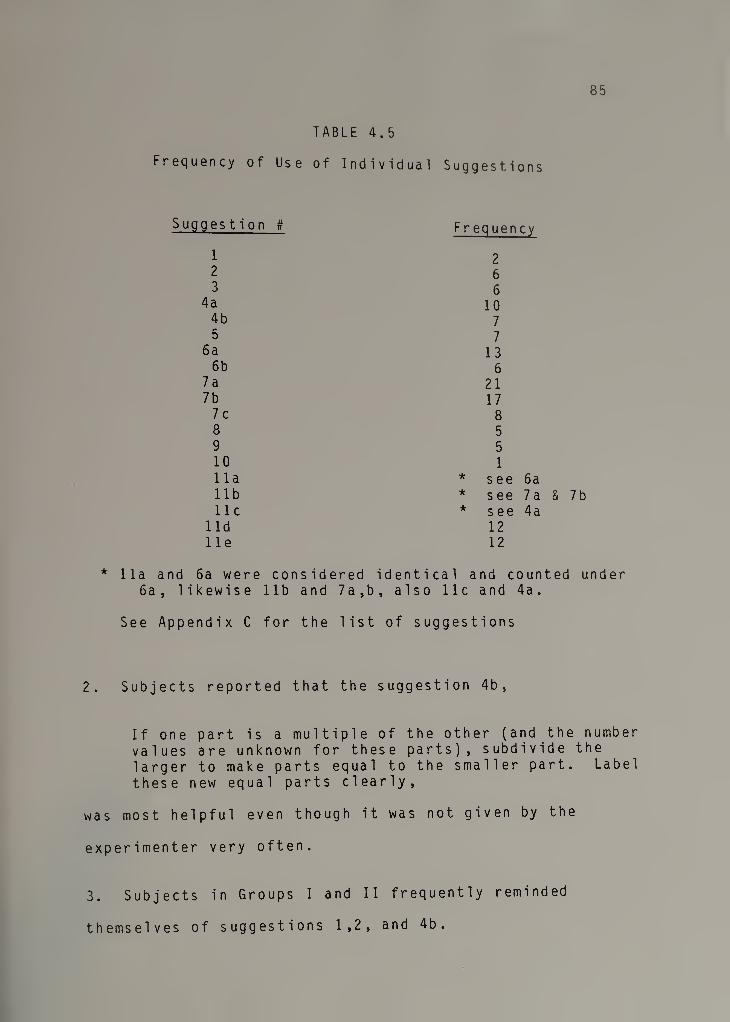
85
TABLE 4.5
Frequency of Use of Individual Suggestions
Suggestion #
1 2 3
4a 4b 5
6a 6b
7a 7b
7c 8 9 10 11a lib 11c
lid lie
Frequency
2 6 6
10 7 7
13 6
21 17
8 5 5 1
* see 6a * s ee 7a & 7b * see 4a
12 12
* 11a and 6a were considered identical and counted under 6a, likewise lib and 7a,b, also 11c and 4a.
See Appendix C for the list of suggestions
2. Subjects reported that the suggestion 4b,
If one part is a multiple of the other (and the number values are unknown for these parts), subdivide the larger to make parts equal to the smaller part. Label these new equal parts clearly,
was most helpful even though it was not given by the
experimenter very often.
3. Subjects in Groups I and II frequently reminded
themselves of suggestions 1,2, and 4b.
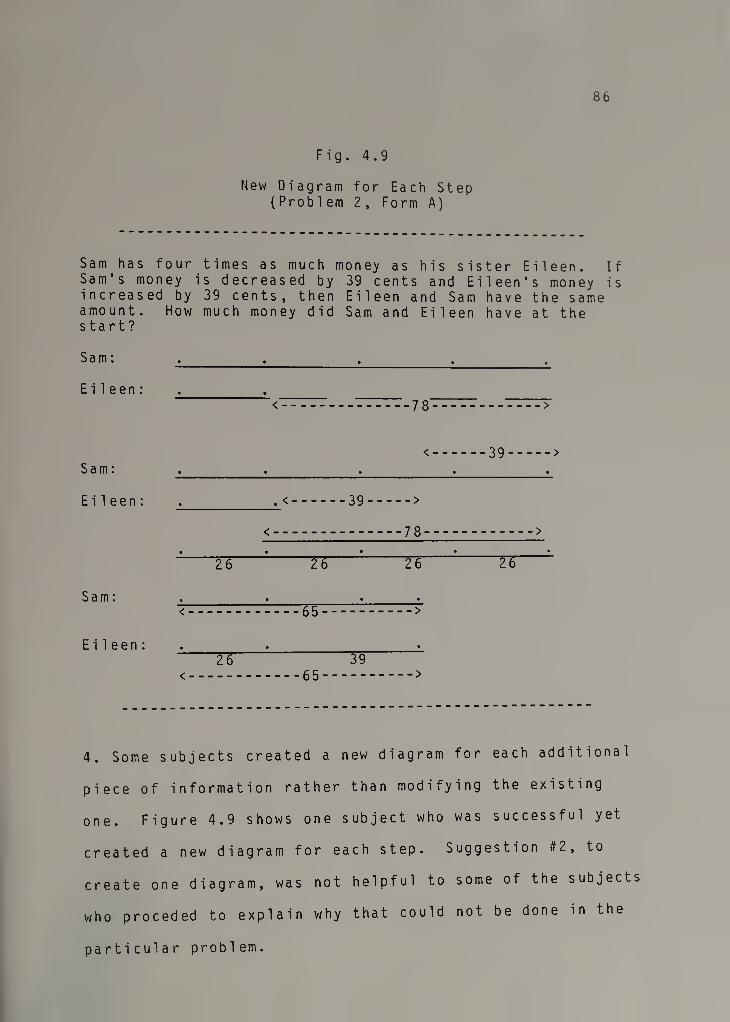
86
Fig. 4.9
New Diagram for Each Step (Problem 2, Form A)
Sam has four times as much money as his sister Eileen. If Sam's money is decreased by 39 cents and Eileen's money is increased by 39 cents, then Eileen and Sam have the same amount. start?
How much money did Sam and Ei1een have at
Sam: • • • •
Eileen: • <- -78. - - >
<. -39-- Sam: • • • • •
Eileen: • .<. -39-
<- ---78- • • • .
26 26 26 26
Sam: • • • •
Eileen:
< -
•
1 1 LO V
O
1 1 | • •
< - 26 39
4. Some subjects created a new diagram for each additional
piece of information rather than modifying the existing
one. Figure 4.9 shows one subject who was successful yet
created a new diagram for each step. Suggestion #2, to
create one diagram, was not helpful to some of the subjects
who proceded to explain why that could not be done in the
particular problem.

87
5. Subjects expressed that the suggestion to avoid the use
of arithmetic signs in the diagrams (#1) was a hindrance
not a help. They showed no indication that they understood
the purpose for its inclusion (to require that
relationships be represented spatially rather than in a
label).
6. Subjects frequently reported that their attempts to
represent these problems diagramatica11y required a mental
effort that surpassed what was required of them in
mathematics classes. ("This strains my brain.")
7. Subjects lacked effective strategies for cutting a
segment into six equal parts. They divided it from left to
right, often winding up with very unequal looking segments.
They seemed to lack the awareness that cutting the segment
into two or into three segments would be a helpful first
s t ep.
8. At times language use seemed to affect the subject's
ability to model the world (operate on the diagram).
Abstract language connected with algorithms seemed to make
diagram drawing more difficult (i.e. subtraction, addition)
while non-mathematica 1 , active language seemed to aid
modeling by diagram (i.e. "takes from one and adds to the
other").

88
9. Subjects, representing the triangle problem (Form A
problem 1), generally drew an equilateral triangle first
and then rejected it in favor of a right triangle.
10. Subjects consistently reported that using diagrams, in
the way that the study required them to, was a task for
which they had little or no previous experience.
Interpretations of Results
Subskills of Diagram Drawing; Model Two
fh_ Re^eapch Question A: Are the subskills identified in
creation°of^usefulU(Hagrams? ™° db°Ve) the
The oral suggestions, presented to the subjects (Group
I), resulted in significantly greater improvement in the
quality of drawings than in those created by subjects in
the control group who received no assistance. This
suggests that at least some of the subskills contained in
the model are lacking in the experimental population and
contribute to the creation of useful diagrams.
Looking at the four separate measures (type,
completeness, labeling, and accuracy), we can get a more
precise idea of the effects of the experimental treatment.
The most clearcut effect was in completeness of the diagram
(M2) (p = . 0 0 8) . The direction to "create one
diagram...instead of several separate ones" (#2)
contributed to the integratedness of the diagram which
89
earned one point out of the four offered for completeness.
The instruction to represent unknown quantities by using an
arbitrary size (#3) and the instruction to represent ratio
relationships by drawing equal parts seemed to offer some
of the subjects a way to represent important information
when they might otherwise have failed to do so or to do so
explicitly. The reminder to check that the "relevant
information" has been represented (# 11 d) also contributed
to the completeness of certain drawings.
The measures for type of diagram (Ml) and accuracy of
diagram, while not significant were close to significant
(p=.054 and p=.058 respectively), indicating that a
difference may reveal itself in a study with a larger
number of subjects. Type, the ability to draw a schematic
representation of the mathematical quantities involved
rather than an illustration of the problem setting, did not
prove to be a significant difficulty for most of the
subjects. Possible differences for type (Ml) were likely
depressed due to the ceiling effect of scores on both the
pretest and treatment problems (Group I--pretest = 2.64,
treatment = 3.00 and Group 111 --pretest = 2.76 , treatment= 2.79
out of a possible 3 points).
While none of the suggestions directly addressed
diagram type, questions related to completeness may have
encouraged some subjects to abandon an illustrative diagram
in favor of a schematic diagram. If a real improvement did

90
take place, it also may have been due to the effect of
working the sample problems (at the end of the pretest
session to familiarize subjects with the list of
suggestions). The sample problems provided subjects the
opportunity to see and work with schematic diagrams.
Experimental subjects showed no significant difference
over control subjects on labeling. This may suggest that
the process of labeling effectively may be a more complex
process which is not generally improved by a simple
intervention of making external suggestions. This is
discussed below under "Metacognition." The final point in
the scoring of this measure was awarded for the labeling of
a derived quantity. The earning of that point indicated
substantial progress towards solution of the problem.
Research Question B: How important are control (metacognitive) skills to the creation of high quality diagrams, particularly the ability to think to use the various subskills and to choose appropriately among available subskills?
It is important to note that subjects in the
experimental group received not only the content of the
suggestions but the benefit of the experimenter's judgement
as to when each suggestion was appropriate. Although
subjects often were unable to make use of the suggestions
and often offered explanations as to why the particular
suggestion was inappropriate in that situation, it is
likely that the metacognitive skills of the experimenter,
91
in deciding when to- try each suggestion, were helpful and
compensated for met a cognitive skills that were not well
developed in this population.
Due to the inequality of subjects assigned to Group II
as opposed to the other groups, it was not possible to
derive conclusive evidence from this study as to the
relative importance of knowing when to use each suggestion.
The question, however, will remain an important one as one
looks to develop diagram drawing abilities in students.
Metacognitive aspects of diagram drawing are discussed
further, below, as part of the discussion of skills not
covered by Model Two.
Algebraic Versus Geometric Problem Contexts
Research Question C: What effect does the problem context (geometric versus algebraic) have on the quality of the diagrams that are drawn?
Consistent with, McKee's work with high school
students, subjects drew significantly higher quality
diagrams for problems with geometric contexts than for
problems with algebraic contexts.
The highly significant difference on diagram type (Ml)
points out an added difficulty of algebraic context
problems. Subjects are less likely to represent an
algebraic context schematically, tending to draw a more
illustrative "picture" rather than an abstract diagram of
the mathematical structure of the problem. This difficulty

92
is considerably less for geometric contexts since an
attempt to draw a "picture" may result in a schematic
representation. This was certainly the case for the two
geometrically posed problems in this study, one involved a
triangle and the other involved line segments. Drawing a
picture of the triangle and of the line segments resulted,
as well, in schematic representat i ons of the lengths of the
sides of the triangle and of the segments. The
corresponding algebraic contexts involved two people's
money and three children's ages. For these algebraic
contexts, subjects, less clear about "what to draw",
sometimes drew representations of the people rather than
spatial representations of the key quantities.
The drawing of schematic diagrams for the geometric
contexts probably permitted the drawing of more complete
diagrams (M2), which may explain much of the difference in
that measure. A diagram which is drawn schematically,
representing the mathematical structure of the problem,
tends to be a better vehicle for representing all of the
important information and relationships.
Labeling (M3) and accuracy (M4) did not seem to be
affected appreciably by whether the problem is stated in a
geometric or an algebraic context. McKee, on the other
hand, found significant differences, as well, for labeling
and accuracy. This can be explained, perhaps, by the fact
that her study was done by large scale paper and pencil

93
measures. Subjects who drew illustrative diagrams may have
realized, at some level, that the diagram was not very
useful and failed to labor further over labeling and
accuracy. Subjects in this study, who were constantly
observed by the experimenter and asked if they had drawn
the most complete and useful diagram that they can,
probably felt some pressure to label their diagrams and
make them accurate.
Other Important Skills
Research Question D: What important skills and knowledge were not identified during the exploratory study?
The Need for Metacognitive Skills: Subjects
frequently reported that the diagram work required more
thinking than was generally demanded of them in mathematics
classes. Rather than simply explaining this by the fact
that diagram drawing is unfamiliar to these subjects, it is
worth looking at this phenomenon in more detail. Besides
the fact that the subjects were not used to thinking
spatially, they were .also not used to solving problems for
which they had no algorithm. In other words, they were
used to solving exercises rather than non-routine problems.
When you do it algebraically, you're not thinking about how the algebra is working, you’re just plugging stuff in. When you do it this way [using diagrams] you understand how it all fits together. [Subject #20]

94
One of the most important and underdeveloped
components of solving nonroutine problems is metacognition
(Schoenfeld 1983). An examination of the difficulties that
subjects showed as they attempted to draw diagrams, points
out some of the metacognitive skills that were needed.
In particular, although the suggestion to label all
parts of the diagram descriptively and numerically were
given more frequently than any other suggestions, the
experimental subjects often did not successfully label all
of the parts in the diagram. They seemed to lack several
aspects of metacognition which were not addressed by the
experimental model :
1. an understanding of the importance of labeling all
parts of the diagram, not just those that represent the
given information or those that represent the quantities
being sought in the problem:
The experienced diagram drawer, when faced with a
problem whose solution is not readily apparent, knows that
the labeling of all parts may result in a convergence of
information which can lead to a breakthrough in solving the
problem. For example in a geometry problem that asks for
the measure of a particular angle, she is likely to label
all known angles, sides and congruent parts, hoping to find
two algebraic expressions for the same angle which would
permit the determiniation of its specific value (i.e. an
angle which is 2x + 90 and also 180 - x) . It is only

95
through experience of this type that the student develops
expectations of the power of thorough labeling of diagrams.
It is possible that the modeling of competent use of
diagram labeling to solve a problem may be helpful to the
novice.
2. the ability to perceive parts or combinations of
parts which have not been labeled:
Often subjects, in response to suggestions to make
sure that all parts have been labeled, looked over the
diagram carefully and reported that all parts were labeled
even though important parts still remained unlabeled. They
seemed to be unable to identify parts which potentially
could be 1abeled .
3. the ability to judge whether a label is
sufficiently detailed [e.g. "books" rather than "Jack's
books"]:
This may, in part, be due to the way labeling of
answers to word problems is taught frequently in schools.
The student often learns that some "unit" is necessary
after the numerical answer (for the purpose of satisfying
the "picky" teacher). As a result an answer such as "4
books" is accepted when "4 books per student" more
accurately describes that quantity.
It should be mentioned that skilled diagram drawers do
not always label everything that they might. However, the
less that is labeled the greater the mental demand to keep

96
track of the parts of the problem. One of the benefits of
drawing a diagram is to reduce the mental load in a problem
(McKee 1983, Newell and Simon 1972). For the subjects in
this study, not labeling parts of the problem often caused
them to excede their abilities to keep track of all the
parts. Perhaps experienced problem solvers develop an
additional metacognitive skill which allows them to monitor
the mental demands of the problem so that they do not
excede their abilities to keep information in their heads.
As is the case with problem solving heuristics,
metacognitive skills seem to include both general skills
and subject specific skills. Thus, some of the
metacognitive demands of diagram drawing are specific to
diagram drawing while some are applicable in problem
solving in general .
The discussion above of metacognitive skills involved
in labeling diagrams revealed both diagram specific skills
(the understanding of the importance of labeling all parts
of a diagram and the ability to identify unlabeled parts)
and general skills (the ability to judge whether a label is
sufficiently detailed). Below are additional metacognitive
abilities whose importance for effective diagram drawing
seems to be indicated by the observations made of the
videotapes.

97
Specific Meta cog n i t i ons : These metacognitive
abilities are specific to diagram drawing and are not
required for other problem solving strategies.
1. The knowledge of what aspects of the diagram are
important:
For some subjects, there seemed to be confusion between
the deductive aspects of diagram solutions and information
that can be gleaned from visual inspection of the diagram.
For example, if one knows that the parts are equal, one can
see by looking at the diagram how many equal parts make up
the larger quantity. On the other hand one cannot conclude
that the parts are equal by looking to see if they look
equal .
Subjects at times reported that their diagram
solutions were limited by the fact that the diagrams were
not measured with a ruler and drawn to scale. This seemed
to show a lack of understanding of how diagrams are used to
advance a solution. Subjects frequently created equal
parts in their diagrams but then failed to look for equal
numbers of those parts when attempting to divide the whole
quantity in half. Uncertainty about what information in
the diagram is useable seems to be a source of confusion to
novice diagram drawers.
2. The knowledge of when to use a particular
strategy:

98
This is made up of thinking to use the strategy and
knowing the domain of utility for the strategy. Subjects
often reminded themselves to avoid arithmetic signs (#1),
to draw one diagram (#2), and to show ratio relationships
by creating equal parts (#4b). The "trigger" for thinking
to use these suggestions seemed to be straight forward and
learned quickly by the subjects. When a subject began to
use an arithmetic sign in the diagram, he often stopped,
realizing that it was suggested that he not do so.
Likewise when confronted with "Sam has four times as much
money as his sister Eileen," subjects seemed able to select
the recently learned strategy of drawing five equal parts,
four to represent the amount of Sam's money and one to
represent the amount of Eileen's money.
Subjects from Group II, who had drawn several diagrams
to represent the information, often when reading over the
list, realized that the suggestion to create one diagram
with all the information was relevant. However, they
lacked the met a cognitive skill to distinguish between two
diagrams which needed to be integrated and one integrated
diagram with two parts. Therefore they sometimes tried to
apply the suggestion where it was not appropriate and at
other times decided that it was not appropriate when it
would have, in fact, provided the relationships between
The latter suggests that they non-integrated diagrams.
99
also lacked the knowledge of how to apply the suggestion in
a broad range of situations.
3. The knowledge of when to use a discrete and when
to use a continuous diagram:
As mentioned in Chapter IV, subjects frequently had
difficulties representing unknown quantities in part
because they had created discrete rather than continuous
diagrams. Where as number-lines or quantitative graphs
are often useful diagrams, such discrete diagrams proved to
be disadvantageous for a number of these problems.
Subjects seemed automatically to use a discrete diagram
based on the type of information that was presented first,
rather than making a conscious and knowledgeable decision.
As a result, they often never became aware of the source of
the difficulty.
General Metacognitions:
1. The ability to monitor one's solution attempts:
Important in all problem solving is the ability to
monitor one's progress, to decide whether a strategy is
working, at what point to abandon it and to be able to
glean information from the abandoned strategy. This
involves an ability to be conscious of one's decisions so
that the unsuccessful ones can be reversed or replaced by
alternatives.
This reflection on one's own process seemed to be
lacking for many of the subjects. The unconscious use of
100
discrete diagrams (discussed in the preceding section) is
one example of the inability to monitor one's work.
Another example was seen in problem 2 Form B:
The sum of the ages of three children is 26. One of the children is 3 times older than the second child and 2 years older than the third child. What are the ages of the children?
Subjects repeated the same sequence of steps (drawing
the 26 year total first) even though that sequence was
making it difficult to successfully represent the
information in the problem.
2. The ability to evaluate one's solution:
Subjects frequently asked the experimenter whether
they had correctly solved the problem. They appeared to be
unable to take the answers which they had generated and
evaluate them in terms of whether they fit for the
requirements of the problem. A solution such as Sam had
$1.17 and Eileen had $.39 would have been rejected ("Sam
has four times as much money as his sister Eileen") if the
subject had had the ability to evaluate his answer.
3. The ability to monitor the memory demands of the
task:
It was postulated above that the expert problem solver
may have the ability to monitor the amount of information
that she must keep in memory. She likely has an
approximate sense of the limit of her ability to do so
effectively and uses external memory (i.e. a labeled

101
diagram, a key for algebraic or calculus expressions) well
before that limit is reached.
In contrast, novice problem solvers in this study
frequently failed to make use of available information
which was not explicitly recorded in the diagram.
Difficulties in Diagram Drawing
Research Question E: What are the difficulties which prevent successful diagram drawing?
Modeling Real World Events with Diagrams Diagram
drawing has been proposed as the necessary bridge to span
the gap that exists between the student's real world
experience and his abstract mathematical work (Botsmanova
1972b). Subjects in this study often demonstrated their
inability to model familiar situations in either their
diagrams or in the follow-up requests by the experimenter
to show algebraic equations.
This lack of ability to model real world events seems
to be due to a limited approach to algebraic problem
solving. These subjects have learned that to solve a
problem one translates the given information into algebraic
symbols and then manipulates the symbols according to so'me
learned procedures which produce an answer. Since this
limited view of algebra is familiar to these subjects while
diagram drawing is not, they tend to try to apply it to
their diagram drawing attempts as well.

102
Several observed behaviors support the notion that
their attempts to draw diagrams is based on their
experience with algebra rather than on a sense of how the
real world phenomena might be represented spatially.
1. In problem 3 of Form A subjects consistently failed
to model the equivalent increase in Barb and Mrs. Brown's
ages, even though they could solve the problem informally.
Mrs. Brown is 38 years old and her daughter Barbara is 8 years old. If Mrs. Brown and Barbara both have birthdays on the same day, when will Mrs. Brown be three times as old as Barbara?
Informally they would say "When Barb is 9, Mrs. Brown
is 39, etc. However, when they attempted to draw the
diagram they failed to even refer to the amount of increase
in the ages, a failure that paralleled their unsuccessful
attempts to write algebraic equations at the end of the
interview. The algebraic approach was limited to the
representation of explicitly described quantities in the
problem. The informal approach was not limited in this way
and, consequently, used more of the available information.
2. Rather than operating on the diagram to model what
happened to the original quantities, the subject created a
new diagram, showing only the result of the last event.
Such a sequence of diagrams seemed to be more
characteristic of the recording of an algebraic solution
than of a visual solution. The language that is used to
describe the phenomenon to be modeled can contribute to its

103
being thought of in more concrete relationships or in more
abstract algorithms.
3. Subjects frequently showed not only that they had
no familiar spatial models to represent basic arithmetic
operations (models that might demonstrate what physically
happens when we add, subtract, multiply, or divide), but
they often had difficulty generating such diagrams.
Subjects were stumped by how to show the sum of two line
segments, not thinking to combine them into one longer
segment. Several students mistakenly interchanged diagrams
representing the sum of two quantities with diagrams
showing the difference of the quantities. Such
difficulties may be the result of trying to draw the
abstract relationship ("how do I draw a plus sign?") rather
than attempting to draw the physical situation ("If this
segment represents the amount of money one child has, and
this one represents the amount of money the second child
has, then to show how much money they both have...").
Partial protocols from two subjects show two
contrasting approaches (see Appendix F). Note that subject
#2 attempts to pull out the quantities in the problem and
represent them without regard for order. Student #1, on
the other hand, used the sequence of events in the problem
to organize the creation of the diagram (focuses more on
modeling the events of the problem).

104
The notion, mentioned earlier, that diagrams can bridge
the gap from real world experience to mathematical
abstraction, is an extension of the popular theory (Hooper
1981) that learning generally procedes from the more
concrete to the more abstract. The learner could procede
from the concrete event, through an intermediate diagram
step, finally to the abstract mathematical representation
(see Figure 4.10). The idea here is that creating a
diagram requires less of a jump in the level of abstraction
than going directly from the concrete situation to the
algebraic expression. The learner is not faced with the
tasks of representing the information and of translating it
into abstract symbols at the same time. The skill of
representing the information in a diagram should therefore
be more easily acquired than the skill of algebraic
symbolization.
Fig. 4.10
Drawing from the Concrete
Concrete -> Diagram —> Algebraic expression
However, the subjects in this study, who have reached
the level of precalculus with virtually no experience with
diagrams, are used to solving problems algebraically,
although not always with competence and understanding.
I

105
Whereas the medium of the diagram is more closely related
to the real world event (less of a jump in abstraction),
these subjects try to draw the mathematical abstractions
that they would normally represent algebraically (see
Figure 4.11).
Fig. 4.11
Drawing from the Abstract
Concrete -> Algebraic expression .> Diagram
Working from the algebraic abstraction back to a
diagram representation may be the most difficult task of
all. Spatial modeling of the abstraction may be a more
difficult problem than the original algebra problem. The
subject is less likely to be successful with that task than
with basing the diagram on the original concrete event.
Difficulties with Mathematical Concepts Subjects
seemed to be limited by poorly developed arithmetic
concepts. In particular they revealed weaknesses in their
understandings of fractions and they confused additive
relationships with multiplicative relationships. Some of
these difficulties might be observable in their algebraic
work as well. However, demanding that they draw diagrams
puts them in a situation devoid of familiar algorithms,
I
106
v/here success seems to be more dependent on understanding
of concepts. Observations of the effect on diagram drawing
of poorly understood mathematical concepts emphasize the
importance of this factor which was described in Model One
(see the exploratory study. Chapter Three).
Indications of Lack of Preparation for Algebra A number of
the difficulties that subjects' had with the tasks in this
study suggest weaknesses which reduce their effectiveness
in algebra as well. In the last section, subjects'
difficulties in representing arithmetic relationships found
in real world problems was discussed. Earlier,
deficiencies in labeling and their lack of general
metacognitive skills were described. There are other
difficulties which also point to weaknesses in the
subjects' foundations for algebra.
1. Subjects showed a lack of appreciation for the
importance of generality. Subjects, when faced with
problem 1 of Form A, frequently drew the triangle initially
as an equilateral triangle. When it turned out to not fit
for the information that they were representing, they
generally drew right triangles. This seemed to reflect a
lack of appreciation for the importance of using the least
specific representation. While this is of greater concern
in geometry, it may also reflect learning that is important
in describing algebraic generalizations.

107
2. Subjects had difficulties representing unknown
quantities. While the simplest explanation is that they
were unfamiliar with doing so using diagrams, it seems
worth pointing out that their inability to devise ways to
represent unknowns in diagrams may reflect a narrow or
incomplete concept of unknowns in algebra. The skill of
representing variables spatially certainly seems to be
related to the situation of "take any point, (x,y), in the
plane...."
3. Subjects frequently seemed unaware of the
relationships that might lead to the desired information.
Subjects' efforts often seemed unsystematic, lacking the
direction that might have resulted from searching for ways
to determine and express particular relationships.
Subjects who created non-integrated drawings seemed to be
unaware of the importance of seeing relationships between
the information in the two drawings.

CHAPTER v
SUMMARY, CONCLUSIONS, RECOMMENDATIONS
Summary
Background The heuristic "draw a diagram" has consistently
been included in lists of general strategies for problem
solving (Polya 1945, Schoenfeld 1980, Charles and Lester
1982). Research in the area of diagram drawing has focused
primarily in the following areas:
1. correlation of problem solving performance with
use of diagrams
2. correlation of use of diagrams with spatial
abilities •j
3. effect of diagrams in the problem presentation on
problem solving performance
4. effect of diagram drawing instruction on problem
solving performance
Research findings have not been consistent in linking
diagram drawing with problem solving performance (Webb
1979, Swart 1970, Kilpatrick 1967, Lean and Clements 1981)
or with spatial abilities (Moses 1978, Landau 1984, Khoury
and Behr 1982). Several studies however have found a
significant relationship between problem solving
performance and the drawing of high quality diagrams (McKee
1983, Schonberger 1976, Schwartz 1971).
108
109
This relationship seems to be consistent with the
findings of the research on diagrams in problem
presentation. They indicate that providing accurate
diagrams results in improved problem solving while
providing inaccurate diagrams results in worse problem
solving performance (Sherrill 197 3 , Threadgi 11-Sowder and
Sowder 1982).
Instructional interventions have basically been
short-term, one week to three months, and have not yielded
impressive improvement in problem solving performance.
Such interventions were likely too short and lacked
appropriate methodology to have significant impact. The
student populations that were studied were mostly naive to
diagram drawing prior to the studies.
The research supports the assumptions that the ability
to draw high quality diagrams is desirable and that this
ability should be taught. However, twouestions that are
left largely unanswered by the research literature are:
1. What factors affect whether a student chooses to
draw a diagram when a diagram could be helpful?
2. What skills and knowledge are required to draw
useful diagrams for solving mathematical problems?
These questions motivated this study.
The Exploratory Study Students from remedial mathematics
classes at the University were given two written tests
110
followed by an individual interview a week later. The
first written test required subjects to show their work
while the second required them to draw diagrams to solve
the problems. All problems could be solved directly using
diagrams. In the interviews, subjects were asked to
explain previous work and to draw diagrams for problems for
which they had not previously attempted diagrams.
The experimenter's analysis of the written work and
the videotapes of the interviews resulted in the
postulating of five factors affecting diagram drawing
choice and performance, Model One:
1. Understanding of the mathematics involved in the
problem and of basic arithmetic concepts (i.e.
fractions , ratio)
2. Diagram drawing skills and experience
3. Conceptions of mathematics
4. Self-concept in mathematics
5. Motivation to solve the problem correctly
The analysis also focused in more depth on factor #2
to generate a list of diagram drawing subskills, Model Two.
(See the list in Chapter III).
The Main Study The research questions were modified, as
follows, to focus the main study:

Ill
A. Are the subskills identified in the exploratory
study (Model Two above) important in the creation of useful
diagrams?
B. How important are control (met a cognitive) skills
to the creation of high quality diagrams, particularly the
ability to think to use the various subski 1 Is and to choose
appropriately among available subskills?
C. What effect does the problem context (geometric
versus algebraic) have on the quality of the diagrams that
are drawn?
D. What important skills and knowledge were not
identified during the exploratory study?
UE. What are the difficulties which prevent successful
diagram drawing?
Students from precalculus classes at the University
were divided randomly into three treatment groups. Each
group had the same pretest interview conditions and
returned one week after for treatment interviews.
Problems, typical of those used in first year algebra, were
used for all interviews (see Appendix B). Subjects were
asked to draw complete and useful diagrams and to refrain
from using algebra .
Model Two was converted into a list of external
control suggestions. During treatment interviews, subjects
in Group I received these suggestions as deemed appropriate
by the experimenter. Subjects in Group II were given the

112
printed list of suggestions and encouraged to refer often
to it. Group III, the control group, repeated the pretest
conditions; no assistance was provided.
The quality of the diagrams were evaluated and
compared for the three groups based on measures of type,
completeness, labeling, and accuracy, as well as the total
of the four measures.
Group II data was not comparable to the data for the
other groups because of their significantly higher
performance on the pretest. This was attributable to the
number of students in each group (7), which was kept low to
permit the experimenter to conduct two individual
interviews with each subject. As a result, the value of
the metacognitive contribution made by the experimenter (in
deciding when to offer each suggestion to Group I subjects)
could not be assessed reliably from the data.
Group I subjects scored significantly higher than the
control group (III) on the total score for diagram quality
as well as on the specific measure of diagram completeness.
These results indicate that some of the subskills in Model
Two do contribute to improved diagram drawing performance.
Suggestions related to drawing integrated diagrams, to
representing unknown quantities, and to representing ratio
relationships seemed to be particularly helpful in
improving diagram completeness. Differences in scores for

113
diagram type and accuracy were close to significant,
indicating the need for further study.
Geometric problem contexts resulted in better scores
for overall diagram quality than did algebraic problem
contexts. This was consistent with the findings of McKee
(1983). Examination of the effect of context on the
individual measures of diagram quality showed significant
effects on diagram type and completeness but no effect on
labeling or accuracy of diagrams. This suggests that
students, when attempting to draw diagrams for problems
with algebraic contexts, face an additional difficulty of
deciding how to represent the important information
spatially.
Analysis of treatment interviews revealed a number of
metacognitive skills which were not addressed by the oral
suggestions. Some of these metacognitive skills are skills
necessary for problem solving in general. These include
judging the completeness of the label given to a particular
quantity, monitoring one's solution strategy, evaluating
the answer obtained, and monitoring the memory demands of
the task. Other metacognitive skills were specific to
diagram drawing including: identifying all parts of the
diagram that should be labeled, knowing what information
gleaned from the diagram can be used, and knowing when to
use a discrete and when to use a continuous diagram.

114
Analysis of the treatment interviews revealed also
specific difficulties encountered by the subjects. Some of
these difficulties were the result of gaps in the subjects'
understandings of mathematical concepts, particularly
fractions and ratio concepts. This finding supported a
similar finding of the exploratory study. Another critical
difficulty was the inability to model real world problem
situations. Not only were many subjects unable to do so
using diagrams, but follow up questions revealed weaknesses
in their ability to do so using algebra, a domain with
which they had had extensive experience.
Conclusions and Recommendations
Conclusions and Implications for Mathematics Instruction
Both the exploratory study and the main study have
contributed to the conclusion that diagram drawing is a
complex ability which is dependent upon the student's
understanding of mathematical concepts, his self-concept in
mathematics, and his beliefs about mathematics, as well as
a host of general and specific skills and metacognitions.
While high levels of functioning on these factors are
important for diagram drawing success, it is also possible,
and worth investigating, that effective instruction in
diagram drawing, conversely, can contribute to general
improvement in mathematical understanding, confidence and
beliefs about mathematics as well as to problem solving
115
skills and metacognit i on . Thus, diagram drawing may be a
useful vehicle through which students' experiences with
mathematics can change in a positive direction.
W h ,i 1 e the study did not explore methods of teaching
diagram drawing, Model Two (see Chapter III) provides some
indications of component skills that must be focused on as
instructional interventions are developed. In addition to
these component skills, the study focuses attention on the
importance of building the related metacognitions.
Students must learn to monitor their work, think to use
particular skills or knowledge, and to understand the
utility and limitations of particular strategies.
The study also focuses attention on a larger issue,
the inabiltiy of students to model real world problem
situations. Diagram drawing is a potential bridge between
the physical world and the abstraction of mathematical
symbblization. This bridge requires that elementary and
secondary mathematics curricula reflect a commitment to an
ongoing development of students' abilities to represent
mathematical relationships spatially. Short instructional
interventions are unlikely to have significant impact for
most students .
Improvement in diagram abilities will not take place,
however, in a vacuum. Effective instruction in this area
will necessitate and contribute to some important changes
in mathematics instruction in general, including:

116
1. a greater focus on the process of mathematical
problem solving with a concommitant decrease in the
importance placed on the answers produced
2. a greater attention to metacognitive skills
3. more use of non-routine problems and a reduction
in the time spent on routine exercises
4. an appreciation of divergent thinking (Diagram
drawing does not lend itself to one "right" way.)
5. the development of a "debugging" view of
mathematical modeling (One creates a model and then
continues to change it and improve it until it is
useful for the task for which it was designed.)
Instruction in algebra in particular may benefit from
preparatory work with diagrams. Algebraic competence with
respect to modeling real world problems and using variables to
represent unknown quantities might be improved if students had
the opportunity to develop these skills first with diagrams.
Algebra affords us the opportunity to manipulate expressions,
often with little need to understand the relationships in
depth. The procedures of algebra provide a short cut for
relating partial representations automatically. It is
important, however, that students learn to think about the
overall relationships in a problem, not just to identify

117
specific parts. Diagram drawing may provide a vehicle for
such learning.
Suggestions for Future Research This research represents a
first attempt to specify the factors which influence the
decision to use a diagram and determine the success in using a
diagram. It also marks a beginning of breaking diagram
. drawing competence into its component subskills. Several
areas of further study are indicated. Future studies should
focus on :
1. diagram drawing skills (using similar problems) of
students who have not as yet been given instruction in
algebra.
The study used subjects who had a background in algebra
but prohibited them from using algebra. This probably caused
some interference due to subjects' confusion over what was
permissible and what was not.
2. diagram drawing skills of expert problem solvers.
3. instructional interventions which are based on
findings from this study.
4. the importance of the met a cognitive components of
diag ram drawing .
5. correlational studies which relate diagram drawing to
the factors specified in Model One.
Diagram drawing provides researchers in mathematics
education a potentially rich medium for studying problem

118
solving and higher order thinking due to its independence from
rote algorithms. As a research topic it offers both the
advantages and disadvantages of being a complex skill, learned
over an extended period of time.
/

REFERENCES
Bell, A., et al. Choice of operation in verbal problems with decimal numbers. Educational studies in mathematics , 12 , 399-420 , 1981 .
Botsmanova, M. E. The forms of pictorial visual aids in instruction in arithmetic problem solving. In J. Kilpatrick & I. Wirszup (Eds.), Instruction in problem solving. Soviet Studies in the Psychology of Learning and Teaching Mathematics (Vol. 6). Stanford: School Mathematics Study Group, 1972. (a)
Botsmanova, M. E. The role of graphic analysis in solving arithmetic problems. In J. Kilpatrick & I. Wirszup (Eds.), Instruction in problem solving. Soviet Studies in the Psychology of Learning and Teaching Mathematics (Vol. 6). Stanford: School Mathematics Study Group, 1972. (b)
Caldwell, J. H., & Goldin, G. A. Variables affecting word problem difficulty in elementary school mathematics. Journal for Research in Mathematics Education, 10, 323-336, 1979.
Charles, R., & Lester, F. Teaching problem so 1 vinq: What, why and how. Palo Alto, CA: Dale Seymour Publications, 1982 .
Clement, J., Lochhead, J., & Monk, G. S. Translation difficulties in learning mathematics. American Mathematical Monthly, 88, April, 1981.
Cooney, T. J., Davis, E. J., & Henderson, K. B. Dynamics of teaching secondary school mathematics. Boston: Houghton Mifflin, 197b. *
de Groot, A. Perception and memory versus thought: Some old ideas and recent findings. In B. Kleinmuntz (Ed.), Problem solving: Research, method, and theory. NY:
Wi1ey,196b. ’
Driscoll, M. Research within reach: Secondary school_ ma t h emat\i cs . Research and Development I n t erpr etat l on
Service, 1983.
Egan, 0. S Schwartz, B. J. Chunking in reca11 of symbo\U drawings. Memory and Cognition, 7_, 149 158, iy/y.
119

120
Ehr, C. K. Cognitive style and information selection during the solution of mathematics word problems (Doctoral dissertation, University of Georgia, 1979). Dissertation Abstracts International, 40, 5768A, 1980.
\Elliott, P. C. Going 'back to basics' in mathematics won't prove who's 'right', but who's 'left' (brain duality and mathematics learning). International Journal of Mathematics, Education, Science, and Techno 1ogv. 11. NoT2T"2TI^"19 , 1980 . - ~
Frandsen, A. N., & Holder, J.R. Spatial visualization in solving complex verbal problems. Journal of Psychology, 7_3 , 229-233 , 1969 .
Goldin, G. A., & McClintock, C.E. (Eds.) Task variables in mathematical problem solving. Mathematics Education Report. ERIC information Analysis Center for Science, Mathematics, and Environmental Education, Ohio State University, 1979.
Greeno, J. G. Skills for representing problems. Paper presented at the American Educational Research Association (AERA) annual conference, 1983.
Guay, R. B., & McDaniel, E. D. The relationship between mathematics achievement and spatial abilities among elementary school children. Journal for Research in Mathematics Education, 8, 211-215, 1977.
Hayes, J. The complete problem solver. Philadelphia: Franklin Institute Press, 1981.
Heller, J., & Reif, F. Prescribing effective human problem-solving processes: Problem description in physics, Cognition and Instruction, 2_, 177 -21 6 , 1984 .
Hendricks, G., & Wills, R. The centering book. Englewood Cliffs, NJ: Prentice-Hall, Inc., 1975.
Herring, R. D. Visual scholars program: Working paper No 2, June, 1980.
Hesemann, J. P. A spatial model for the cognitive representation of verbal algebra problems (Doctoral dissertation, Indiana University, 1976). Abstracts International , 37 , 2037A, 197 7 .
Dissertation
Hooper, K. Multiple representations within the mathematics domain. Draft. August, 1981.

121
Johnson, D. A. , & Rising, 6. R. Guidelines for teachinq mathematics. Belmont, CA: Wadsworth, 1967 .-
Khoury , H. A. & Behr, M. Student performance, individual differences, and modes of representation. Journal for Research in Mathematics Education, 13, January ,1562.
Kilpatrick, J. Analyzing the solutions of word problems in mathematics: An exploratory study (Doctoral dissertation, Stanford University, 1967) Dissertation Abstracts, 28 , 4380A, 1967 .
Kinsella, J. J. Problem solving. In M.F. Rosskopf (Ed.), The teachinq of secondary school mathematics. Thirty-third Yearbook of the Natioinal Counci1 of Teachers of Mathematics. Washington, D.C: The Council, 197 0 .
Landau, M. The effects of spatial ability and problem presentation format on mathematical problem solving performance of middle school students (Doctoral dissertation. Northwestern University, 1984).
Larkin, J. H. Mechanisms of effective problem representation in physics. Carnegie-Mel 1 on University, C.I.P. #434, August, 1983.
Lean, G. A., & Clements, M. A. Spatial ability, visual imagery, and mathematical performance. Ed ucationa 1 Studies in Mathematics, 1_2 ( 3), 267 -299 , 1981 . -
Lesh, R. Some trends in research and the acquisition and use of space and geometry concepts. Papers from the second international conference for the psychology of mathematics education, Bielefeld, Germany, 1979.
Lesh, R., Landau, M., & Hamilton, E. Conceptual models and applied mathematical problem-solving research. In R. Lesh & M. Landau (Eds.), Acquisition of mathematics concepts and processes. New York: Academic Press , 1983.
Lester, F. Jr. Ideas about problem solving: A look at some psychological research. Arithmetic Teacher, 1977.
Levy, J. Research synthesis on right and left hemispheres: We think with both sides of the brain. Educational Leadership, January, 1983.
Lochhead, J. Problem solving for rote learners. In G. Akst (Ed.) New directions for college learning assistance
122
improving mathematics skills. San Francisco: Jossey Bass, December , 1381.
Lucas, J. F. The teaching of heuristic problem-solving strategies in elementary calculus. Journal for Research in Mathematics Education, 5., 36-46 , 1974 .
Luerhman, A. Graphic Solution to Insoluable Problems. Update, Math Imagery Group, University of California at Santa Cruz, March 9, 1982.
Maier, G. Mathematics and visual thinking. Paper presented at the American Educational Research Association (AERA) annual conference, 1983.
Mason, J. Representing representing: Notes following the conference from John Mason. 1984. (a)
Mason, J. Personal correspondance, 1984 . (b)
Mayer, R. E. Comprehension as affected by structure of problem representat i on . Memory and Cognition, 4(3), 249-255, 1976.
Mayer, R. E. & Revlin, R. An information processing framework for research on human reasoning. In R. Revlin & R. E. Mayer (Eds.), Human reasoning. Washington, D.C.: Winston, 1978.
McKee, L. D. Figure-drawing ability in solving mathematical problems (Doctoral dissertation, University of Georgia, 1983).
Moses, B. The nature of spatial ability and its relationship to mathematical problem solving (Doctoral dissertation, Indiana University, 1977). Dissertation Abstracts International , 38 , 4640A, 1978 .
Moses, B. Visualization: A different approach to problem solving. School Science and Mathematics, 82(2), 141-147, 1982.
National Assessment of Educational Progress. Mathematical app1ications: Selected results from the second assessment of mathematics (Report No. 09-MA-3). Denver. Education Commission of the States, 1979.
National Council of Supervisors of Mathematics. Position paper on basic skills. Arithmetic Teacher, 25, 19-22, 1977 .

123
National Council of Teachers of Mathematics. An aqenda for action: Recommendations for school mathematics <JT the 1980s.Reston, VA: The Council, 1980. --
National Council of Teachers of Mathematics. Priorities in school mathematics: Executive summary. Reston. VA: The Council , 1981. -
Nelson, G. T. The effects of diagram drawing and translation on pupil's mathematical problem-solving performance (Doctoral dissertation, University of Iowa, 1974). Dissertation Abstracts International, 35, 4149A, 197 5 .
N e w e11, A., & Simon, H. A. Human prob1em so 1 ving. Englewood Cliffs, N.J.: Prentice-Hall , 197 2 .
O'Regan, P. Problem solving and teaching mathematics. Course materials for Math 309 (Rhode Island College), 1984.
Ornstein, R. B. The psycholqy of conciousness. San Francisco: W.H. Freeman, 1972.
Paige, J. M., & Simon, H. A. Cognitive processes in solving algebra word problems. In B. Kleinmuntz (Ed.), Problem solving: Research, method, and theory. NY: Wiley, 1966.
Peck, D. M. Barriers to mathematical thinking and problem solving. Procedinqs of the sixth annual meeting of North American chapter of the international group for Th~e psychology of mathematics education (PME-NA), Madison, WI, 1984.
Polya, G. How to solve it. Princeton, NJ: Princeton University Press , 1945 .
Reif, F., Larkin, J. H., & Brackett, G. C. Teaching general learning and problem-solving skills. American Journal of Physics, 44, March, 197 6.
Schoenfeld, A. H. Can heuristics be taught? in J. Lochhead and J. Clement (Eds.), Cognitive process instruction, Philadelphia: Franklin Institute Press, 1979.
Schoenfeld, A. H. Heuristics in the classroom. In Problem solving i n school mathematics, 1980 yearbook, Reston, VA: National Council of Teachers of Mathematics.

124
Schoenfeld, A. H. Met acognitive and epistemological issues in mathematical understanding. Conference on Problem Solving, San Diego State University, June, 1983.
Schonberger, A. K. The interrelationship of sex, visual spatial abilities, and mathematical problem solving ability in grade seven (Technical Report No. 387). Wisconsin Research and Development Center for Cognitive Learning, The University of Wisconsin, 1976.
Schultz, K. Se1f-directed use of different types of representational models in middle school problem solving. Procedings of the fifth annual meeting of North American chapter of the international group Tor the psychology of mathematics education (PME-NA) , Montreal , 198 3.
Schwartz, S. H. Modes of representation and problem solving: Well evolved is half solved. Journal of Experimental Psychology, 91 , 347 -350 , 197 1 .
Sherill, J. M. The effects of different presentations of mathematical word problems upon the achievement of tenth grade students. School Science and Mathematics, 7 3, 277-282, 1973.
Shoecraft, P. J. The effects of provisions for imagery through materials and drawings in translating algebra word problems, grades seven and nine"(Doctoral dissertation. University of Michigan, 1971). Dissertation Abstracts International, 32 , 3874A-387 5A, TT7T7
Simon, H. A. Learning with understanding. Mathematics Education Report. ERIC Information Analysis Center for Science, Mathematics, and Environmental Education, Ohio State University, 1975.
Smith, C. E. Sputnick II: Where are you when we need you? Change, 15, 7-10, October 1983.
Swart W. L. A comparative study of high- and low-structure approaches to *devel oping problem-solving ability in fourth grade children. Dissertation Abstracts International , 31 , 669A, 1970 .
Tanaka, J, Group 1982 .

125
Threadgi11-Sowder , J. & Juilfs, P. Journal for Research in Mathematics Education, 11, November, 1980.
Threadgi11-Sowder , J. & Sowder, L. Drawn versus verbal formats for mathematical story problems. Journal for Research in Mathematics Education, 13, November, 1982.
Vest, F., & Congleton, C. Three steps in teaching problem solving. Mathematics Teaching, 82^( 3), 18-20 , 1978.
Walsh E. & Walsh J. The status of science education. Education Digest, 48, February, 1983.
Webb, L. F., & Sherrill, J. M. The effects of differing presentations of mathematical word problems upon the achievement of preservice elementary teachers. School Science and Mathematics, 7 4 , 559 -565 , 1974 .
Whimbey, A., & Lochhead, J. Problem Solving and Comprehension. 2nd ed. Philadelphia: Franklin Institute Press , 1980.
Wicker, F. W., Weinstein, D. E., Yelich, C. A., & Brooks, J. D. Problem-reformulation training and visualization training with insight problems. Journal of Educational Psy cho1ogy , 7 0 , 37 2-377 , 1978 .

Appendix A
Problems Used in Exploratory Study
SET 1: Show all your work as you solve these problems:
1) Abby buys a 6 ft. long board. She cuts it into 3/4 ft. sections. How many 3/4 ft. sections did she make?
2) Chan has 3/4 of a gallon of ice cream. He gives 2/3 of what he has to Barry. How much ice cream does he have 1 eft?
3) There are several colors of dogs in a pen. 1/5 of the dogs are black, 10 dogs are spotted, and the remaining 2/3 of the dogs are brown. How many dogs are in the pen?
4) Alex buys his car at a "2/7 off" sale. He pays $3500. What was the original list price of the car? (DO NOT USE ALGEBRA)
5) If six people shake hands such that each one shakes hands with each other person, how many handshakes will there be?
6) The label on a tin can extends from one end to the other. It wraps completely around the can with the ends of the Table overlapping 1 inch. The can is 6 inches tall and its radius is 2 inches. What is the area of the label?
7) Dave decided to walk to the local gas station.. After he walked 1 mile, he decided to walk half the remaining distance before resting. After he reached his resting point, he still had 1/3 of the distance of the trip plus 1 mile to walk. How long was Dave's trip?
81 A couqar spots a fawn 200 feet away. The cougar starts toward the fawn at 50 ft. per second. At the same instant the fawn starts running away at 30 ft. per second. How long will it take the cougar to catch the fawn.
9) There are eight points on a circle. Each point connected to every other point by a line segment, line segments are there?
i s How many
126
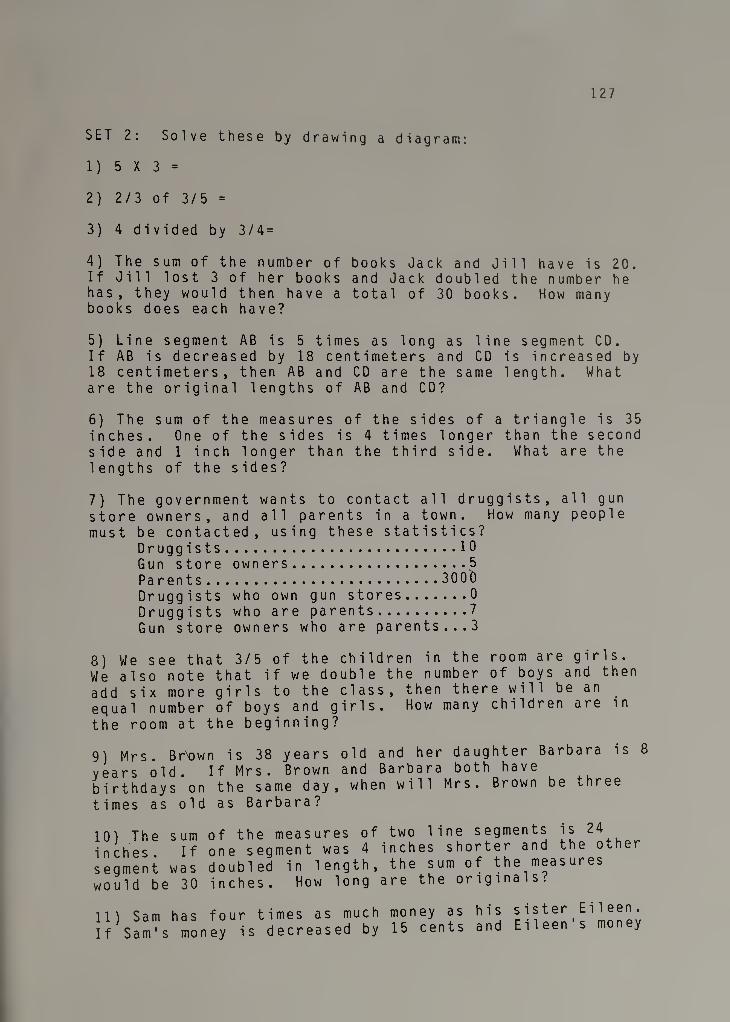
127
SET 2: Solve these by drawing a diagram:
1) 5X3=
2) 2/3 of 3/5 =
3) 4 divided by 3/4=
4) The sum of the number of books Jack and Jill have is 20. If Jill lost 3 of her books and Jack doubled the number he has, they would then have a total of 30 books. How many books does each have?
5) Line segment AB is 5 times as long as line segment CD. If AB is decreased by 18 centimeters and CD is increased by 18 centimeters, then AB and CD are the same length. What are the original lengths of AB and CD?
6) The sum of the measures of the sides of a triangle is 35 inches. One of the sides is 4 times longer than the second side and 1 inch longer than the third side. What are the 1engths of the sides?
7) The government wants to contact all druggists, all gun store owners, and all parents in a town. How many people must be contacted, using these statistics?
Druggists.10 Gun store owners.5 Parents. 3000 Druggists who own gun stores.0 Druggists who are parents.7 Gun store owners who are parents...3
8) We see that 3/5 of the children in the room are girls. We also note that if we double the number of boys and then add six more girls to the class, then there will be an equal number of boys and girls. How many children are in the room at the beginning?
9) Mrs. BrXDwn is 38 years old and her daughter Barbara is 8 years old. If Mrs. Brown and Barbara both have birthdays on the same day, when will Mrs. Brown be three times as old as Barbara?
10) The sum of the measures of two line segments is 24 inches If one segment was 4 inches shorter and the other segment was doubled in length, the sum of the measures would be 30 inches. How long are the originals.
11) Sam has four times as much money as his sister Ei1een. If Sam's money is decreased by 15 cents and Eileen s mon y

128
is increased by 15 cents, then Eileen and Sam have the same amount. How much money did Sam and Eileen have at the start?

Appendix B
Problems Used in Main Study
Form A 1. The sum of the measures of the sides of a triangle is 35 inches. One of the sides is 4 times longer than the second side and 1 inch longer than the third side. What are the lengths of the sides?
2. Sam has four times as much money as his sister Eileen. If Sam's money is decreased by 39 cents and Eileen's money is increased by 39 cents, then Eileen and Sam have the same amount. How much money did Sam and Eileen have at the start?
3. Mrs. Brown is 38 years old and her daughter Barbara is 8 years old. If Mrs. Brown and Barbara both have birthdays on the same day, when will Mrs. Brown be three times as old as Barbara?
Form B 1. The sum of the number of books Jack and Jill have is 20. If Jill lost 3 of her books and Jack doubled the number he has, they would then have a total of 30 books. How many books does each have?
2. The sum of the ages of three children is 26. One of the children is 3 times older than the second child and 2 years older than the third child. What are the ages of the children?
3. Line segment AB is six times as long as line segment CD. If AB is decreased by 30 centimeters and CD is increased by 30 centimeters, then AB and CD are the same length. What are the original lengths of AB and CD?
Extra problem worked by Group III at the end of the pretest (did not figure in scoring). .
Chan has 3/4 of a gallon of ice cream. He gives 2/3 ot what he has to Barry. How much ice cream does he have
left?
129

Appendix C
Suggestions
1. Avoid using arithmetic signs in your diagram, such as + - x / =.
2. Create one diagram that has all the information in it instead of several separate diagrams.
3. If the size of the fraction to be represented is unknown, mark off a space remembering that its size is arbitrary. Try to avoid drawing it to look equal in size to parts that may not be equal to it.
4. a)Are there any equal parts in the picture? Label the equal parts so they are easily recognized as such.
b)If one part is a multiple of the other (and the number values are unknown for these parts), subdivide the larger to make parts equal to the smaller part. Label these new equal parts clearly.
5. If it would be helpful now to redraw the picture, do so.
6. a) Label what you have drawn, naming the part or parts that you have created. If you have drawn part of a whole and labeled it, you may also be able to label the remaining part of the whole.
b) What does this represent? [referring to an unlabled space]
7. a) Label all parts numerically for which you now know the appropriate numbers.
b) Be aware of parts of your diagram for which you can now figure out the number value by combining numbers that are already in the diagram, looking for differences or working with equal parts.
c) Do you know the numerical value of this space. [referring to an unlabled space]
8. Try drawing a representation of the final or goal state of the problem. See if you can work from there.
9. Can you draw that that is written in as diagram]
information? [referring to information a label rather than drawn into the
130

131
10. If two parts are equal and one part is subdivided, make the same subdivisions in the other equal part.
11. Review and check over certain steps. a) Check to see that all parts are labeled
descriptively, that the name of what that space represents is included.
b) Check to see that all parts are labeled with number values. Look to see if there are any other parts you now can determine the number value of.
c) Are all equal parts clearly indicated? d) Has all of the relevant information been
represented? e) Reread the problem to make sure that you have
accurately represented the problem.

Appendix D
Evaluation of Diagrams and Sample Diagrams
Evaluation Scale: quality of diagrams
Note: Sample diagrams are provided for reference on paqe 4 of Appendix D. y
LyPe• 3 points--schematic, represents math structure 2 points--part schematic and part illustrative 1 po i nt--i 1 1 ustrative , no math structure
Completeness: 4 points possible Note: completeness only deals with what is represented
spatial 1 y and not with what is described in labels. 1 point subtracted for non-integ rated diagram (two or
more unrelated diagrams) 1 point subtracted for each piece of relevant
information not represented spatially (see criteria for each problem, be!ow)
Labeling: 4 points possible--includes numerical labels and descriptive labels (see criteria for each problem below)
Accuracy: 3 points--shows correct understanding of problem 2 points--some inaccuracy l--not at all accurate or not enough
information represented to evaluate accuracy
132
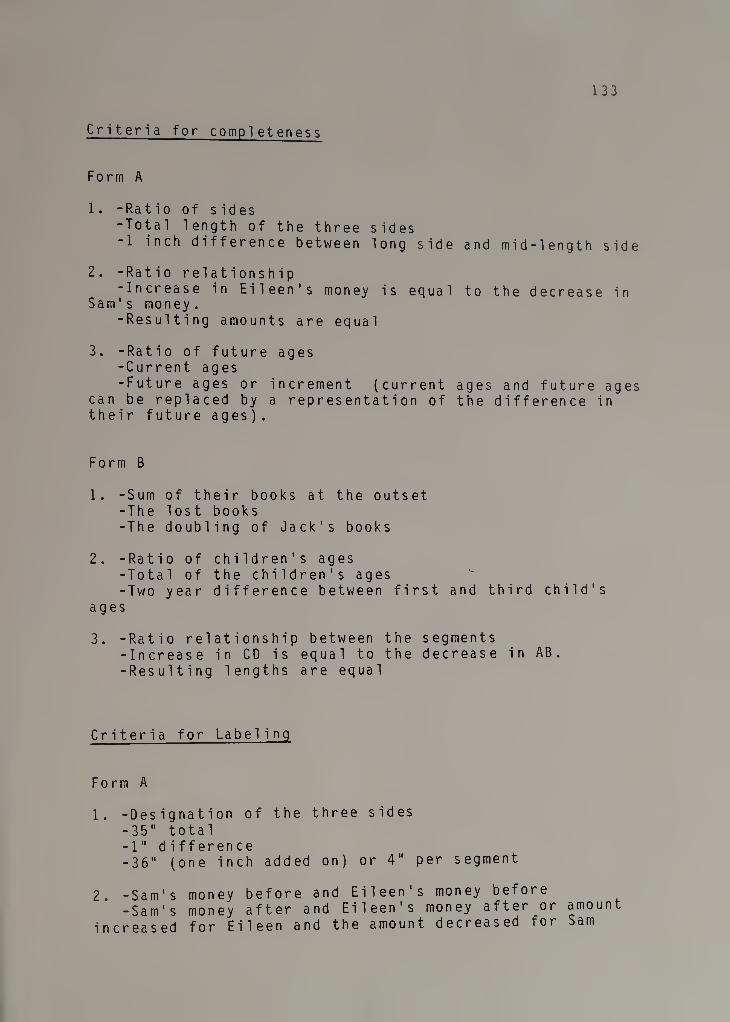
133
Criteria for completeness
Form A
1. -Ratio of sides -Total length of the three sides -1 inch difference between long side and mid-length side
2. -Ratio relationship -Increase in Eileen's money is equal to the decrease in
Sam's money. -Resulting amounts are equal
3. -Ratio of future ages -Current ages -Future ages or increment (current ages and future ages
can be replaced by a representation of the difference in their future ages).
Form B
1. -Sum of their books at the outset -The lost books -The doubling of Jack's books
2. -Ratio of children's ages -Total of the children's ages -Two year difference between first and third child's
ages
3. -Ratio relationship between the segments -Increase in CD is equal to the decrease in AB. -Resulting lengths are equal
Criteria for Labeling
Form A
1. -Designation of the three sides -35" total -1" difference -36" (one inch added on) or 4" per segment
2. -Sam's money before and Eileen's money before -Sam's money after and Eileen's money after or amount
increased for Eileen and the amount decreased for Sam

134
-$.39 -$.26 per segment or $.135 per half segment or S r 0 - $ 1.0 4
3. -Barb's current age and Mrs. Brown's current aqe -increase in their age -8 years and 38 years -increase = 7 years or Barb's future age = 15 years or Mrs. Brown's future age is 45 years
OR -Barb's future age -Mrs. Brown's future age -30 years difference in their ages -increase = 7 years or Barb's future age = 15 years or Mrs. Brown's future age is 45 years
Form B
1. -Jill's books and Jack's books (at the outset), 20 books -3 books lost and Jack's number of books doubled -30 books total -17 books total after Jill lost three or 13 books Jack
gained or 7 books Jill had at the outset
2. -Three children's ages -26yearstotal -2 years difference in age between first and third child -28 years (two years added on) or 4 years per segment
3* "ABo and CDq
- A B f i p g
an uf or the increase in CD and the decrease in AB
-30 cm -12 cm per segment or ABQ=72 cm or
T LUf=42 cm

Fig. D.i
135
FORM A 1)
Sample Diagrams
35"
k--
2)
.39 Eileen's $
~- increase
.39
3)
Barb's age
1 I 7 I 8 | 7 | 8
Mrs. B.'s
I age
i-7 L 8 i 1 V 38
increment
k— . 39 —jl
Barb's final age Mrs. B.'s final age Mrs. B.'s final age
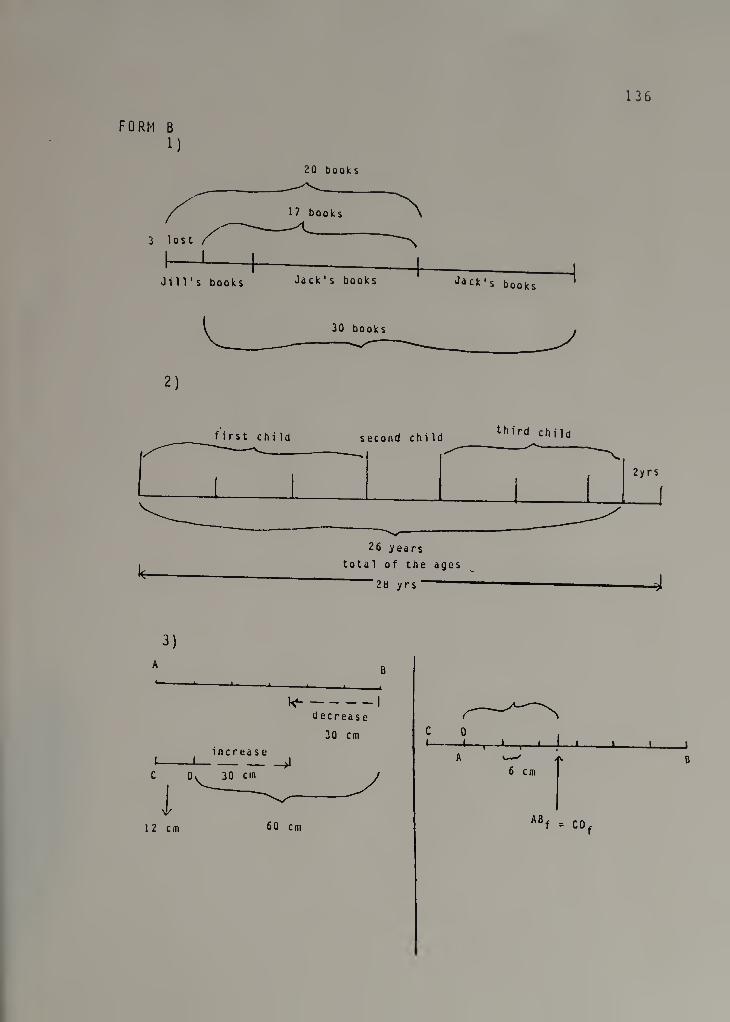
FORM B 1)
136
20 books
2)
total of the ages
2b yrs
3)
decrease
30 cm
increase <-1->1
12 cm 60 cm
C U -I , I , , I .
A <-—' a, 6 cm
ABf = CDf
X 1 J
B

APPENDIX E
Table E.1
Correlations of Scores by the Two Scorers (columns are by problem, rows are by measure)
Al A2 A3 B_l_ B2_ B3
Ml 1.000 .750 1.000 .671 .932 1.000 M2 .916 .976 .846 .853 .906 .976 M3 . .962 1.000 .791 .907 .836 .828 M4 .795 .718 1.000 . 661 .720 .791
" A1" indicates form A, problem #1.
137
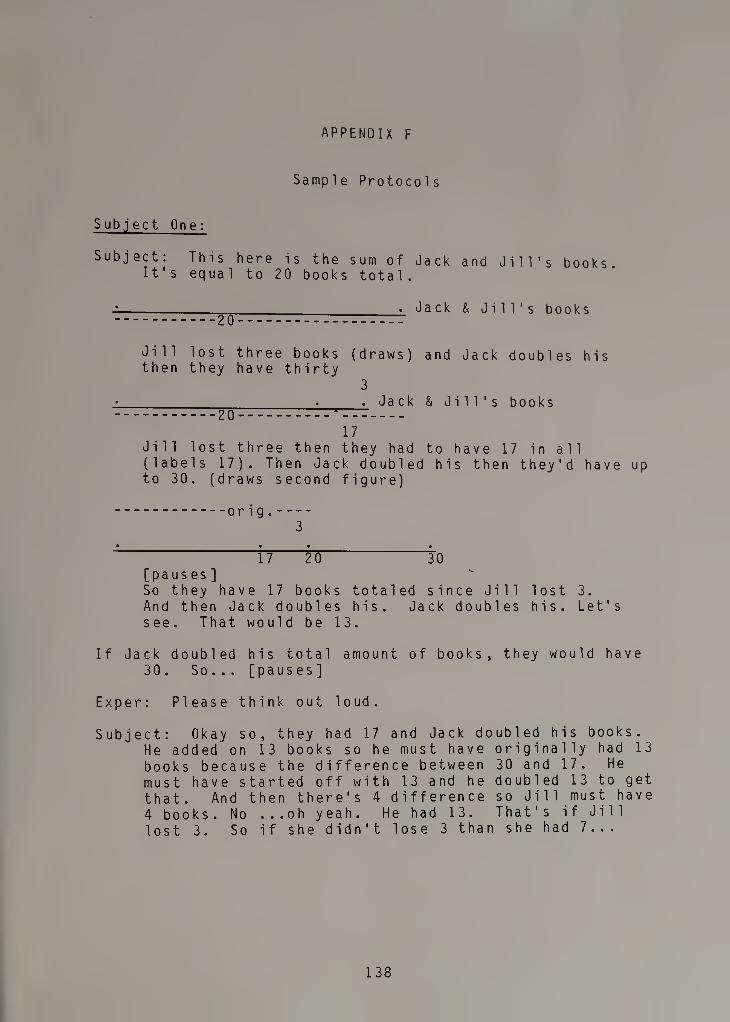
APPENDIX F
Sample Protocols
Subject One:
Subject: This here is the sum of Jack and Jill's books. It's equal to 20 books total .
■20 Jack & Jill's books
Jill lost three books (draws) and Jack doubles his then they have thirty
3 __._. Jack & Jill's books -20-* --
17 Jill lost three then they had to have 17 in all (labels 17). Then Jack doubled his then they'd have up to 30. (draws second figure)
orig.- 3
17 20 30 [pauses] So they have 17 books totaled since Jill lost 3. And then Jack doubles his. Jack doubles his. Let's see. That would be 13.
If Jack doubled his total amount of books, they would have 30. So... [pauses]
Exper: Please think out loud.
Subject: Okay so, they had 17 and Jack doubled his books. He added on 13 books so he must have originally had 13 books because the difference between 30 and 17. He must have started off with 13 and he doubled 13 to get that. And then there's 4 difference so Jill must have 4 books. No ...oh yeah. He had 13. That's if Jill lost 3. So if she didn't lose 3 than she had 7...
138

139
.orig.- 3
n'iV'to-jo Jack Jill .13.
Subject Two
Subject: (Draws a box) 20 books. Jill lost 3 of her books. Okay, arbitrary... (draws)
Exper: You j-ust remembered one of the suggestions?
Subject: Yes. Arbitrary. I remembered not to make it 1/2. I can relate... it was confusing last time because sometimes if you make it similar or equal to 1/2.... This is Jill. Now Jack... another arbitrary (draws). If this is 20 books we know that half of that is 10 and this is 30 (draws) .
Jack + Jill 20
Jill Jack
Jack has more books than Jill, it looks like. I guess I need to make an association. If I double what Jack had, it almost makes it look equal to the 30. That's not taking into association what Jill has. So I guess I need to make a picture that better represents what Jack has.
Let's see. Leave that out. (crosses out a box)
That's what Jack has. (draws another box)

140
30
The sum of these two will equal 20 and if you subtract 3 and double that you know you get 30.
Okay. Since I don't really know what Jill has, I can't really even begin to figure out what fraction is the 3 books. (draws a box to show the doubled quantity)
So this being what Jill has left over. And again that's just a rough sketch.
I know at least that Jack has more books left over than Jill.
That's a fair representation. Iknow that half of that and you tack on another half equals 30. It's the only ground base thing that I have that I know is right. This is too arbitrary really. This is the biggest unknown. It makes it too difficult without using algebra.