Embed Size (px)
Citation preview
The Rangely Field
An Experiment in Earthquake Controlat Rangely, Colorado
C. B. Raleigh, J. H. Healy, J. D. Bredehoeft
The discovery in 1966 that injection offluid underground at high pressure was re-
sponsible for the triggering of earthquakesnear Denver, Colorado, led to speculationsthat earthquakes might be controllable (1).Reduction of the frictional strength of thehighly stressed basement rock by injectionof the fluid is the favored explanation forthe mechanism by which the earthquakeswere triggered (2). The pressurized fluidenters a fracture and supports a part of thenormal stress equivalent to the pressure ofthe fluid. As the fluid has no shear strength,the effective normal stress and the friction-al resistance to sliding are lowered. If thefracture is subject to shear stress greaterthan the product of this effective normalstress and the coefficient of friction, therocks will slip and generate an earthquake.This hypothesis was not uniformly accept-ed by earth scientists, and although sup-ported by the available data the hypothesiscould not be established conclusively atDenver.The injection of waste fluid into the
Army's disposal well at the Rocky Moun-tain Arsenal was discontinued in 1966, andthe earthquakes have now almost com-
pletely ceased. The disposal well, becauseof its proximity to Denver, could not beused for experimental purposes, but the ex-
perience was nevertheless highly signifi-cant. Earthquakes apparently were beingtriggered by injection of fluid into stressedrock, and with reduction in fluid pressurethe earthquakes sharply decreased in fre-quency. If the physical basis for these phe-nomena could be well established in a fieldexperiment, earthquake control and pre-vention of inadvertent triggering of earth-quakes might become feasible.
For an adequate field experiment it wasnecessary (i) to know the fluid pressure inthe vicinity of the hypocenter of the earth-quakes, (ii) to measure the absolute stateof stress, (iii) to have precise hypocentral
C. B. Raleigh and J. H. Healy are geophysicists atthe National Center for Earthquake Research, U.S.Geological Survey, Menlo Park, California 94025. J.D. Bredehoeft is a hydrologist at the U.S. GeologicalSurvey, Reston, Virginia 22092.
1230
locations and focal plane solutions for theearthquakes, and most important (iv) to beconfident that the active phase of the ex-
periment would not materially increase thelikelihood of a damaging earthquake. In1967 we were advised by W. W. Rubeythat the Rangely Oil Field might meet our
requirements. An array of seismographs atVernal, Utah, had been recording smallearthquakes from the vicinity of Rangelysince its installation in 1962 (3). The fieldhad been on waterflood-the injection ofwater at high pressure for secondary recov-
ery of oil-since 1957. In the fall of 1967,we installed a portable array of seismo-graphs and recorded 40 small earthquakesin a 10-day period at the Rangely field (4).The earthquakes occurred within the oilfield in two areas where fluid pressures dueto waterflooding were high. In 1968, theleaseholders and the operator, Chevron OilCompany, agreed to permit us to conductan experiment to control the seismic activi-ty in a part of the field. The experiment be-gan in September 1969 with the full coop-
eration of Chevron and was supported bythe Advanced Research Projects Agencyof the Department of Defense, who were
interested because the Army's well at Den-ver had triggered the earthquakes there.The experiment was planned as follows.
After a year of recording of seismic activi-ty from a local network of seismographs,the fluid pressure in the vicinity of theearthquakes would be reduced by back-flowing water from injection wells. If thefluid pressure reduction resulted in reducedseismic activity, the pressure would beraised again by injection and the cycle re-
peated. Concurrent measurements of res-
ervoir pressure in nearby wells would beused to establish the reservoir performanceand make predictions of the spatial distri-bution of pressure with the cycles of in-jection and withdrawal. By measuring thestresses in situ and the frictional propertiesof the reservoir rock, a test of the effectivestress hypothesis could be made by com-
paring the observations with the predictedfluid pressure for triggering of earth-quakes.
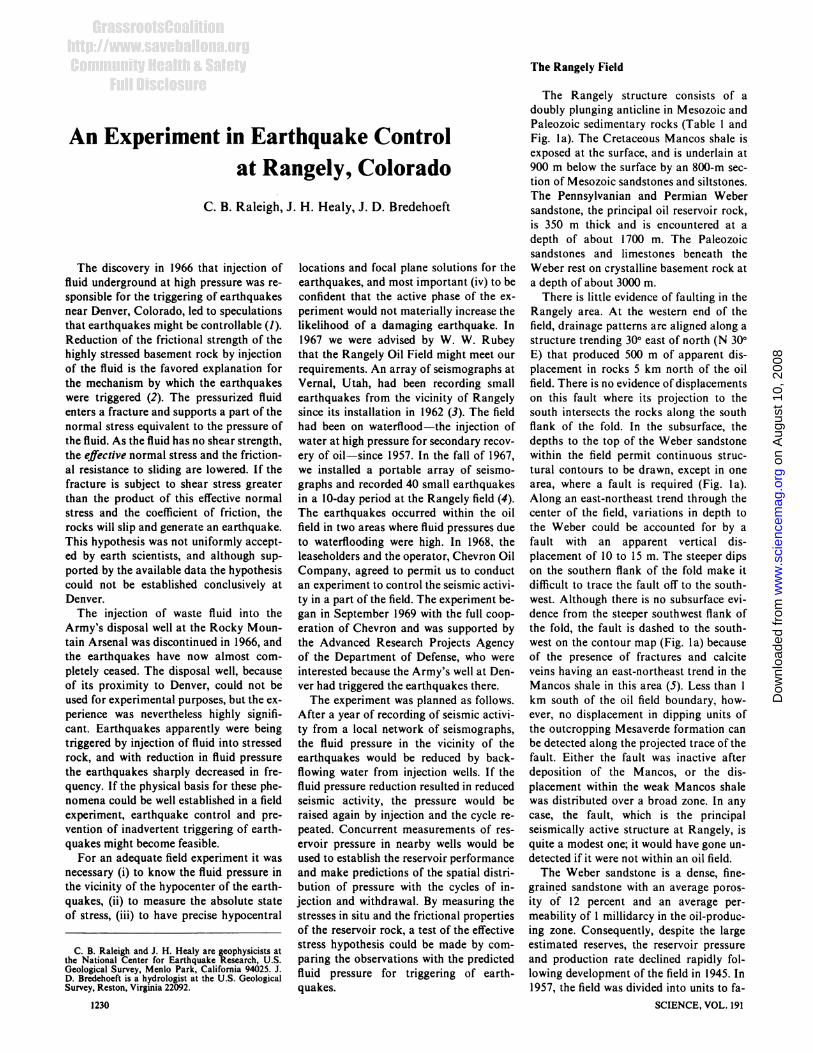
The Rangely structure consists of adoubly plunging anticline in Mesozoic andPaleozoic sedimentary rocks (Table I andFig. la). The Cretaceous Mancos shale isexposed at the surface, and is underlain at900 m below the surface by an 800-m sec-tion of Mesozoic sandstones and siltstones.The Pennsylvanian and Permian Webersandstone, the principal oil reservoir rock,is 350 m thick and is encountered at adepth of about 1700 m. The Paleozoicsandstones and limestones beneath theWeber rest on crystalline basement rock ata depth of about 3000 m.There is little evidence of faulting in the
Rangely area. At the western end of thefield, drainage patterns are aligned along astructure trending 300 east of north (N 300E) that produced 500 m of apparent dis-placement in rocks 5 km north of the oilfield. There is no evidence of displacementson this fault where its projection to thesouth intersects the rocks along the southflank of the fold. In the subsurface, thedepths to the top of the Weber sandstonewithin the field permit continuous struc-tural contours to be drawn, except in onearea, where a fault is required (Fig. Ia).Along an east-northeast trend through thecenter of the field, variations in depth tothe Weber could be accounted for by afault with an apparent vertical dis-placement of 10 to 15 m. The steeper dipson the southern flank of the fold make itdifficult to trace the fault off to the south-west. Although there is no subsurface evi-dence from the steeper southwest flank ofthe fold, the fault is dashed to the south-west on the contour map (Fig. la) becauseof the presence of fractures and calciteveins having an east-northeast trend in theMancos shale in this area (5). Less than Ikm south of the oil field boundary, how-ever, no displacement in dipping units ofthe outcropping Mesaverde formation canbe detected along the projected trace of thefault. Either the fault was inactive afterdeposition of the Mancos, or the dis-placement within the weak Mancos shalewas distributed over a broad zone. In anycase, the fault, which is the principalseismically active structure at Rangely, isquite a modest one; it would have gone un-detected if it were not within an oil field.The Weber sandstone is a dense, fine-
grained sandstone with an average poros-ity of 12 percent and an average per-meability of 1 millidarcy in the oil-produc-ing zone. Consequently, despite the largeestimated reserves, the reservoir pressureand production rate declined rapidly fol-lowing development of the field in 1945. In1957, the field was divided into units to fa-
SCIENCE, VOL. 191
on
Aug
ust 1
0, 2
008
ww
w.s
cien
cem
ag.o
rgD
ownl
oade
d fr
om

cilitate waterflooding to increase the pro-ductivity. After this, wells on the peripheryof the field were converted to water in-jection. By 1962, pressure surveys (6)showed that in local areas injection hadraised the reservoir fluid pressures above170 bars, the virgin reservoir pressure. By1967, when earthquakes were first accu-rately located in the field, bottom-holepressures as high as 290 bars were record-ed.
Seismicity
Before the installation of the UintaBasin Seismic Observatory at Vernal,Utah, there were no instrumental recordsof earthquakes at Rangely. We were givenone secondhand report of felt earthquakesin the area from the period before fluid in-jection, but we have not attempted to veri-fy the report. Continuous recording fromthe U.S. Geological Survey network,which permitted the first accurate locationof earthquakes, began in October 1969, 12years after waterflooding was begun. Thus,we are unable to establish any correlationbetween the initiation of waterflooding andthe onset of seismic activity at Rangely.Nevertheless, a correlation betweenseismicity and high pore pressure was es-tablished as soon as a clear pattern ofearthquake activity emerged from analysisof the data from the microearthquake net-work (Fig. I b).
108° 52' 30"
Table 1. Subsurface rocks in the Rangely OilField.
Thick- DepthFormation ness (in)
(m)Mancos shale 990 990Dakota sandstone 93 1083Morrison formation 223 1306Curtis formation 30 1336Entrada sandstone 43 1379Carmel formation 23 1402Navajo sandstone 160 1562Triassic (undifferentiated) 273 1835Park City formation 43 1878Weber sandstone 408 2286Pennsylvanian upper 102 2388member of Morganformation
A seismic network consisting of 14short-period, vertical seismometers was in-stalled in 1969 and the data telemetered toMenlo Park. The network was maintainedin essentially the same configuration dur-ing the period of the experiment to avoidany problems that might arise from chang-ing the number of stations or the in-strumentation. As the data were analyzedsystematically by a small group of people,and most were examined by one person,there are no inconsistencies resulting fromchanges in staff or in analysis procedures.
Because the zone in which we were ableto control the fluid pressure in this experi-ment is not large, the location of the earth-quakes is critically important for estab-
lishing the relationship between fluid pres-sure and seismicity. Procedures have beendeveloped to determine the parameters ofa flat-layered velocity model from a set ofearthquake data in a dense network ofseismograph stations. If horizontal veloci-ty gradients exist, systematic errors will bepresent in the earthquake locations calcu-lated from a flat-layered model. It turnedout that a systematic bias does exist in thestandard locations, which moves earth-quakes toward the north.To determine the parameters of a flat-
layered model that would fit the data, weused a linear velocity function approxi-mated for computation by 0.5-km-thicklayers. The parameters of this model werevaried to minimize the residuals-differ-ences between the measured and calculatedcompressional wave arrival times-in a setof 100 earthquakes, and a station correc-tion was determined for each station thatwould compensate for variations in near-surface structure.Two people independently picked the ar-
rival times for the set of earthquakes, andtwo independent locations were deter-mined by using the Hypolayr routine (7).The histogram of the horizontal distancesbetween these pairs of locations (Fig. 2)provides an estimate of the random errorsin the location procedure. Some of thepairs of locations were separated by morethan 400 m, but most were closer than 200m.The velocity model derived from the
UT area A 1~UCo /° 0 1 2 km . t
I0 5 mco co
I I/ I /40 3.0 40 3.0
Fig. 1. (a) Structure contour map of the Rangely anticline with subsurface faults shown as dashed lines. The contour interval is 150 m, indicating depthbelow sea level to the Weber sandstone. ( 0 ) Experimental wells used for varying fluid pressure in Weber sandstone. (O) Well used for measurement ofstress. (A) Seismic stations. (b) Earthquakes (x) located at Rangely between October 1969 and November 1970. The contours are bottom-hole 3-dayshut-in pressures as of September 1969; the interval is 70 bars. ( A) Seismic stations; (*)experimental wells. The heavy, dashed line indicates the faultmapped in the subsurface.
123126MARCH 1976
on
Aug
ust 1
0, 2
008
ww
w.s
cien
cem
ag.o
rgD
ownl
oade
d fr
om

earthquake data was a good approxima-tion to the velocity measured in a well inthe center of the oil field, and earthquakeslocated with this model had residuals thatwere of the same magnitude as the prob-able error in the measured arrival times(0.01 to 0.02 second).
Lateral variations in the velocity-depthprofile cannot be easily detected from theearthquake data alone, and lateral varia-tions in velocity can result in a systematicbias in location. To test for such a bias, acalibration shot was fired at a depth of2000 m in one of the injection wells. Thesignals from the shot were well recorded onmost of the regular stations and on a sup-plementary network installed to record theshot. The calculated location of the shotfell 200 to 300 m north of the actual loca-tion, depending on which combination ofstations was used to'locate it. The mostdistant stations did not record the shot,and it is probable that lateral trends in ve-locity would produce a greater offset in thelocation if data from the distant stationswere available.The pressure changes in the Weber sand-
stone brought about by the removal offluid from the center of the field and in-jection of water around the edges of thefield are large enough to produce a signifi-cant change in velocity. Measurements ofvelocity in the Weber sandstone as a func-tion of effective confining pressure indicatethat a change as large as 5 percent is pos-sible (8). The distribution of the pressurechanges with respect to the seismic zonewould also produce a northward bias in theearthquake locations.The location of some important earth-
quakes is about 500 m north of the in-jection wells where the fluid pressure wasvaried. These earthquakes, when locatedwithout corrections for lateral velocityvariation, actually lie in a zone where thefluid pressure remained low during the ex-periment. Using the calibration shot dataand qualitative judgments about the prob-able lateral variations in velocity, we couldapply a set of reasonable corrections to thetravel times that would move these earth-quakes to the south into the zone of highfluid pressure. However, we chose topresent the earthquakes as located by a ve-locity structure with isotropic, flat layers,uncorrected for the error in location of thecalibration explosions. Therefore, the epi-centers appear to occur a few hundred me-ters north of their actual location (Fig. 6).
Several methods of estimating magni-tude were tested, and a method based onthe duration of the seismic signal wasfound to be the most systematic and reli-able. The duration of the signal was inde-pendent of the distance of the quake from
1232
40
~' 30
20'St10
0 0.2 0.4 0 0.2 0.4 0.6
Error in epicenter (km) Error in depth (km)
Fig. 2. Relative errors in epicentral and depthlocations of 100 earthquakes due to differencesbetween the first arrival readings made by twoseparate observers.
the station, and all but a few stations gave
a consistent measure of duration (t in sec-
onds) that was related to magnitude by M= 1.8 log t - 1.0. Stations that were anom-
alous with respect to the average were notused in the estimate of magnitude. The ac-
curacy of any measure of seismicity de-pends entirely on the precision of the esti-mated magnitudes of the smallest earth-quakes used in the count. Different cutoffmagnitudes were examined, and no sys-
tematic bias was observed that could be re-
lated to inaccuracies in magnitude. Earth-quakes with a coda length of more than 2seconds were located, and all locatedearthquakes were used in the seismicitystatistic.The magnitudes of the Rangely earth-
quakes chosen for study are ML > -0.5.Events of this magnitude were recorded as
clear signals on at least six stations. Thelargest earthquakes, both of which oc-
curred on 21 April 1970, were ML = 3.1.The earthquakes tended to cluster in timeand space as swarms of events of similarmagnitudes, followed in some cases bylarger-magnitude earthquakes with after-shock sequences. The epicenters of theearthquakes are distributed into two denseclusters in space, with one lying in the im-mediate vicinity of the experimental wellsand the other to the southwest (Fig. lb).The southwest cluster of hypocenters havefocal depths averaging 3.5 km, whereasthose beneath the injection wells havedepths of about 2.0 to 2.5 km within the in-jected horizon. The earthquakes lie along a
vertical zone trending nearly parallel to themapped subsurface fault. There are also a
few events located in the northwest end ofthe field (Fig. Ib).Taken altogether, the cumulative fre-
quency relative to magnitude of theRangely earthquakes fits the equation logN = a + bM. If the two clusters of earth-quakes are treated independently, the val-ue of b for the deeper, southwesterly clus-
ter is 0.81; that- for the northeasterly clus-ter is 0.96.
Focal plane solutions derived from theradiation pattern of compressional wavearrivals have been generated for a largenumber of individual earthquakes. The dis-tribution of the azimuths of the nearly ver-tical nodal planes is bimodal, with onepeak parallel to the trend of epicentersshown in Fig. 3. The nodal planes parallelto the epicentral trend and the subsurfacefault correspond to fault planes with aright-lateral sense of shear, having a slipdirection plunging 10° to 200 to the south-west (Fig. 3). The fault can therefore beconsidered to be a right-lateral, approxi-mately strike-slip fault. The variations inthe orientations of the nodal planes mayrepresent real differences in the orienta-tions of rupture surfaces rather than errorsdue to inaccuracies in the locations ofthe earthquakes. The width of the epicen-tral zone is more than I km, or three times.the error in the relative locations of theepicenters. It appears that the fault is not asingle, large fracture surface, but a broadzone composed of subparallel fractures.
Effective Stresses
To test the hypothesis that increasedfluid pressure triggered the earthquakes atRangely by reducing the effective normalstresses on the fault surfaces, we attemptedto measure the absolute stresses and ,theorientation of the fault planes and slip di-rections. Hydraulic fracturing of rock inboreholes affords a method to measure thein situ state of stress. The theory relatinghydraulic fracturing pressure to the stressin rocks is well understood (9), and fieldand laboratory experiments confirm thatthe technique works well under certainconditions. A hydraulic fracture experi-ment at a depth of 2 km in the Weber sand-stone at Rangely was carried out by Haim-son (10). He had shown from records ofprevious hydraulic fracturing operations inthe oil field that the least principal com-pressive stress was constant over large sec-tions of the reservoir.The method consists of increasing fluid
pressure in a borehole until the hoop ten-sile stresses in the wall of the hole exceedthe tensile strength of the rock. At thatpoint a tensile fracture opens and the pres-sure drops as fluid flows into the propagat-ing fracture. When the pump is shut down,the fluid pressure drops precipitously asfluid from the borehole continues to flowinto the fracture. When the fracturecloses, the fluid pressure flattens out at avalue (the instantaneous shut-in pressure)equivalent to the normal stress acting
SCIENCE, VOL. 191
on
Aug
ust 1
0, 2
008
ww
w.s
cien
cem
ag.o
rgD
ownl
oade
d fr
om

across the crack surface. In theory and ex-periment (11) the crack propagates normalto the least principal compressive stress.The shut-in pressure is equal to the leastprincipal stress, S3, and the maximum prin-cipal stress, S, is given by the relation
Pf= T+3S3-S-POwhere T is the tensile strength and P0 thepreexisting fluid pressure in the rock. Thebreakdown pressure is Pf. The experimentat Rangely was carried out in unfracturedrock of low permeability, 0.1 millidarcy,and yielded a vertical tensile fracture ori-ented N 700 E.
Laboratory experiments have shownthat the breakdown pressure is a functionof the rate of pressurization of the bore-hole in the laboratory specimen (10). Con-sequently, experiments were performed oncores of Weber sandstone to measurebreakdown pressure under known stressesand different rates of pressurization, to de-termine the appropriate value of T. Thepressurization rate at Rangely was 3 barsper second. At comparable pressurizationrates in the experiments the tensilestrength was about 100 bars. The exactrate is not important; in this range of pres-surization rates, the breakdown pressure isinsensitive to the rate. A specimen in whichthe internal hole was sealed with sealingwax also yielded a value of 100 bars, in-dicating that the permeability of the Web-er sandstone is not a significant factor inthe breakdown pressure at such pressur-ization rates (12).The hydraulic fracture in the reservoir
yielded the following values of the stresses.Given a measured value of 162 bars for P0,the initial fluid pressure in the rock, a shut-in pressure of 314 bars, and a breakdownpressure of 328 bars, then S, = 552 bars,S2= 427 bars (the overburden stress), andS3 = 314 bars.From the orientation of the fault and
slip direction determined from focal planesolutions of nearby earthquakes (13), theshear and normal stresses resolved into theslip direction and normal to the faultplane, respectively, are r = 72 bars and S0= 342 bars. The coefficient of static fric-tion, s, for faulted specimens of Webersandstone (14) is 0.81. Applying the Hub-bert-Rubey failure criterion to faulting atRangely
TC = (Sn -Pc)A.where Tc is the shear stress at failure, Sn isthe normal stress, and Pc is the criticalfluid pressure required to trigger earth-quakes, gives Pc = 257 bars as the criticalfluid pressure above which earthquakesshould be triggered.The orientations of the maximum and
26 MARCH 1976
minimum principal stresses are consistentwith those of the stresses measured at ornear the surface at several localities within50 km of Rangely (15). The approximatelyeast-west orientation of the regional maxi-mum compressive stress is consistent withthe mode of faulting as revealed by thefault zone trending about N 50° E. Ifstresses generated by the steep fluid pres-sure gradients in the field (Fig. 1b) were re-sponsible for triggering the earthquakes,the sense of slip would be left- rather thanright-lateral as observed. The principal testof the triggering mechanism is the effect onthe seismic activity of lowering and raising
the fluid pressure with respect to the 257-bar value calculated above. Our originalcalculation of the predicted triggeringpressure was published in 1972 (13). It wasnot until the period December 1972 toMay 1973 that a complete cycle of raisingand lowering the fluid pressure around thisvalue could be achieved.
Reservoir Fluid Pressures
Periodically a bottom-hole pressure sur-vey is made throughout the Rangely fieldin an attempt to map the pressure distribu-
Fig. 3. Compressional wave radiation patterns of Rangely earthquakes shown on lower hemisphereequal-area projections. Black is the first motion up, white the first motion down. The rose diagramshows azimuths of right-lateral nodal planes. The dashed line shows the southern boundary of the oilfield.
320
280-
L / Fe~~~~ ~~ee69\U' /Bottom hole pressure
S * / \ ~~~~~~~~(72hour shut-in)\240- / \\* -
Model calculation(Model approximately 500
feet WSW of Fee 69)
200
160 O' A M J J10 A S 0 N XD J F lM lA M J J
1972 1973
Fig. 4. Bottom-hole fluid pressures observed in experimental well Fee 69 compared with pressurescalculated from reservoir simulator model at a distance of 150 m west-southwest of the well.
1233
on
Aug
ust 1
0, 2
008
ww
w.s
cien
cem
ag.o
rgD
ownl
oade
d fr
om

tion in the Weber reservoir. To obtain rep-resentative reservoir pressures, a well isshut in and pressures are measured over aperiod of several days, then extrapolated to"undisturbed" reservoir pressures. Afterthe field was unitized in 1957, these sur-veys were made annually; in recent yearsthe surveys have been made every 2 years.The Weber reservoir pressure distribu-tion measured by the field's operatorsin 1969 (Fig. Ib) is typical of the re-cent pressure distribution in the oil field.A reservoir simulation model was 4evel-oped to provide a more detailed picture ofthe pressure distribution in the part of theoil field used in this experiment. The modelis used to solve the basic partial differentialequations for reservoir pressure by a finite-difference approximation method (16, 17).
Three phases-oil, gas, and water-haveexisted in the oil field. A gas cap that waspresent in the area of interest was removedin the first stages of production. Becausewe were only interested in calculating res-ervoir pressures, we simulated the reser-voir by a single-phase model, but used avariable compressibility in an effort tocompensate for the effects of the variationsin the oil/water ratio. The producible fluidnow in the area of earthquake activity iswater.The bottom-hole pressure measure-
ments fit the adjusted model rather well. Inparticular, the observed pressure history(Fig. 4) in well Fee 69 (Fig. 5) fits the cal-culated history closely.
Reservoir pressures were continuouslymonitored at the surface in five shut-inwells near the zone of earthquake activity;these observation wells are indicated inFig. 5. Pressure transducers were installedat the wellheads and data were transmittedto a central recorder at well Emerald 45,which is located 400 m west of the experi-mental wells. These data were supple-mented with the monthly bottom-holepressures taken in the same wells (Fig. 5).Two of the instrumented wells, UPRR
29-32 and UPRR 67-32, are close to thefault zone to the northeast. These wells areless than 800 m from the zone of earth-quake activity, and neither well shows amarked change in reservoir pressure thatcan be correlated with pressures in the ac-tive area (Fig. 5). This suggests that thefault to the northeast of the active area isnot a zone of unusually high permeabilityalong which pressure changes are rapidlytransmitted. The transmissibility (effectivepermeability) of this general part of thereservoir is approximately 15,000 to 30,000millidarcy-centimeters. Using the reservoirmodel, we experimented with anisotropicpermeability along the fault zone, makingthe fault zone two, three, and five timesmore permeable parallel to the fault. The
1234
V)
m
0-
150
1970 1971 1972 1973 1974
Emerald 36.
IETerald 21 UP 67-32
1 Fee 69 UP 29-32O 0 * . .
Emerald 45 _______
O 1 km .
Fig. 5. Pressure history and map showing obser-vation wells. Experimental wells are indicatedby large closed circles.
factor of 5 for anisotropy gave the best re-
sults.In contrast to the wells to the northeast,
Emerald 45, which is 0.75 km due west ofthe active earthquake zone, responds very
rapidly to pressure changes in the activearea. For most of the period the correla-tion in pressure between wells Fee 69 andEmerald 45 is quite striking (Fig. 5). Dur-ing the period December 1971 to March1973 the casing in Emerald 45 was leaking,and because of the leak the pressures are
not correlated during this period. After thecasing leak was fixed, in March 1973, thepressure in Emerald 45 again approachedand closely followed the pressure in Fee 69.Emerald 45 must be closely connected,presumably by a fracture or system offractures, to the zone influenced by the in-jection wells. That such rapid communica-tion of fluid pressures can take place in-dicates that it may be possible to quicklyeffect pressure variations in fractures with-in the fault zone.
Reservoir pressures at selected times inthe experiment were calculated for com-
parison with the earthquake activity (Fig.6a). The pressure distribution is shownonly on the epicenter maps that cover thepart of the field of interest. The verticaldistribution of pressures is not known, andno attempt is made to represent the fluidpressure in the vertical cross sections inFig. 6b. The 72-hour shut-in pressures
measured at the bottom of well Fee 69 are
taken as representative of the fluid pres-
sures in the earthquake zone, at least inthat part of the zone underlying the fourinjection wells. These shut-in pressures are
compared with a histogram showing thefrequency of seismic events in Fig. 7.
Controlling the Earthquakes
From October 1969 to 10 November1970, injection into the four designatedwells raised the bottom-hole pressure inthe vicinity from 235 to 275 bars (Figs. 5-7). During that time, more than 900 earth-quakes occurred in the field, 367 of themwithin 1 km of the bottom of the four in-jection wells. On 10 November the wellswere shut in for 3 days and then back-flowed. The record of pressure in Fig. 5shows the monthly 72-hour shut-in pres-sures taken at well Fee 69 dropping from275 to 203 bars in 6 months. Seismic activ-ity within 1 km of the wells dropped fromthe previous year's average of 28 earth-quakes per month to about 1 per month.On 26 May 1971 reinjection was initiated,and the bottom-hole pressure at Fee 69was raised to 265 bars. The seismic activitynear the wells remained at less than 1earthquake per month.
In September 1971 the pattern of water-flooding in the Rangely field wa-s changedto increase production of oil, and the well-head injection pressures in the experimen-tal area decreased as a result. The bottom-hole pressures then declined gradually un-til August 1972, when a booster pump wasinstalled to raise the pressures back to atleast the original value of 275 bars. Be-tween October 1972, when the bottom-holepressure first exceeded the predicted criti-cal value of 257 bars, and January 1973,when the pressure had risen to 275 bars,the monthly average of earthquakes nearthe wells rose to six. From January untilthe end of April, with the pressure standingat about 280 bars, the monthly average ofearthquakes near the wells was 26. Thewells were shut in and backflowing was be-gun on 6 May 1973. Since that day noearthquakes have been recorded within 1km of the bottom of the four injectionwells, and only one earthquake per monthhas been recorded along the fault zone tothe southwest.
Discussion and Conclusions
The experiment at Rangely has con-firmed the hypothesis that earthquakesmay be triggered by increase of fluid pres-sure and has shown that the effect is wellaccounted for by the Hubbert-Rubey prin-ciple of effective stress. The strong tempo-ral correlation between frequency of theseismic activity and variations in the fluidpressure around the predicted value is evi-dence for this conclusion. The frictionalstrength of the fault varies in direct pro-portion to the difference between the totalnormal stress and the fluid pressure. Thisresult comes as no surprise; the effect of
SCIENCE, VOL. 191
on
Aug
ust 1
0, 2
008
ww
w.s
cien
cem
ag.o
rgD
ownl
oade
d fr
om

pore pressure on brittle failure in rock hasbeen verified repeatedly in laboratory ex-periments. However, given the com-plexities of a real fault zone, with dimen-sions scaled up by four to five orders ofmagnitude relative to laboratory speci-mens, it is especially significant that suc-cessful prediction of the approximate porepressure required for triggering of earth-quakes according to the Hubbert-Rubeytheory was possible. In order for this to beso, several requirements had to be met.
It was necessary to know the completestate of stress and the distribution of fluidpressure at the depth of the earthquakehypocenters. The conditions for use of thehydraulic fracturing technique for stressmeasurement were nearly ideal. Moreover,the method could be applied economicallyat the depth where the earthquakes oc-curred because of the active drilling pro-gram in the oil field.
Permeability to fluid flow along the faultis sufficiently large that adjustment of fluidpressure in the fault follows rapidly uponchanges in fluid pressure at the experimen-tal wells. The cessation of seismic activitywithin 1 day of the initiation of backflow-ing the experimental wells in May 1973 es-tablished the correlation between fluidpressure and earthquakes beyond reason-able doubt. A large lag between fluid pres-sure changes in seismic activity would havenecessitated several repetitions of the in-jection-withdrawal cycle.
Extraction of oil (and injected water)just to the north of the experimental wellsserved to maintain fluid pressures overmost of the fault zone well below the criti-cal value for triggering earthquakes.Therefore, the length of the fault zone li-able to shear failure was so limited thatearthquakes of damaging size were virtual-ly precluded. It is this safety feature thatleads us to believe that earthquakes trig-gered inadvertently by raising subsurfacefluid pressures in otherwise seismically in-active areas can be controlled. By makinguse of the strengthening effect of a reduc-tion of fluid pressure in a major fault zone,we may ultimately be able to control thetiming and the size of major earthquakes.
Limiting the magnitudes ofearthquakes.Although fluid injection for secondary re-covery of oil or brine disposal has not, toour knowledge, triggered damaging earth-quakes, the procedure is becoming ex-tremely widespread, involving, in a fewcases, injection near large active faults.Moreover, filling of several large reservoirshas been accompanied by severe earth-quakes (18), probably through leakage ofthe impounded water into faults. In eithercase, with knowledge of the location of thefault on which the seismic activity is in-duced, drilling and pumping of pore fluid26MARCH 1976
frorn the fault zone could serve to reducethe hazard.The Rangely experiment has brought
the possibility for control of naturally oc-curring earthquakes into sharp focus. Wenow know that faults, at least in the shal-low crust, obey a simple failure law inwhich fluid pressure plays a clearly under-
N
E
_ .
stood role. The fault can be strengthenedlocally by reducing the internal fluid pres-sure, thereby creating a barrier to thepropagation of a. rupture. Provided thebarriers so created are spaced at distancesof one to a few kilometers apart, the frac-tures can be limited to lengths appropriatefor earthquakes of less than damaging size.
5 Nov 1971 * Aug 1972 Sep 1972- May 1973 Jun 1973 - May 1974
Fig. 6 (a) Seismicity at Rangely for different intervals of time. Pressures (bars) were calculated forthe reservoir at the times indicated, except for the map for October 1969 to October 1970, where thecontours are from bottom-hole pressures measured in September 1969. (b) Vertical sections lookingnorth, showing earthquakes as a function of time. The injection horizon, the Weber sandstone, andthe four experimental wells are shown.
1235
40 7.2 40 7.2
0 CM
Go
0 *CNov i970 - Jul 1971 ,
40 3.8 40 3.8
40 7.2 40 7.2I a0coG
Aug 1971 - Oct 1971 0
40 3.8 40 3.8
40 7.2 40 7.20 Ne 0n0 0l I*O
N^on
Jun 1973,, May 1914_
40 3.8 40 3.8
on
Aug
ust 1
0, 2
008
ww
w.s
cien
cem
ag.o
rgD
ownl
oade
d fr
om

GE
'U0
m
.0
Ez
19691 1970 1971 1972 1973 1 1974
Fluid Fluid ,|* Fluidinjection withdrawal injection
Fig. 7. Frequency of earthquakes at Rangely. Stippled bars indicate earthquakes within I km of ex-
perimental wells. The clear areas indicate all others. Pressure history in well Fee 69 is shown by theheavy line; predicted critical pressure is shown by the dashed line.
Various schemes can be conceived whichwould lead to reduction of the size ofearthquakes. For example, the San An-dreas fault has an average slip rate of 2 to 3cm per year (19). We wish to accommodatethe slip without permitting the strain to ac-
cumulate to yield great earthquakes every
100 to 200 years. An earthquake of mag-
nitude 4.5 requires a fault length of about5 km and yields 2 cm or so of slip. In one
scheme of earthquake control, wells are
drilled 5 km apart and 5 km or so in depth,and the fluid pressure is reduced by the re-
quired amount and over the required area
of the fault to arrest a fracture of this size.Another well is drilled in the center of each5-km section, and fluid is injected to trig-ger an earthquake (Fig. 8). Now, in thefaulted area the stress is relieved, but con-
centration of stress results at the ends ofthe fracture in the strengthened zones.
Next, fluid is pumped out of the wellsformerly used for injection, and this zone
becomes strengthened. The fluid is theninjected into the intervening wells, andnew earthquakes are triggered at theformer barriers so that the accumulatedstress is relieved. The procedure must bealternated at intervals of 6 months to ac-
commodate the required slip rate. Dieter-ich, who has contributed much to this dis-cussion, has developed a laboratory analogof this model (20).Whether such a scheme is feasible de-
pends on several factors, which presentlyare unknown. The permeability of the faultzone is chief among these. Should we findthat there are extensive sections of rock inthe fault that have very low permeability,
1236
removal of fluid to render the zone effec-tive as a crack arrester would require an
uneconomically large number of weils.There are no data on the permeability ofthe fault zone at depths where earthquakesoccur. Nor do we know the temperature,the existing state of stress or pore pressure,or much about the material properties ofthe fault zone. Except for conducting labo-ratory studies and developing case histo-ries of other earthquake sequences relatedto fluid pressure increases, there is littlethat can be done at this time in research on
earthquake control until those quantitiesare measured.A few holes 7 km or so in depth drilled
A CA B Ct t 4t
"~S Strength----Stress---- __
a b - FractureB /A B c
D ; 2// \Fracture.-* -r-Fracture
c d
Fig. 8. Hypothetical scheme for controllingearthquakes. (a) Fluid is removed from wells Aand C, with an increase in frictional strengthalong the fault. (b) Fluid is injected into well B,triggering an earthquake; the stress drops at Band increases at A and C, where the fracture isarrested. (c) Fluid is removed from well B, re-sulting in an increase in strength at B. (d) Fluidis injected at A and C, producing earthquakes,and the fracture is now arrested at B.
along critical sections of the San Andreasfault would provide data necessary to eval-uate the feasibility of controlling the be-havior of this dangerous fault. Many hypo-thetical problems have been conceived thatwould preclude the possibility of ever ob-taining any degree of useful control over agreat fault, and it is possible that a few ex-ploratory holes would demnonstrate that at-tempts to control the San Andreas faultwould be either too dangerous or too ex-pensive. But, given the encouraging resultsof the research reported in this article, wefeel that control of the San Andreas faultcould ultimately prove to be feasible.A more complete study of the fault mayreveal properties that might simplify thetechnical aspects of control. The recentrapid advances in research on the mech-anisms of earthquakes, combined with theRangely results, lead us to the conclusionthat initial experiments preliminary tocontrol of earthquakes on the San Andreasfault should now be carried out.
Summary
An experiment in an oil field at Rangely,Colorado, has demonstrated the feasibilityof earthquake control. Variations inseismicity were produced by controlledvariations in the fluid pressure in a seismi-cally active zone. Precise earthquake loca-tions revealed that the earthquakes clus-tered about a fault trending through a zoneof high pore pressure produced by second-ary recovery operations. Laboratory mea-surements of the frictional properties ofthe reservoir rocks and an in situ stressmeasurement made near the earthquakezone were used to predict the fluid pressurerequired to trigger earthquakes on pre-existing fractures. Fluid pressure was con-trolled by alternately injecting and recov-ering water from wells that penetrated theseismic zone. Fluid pressure was moni-tored in observation wells, and a computermodel of the reservoir was used to infer thefluid pressure distributions in the vicinityof the injection wells. The results of this ex-periment confirm the predicted effect offluid pressure on earthquake activity andindicate that earthquakes can be controlledwherever we can control the fluid pressurein a fault zone.
References and Notes1. D. Evans, Mt. Geol. 3, 23 (1966).2. J. R. Healy, D. T. Griggs, W. W. Rubey, C. B.
Raleigh, Science 161, 1301 (1968).3. R. C. Munson, thesis, Colorado School of Mines
(1968)4. J. F. Gibbs, J. H. Healy, C. B. Raleigh, J. M.
Coakley, Bull. Seismol. Soc. Am. 63, 1557 (1973).5. C. R. Thomas, Map of the Rangely Oil and Gas
Field, Rio Blanco and Moffat Counties, Colorado(Oil and Gas Investigations No. 41, U.S. Geologi-cal Survey, Washington, D.C., 1945).
6. E. Klipp, personal communication.
SCIENCE, VOL. 191
on
Aug
ust 1
0, 2
008
ww
w.s
cien
cem
ag.o
rgD
ownl
oade
d fr
om

7. J. P. Eaton, "HYPOLAYR," U.S. Geol. Sur.Open-File Rep. (1969).
8. R. Stewart, personal communication.9. R. 0. Kehle,J. Geophys. Res. 69, 259 (1964).
10. B. C. Haimson, Proc. 14th Symp. Rock Mech.(1972), p. 689.
I1. M. K. Hubbert and D. G. Willis, Trans. AIME 210,153 (1957).
12. The apparent increase in breakdown pressure athigh pressurization rates is related to the inabilityof the viscous fluid to reach the tip of the propagat-ing crack (M. Zoback, F. Rummel, R. Jung, H. Al-hied, personal communication). The pressure in theborehole will, therefore, continue to rise ratherthan show a sudden flattening out with time.
13. C. B. Raleigh, J. H. Healy, J. D. Bredehoeft,Geophys. Monogr. Am. Geophys. Union 16(1972), pp. 275-284.
14. J. D. Byerlee, Int. J. Rock Mech. Min. Sci.Geomech. Abstr. 12, 1 (1975).
15. C. B. Raleigh, in Advances in Rock Mechanics(National Academy of Sciences, Washington,D.C., 1974), vol. 1, part A, pp. 593-597.
16. D. W. Peaceman and H. H. Rachford, Jr., J. Soc.Ind. Appl. Math. 3, 28 (1955).
17. G. Pinder and J. D. Bredehoeft, U.S. Geol. Surv.Water Resour. Div. 4 (No. 5), 1069 (1968).
18. H. K. Gupta, B. K. Rastogi, H. Narain, Geophys.Monogr. Am. Geophys. Union 17 (t973), pp. 455-467.
19. R. E. Wallace, Geol. Soc. A m. Bull. 81, 2875(1970).
20. J. H. Dieterich and C. B. Raleigh, Eos 55, 353(1974).
21. We wish to acknowledge the excellent work of J.Bohn and L. Peake in reading and analyzing theseismic records from Rangely. Our colleagues J.D. Byerlee, J. H. Dieterich, and J. Handin contrib-uted significantly to this work. D. T. Griggs andW. W. Rubey encouraged us to begin this ex-periment and gave valuable advice and supportover the 5 years required to complete it. We re-ceived valuable advice from a panel appointed bythe Advanced Research Projects Agency. Thework was carried out under ARPA order 1684.
with x,y the usual space coordinates, in ourcase
Ganymede is the largest moon of Jupi-ter, having a diameter of about 5000 km.Because earth-based telescopes can barelyresolve it, the details of Ganymede's sur-face are largely unknown. Other, nonvisualevidence has led to the belief that its sur-face is very rough, largely composed ofrocky or metallic material embedded in ice(1). The detailed pictures presented hereprovide a body of visual information onthe surface makeup of Ganymede.
During its mission to Jupiter, the Pio-neer 10 spacecraft acquired two pictures ofGanymede (2), which provided a much im-proved view of its surface. The pictureswere obtained with two different color fil-ters, one in red (5950 to 7200 A) and one inblue (3900 to 5000 A). Unfortunately,these pictures are quite blurred because ofthe small scale of details on Ganymede rel-ative to the size of the image blur spot (thetotal instrument response function).We report here the results of an attempt
to restore the pictures-that is, to removethe blur due to the instrument responsefunction. Such removal is at least theo-retically possible, because the instrumentresponse function is deterministic, andlargely known.The authors are professors of optical sciences at the
University of Arizona, Tucson 85721.
26 MARCH 1976
Let s(x,y) represent the instrument re-
sponse function, with x,y the usual spacecoordinates. Mathematically, the restora-tion problem consists in inverting theimaging equation
(Xm,y") = ffdx'dy'O(x',y') xscene
S(Xm-X ,Yn-Y) ( )
m,n = 1,2,...,Mfor the unknown O(x',y'), the "restora-tion." The irradiance image data i(Xm,Yn)and response function s(x,y) are assumedknown, from measurements, and hencecontain noise. Such noise is the chiefimpediment to estimating O(x',y').Three factors aided in making such res-
toration practicable. First, the irradianceimage is a linear function of the imagedata; hence, there are no problems of esti-mating the irradiance image such as occurwhen the image is photographic.Second, and most important, the image
was sampled at a sufficiently fine subdivi-sion to allow some degree of enhancement.There were about 28 sampled image valueswithin the central core of the two-dimen-sional instrument response function.
Third, the instrument response functionis very nearly separable. That is, if s(x,y)represents the general response function,
(2)Functions s, and S2 are the x- and y-com-ponent marginal distributions of s. Al-though Eq. 2 is an approximation, themaximum discrepancy between the left-and right-hand sides is about 2 percent ofthe central maximum in s. Figure I showsthe marginal imaging kernels s, and s2.
Separability is important because it per-mits use of a restoration procedure-themaximum entropy algorithm-whose out-put is constrained to be positive (or zero)everywhere (3). The general two-dimen-sional case would otherwise require toomuch computer time. Because of separa-bility, the two-dimensional image may berestored as a sequence of one-dimensional,or line, restorations. These may be imple-mented with enough speed to permit thepositive constraint to be enforced on themoderate-sized Ganymede pictures dis-cussed below.One negative aspect of the problem was
the occasional existence of artifacts in theimage data. Even worse, the artifacts weresystematic-that is, highly correlated-and hence indistinguishable from true de-tail. We discuss below the steps we took tominimize this problem.The images were restored in two differ-
ent ways: by conventional linear filteringand by the maximum entropy algorithmcited above. To the best of our knowledge,the latter is the first published use ofthis kind of algorithm on real (non-simulated), moderately extended imagedata.The linear restoring algorithm was of
the type used by Nathan (4)-inverse fil-tering, with a maximum permitted boost inamplitude specified by the user. Phase wasalways fully corrected. All operations onthe image data were in direct (com-pared to frequency) space. Hence, theimage was restored by convolution with afunction whose Fourier transform is theupper-bounded, inverse filter. We triedmaximum boosts of 2, 4, 5, and 10 beforesettling on 2 as the most reliable.
1237
Restored Pictures of Ganymede,Moon of Jupiter
Digital restoration of two space pictures of Ganymedehas revealed some interesting surface features.
B. Roy Frieden and William Swindell
S(X,Y) .-- SIWS2CY)
on
Aug
ust 1
0, 2
008
ww
w.s
cien
cem
ag.o
rgD
ownl
oade
d fr
om