Embed Size (px)
Citation preview

An Examination of the Former Centrally Planned Economies 25 Years After the Fall of Communism
By James Gwartney, [email protected] (Florida State University) and Hugo Montesinos,
[email protected] (Florida State University).
James D. Gwartney is a Professor of Economics and the Gus A. Stavros Eminent Scholar at Florida
State University. Hugo M. Montesinos is a doctoral student and resident econometrician at
Florida State University. This report was initially prepared for presentation at the annual meeting
of the Economic Freedom of the World network held September 28-30, 2017 in Kiev, Ukraine.
Key findings
This report examines the changing economic and political institutions of 25 former centrally planned
(FCP) economies following the collapse of communism and analyzes how the changes have impacted
performance. The key findings of the study are:
1. Seven of the 25 FCP economies ranked in the top quarter of the 159 countries included in the
Economic freedom of the World project in 2015. These seven countries – Georgia, Estonia,
Lithuania, Latvia, Romania, Armenia, and Albania – had a 2015 Economic Freedom of the World
(EFW) summary rating of 7.5 or higher. Another nine countries – Czech Republic, Bulgaria,
Poland, Slovak Republic, Hungary, Kazakhstan, Macedonia, Croatia, and Slovenia – had 2015
EFW summary ratings between 7.0 and 7.5 and ranked in the second quartile worldwide. All of
these countries achieved substantial increases in economic freedom during 1995-2015. Another
nine FCP economies – Kyrgyz Republic, Tajikistan, Montenegro, Serbia, Bosnia and Herzegovina,
Russia, Moldova, Azerbaijan, and Ukraine – have 2015 EFW summary ratings of less than 7.0.
This latter group has moved more slowly toward the institutional framework of a market
economy.
2. The countries with more economic freedom grew more rapidly than those that were less free.
Six of the seven countries in the most-free group achieved a robust annual growth rate of per
capita GDP of 4.0 percent or higher during 1995-2015. The exception was Romania, which was a
late reformer and achieved a growth rate of 4.56 during 2000-2015 after adopting reforms
supportive of economic freedom. Among the nine countries in the middle group, only Poland
and Kazakhstan achieved an annual growth rate greater than 4 percent. Among the eight
countries in the least free group for which data were available, only Bosnia and Herzegovina and
Azerbaijan achieved an annual growth rate greater than 4 percent. The growth rate of Bosnia
and Herzegovina was almost certainly exaggerated because of its low 1995 per capita GDP as
the result of civil war, while the high growth rates of both Azerbaijan and Kazakhstan were
elevated by the increasing and abnormally high oil prices during 2002-2014.
3. International trade (imports plus exports) as a share of GDP increased substantially in most all of
the countries in the most free and middle group during 1995-2015. The increases in the size of

the trade sector were particularly large for the ten FCP countries that joined the European
Union during 2004 and 2007. Net foreign direct investment as a share of GDP also increased
substantially during the first decade of the 21st century. These trends are indicative of greater
integration into the world economy. However, the foreign investment rate has fallen
substantially since 2010. This decline is a sign of potential trouble ahead.
4. The poverty rates rose in several FCP economies during the transition phase of the 1990s and
early years of the 21st century. However, the poverty rates declined rapidly thereafter. By 2015,
the moderate poverty rate ($3.10 per day in 2011 dollars) was lower than the 1995 rate in all
the FCP economies. In 2015, the moderate poverty rate was less than 10 percent in 21 (and less
than 5 percent in 18) of the 25 FCP economies.
5. During 1995-2015, the political institutions of most FCP economies moved toward protection of
civil liberties, democratic decision-making, and better control of corruption. The following nine
countries had 2015 political institutions most consistent with civil liberties protection, political
democracy, constraints on the executive, and absence of corruption: Estonia, Lithuania, Latvia,
Czech Republic, Poland, Slovak Republic, Hungary, Croatia, and Slovenia. In contrast, the political
institutions of Kazakhstan, Tajikistan, Russia, and Azerbaijan were least consistent with
protection of civil liberties, democratic principles, and absence of corruption.
6. The per capita GDP of the FCP economies rose substantially during 1995-2015 relative to the
high-income countries of Europe and the world. The largest increases in relative income were
registered by Georgia, Lithuania, Latvia, Armenia, Albania, Kazakhstan, Azerbaijan, and Bosnia
and Herzegovina. The per capita GDP of each of these countries relative to the mean of the
world’s 21 high-income countries more than doubled between 1995 and 2015. Five of these
eight countries are in the group with the highest 2015 economic freedom ratings.
7. Regression analysis was used to estimate the impact of initial income, economic freedom,
population, demographic factors, net foreign direct investment, and net fuel exports on the
growth of per capita GDP. This comprehensive model explained approximately two-thirds of the
cross-country variation in growth of per capita GDP among the 122 countries for which the data
were available during 1995-2015 and 2000-2015. The regression model indicates that economic
freedom exerts a positive and highly significant impact on economic growth, even after
accounting for the other factors included in the model. The dummy variable for the FCP group
with a 2015 EFW rating above 7.5 was always significant, indicating that the growth rates of
these countries was more rapid than the world’s 21 high-income countries.
8. Regression analysis was also used to examine the determinants of life satisfaction, a measure
developed from the World Values Survey. A set of personal attributes (such as employment,
relative income, gender, and age) and country specific measures including the summary EFW
rating, per capita GDP, the Polity IV democracy score, and language fractionalization were
incorporated as independent variables. The results indicate that economic freedom exerts a
significant positive impact on life satisfaction both directly and indirectly (through per capita
GDP). While the life satisfaction of persons living in FCP countries was well below that of similar
individuals in other countries during the 1990s, the gap has declined, and by 2010-2014, it was
virtually eliminated.

9. The economic freedom area ratings of the FCP countries increased substantially in areas 1 (size
of government), 3 (access to sound money), 4 (international trade) and 5 (regulation of finance,
labor, and business) during 1995-2015. In these four areas, the economic freedom ratings of the
FCP countries, particularly the 11 that are now members of the European Union, are
approximately the same as the ratings of the high-income European countries.
10. There is a huge gap in the quality of the legal systems (EFW Area 2) of the FCP countries
compared to the high-income countries of Europe. Moreover, the FCP countries have failed to
improve in this area. There are even some signs of deterioration in several FCP countries. Unless
the FCP countries improve their legal systems, their future growth will slow and their gains
relative to high-income countries come to a halt. This may already be happening, as foreign
direct investment has declined sharply and real economic growth slowed since 2010.
Introduction
A little more than a quarter of a century has passed since the collapse of communism. This is an ideal
time to evaluate the response of these countries. Which countries have moved the most toward
economic liberalization? How have the former centrally planned (FCP) economies performed in recent
decades? How have their political institutions evolved during the transition era and beyond? What
lessons can be learned from the experience of these economies? This report will address each of these
questions.
In some ways, the experience of the FCP countries constitutes a natural economic experiment. There is
considerable diversity in the paths they have followed. Some moved rapidly toward economic reform
and liberalization following the collapse of communism, but others moved more slowly, and still others
have undertaken little or no reform. Some of the FCP countries had relatively high per capita incomes
prior to the fall of communism, while others were exceedingly poor. Some experienced lengthy and
painful transitions, while others made the move from central planning to markets more smoothly. Some
of these countries are now highly democratic, while others are still governed by authoritarian political
regimes. As we examine the experience of these economies, we will do so with an eye to what can be
learned about institutions, economic growth, and the development process.
This study is organized in the following manner. Section 1 examines the path of economic liberalization
of 25 FCP economies during 1995-2015. Section 2 presents data on various indicators of economic
performance during this same time frame. Section 3 focuses on the evolution of the political institutions
(e.g. protection of civil liberties, democracy, control of corruption) in the FCP countries. Section 4
compares the income levels and growth rates of these economies relative to the world’s high-income
countries and other developing economies. Sections 5 and 6 use regression analysis to examine the
determinants of economic growth and life satisfaction and consider the implications for the FCP
economies. Section 7 analyzes areas where the FCP economies have made substantial moves toward
economic liberalization, as well as a major deficiency – low quality legal systems -- that is likely to

restrain their future progress. Section 8 considers the implications for the future. The addendum
provides additional details on the economic liberalization of ten “success stories” -- countries that made
the transition from central planning to markets most successfully.
1. Economic Liberalization of the Former Centrally Planned Economies
The Economic freedom of the World project provides a measure of the degree to which the institutions
and policies of various countries are consistent with economic freedom (Gwartney, Lawson, and Hall
2017). This measure uses more than 40 different variables to construct a summary index of economic
freedom. The economic freedom of the world (EFW) index now covers 159 countries and the data are
available for 123 countries since 1995. This data set makes it possible to identify cross-country
differences in economic freedom and to track changes across time.
The EFW index is designed to measure the degree to which the institutions of a country are supportive
of (1) personal choice, (2) voluntary exchange, (3) open entry into markets, and (4) protection of
individuals and their property from aggression by others. Because economic freedom facilitates and
encourages gains from trade, entrepreneurship, innovation, and capital formation, economic theory
indicates that it is an important source of economic growth and development. Several empirical studies
have found that this is indeed the case. See for example Berggren (2003), De Haan, Lundström, and
Sturm (2006), Dawson (1998 and 2003), Faria and Montesinos (2009), Faria, Montesinos, Morales, and
Navarro (2016), Feldmann (2017), Justesen (2008), and Nystrom (2008). Moreover, economic freedom
permits individuals to mold and shape their lives according to their preferences. Over and above the
impact on income, this may enhance quality of life.
There are 25 former centrally planned (FCP) economies for which the Economic Freedom of the World
(EFW) data are now available. These data are available continuously throughout the 1995-2015 period
for 14 of these countries. This study will focus on analysis of these 25 FCP economies.
Table 1 provides the EFW summary ratings and worldwide rankings (in parentheses) for these 25
countries (when available) for 1995, 2000, 2005, 2010, and 2015. Seven of the FCP economies (Georgia,
Estonia, Lithuania, Latvia, Romania, Armenia, and Albania) had a 2015 EFW summary rating of 7.5 or
higher. Worldwide, these seven countries all ranked in the top quartile among the 159 countries for
which the EFW data were available. Moreover, these countries have achieved dramatic increases in
economic freedom. While the Baltic states all ranked in the Top 20 in 2015, in 1995 Estonia was 57th,
Lithuania 80th, and Latvia 75th. Romania ranked 20th in 2015, but it was a late reformer. Romania’s
worldwide ranking was 118th in 1995 and 107th in 2000 (among the 123 countries included in the index
during those years. Albania has steadily improved both its rating and ranking, moving up from 96th in
1995 to 63rd in 2005 and 32nd in 2015. While the EFW data were unavailable for Georgia and Armenia
during 1995 and 2000, the ratings and rankings of both have increased since 2005.

Table 1: Economic Freedom Ratings and Rankings for the 25 Former Centrally Planned Countries, 1995-
2015
Country 1995 2000 2005 2010 2015
Top EFW Group: 2015 EFW ≥ 7.50
Georgia 7.42 (33) 7.50 (27) 8.01 (8)
Estonia 6.12 (57) 7.48 (23) 7.96 (11) 7.82 (10) 7.95 (10)
Lithuania 5.51 (80) 6.90 (53) 7.37 (40) 7.47 (29) 7.92 (13)
Latvia 5.59 (75) 7.13 (39) 7.42 (33) 7.23 (50) 7.75 (17)
Romania 3.83 (118) 5.37 (107) 7.24 (49) 7.30 (45) 7.72 (20)
Armenia 7.31 (44) 7.56 (24) 7.60 (29)
Albania 5.10 (96) 6.20 (73) 6.96 (63) 7.35 (37) 7.54 (32)
Middle EFW Group: 2015 EFW between 7.00 and 7.50
Czech Rep 5.99 (72) 6.71 (62) 6.98 (62) 7.22 (52) 7.46 (42)
Bulgaria 4.8 (101) 5.52 (104) 6.95 (64) 7.30 (45) 7.39 (48)
Poland 5.28 (90) 6.58 (72) 6.89 (67) 7.12 (61) 7.34 (51)
Slovak Rep 5.25 (83) 6.85 (57) 7.63 (20) 7.47 (29) 7.31 (53)
Hungary 6.15 (58) 7.03 (47) 7.20 (52) 7.31 (44) 7.30 (54)
Kazakhstan 6.83 (69) 6.94 (71) 7.18 (66)
Macedonia 6.36 (86) 6.93 (72) 7.17 (67)
Croatia 4.98 (94) 6.12 (78) 6.47 (83) 6.68 (88) 7.02 (72)
Slovenia 5.22 (87) 6.63 (71) 6.91 (66) 6.82 (80) 7.00 (73)
Bottom EFW Group: 2015 EFW < 7.00
Kyrgyz Rep 6.61 (79) 6.61 (94) 6.89 (80)
Tajikistan 6.28 (113) 6.80 (82)
Montenegro 6.35 (93) 7.33 (40) 6.77 (85)
Serbia 5.96 (109) 6.56 (97) 6.75 (88)
Bosnia&Hzgvna 6.18 (100) 6.63 (91) 6.61 (99)
Russia 4.48 (107) 5.39 (106) 6.24 (98) 6.54 (98) 6.60 (100)
Moldova 6.67 (73) 6.58 (96) 6.56 (102)
Azerbaijan 6.04 (106) 5.97 (127) 6.38 (114)
Ukraine 3.39 (123) 4.69 (117) 5.81 (118) 5.90 (133) 5.38 (149)
Number of countries included in the index
123 123 141 153 159
Source: 2017 Economic Freedom of the World Report. Note: The table is sorted according to the 2015
EFW summary rating. The worldwide EFW ranking, each year, is in parentheses. The total number of
countries included in the worldwide EFW ranking is in the last row of the table.

A group of nine other countries (Czech Republic, Bulgaria, Poland, Slovak Republic, Hungary, Kazakhstan,
Macedonia, Croatia, and Slovenia) had a 2015 summary EFW rating between 7.0 and 7.5. Worldwide,
the 2015 rankings of these countries ranged from 42nd for the Czech Republic to 73rd for Slovenia. Thus,
each of these nine countries ranked in the second quartile among the 159 countries included in the EFW
data set in 2015. These nine countries comprise the middle group in terms of economic liberalization
among the 25 FCP economies.
The Czech Republic is the highest ranked country in the middle group, and it has shown significant
improvement. It ranked 42nd in 2015, up from 72nd in 1995. Other countries in this group have registered
even more impressive gains in economic freedom. For example, Bulgaria’s 2015 worldwide ranking was
48th, up from 101st in 1995 and 104th in 2000. Poland ranked 51st in 2015, up from 90th in 1995 and 72nd
in 2000. The ranking of the Slovak Republic rose from 83rd in 1995 to 20th in 2005, but it has
subsequently receded to 53rd in 2015. The movements toward economic freedom of Hungary, Croatia,
and Slovenia during 1995-2015 were more modest.
Finally, there is another set of nine FCP economies with 2015 EFW summary ratings of less than 7.0. This
set of countries is comprised of the Kyrgyz Republic, Tajikistan, Montenegro, Serbia, Bosnia and
Herzegovina, Russia, Moldova, Azerbaijan, and Ukraine. The worldwide rankings of these countries
ranged from 80th for the Kyrgyz Republic to 149th for Ukraine. Except for Ukraine, the 2015 ranking for
each of these countries placed them in the third quartile worldwide. Ukraine was in the fourth quartile.
In 2015, these nine countries were the least economically free among the FCP economies. Further, there
is little evidence of improvement among the countries in this group. These countries ranked in the
bottom half worldwide during 1995-2005, and this was still true in 2015. The case of Russia is typical.
Russia ranked 107th in 1995, 98th in 2005, and 100th in 2015.
As we proceed, we will often divide the 25 centrally planned economies into these three groups as we
analyze their structure and performance.
2. Indicators of Economic Performance: 1995-2015
How does the performance of the former centrally planned (FCP) economies that have made more
substantial moves toward economic freedom compare with the performance of those that have been
slow to move toward economic liberalization? In order to provide insight on this question, this section
will examine the income levels, growth rates, international trade sectors, foreign investment, and
poverty levels of the FCP economies during 1995-2015.
Per Capita income
Table 2 shows the 2015 per capita GDP figures for each of the 25 economies and for the high, middle,
and low economic freedom groups. Both the simple mean and population weighted mean per capita
GDP data are presented for each of the three groups. Within the most economically free group, the
countries with the highest per capita 2015 GDP were Estonia, Lithuania, Latvia, and Romania. The 2015
per capita GDP for each of these countries exceeded $20,000. In the middle group, seven of the nine
countries (Czech Republic, Poland, Slovak Republic, Hungary, Kazakhstan, Croatia, and Slovenia) all
registered a 2015 per capita GDP of greater than $20,000. In this group only Bulgaria and Macedonia
failed to reach this benchmark. In the group with the lowest EFW ratings in 2015, only Russia achieved a
2015 per capita GDP of greater than $20,000. Four of the countries (Kyrgyz Republic, Tajikistan,
Moldova, and Ukraine) in this group had a 2015 per capita GDP figure of less than $10,000.
With regard to the mean figures for the three groups, both the simple mean and the population
weighted mean for the middle group was the highest, followed by the most economically free group.
The group with the lowest EFW ratings also had the lowest 2015 mean per capita income levels.
Growth of per Capita GDP
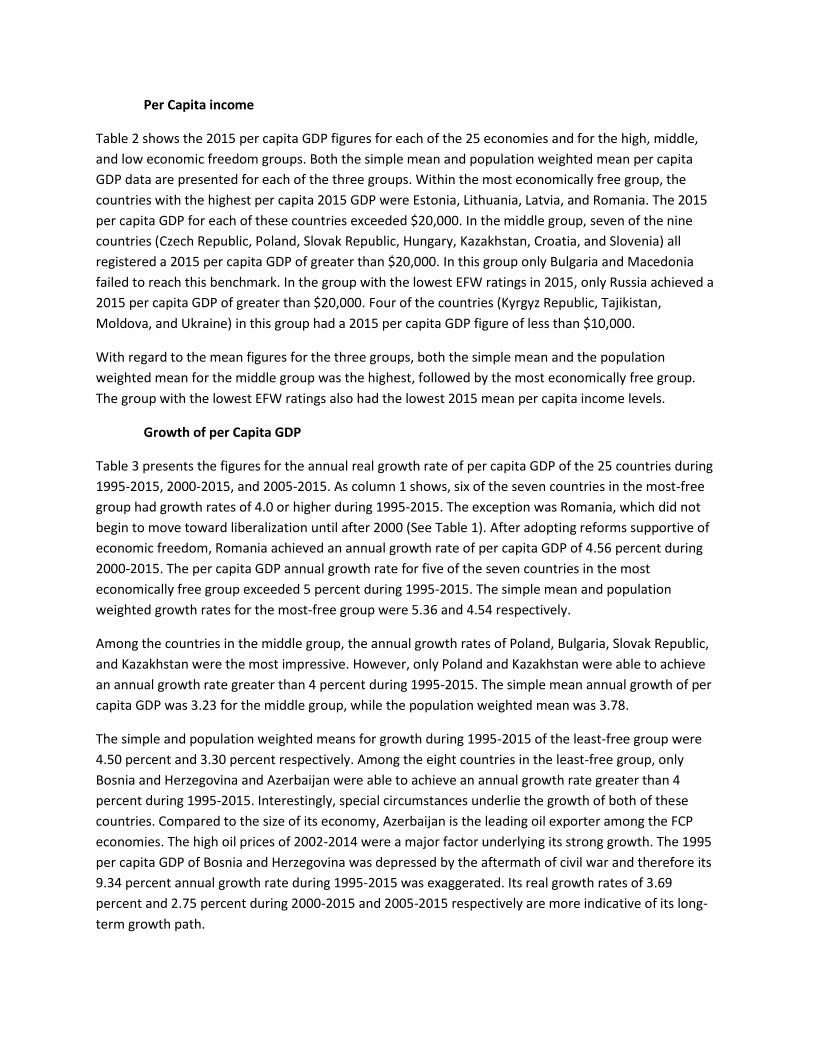
Table 3 presents the figures for the annual real growth rate of per capita GDP of the 25 countries during
1995-2015, 2000-2015, and 2005-2015. As column 1 shows, six of the seven countries in the most-free
group had growth rates of 4.0 or higher during 1995-2015. The exception was Romania, which did not
begin to move toward liberalization until after 2000 (See Table 1). After adopting reforms supportive of
economic freedom, Romania achieved an annual growth rate of per capita GDP of 4.56 percent during
2000-2015. The per capita GDP annual growth rate for five of the seven countries in the most
economically free group exceeded 5 percent during 1995-2015. The simple mean and population
weighted growth rates for the most-free group were 5.36 and 4.54 respectively.
Among the countries in the middle group, the annual growth rates of Poland, Bulgaria, Slovak Republic,
and Kazakhstan were the most impressive. However, only Poland and Kazakhstan were able to achieve
an annual growth rate greater than 4 percent during 1995-2015. The simple mean annual growth of per
capita GDP was 3.23 for the middle group, while the population weighted mean was 3.78.
The simple and population weighted means for growth during 1995-2015 of the least-free group were
4.50 percent and 3.30 percent respectively. Among the eight countries in the least-free group, only
Bosnia and Herzegovina and Azerbaijan were able to achieve an annual growth rate greater than 4
percent during 1995-2015. Interestingly, special circumstances underlie the growth of both of these
countries. Compared to the size of its economy, Azerbaijan is the leading oil exporter among the FCP
economies. The high oil prices of 2002-2014 were a major factor underlying its strong growth. The 1995
per capita GDP of Bosnia and Herzegovina was depressed by the aftermath of civil war and therefore its
9.34 percent annual growth rate during 1995-2015 was exaggerated. Its real growth rates of 3.69
percent and 2.75 percent during 2000-2015 and 2005-2015 respectively are more indicative of its long-
term growth path.

Table 2: Per capita GDP (2011 PPP dollars) in the Former Centrally Planned Economies, 1995-2015
Source: World Bank (2017). World Development Indicators. Note: The table is sorted according to the
2015 EFW summary rating. The worldwide 2015 EFW ranking, out of 159 countries, is in parentheses.
The population weighted mean was computed using the 2015 population. In the case of Montenegro,
the earliest per capita GDP figure available from the World Bank is for the year 1997. Therefore the per
capita GDP for Montenegro reported in the table is for 1997 rather than 1995.
Country (2015 EFW Rank) 1995 2000 2005 2010 2015
Top EFW Group 2015 EFW ≥ 7.50
Georgia (8) 2,295 3,264 4,902 6,734 9,025
Estonia (10) 11,362 15,703 22,807 22,741 27,329
Lithuania (13) 9,357 12,189 18,526 21,069 26,971
Latvia (17) 8,272 11,159 17,496 18,252 23,057
Romania (20) 10,546 10,523 14,656 17,818 20,538
Armenia (29) 2,173 2,925 5,357 6,703 8,180
Albania (32) 4,129 5,470 7,462 9,927 11,025
Simple Mean 6,876 8,748 13,029 14,749 18,018
Pop. Wtd. Mean 8,202 9,021 12,968 15,469 18,349
Middle EFW Group: 2015 EFW between 7.00 and 7.50
Czech Rep (42) 19,215 21,137 25,734 28,290 30,381
Bulgaria (48) 8,446 8,958 12,681 15,283 17,000
Poland (51) 11,300 14,732 17,194 21,771 25,299
Slovak Rep (53) 13,184 15,605 20,021 25,159 28,254
Hungary (54) 15,244 17,855 22,307 22,277 24,831
Kazakhstan (66) 8,283 9,952 16,014 20,097 23,522
Macedonia (67) 7,641 8,621 9,386 11,355 12,760
Croatia (72) 12,625 15,745 19,545 20,118 20,636
Slovenia (73) 18,431 22,723 26,955 28,678 29,097
Simple Mean 12,708 15,037 18,871 21,448 23,531
Pop. Wtd. Mean 12,044 14,595 18,393 21,791 24,646
Bottom EFW Group: 2015 EFW < 7.00
Kyrgyz Rep (80) 1,696 2,075 2,370 2,790 3,238
Tajikistan (82) 1,270 1,180 1,707 2,106 2,641
Montenegro (85) 10,205 10,075 11,397 14,035 15,291
Serbia (88) 7,393 7,985 10,901 12,688 13,278
Bosnia&Herzegovina (99) 1,827 6,327 8,315 9,717 10,902
Russia (100) 12,813 14,051 19,326 23,108 24,124
Moldova (102) 2,605 2,321 3,308 3,911 4,747
Azerbaijan (114) 3,320 4,459 8,052 15,950 16,699
Ukraine (149) 5,060 4,797 7,246 7,824 7,465
Simple Mean 4,498 5,919 8,069 10,237 10,932
Pop. Wtd. Mean 9,630 10,502 14,631 17,583 18,271
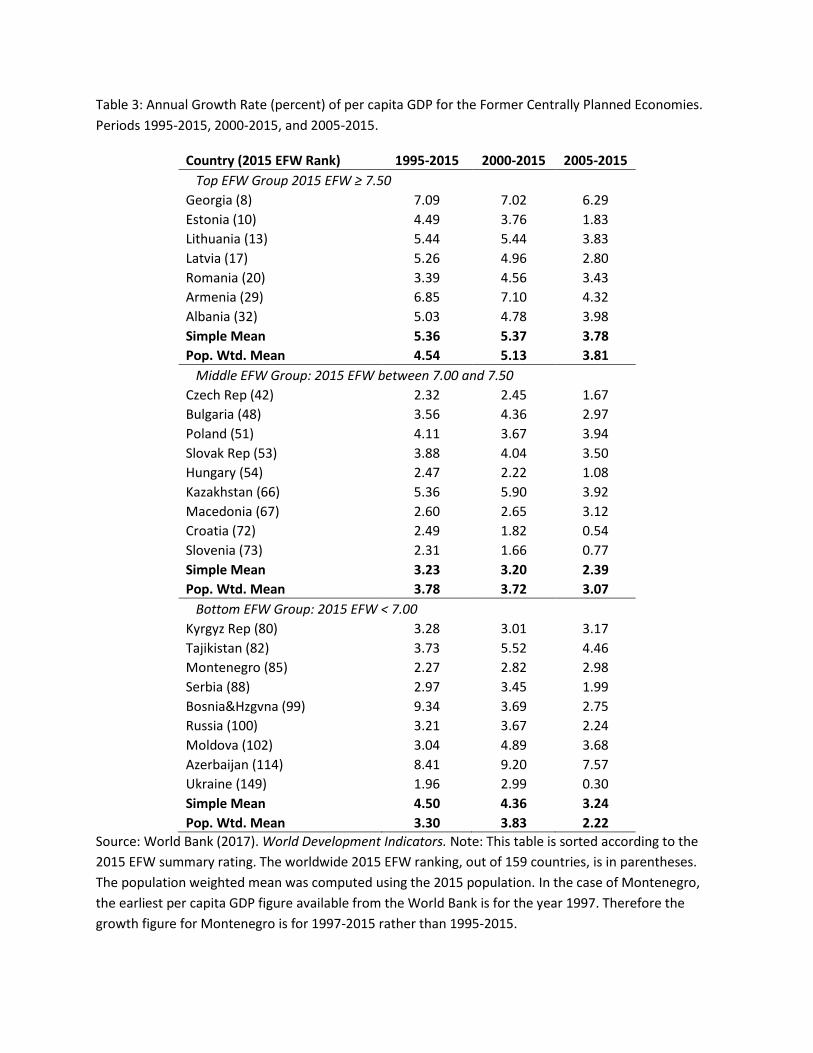
Table 3: Annual Growth Rate (percent) of per capita GDP for the Former Centrally Planned Economies.
Periods 1995-2015, 2000-2015, and 2005-2015.
Country (2015 EFW Rank) 1995-2015 2000-2015 2005-2015
Top EFW Group 2015 EFW ≥ 7.50
Georgia (8) 7.09 7.02 6.29
Estonia (10) 4.49 3.76 1.83
Lithuania (13) 5.44 5.44 3.83
Latvia (17) 5.26 4.96 2.80
Romania (20) 3.39 4.56 3.43
Armenia (29) 6.85 7.10 4.32
Albania (32) 5.03 4.78 3.98
Simple Mean 5.36 5.37 3.78
Pop. Wtd. Mean 4.54 5.13 3.81
Middle EFW Group: 2015 EFW between 7.00 and 7.50
Czech Rep (42) 2.32 2.45 1.67
Bulgaria (48) 3.56 4.36 2.97
Poland (51) 4.11 3.67 3.94
Slovak Rep (53) 3.88 4.04 3.50
Hungary (54) 2.47 2.22 1.08
Kazakhstan (66) 5.36 5.90 3.92
Macedonia (67) 2.60 2.65 3.12
Croatia (72) 2.49 1.82 0.54
Slovenia (73) 2.31 1.66 0.77
Simple Mean 3.23 3.20 2.39
Pop. Wtd. Mean 3.78 3.72 3.07
Bottom EFW Group: 2015 EFW < 7.00
Kyrgyz Rep (80) 3.28 3.01 3.17
Tajikistan (82) 3.73 5.52 4.46
Montenegro (85) 2.27 2.82 2.98
Serbia (88) 2.97 3.45 1.99
Bosnia&Hzgvna (99) 9.34 3.69 2.75
Russia (100) 3.21 3.67 2.24
Moldova (102) 3.04 4.89 3.68
Azerbaijan (114) 8.41 9.20 7.57
Ukraine (149) 1.96 2.99 0.30
Simple Mean 4.50 4.36 3.24
Pop. Wtd. Mean 3.30 3.83 2.22
Source: World Bank (2017). World Development Indicators. Note: This table is sorted according to the
2015 EFW summary rating. The worldwide 2015 EFW ranking, out of 159 countries, is in parentheses.
The population weighted mean was computed using the 2015 population. In the case of Montenegro,
the earliest per capita GDP figure available from the World Bank is for the year 1997. Therefore the
growth figure for Montenegro is for 1997-2015 rather than 1995-2015.

The FCP countries that liberalized the most generally grew more rapidly during 1995-2015 than their
counterparts that were slow to reform. Consider the number of countries in each of the three groups
that achieved an annual growth rate of at least 4 percent during the two-decade time frame. Six of the
seven countries in the most economically free group achieved this benchmark, but only two of the nine
countries in the middle group and only two of the eight countries in the least-free group were able to
achieve this figure. Moreover, the population weighted mean annual growth rate of the most-free group
was 4.54 percent, compared to 3.78 percent for the middle group and 3.30 percent for the least-free
group.
Table 3 (columns 2 and 3) present growth rate data similar to that of column 1 except that the periods
examined are 2000-2015 and 2005-2015. A comparison of the growth rates across the three periods
highlights an important point: the growth rates of the most recent decade were lower than for the
earlier periods for 21 of the 25 countries. Only two countries – Macedonia and Montenegro – had a
higher growth rate of real GDP during 2005-2015 than during the longer time periods. This illustrates
that the rate of growth for most of these economies has slowed in recent years. Nonetheless, the per
capita GDP of ten of the 25 FCP countries (Georgia, Lithuania, Armenia, Albania, Poland, Kazakhstan,
Slovak Republic, Tajikistan, Moldova, and Azerbaijan) grew at an annual rate of 3.5 percent or higher
during 2005-2015. Thus, while growth has generally slowed, it remains relatively strong among these
economies.
Table 4 presents the real growth rate of the 25 economies according to high and low initial income
status. The high-income group is comprised of countries with a 1995 real per capita GDP (measured in
2011 dollars) of greater than $8,000, while the low-income group contains those countries with a 1995
per capita GDP below this benchmark. It is useful to view the data in this manner because lower income
economies are able to adopt technology and successful production procedures from the more advanced
countries with higher income levels. Thus, other things constant, one would expect the lower income
countries to grow more rapidly than their higher income counterparts. Within the two groups, the
countries are ordered from high to low according to their 2015 EFW rating.
Within the 13 countries in the high-income group, seven of the eight countries with the highest
economic freedom ratings (Czech Republic is the exception) achieved impressive growth rates during
1995-2015. Each of the seven countries grew at an annual rate of 3.39 or higher during 1995-2015.
Among the high-income group, three of the five countries with the lowest EFW ratings – Hungary,
Croatia, and Slovenia – lagged in terms of economic growth. Two countries (Russia and Kazakhstan) in
the high-income group achieved impressive growth rates even though their economic freedom levels
were low. Interestingly, both countries are leading oil exporters and the high world price of oil during
2002-2014 certainly enhanced their growth.
Table 4: Annual Growth Rates of per capita GDP (percent) of Former Centrally Planned Economies,
for High and Low-Income Groups, Periods: 1995-2015, 2000-2015, and 2005-2015.
1995 per
capita GDP Annual growth rate of real per capita GDP (percent)
Country (2015 EFW Rank) 2015 EFW
rating (2011 PPP
dollars)
1995-2015
2000-2015
2005-2015
High Income Group: 1995 per capita GDP greater than $8,000
Estonia (10) 7.95 11,362 4.49 3.76 1.83
Lithuania (13) 7.92 9,357 5.44 5.44 3.83
Latvia (17) 7.75 8,272 5.26 4.96 2.80
Romania (20) 7.72 10,546 3.39 4.56 3.43
Czech Rep (42) 7.46 19,215 2.32 2.45 1.67
Bulgaria (48) 7.39 8,446 3.56 4.36 2.97
Poland (51) 7.34 11,300 4.11 3.67 3.94
Slovak Rep (53) 7.31 13,184 3.88 4.04 3.50
Hungary (54) 7.30 15,244 2.47 2.22 1.08
Kazakhstan (66) 7.18 8,283 5.36 5.90 3.92
Croatia (72) 7.02 12,625 2.49 1.82 0.54
Slovenia (73) 7.00 18,431 2.31 1.66 0.77
Russia (100) 6.60 12,813 3.21 3.67 2.24
Low Income Group: 1995 per capita GDP less than $8,000
Georgia (8) 8.01 2,295 7.09 7.02 6.29
Armenia (29) 7.60 2,173 6.85 7.10 4.32
Albania (32) 7.54 4,129 5.03 4.78 3.98
Macedonia (67) 7.17 7,641 2.60 2.65 3.12
Kyrgyz Republic (80) 6.89 1,696 3.28 3.01 3.17
Tajikistan (82) 6.80 1,270 3.73 5.52 4.46
Montenegro (85) 6.77 10,205 2.27 2.82 2.98
Serbia (88) 6.75 7,393 2.97 3.45 1.99
Bosnia&Hzgvna (99) 6.61 1,827 9.34 3.69 2.75
Moldova (102) 6.56 2,605 3.04 4.89 3.68
Azerbaijan (114) 6.38 3,320 8.41 9.20 7.57
Ukraine (149) 5.38 5,060 1.96 2.99 0.30
Source: 2017 Economic Freedom of the World Report and World Bank (2017), World Development
Indicators. Note: Within each group, the countries are sorted according to the 2015 EFW summary
rating. The worldwide 2015 EFW ranking, out of 159 countries, is in parentheses. In the case of
Montenegro, the earliest per capita GDP figure available from the World Bank is for the year 1997.
Therefore the per capita GDP for Montenegro reported in the table is for 1997 rather than 1995.
Similarly, the growth figure for Montenegro is for 1997-2015 rather than 1995-2015.

Turning to the low-income group of Table 4, the three countries with the highest EFW rating – Georgia,
Albania, and Armenia – had annual real growth rates in the 5 percent to 7 percent range during 1995-
2015. Among the low-income group with lower EFW ratings, only Bosnia and Herzegovina and
Azerbaijan achieved impressive growth during 1995-2015. As mentioned above, exceptional
circumstances underlie the growth of these two countries. As we proceed, the relationship between
economic freedom and the growth rate of the FCP economies will be examined in more detail.
Growth of the Trade Sector
International trade promotes gains from specialization, economies from large scale production, and
importation of innovative products and production methods. Further, international trade makes it
possible for both consumers and producers of a domestic economy to gain from greater integration into
the worldwide network of markets. Thus, economic analysis indicates that trade openness and
expansion in trade will elevate economic growth.
The ratio of exports plus imports divided by GDP provides a straightforward measure for the size of the
trade sector. The average annual size of the trade sector was calculated for the 25 FCP economies for
four periods: 1996-2000, 2001-2005, 2006-2010, and 2011-2015. Table 5 illustrates the expansion in the
size of the trade sector for the 25 FCP economies. Comparison of the beginning and ending time frames
provides insight on changes in the size of the trade sector over the two-decade period.
Except for Armenia, all the countries in the most economically free group experienced substantial
increases in trade as a share of GDP. The simple mean size of the trade sector for this group rose from
79.5 percent during 1996-2000 to 111.9 percent in 2011-2015, an increase of 40 percent. When the
figures for each country are weighted by GDP, the size of the trade sector for these countries rose from
70.3 percent in the earlier period to 98.6 percent in the latter time frame, which is also an increase of
approximately 40 percent.
The countries in the middle group also experienced sizeable expansions in international trade. The
simple mean of trade as a share of GDP for the middle group rose from 86.4 percent during 1996-2000
to 125.0 during 2011-2015, an increase of approximately 45 percent. The GDP weighted mean size of
the trade sector for the middle group rose from 75.3 percent during 1996-2000 to 111.6 percent during
2011-2015, an increase of almost 50 percent. Clearly both the top and middle groups experienced
substantial increases in the size of their trade sectors. By 2015, both the most free and middle groups
were substantially more integrated into the world economy than during the mid-1990s.

Table 5: Size of the Trade Sector (as Percentage of GDP) of Former Centrally Planned Economies
Country (2015 EFW Rank)
1996- 2000
2001- 2005
2006- 2010
2011- 2015
Top EFW Group 2015 EFW ≥ 7.50
Georgia (8) 55 76 86 100
Estonia (10) 144 128 134 164
Lithuania (13) 88 102 120 159
Latvia (17) 86 90 97 122
Romania (20) 61 76 70 81
Armenia (29) 75 75 60 74
Albania (32) 47 65 82 82
Simple Mean 79.5 87.4 92.8 111.9
GDP. Wtd. Mean 70.3 82.6 82.2 98.6
Middle EFW Group: 2015 EFW between 7.00 and 7.50
Czech Rep (42) 87 105 125 151
Bulgaria (48) 88 85 111 126
Poland (51) 53 66 79 91
Slovak Rep (53) 110 132 157 180
Hungary (54) 107 123 154 169
Kazakhstan (66) 79 95 86 66
Macedonia (67) 85 76 99 111
Croatia (72) 70 84 81 88
Slovenia (73) 97 108 128 144
Simple Mean 86.4 97.2 113.4 125.0
GDP. Wtd. Mean 75.3 88.9 102.2 111.6
Bottom EFW Group: 2015 EFW < 7.00
Kyrgyz Rep (80) 91 86 134 129
Tajikistan (82) 156 126 79 74
Montenegro (85) 88 96 118 105
Serbia (88) 39 66 79 94
Bosnia&Herzegovina (99) 112 105 85 89
Russia (100) 58 59 52 48
Moldova (102) 125 134 129 124
Azerbaijan (114) 78 103 88 75
Ukraine (149) 97 109 97 100
Simple Mean 93.7 98.2 95.7 93.1
GDP. Wtd. Mean 62.8 66.0 58.8 55.8
Source: World Bank (2017). World Development Indicators. Note: The size of the trade sector is the
defined as imports plus exports divided by GDP. This table shows the average size of the trade sector
over each of the five-year periods. The table is sorted according to the 2015 EFW summary rating. The
worldwide 2015 EFW ranking, out of 159 countries, is in parentheses.

The situation was quite different for the least economically free group. Only three of the nine countries
in this group – Kyrgyz Republic, Montenegro, and Serbia – experienced significant expansions in trade.
The size of the trade sector for the other six countries in this group was either similar or smaller in 2015
than during the late 1990s. The simple mean for this group was 93.1 percent in 2011-2015, virtually
unchanged from 93.7 percent in 1996-2000. When weighted by the GDP figures of each country, the
mean size of the trade sector for this group fell from 62.8 percent during 1996-2000 to 55.8 percent
during the most recent five-year period, a decline of a little more than 10 percent. Clearly, the least-free
economies among the FCP countries are considerably less integrated into the world economy than the
countries in the middle and top groups in terms of economic freedom.
Eight FCP countries (Czech Republic, Estonia, Hungary, Latvia, Lithuania, Slovak Republic, Slovenia, and
Poland) joined the European Union in 2004, and two others (Romania and Bulgaria) joined in 2007. Still
later, Croatia joined the EU in 2013. In addition to its central government functions, the EU is a customs
union. In fact, it is an outgrowth of a free trade agreement among several European countries. The EU
sets common tariff rates and international trade policy for all member countries, but there are no tariffs
or restrictions on the movement of goods and services within the union.
Joining the EU will generally reduce the trade barriers and enhance the size of the trade sector of a FCP
country. There are two reasons why this will be the case. First, joining the EU will provide both the
domestic consumers and producers with a vastly larger “free trade” market. Thus, trade with partners in
other EU countries will generally increase. Second, because tariff rates and other trade restrictions
imposed by the EU are relatively low, the trade barriers with non-EU members will also tend to decline.
This will be particularly true if the trade restrictions of the joining member were high prior to
membership in the union.
Did joining the EU reduce trade barriers and lead to an expansion in trade? There is evidence this was
the case. All of the ten FCP countries that joined the EU during 2004-2007 had substantially larger trade
sectors in 2011-2015 than during 1996-2000. Further, the increases in the size of the trade sector were
exceedingly large. For example, between 1996-2000 and 2011-2015, international trade as a share of
GDP soared in Lithuania from 88 percent to 159 percent. In the Czech Republic, the size of the trade
sector rose from 87 percent to 151 percent; in the Slovak Republic, the increase was from 110 percent
to 180 percent; in Poland, the parallel increase was from 53 percent to 91 percent. Similarly, between
1996-2000 and 2011-2015 the trade sector of Hungary rose from 107 percent to 169 percent and that of
Slovenia soared from 97 percent to 144 percent. Latvia and Bulgaria experienced similar large increases
in the size of their trade sectors soon after joining the EU. Moreover, the expansions in the trade sector
of the FCP countries that joined the EU were substantially greater than those achieved by the non-EU
FCP countries. These trade increases are consistent with the view that joining the EU reduced trade
barriers, enhanced international trade, and promoted integration into the world economy.

Foreign Direct Investment
Foreign direct investment (FDI) plays a key role in the growth process. There are several reasons why
this is the case. First, almost all FDI is private. Thus, it reflects investor confidence in the institutions and
future of a country. Second, FDI is an important source of innovation and technology transfers among
countries. This is particularly important for developing economies because they often lag well behind
their higher income counterparts in these areas. Finally, FDI is also a source of financing for capital
investment, an ingredient that is often in short supply in lower income developing economies.
Table 6 present data on net foreign direct investment as a share of GDP during 1995-2015 for the 25 FCP
economies. Note how FDI increased as a share of GDP in most of these economies during the first
decade of this century, but it has declined substantially since 2010. For example, the simple mean of net
FDI as a share of the economy for the seven countries with the highest EFW ratings rose from 4.6
percent during 1996-2000 to 5.4 percent in 2001-2005 and 7.5 percent in 2006-2010, but it then
receded sharply to 4.6 percent during 2011-2015. This same pattern was present for the GDP weighted
mean of net FDI for this group. Further, this pattern – high levels of net FDI during 2001-2010, but
declines during the past five years – was present for the mean values of the other two groups. The
declining levels of net FDI as a share of the economy are a troublesome sign. This is likely to slow the
rate of future economic growth. As we proceed, we will consider an important factor that may underlie
the recent declining rates of foreign investment among the FCP economies.
Poverty Rates
The World Bank defines Extreme poverty as the percentage of the population with an income of less
than $1.90 per day, measured in 2011 international dollars. The moderate poverty rate is defined as the
share of population with an income of less than $3.10 per day in 2011 dollars. The extreme poverty rate
was exceedingly low in most all of the FCP countries throughout 1995-2015. Therefore, we will focus on
the moderate poverty rate figures.
The moderate poverty rate for each of the 25 FCP economies was derived for 1995, 2000, 2005, 2010,
and 2015.1 As Table 7 illustrates, the moderate poverty rate was low during 1995-2015 in several of the
FCP countries. For example, the moderate poverty rate never rose above 3 percent during the two
decades in the Czech Republic, Poland, Slovak Republic, Hungary, Croatia, and Slovenia. The moderate
poverty rate was highest for Georgia, Lithuania, Armenia, Kazakhstan, Macedonia, Kyrgyz Republic,
Tajikistan, Moldova, Azerbaijan, and Ukraine. The moderate poverty rate in each of these ten countries
soared to more than 15 percent in either 1995 or 2000.
1 The World Bank poverty rate data were utilized to derive the annual moderate poverty rate figures. The original data are from Chen and Ravallion (2010) and the methodology employed is from Connors and Montesinos (2017). This methodology uses the available poverty figures and the mortality rate of children under 5 to iteratively derive the annual poverty rates using an autoregressive model.

Table 6: Net Foreign Direct Investment (as Percentage of GDP) in Former Centrally Planned Economies
Country (2015 EFW Rank)
1996- 2000
2001- 2005
2006- 2010
2011- 2015
Top EFW Group 2015 EFW ≥ 7.50
Georgia (8) 5.4 6.6 11.9 8.1
Estonia (10) 6.3 11.2 11.8 4.1
Lithuania (13) 4.3 3.2 3.8 2.0
Latvia (17) 5.6 3.1 4.5 3.7
Romania (20) 2.9 4.7 5.2 1.9
Armenia (29) 5.6 5.0 7.4 3.9
Albania (32) 2.3 3.8 7.9 8.6
Simple Mean 4.6 5.4 7.5 4.6
GDP. Wtd. Mean 3.7 4.8 5.9 2.9
Middle EFW Group: 2015 EFW between 7.00 and 7.50
Czech Rep (42) 5.5 7.3 4.6 2.9
Bulgaria (48) 4.6 9.3 16.8 3.9
Poland (51) 3.9 3.3 4.4 2.3
Slovak Rep (53) 2.5 6.5 4.5 1.9
Hungary (54) 7.1 6.0 19.3 3.6
Kazakhstan (66) 6.7 9.7 10.2 4.9
Macedonia (67) 2.6 5.1 5.4 3.1
Croatia (72) 3.8 4.0 5.8 2.8
Slovenia (73) 0.9 3.4 1.5 1.6
Simple Mean 4.2 6.1 8.1 3.01
GDP. Wtd. Mean 4.8 5.8 7.5 3.05
Bottom EFW Group: 2015 EFW < 7.00
Kyrgyz Rep (80) 3.5 2.5 6.3 9.3
Tajikistan (82) 1.9 4.3 6.1 3.2
Montenegro (85) 8.5 25.2 13.1
Serbia (88) 1.0 4.3 8.9 5.8
Bosnia&Herzegovina (99) 2.7 5.0 5.4 2.2
Russia (100) 1.1 1.7 3.7 1.9
Moldova (102) 4.6 4.4 7.6 4.1
Azerbaijan (114) 16.9 38.0 11.3 6.3
Ukraine (149) 1.5 3.7 5.4 3.1
Simple Mean 4.2 8.0 8.9 5.5
GDP. Wtd. Mean 1.8 3.4 4.3 2.4
Source: World Bank (2017). World Development Indicators. Note: Net foreign direct investment (FDI) is
the net inflow of foreign direct investment (new investment inflows less disinvestment) as a percentage
of GDP. This table shows the average FDI over each of the five-year the periods. The table is sorted
according to the 2015 EFW summary rating. The worldwide 2015 EFW ranking, out of 159 countries, is in
parentheses.

Table 7: Moderate Poverty Rates in the Former Centrally Planned Economies, 1995-2015
Country (2015 EFW Rank) 1995 2000 2005 2010 2015
Top EFW Group 2015 EFW ≥ 7.50
Georgia (8) 36.5 42.9 36.5 38.6 29.1
Estonia (10) 5.0 4.7 2.9 0.0 0.1
Lithuania (13) 25.9 3.7 4.3 1.1 0.1
Latvia (17) 3.0 15.0 2.1 0.8 0.4
Romania (20) 4.5 6.5 19.8 4.8 4.0
Armenia (29) 41.4 47.6 24.7 21.7 15.2
Albania (32) 12.9 12.1 9.8 8.9 6.4
Simple Mean 18.5 18.9 14.3 10.8 7.9
Pop. Wtd. Mean 13.6 14.7 18.4 9.6 7.3
Middle EFW Group: 2015 EFW between 7.00 and 7.50
Czech Rep (42) 0.4 0.5 0.1 0.0 0.1
Bulgaria (48) 1.1 5.0 4.1 2.7 4.4
Poland (51) 1.9 1.1 0.0 0.3 0.4
Slovak Rep (53) 0.9 2.4 0.2 0.1 0.4
Hungary (54) 0.9 0.3 0.6 0.1 0.2
Kazakhstan (66) 8.5 22.2 2.9 4.7 1.8
Macedonia (67) 9.5 18.0 6.4 7.2 5.5
Croatia (72) 1.4 0.2 0.2 0.2 0.2
Slovenia (73) 0.3 0.1 0.0 0.1 0.1
Simple Mean 2.8 5.6 1.6 1.7 1.4
Pop. Wtd. Mean 2.8 5.4 1.0 1.3 1.0
Bottom EFW Group: 2015 EFW < 7.00
Kyrgyz Rep (80) 36.1 47.8 42.5 21.7 18.2
Tajikistan (82) 86.2 80.3 60.5 31.0 28.1
Montenegro (85) 6.2 3.6 1.2 0.3 3.5
Serbia (88) 4.4 2.1 1.4 1.7 1.5
Bosnia&Herzegovina (99) 4.5 1.9 1.1 0.6 0.7
Russia (100) 11.3 12.2 3.2 0.9 0.9
Moldova (102) 5.4 64.8 28.8 5.2 2.4
Azerbaijan (114) 24.8 28.2 0.0 5.1 7.6
Ukraine (149) 19.0 18.1 5.0 0.3 0.4
Simple Mean 22.0 28.8 15.9 7.4 7.0
Pop. Wtd. Mean 16.3 17.8 6.9 2.6 2.5
Source: World Bank (2017). World Development Indicators; and Connors and Montesinos (2017). Note:
The moderate poverty rate is the percent of population living with less than $3.10 a day. This table is
sorted according to the 2015 EFW summary rating. The worldwide 2015 EFW ranking, out of 159
countries, is in parentheses.
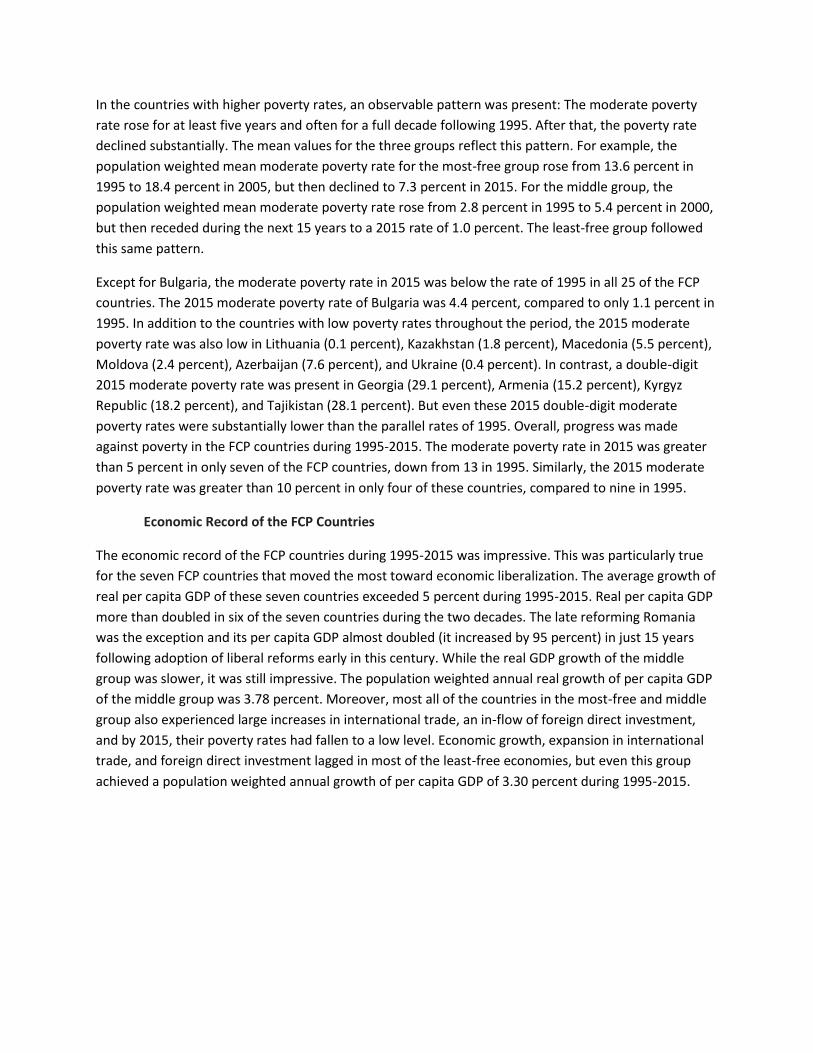
In the countries with higher poverty rates, an observable pattern was present: The moderate poverty
rate rose for at least five years and often for a full decade following 1995. After that, the poverty rate
declined substantially. The mean values for the three groups reflect this pattern. For example, the
population weighted mean moderate poverty rate for the most-free group rose from 13.6 percent in
1995 to 18.4 percent in 2005, but then declined to 7.3 percent in 2015. For the middle group, the
population weighted mean moderate poverty rate rose from 2.8 percent in 1995 to 5.4 percent in 2000,
but then receded during the next 15 years to a 2015 rate of 1.0 percent. The least-free group followed
this same pattern.
Except for Bulgaria, the moderate poverty rate in 2015 was below the rate of 1995 in all 25 of the FCP
countries. The 2015 moderate poverty rate of Bulgaria was 4.4 percent, compared to only 1.1 percent in
1995. In addition to the countries with low poverty rates throughout the period, the 2015 moderate
poverty rate was also low in Lithuania (0.1 percent), Kazakhstan (1.8 percent), Macedonia (5.5 percent),
Moldova (2.4 percent), Azerbaijan (7.6 percent), and Ukraine (0.4 percent). In contrast, a double-digit
2015 moderate poverty rate was present in Georgia (29.1 percent), Armenia (15.2 percent), Kyrgyz
Republic (18.2 percent), and Tajikistan (28.1 percent). But even these 2015 double-digit moderate
poverty rates were substantially lower than the parallel rates of 1995. Overall, progress was made
against poverty in the FCP countries during 1995-2015. The moderate poverty rate in 2015 was greater
than 5 percent in only seven of the FCP countries, down from 13 in 1995. Similarly, the 2015 moderate
poverty rate was greater than 10 percent in only four of these countries, compared to nine in 1995.
Economic Record of the FCP Countries
The economic record of the FCP countries during 1995-2015 was impressive. This was particularly true
for the seven FCP countries that moved the most toward economic liberalization. The average growth of
real per capita GDP of these seven countries exceeded 5 percent during 1995-2015. Real per capita GDP
more than doubled in six of the seven countries during the two decades. The late reforming Romania
was the exception and its per capita GDP almost doubled (it increased by 95 percent) in just 15 years
following adoption of liberal reforms early in this century. While the real GDP growth of the middle
group was slower, it was still impressive. The population weighted annual real growth of per capita GDP
of the middle group was 3.78 percent. Moreover, most all of the countries in the most-free and middle
group also experienced large increases in international trade, an in-flow of foreign direct investment,
and by 2015, their poverty rates had fallen to a low level. Economic growth, expansion in international
trade, and foreign direct investment lagged in most of the least-free economies, but even this group
achieved a population weighted annual growth of per capita GDP of 3.30 percent during 1995-2015.

3. Civil Liberties and Political Institutions
The FCP economies have a history of authoritarianism, political corruption, and abuse of civil liberties.
Thus, sensitivity to the operation of political institutions is an issue of considerable importance. Tables 8
through 12 provide data on civil liberties and political institutions.
Freedom House has provided ratings for both civil liberties and political rights annually since 1972.
Tables 8 and 9 provide the Freedom House data on civil liberties and political rights for the 25 FCP
countries during 1995-2015. According to Freedom House, “Civil liberties allow for the freedoms of
expression and belief, associational and organizational rights, rule of law, and personal autonomy
without interference from the state.” Similarly, Freedom House indicates “Political rights enable people
to participate freely in the political process, including the right to vote freely for distinct alternatives in
legitimate elections, compete for public office, join political parties and organizations, and elect
representatives who have a decisive impact on public policies and are accountable to the electorate.”
The Freedom House rating scale ranges from 1 (most free) to 7 (least free). Moreover, countries with a
rating of 1 or 2 are classified as “free,” 3, 4, or 5 as “partly free,” and 6 or 7 as “not free.”
As Tables 8 and 9 indicate, Freedom House classifies seven of the 25 FCP economies as free (ratings of
either 1 or 2) for both civil liberties and political rights throughout the entire period. These seven
countries are Estonia, Lithuania, Latvia, Czech Republic, Poland, Hungary, and Slovenia. By 2015,
Romania, Bulgaria, Slovak Republic, Croatia, and Serbia joined the “free” group for both civil liberties
and political rights. Except for Serbia, all of the countries with civil liberties and political rights
classifications as “free” are from the two groups with the highest EFW ratings. Moreover, other than
Serbia, none of the countries in the bottom EFW group were classified as “free” in both civil liberties and
political rights during any of the years. Freedom House rates Tajikistan, Russia, and Azerbaijan as “not
free” in both civil liberties and political rights in 2015. The ratings for Russia are particularly interesting
because of their persistent deterioration. Its rating for civil liberties were 4 in 1995, 5 during 2000-2010,
and 6 in 2015. In political rights, Russia’s rating receded from 3 in 1995 to 5 in 2000, and 6 during 2005-
2015.

Table 8: Civil Liberties in the Former Centrally Planned Economies, 1995-2015
Country (2015 EFW Rank) 1995 2000 2005 2010 2015
Top EFW Group 2015 EFW ≥ 7.50
Georgia (8) 5 4 3 3 3
Estonia (10) 2 2 1 1 1
Lithuania (13) 2 2 1 1 1
Latvia (17) 2 2 1 2 2
Romania (20) 3 2 2 2 2
Armenia (29) 4 4 4 4 4
Albania (32) 4 5 3 3 3
Simple Mean 3.1 3.0 2.1 2.3 2.3
Middle EFW Group: 2015 EFW between 7.00 and 7.50
Czech Rep (42) 2 2 1 1 1
Bulgaria (48) 2 3 2 2 2
Poland (51) 2 2 1 1 1
Slovak Rep (53) 3 2 1 1 1
Hungary (54) 2 2 1 1 2
Kazakhstan (66) 5 5 5 5 5
Macedonia (67) 3 3 3 3 3
Croatia (72) 4 3 2 2 2
Slovenia (73) 2 2 1 1 1
Simple Mean 2.8 2.7 1.9 1.9 2.0
Bottom EFW Group: 2015 EFW < 7.00
Kyrgyz Rep (80) 4 5 4 5 5
Tajikistan (82) 7 6 5 5 6
Montenegro (85) 2 3
Serbia (88) 6 4 2 2 2
Bosnia&Herzegovina (99) 6 4 3 3 3
Russia (100) 4 5 5 5 6
Moldova (102) 4 4 4 3 3
Azerbaijan (114) 6 5 5 5 6
Ukraine (149) 4 4 2 3 3
Simple Mean 5.1 4.6 3.8 3.7 4.1
Source: Freedom House (2017). Freedom in the World – 2017 report. The rating scale ranges from 1
(most-free) to 7 (least-free). Note: This table is sorted according to the 2015 EFW summary rating. The
worldwide 2015 EFW ranking, out of 159 countries, is in parentheses.

Table 9: Political Rights in the Former Centrally Planned Economies, 1995-2015
Country (2015 EFW Rank) 1995 2000 2005 2010 2015
Top EFW Group 2015 EFW ≥ 7.50
Georgia (8) 4 4 3 4 3
Estonia (10) 2 1 1 1 1
Lithuania (13) 1 1 1 1 1
Latvia (17) 2 1 1 2 2
Romania (20) 4 2 2 2 2
Armenia (29) 4 4 5 6 5
Albania (32) 3 4 3 3 3
Simple Mean 2.9 2.4 2.3 2.7 2.4
Middle EFW Group: 2015 EFW between 7.00 and 7.50
Czech Rep (42) 1 1 1 1 1
Bulgaria (48) 2 2 1 2 2
Poland (51) 1 1 1 1 1
Slovak Rep (53) 2 1 1 1 1
Hungary (54) 1 1 1 1 2
Kazakhstan (66) 6 6 6 6 6
Macedonia (67) 4 4 3 3 4
Croatia (72) 4 2 2 1 1
Slovenia (73) 1 1 1 1 1
Simple Mean 2.4 2.1 1.9 1.9 2.1
Bottom EFW Group: 2015 EFW < 7.00
Kyrgyz Rep (80) 4 6 5 5 5
Tajikistan (82) 7 6 6 6 7
Montenegro (85) 3 3
Serbia (88) 6 4 3 2 2
Bosnia&Herzegovina (99) 6 5 4 4 4
Russia (100) 3 5 6 6 6
Moldova (102) 4 2 3 3 3
Azerbaijan (114) 6 6 6 6 7
Ukraine (149) 3 4 3 3 3
Simple Mean 4.9 4.8 4.5 4.2 4.4
Source: Freedom House (2017). Freedom in the World – 2017 report. The rating scale ranges from 1
(most-free) to 7 (least-free). Note: This table is sorted according to the 2015 EFW summary rating. The
worldwide 2015 EFW ranking, out of 159 countries, is in parentheses.

Tables 10 and 11 provide information from the Polity IV dataset (Marshall, Gurr, and Jaggers 2016).
Table 10 indicates the degree of democracy. The scale for this variable ranges from -10 (strongly
autocratic) to +10 (strongly democratic). The Polity IV data indicates that most of the FCP economies
moved towards democracy during 1995-2015. By 2015, only three countries, Kazakhstan, Tajikistan, and
Azerbaijan, were classified as autocratic (negative rating). Most of the 25 countries have positive ratings
of 8 or more. In the most economically free group, only Georgia and Armenia had a 2015 rating of less
than 8, and in the middle group, only Kazakhstan failed to meet this benchmark. However, in the least-
free group, five countries – Kyrgyz Republic, Tajikistan, Russia, Azerbaijan, and Ukraine – had democracy
ratings of less than 8.
Table 11 provides the Polity IV data for constraints on the executive. The scale of this variable ranges
from 1 (no limitations on executive actions) to 7 (accountability groups such as legislatures have the
power to constrain executive actions). As in the case of democracy, the ratings for constraints on the
executive were higher in 2015 than was true two decades earlier. In 2015, all countries of the most-free
group had ratings of 7 except for Georgia (rating of 6) and Armenia (rating of 5). In the middle group,
eight of the nine countries had a rating of 7; the exception was Kazakhstan with a rating of 2. In the
least-free group, four of the nine countries – Kyrgyz Republic, Montenegro, Serbia, and Moldova – had a
rating of 7. However, the constraints on the executive were weak for four other countries in this group:
Tajikistan (rating of 3), Russia (rating of 4), Azerbaijan (rating of 2), and Ukraine (rating of 5). While there
are countries with democratic political institutions in each of the three groups, countries in the least
economically free group are more likely to be less democratic and have weaker constraints on the
executive.
Table 12 presents data from Transparency International on perception of corruption (Transparency
International, 2015). The Corruption Perception Index (CPI) focuses on corruption in the public sector
and defines corruption as “the abuse of public office for private gain.” The index ranges from 0 (highly
corrupt) to 100 (highly clean). As Table 12 illustrates the CPI increased for almost all the 25 FCP
economies, indicating a reduction in the level of corruption in these countries. The CPI was unavailable
for a number of countries in 1995 and 2000. Thus, we will focus on the ratings during 2005-2015. For the
most-free group, the average CPI increased from 37.1 in 2005 to 50.7 in 2015. For the middle group, the
average CPI rose from 39.8 in 2005 to 49.1 in 2015. For the least-free group, the average CPI increased
from 25.3 in 2005 to 32.7 in 2015. The 2015 average CPI is considerably higher for the most-free and
middle groups than for the least economically free group. The following four countries had 2015 CPI of
60 or higher: Estonia (70), Lithuania (61), Poland (62), and Slovenia (60). In contrast, the 2015 CPI was
less than 30 for the following countries: Kazakhstan (28), Kyrgyz Republic (28), Tajikistan (26), Russia
(29), Azerbaijan (29), and Ukraine (27). Note that all four of the countries with the highest 2015 CPI are
from the two groups with the highest 2015 EFW ratings. In contrast, five of the six countries (Kazakhstan
is the exception) with the lowest 2015 CPI are from the group with the lowest 2015 EFW rating.

Table 10: Democracy (Polity IV Score) in the Former Centrally Planned Economies.
Country (2015 EFW Rank) 1995 2000 2005 2010 2015
Top EFW Group 2015 EFW ≥ 7.50
Georgia (8) 5 5 7 6 7
Estonia (10) 6 9 9 9 9
Lithuania (13) 10 10 10 10 10
Latvia (17) 8 8 8 8 8
Romania (20) 5 8 9 9 9
Armenia (29) 3 5 5 5 5
Albania (32) 5 5 9 9 9
Simple Mean 6.0 7.1 8.1 8.0 8.1
Middle EFW Group: 2015 EFW between 7.00 and 7.50
Czech Rep (42) 10 10 10 9 9
Bulgaria (48) 8 8 9 9 9
Poland (51) 9 9 10 10 10
Slovak Rep (53) 7 9 9 10 10
Hungary (54) 10 10 10 10 10
Kazakhstan (66) -4 -4 -6 -6 -6
Macedonia (67) 6 6 9 9 9
Croatia (72) -5 8 9 9 9
Slovenia (73) 10 10 10 10 10
Simple Mean 5.7 7.3 7.8 7.8 7.8
Bottom EFW Group: 2015 EFW < 7.00
Kyrgyz Rep (80) -3 -3 3 4 7
Tajikistan (82) -6 -1 -3 -3 -3
Montenegro (85) 6 9 9
Serbia (88) 6 8 8
Bosnia&Hzgvna (99) Russia (100) 3 6 6 4 4
Moldova (102) 7 7 9 9 9
Azerbaijan (114) -6 -7 -7 -7 -7
Ukraine (149) 7 6 6 6 4
Simple Mean 0.3 1.3 3.3 3.8 3.9
Source: Marshall, Gurr, and Jaggers (2016), Polity IV Project. The democracy score ranges from -10
(strongly autocratic) to +10 (strongly democratic). Note: This table is sorted according to the 2015 EFW
summary rating. The worldwide 2015 EFW ranking, out of 159 countries, is in parentheses.

Table 11: Constraints on the Executive in the Former Centrally Planned Economies. 1995-2015
Country (2015 EFW Rank) 1995 2000 2005 2010 2015
Top EFW Group 2015 EFW ≥ 7.50
Georgia (8) 5 5 5 5 6
Estonia (10) 7 7 7 7 7
Lithuania (13) 7 7 7 7 7
Latvia (17) 7 7 7 7 7
Romania (20) 5 6 7 7 7
Armenia (29) 3 5 5 5 5
Albania (32) 5 5 7 7 7
Simple Mean 5.6 6.0 6.4 6.4 6.6
Middle EFW Group: 2015 EFW between 7.00 and 7.50
Czech Rep (42) 7 7 7 7 7
Bulgaria (48) 7 7 7 7 7
Poland (51) 7 7 7 7 7
Slovak Rep (53) 6 7 7 7 7
Hungary (54) 7 7 7 7 7
Kazakhstan (66) 2 2 2 2 2
Macedonia (67) 5 5 7 7 7
Croatia (72) 3 7 7 7 7
Slovenia (73) 7 7 7 7 7
Simple Mean 5.7 6.2 6.4 6.4 6.4
Bottom EFW Group: 2015 EFW < 7.00
Kyrgyz Rep (80) 4 4 4 7
Tajikistan (82) 3 4 3 3 3
Montenegro (85) 7 7
Serbia (88) 7 7
Bosnia&Hzgvna (99) Russia (100) 3 5 5 4 4
Moldova (102) 7 7 7 7 7
Azerbaijan (114) 2 2 2 2 2
Ukraine (149) 5 5 5 5 5
Simple Mean 4.0 4.5 4.3 5.0 5.3
Source: Marshall, Gurr, and Jaggers (2016), Polity IV Project. The executive constraints variable ranges
from 1 (no limitations on executive actions) to 7 (accountability groups such as legislatures have the
power to constrain executive actions). Note: This table is sorted according to the 2015 EFW summary
rating. The worldwide 2015 EFW ranking, out of 159 countries, is in parentheses.

Table 12: Corruption Perception Index in the Former Centrally Planned Economies. 2000-2015
Country (2015 EFW Rank) 2000 2005 2010 2015
Top EFW Group 2015 EFW ≥ 7.50
Georgia (8) 23 38 52
Estonia (10) 57 64 65 70
Lithuania (13) 41 48 50 61
Latvia (17) 34 42 43 55
Romania (20) 29 30 37 46
Armenia (29) 25 29 26 35
Albania (32) 24 33 36
Simple Mean 37.2 37.1 41.7 50.7
Middle EFW Group: 2015 EFW between 7.00 and 7.50
Czech Rep (42) 43 43 46 56
Bulgaria (48) 35 40 36 41
Poland (51) 41 34 53 62
Slovak Rep (53) 35 43 43 51
Hungary (54) 52 50 47 51
Kazakhstan (66) 30 26 29 28
Macedonia (67) 27 41 42
Croatia (72) 37 34 41 51
Slovenia (73) 55 61 64 60
Simple Mean 41.0 39.8 44.4 49.1
Bottom EFW Group: 2015 EFW < 7.00
Kyrgyz Rep (80) 23 20 28
Tajikistan (82) 21 21 26
Montenegro (85) 37 44
Serbia (88) 28 35 40
Bosnia and Herzegovina (99) 29 32 38
Russia (100) 21 24 21 29
Moldova (102) 26 29 29 33
Azerbaijan (114) 15 22 24 29
Ukraine (149) 15 26 24 27
Simple Mean 19.3 25.3 27.0 32.7
Source: Transparency International (2016). Corruption Perceptions Index. The Corruption Perception
Index ranges from 0 (highly corrupt) to 100 (highly clean). Note: This table is sorted according to the
2015 EFW summary rating. The worldwide 2015 EFW ranking, out of 159 countries, is in parentheses.

Summarizing, the following nine countries had 2015 political institutions most consistent with
protection of civil liberties, political democracy, and absence of corruption: Estonia, Lithuania, Latvia,
Czech Republic, Poland, Slovak Republic, Hungary, Croatia, and Slovenia. In 2015, these countries had
civil liberties and political rights ratings of 1 or 2; democracy scores of 8, 9, or 10; constraints on the
executive of 6 or 7; and a Corruption Perception Index of 50 or more. In contrast, the political
institutions of the following four countries were most inconsistent with civil liberties protection, political
democracy, and absence of corruption: Kazakhstan, Tajikistan, Russia, and Azerbaijan. In 2015, these
countries had civil liberties and political rights ratings of 5, 6 or 7; democracy scores less than 5;
constraints on the executive of less than 5; and a Corruption Perception Index of less than 30.
4. The Income of the Former Centrally Planned Economies Compared to the World’s High-Income
Countries and Other Developing Economies
This section will compare the relative per capita GDP of the former centrally planned (FCP) economies
with the 21 high-income countries and with the 82 other developing economies for which the economic
freedom data were available for 1995-2015. The 21 high-income countries are comprised of the 16 high-
income European countries, plus Australia, Canada, Japan, New Zealand, and the United States.
Table 13 presents data for the per capita GDP of the FCP economies as a percent of the parallel figure
for the 21 high-income countries for 1995, 2005, and 2015. The per capita GDP for each of the 25 FCP
economies increased more rapidly than the mean for the high-income group between 1995 and 2015.
As a result, the ratio of the per capita income of each centrally planned country relative to the mean for
the high-income group rose.
The mean figures for the three groups of FCP countries illustrate that the relative income increases are
impressive. The ratio of the mean per capita GDP of the most economically free group compared to the
high-income economies more than doubled, soaring from 19.9 percent in 1995 to 40.6 percent in 2015.
The parallel ratio for the middle group increased by approximately 50 percent from 36.9 percent in 1995
to 53.0 percent in 2015. Finally, the ratio for the bottom group increased from 13.0 percent in 1995 to
24.6 percent in 2015, an increase of 90 percent. The largest increases in relative income were registered
by Georgia, Lithuania, Latvia, Armenia, Albania, Kazakhstan, Azerbaijan, and Bosnia and Herzegovina.
The ratio for each of these countries more than doubled between 1995 and 2015. Note that five of
these eight countries are in the group with the highest 2015 EFW ratings.
The countries with the highest income levels were Estonia, Lithuania, Czech Republic, Slovak Republic,
and Slovenia. By 2015, the per capita GDP for each of these five countries had risen to 60 percent or
more than that of the mean for the 21 high-income countries. The countries with the lowest 2015
income levels were Armenia, Kyrgyz Republic, Tajikistan, Moldova, and Ukraine. The 2015 per capita
income of each of these five countries was less than 20 percent of the comparable mean for the high-
income group.

Table 13: Per capita GDP of the Former Centrally Planned Economies Relative to the 21-High Income
Industrial Countries (percent). Years 1995, 2005, and 2015.
Country (2015 EFW Rank) 1995 2005 2015
Top EFW Group 2015 EFW ≥ 7.50
Georgia (8) 6.7 11.7 20.3
Estonia (10) 33.0 54.3 61.6
Lithuania (13) 27.1 44.1 60.8
Latvia (17) 24.0 41.6 51.9
Romania (20) 30.6 34.9 46.3
Armenia (29) 6.3 12.7 18.4
Albania (32) 12.0 17.8 24.8
Simple Mean 19.9 31.0 40.6
Middle EFW Group: 2015 EFW between 7.00 and 7.50
Czech Rep (42) 55.7 61.2 68.4
Bulgaria (48) 24.5 30.2 38.3
Poland (51) 32.8 40.9 57.0
Slovak Rep (53) 38.2 47.6 63.7
Hungary (54) 44.2 53.1 55.9
Kazakhstan (66) 24.0 38.1 53.0
Macedonia (67) 22.2 22.3 28.7
Croatia (72) 36.6 46.5 46.5
Slovenia (73) 53.5 64.1 65.5
Simple Mean 36.9 44.9 53.0
Bottom EFW Group: 2015 EFW < 7.00
Kyrgyz Rep (80) 4.9 5.6 7.3
Tajikistan (82) 3.7 4.1 5.9
Montenegro (85) 27.1 34.4
Serbia (88) 21.4 25.9 29.9
Bosnia and Herzegovina (99) 5.3 19.8 24.6
Russia (100) 37.2 46.0 54.3
Moldova (102) 7.6 7.9 10.7
Azerbaijan (114) 9.6 19.2 37.6
Ukraine (149) 14.7 17.2 16.8
Simple Mean 13.0 19.2 24.6
Source: World Bank (2017). World Development Indicators. Note: This table is sorted according to the
2015 EFW summary rating. The worldwide 2015 EFW ranking, out of 159 countries, is in parentheses.

Table 14 provides the annual growth rate of per capita GDP for the 21 countries in the high-income
group, 16 high-income European countries, and for 82 developing economies. The per capita growth
data are also provided for the 25 FCP economies according to their 2015 EFW summary rating. Both the
simple and population weighted mean growth rates are provided for three different time periods –
1995-2015, 2000-2015, and 2005-2015.
How do the growth rates of the FCP groups compare to the other groups? As is implied by Table 13, the
centrally planned economies grew more rapidly than the high-income countries throughout the 1995-
2015 period. For example, the simple mean annual growth rate of the top, middle, and bottom groups
(according to 2015 EFW ratings) were 5.36 percent, 3.23 percent, and 4.50 percent, respectively. Each of
these rates were well above the simple mean of 1.50 percent for the world’s 21 high-income countries
and the 1.52 percent annual growth rate for the 16 high-income European countries. The population
weighted mean annual growth rates for the top (most-free), middle, and bottom (least-free) centrally
planned groups during 1995-2015 were 4.54 percent, 3.78 percent, and 3.30 percent, respectively.
Again, these figures are all considerably higher than the 1.25 percent for the 21 high-income countries
of the world and 1.16 percent for the 16 European countries. When these comparisons are also made
for the 2000-2015 and 2005-2015 periods, the pattern of the results is the same: the growth rates for
each of the centrally planned groups exceeds that of the high-income countries.
Turning to a comparison between the FCP economies and the other 82 developing countries, the simple
average annual growth rate of the centrally planned groups nearly always exceeds the simple average
for the 82 developing economies. For example, the simple mean annual growth rate for 1995-2015 of
the 82 developing economies was 2.03 percent, compared to the annual growth rates of 5.36 percent,
3.23 percent, and 4.50 percent for the top, middle, and bottom FCP groups. The pattern was similar for
the 15 and 10-year comparisons: the simple average annual growth rates of the FCP economies were
generally greater than the simple average for the 82 developing countries.
However, the pattern changes when the population weighted figures are used for the comparisons. The
population weighted mean annual growth rates for the 82 developing economies are generally greater
than the parallel rates for the FCP countries. For example, the population weighted mean annual growth
rate for the 82 developing countries during 1995-2015 was 4.75 percent compared to 4.54 percent, 3.78
percent, and 3.30 percent for the top, middle, and bottom groups among the FCP economies. The
population weighted growth rates for the 82 developing economies are driven by the high growth rates
of China and India, the world’s two most populace countries. When these two countries are omitted
from the developing group, the mean annual growth rate of the remaining 80 countries is substantially
lower. When the FCP groups are compared with the developing countries without China and India, the
growth rates of the FCP economies are generally higher than that of the 80 developing economies.
Summarizing, the growth rates of the FCP economies are generally higher than the growth rates of the
world’s 21 high-income countries, the 16 high-income European economies, and the developing
economies of the world, except for China and India. This pattern holds for both the simple average and
the population weighted average growth rates and for each of the three periods. The next section will
use regression analysis to analyze growth rates in more detail.

Table 14: Growth Rates of per capita GDP of Former Centrally Planned Economies (FCP) and Other Sets
of Countries.
Group of countries 1995-2015 2000-2015 2005-2015
Simple average annual growth rate (percent)
21 High-income 1.50 0.94 0.59
16 High-income European 1.52 0.90 0.54
Other 82 developing 2.03 2.18 2.15
Other 82 (excluding China and India) 1.91 2.05 2.02
China and India 7.01 7.39 7.57
25 Former Centrally Planned 4.27 4.23 3.09
7 FCP - Top 2015 EFW group 5.36 5.37 3.78
9 FCP - Middle 2015 EFW group 3.23 3.20 2.39
9 FCP - Bottom 2015 EFW group 4.50 4.36 3.24
Population weighted average annual growth rate (percent)
21 High-income 1.25 0.80 0.52
16 High-income European 1.16 0.67 0.40
Other 82 developing 4.75 5.14 5.21
Other 82 (excluding China and India) 2.41 2.82 2.77
China and India 7.06 7.43 7.61
25 Former Centrally Planned 3.55 3.93 2.61
7 FCP - Top 2015 EFW group 4.54 5.13 3.81
9 FCP - Middle 2015 EFW group 3.78 3.72 3.07
9 FCP - Bottom 2015 EFW group 3.30 3.83 2.22
Source: World Bank (2017), World Development Indicators.
Note: The 21 high income countries are Australia, Austria, Belgium, Canada, Denmark, Finland, France,
Germany, Iceland, Ireland, Italy, Japan, Luxembourg, Netherlands, New Zealand, Norway, Spain,
Sweden, Switzerland, United Kingdom, and United States. The 16 high-income European countries are
comprised of the 21 high-income countries, minus Australia, Canada, Japan, New Zealand, and the
United States. There were 123 countries with continuous EFW data from 1995 to 2015. The 21 high-
income industrial countries and 14 FCP economies are included in this group. Thus, the EFW data were
available for 88 developing economies. However, the per capita GDP data of six of these countries
(Venezuela, Syria, Papua New Guinea, Guyana, Haiti, and Taiwan) were unavailable in the World Bank
data in either 1995 or 2015. Thus, the growth rate data from the World Bank were available for 82 non-
FCP developing economies.

5. The Determinants of Economic Growth, 1995-2015: Regression Analysis
This section will consider the factors underlying the growth of the 128 countries of our study (the 21
high-income, 25 former centrally planned, and 82 developing countries) during 1995-2015. However,
the 1995 EFW and per capita GDP data are unavailable for Montenegro, and the data for another
variable included in this analysis (net fuel exports) are unavailable for five other countries -- Chad,
Democratic Republic of Congo, Guinea-Bissau, Serbia, and Tajikistan. Thus, these countries must be
omitted from this analysis. Therefore, our final data base consists of 122 countries. Unless otherwise
noted, the World Bank (2017) is the source of all variables included in this analysis.
Regression analysis will be utilized to examine the determinants of growth. Table 15 presents the results
of this analysis. The dependent variable is the annual growth rate of real GDP per capita over the
periods 1995-2015 (panel A), 2000-2015 (panel B), and 2005-2015 (panel C). A brief description of the
key independent variables included in our regression models is provided here.
a. 1995 per Capita GDP. This variable is measured in 2011 international dollars and is in logarithmic
form. It is expected to have a negative sign, indicating convergence. Holding everything else
constant, countries with larger 1995 per capita GDP are expected to grow less rapidly.
b. Economic Freedom Summary Index. In equations 1, 2, and 3, both the 1995 Economic Freedom of
the World summary rating and the change in the summary rating from 1995 to 2015 were included
in the model. These variables are expected to have a positive sign, indicating that both the level and
the change in economic freedom will foster higher rates of economic growth. Regressions 1, 2, and 3
were estimated using 114 observations instead of 122. The eight countries dropped are former
centrally planned economies for which the 1995 EFW data were unavailable. These countries are
Georgia, Armenia, Kazakhstan, Macedonia, Kyrgyz Republic, Bosnia and Herzegovina, Moldova, and
Azerbaijan.
In equations 4, 5, and 6, the average EFW rating over the available observations in the period 1995-
2015 was used. For the eight countries listed above, the EFW average covers the periods 2005,
2010, and 2015. For the other 114 countries, the EFW average covers the periods 1995, 2000, 2005,
2010, and 2015. This variable is expected to have a positive sign, reflecting the positive impact of
economic freedom on growth. The advantage of using the average EFW – in equations 4, 5, and 6 –
is that we reduce measurement error and we are able to utilize the full sample of 122 countries. The
advantage of using EFW in 1995 and the change from 1995 to 2015 – in columns 1, 2, and 3 – is that
we can measure the separate effects of both the level and the change in the quality of economic
institutions over an extended period.
c. Population. This variable is measured in millions of people in 2015 and is in logarithmic form.
Transaction costs are higher for trade across national boundaries, particularly when trade barriers
are present and the trading partners utilize different currencies and/or speak different languages.
Other things constant, larger countries (and integrated market areas) will derive more gains from
trade allowing them to grow more rapidly. Therefore, we expect this variable to enter the equations
with a positive sign.
d. Percentage of Female Population in the Prime Working Age 25-59 Group. This variable is the
percentage of female population between the ages 25 to 59 as a percentage of the total female

population at the beginning of the period under consideration: That is, in the year 1995 for panel A,
in the year 2000 for panel B, and in the year 2005 for panel C. Persons in the prime working age
category will generally have higher skill levels, greater commitment to the labor market, and
therefore higher productivity. The female population was chosen instead of total population
because the former more accurately reflects the latent composition of the population which is
sometimes contaminated by in-migration of workers, most of whom are males. We expect this
variable to have a positive sign.
e. Change in the Percentage of Female Population Age 25-59. This variable is the percentage of
female population in the prime working age 25-59 group at the end of the period minus the
corresponding figure at the beginning of the period. Thus, in panel A, it is the change from 1995 to
2015; in panel B, it is the change from 2000 to 2015; and in panel C, it is the change in the last
decade, 2005-2015. An increase in the share of the population in the prime working age group will
enhance productivity and economic growth. Therefore, we expect this variable to enter with a
positive sign. However, the composition of the population will change slowly. As a result, this
variable will exert a smaller impact over shorter time periods.
f. Net Foreign Direct Investment. This variable is the average net inflow of foreign direct investment
as a percentage of GDP during the period under consideration: 1995-2015 (panel A), 2000-2015
(panel B), and 2005-2015 (panel C). Because foreign direct investment is a source of both capital
financing and innovative ideas, we expect it to have a positive sign.
g. Net Fuel Exports. This variable is fuel exports minus fuel imports as a percentage of GDP, averaged
over the period 1995-2015 (panel A), 2000-2015 (panel B), and 2005-2015 (panel C). Other things
constant, the larger this variable, the greater the net revenues derived from the fuel exports
(reflecting a combination of fuel prices and units sold). Increases in net fuel exports will enhance
growth while larger expenditures on fuel imports will slow growth. Therefore, we expect this
variable to have a positive sign.
h. Dummy for Six Middle-Eastern Oil Exporting Countries. This dummy is equal to one for the
countries Bahrain, Kuwait, Oman, Qatar, Saudi Arabia, and United Arab Emirates, and zero
otherwise. In contrast with most oil exporters, as these six countries have derived additional
revenues from oil exports, their in-migration of workers, mostly prime age males, has increased
rapidly. Some of the migrants are involved in the oil industry, but others are involved in construction
and other domestic projects. Because the earnings of the migrants are low relative to the domestic
population, their inflow reduces per capita GDP. Therefore, we expect this variable to have a
negative sign.
i. Dummies for the 25 Former Centrally Planned and the 82 Other Developing Economies. Dummy
variables indicating developing countries and centrally planned economies (sometimes classified by
EFW rating) were included in the model. This provides information on the growth rates of these
economies in comparison with the 21 High-Income industrial countries.
Table 15 shows the regressions with the annual growth rate of real GDP per capita as the dependent
variable. The results are presented for three different time periods: panel A 1995-2015, panel B 2000-
2015, and panel C 2005-2015.

Equations 1 and 4 are simple models that include the 1995 per capita income, EFW, and dummies for
former centrally planned (FCP) economies and for the other 82 developing countries. Equation 1
includes the 1995 EFW summary rating and the change during 1995-2015, while equation 4 includes
only the average EFW summary rating during 1995-2015. As expected, the 1995 per capita GDP is always
negative and highly significant while the EFW variables are always positive and highly significant. The
dummy for the 82 developing countries is generally insignificant. However, the dummy for the FCP
economies is always positive and significant, indicating these economies grew more rapidly than the
high income based group. Even these simple models had R-squares between 26 percent to 38 percent
across the three panels.
Equations 2 and 5 present the results for the comprehensive model. In addition to the variables included
in regressions 1 and 4, the comprehensive model also includes population, percentage of the female
population in the prime working age 25-59 group at the beginning of the period, changes in the
percentage of the population in this group over the period, net foreign direct investment, the net fuel
exports, and a dummy for six Middle Eastern oil exporters. These variables have the expected sign and
are significant at the 10 percent level or higher. In most cases, the continuous variables are significant at
the 1 percent level. In panels A and B, the following variables are all significant at the 1 percent level:
per capita income, EFW, percentage of the female population age 25-59 at the beginning of the period,
the change in the percentage of this population during the period, and the net fuel exports. The dummy
for the six middle eastern oil exporters was always negative and significant at the 5 percent level or
higher.
The explanatory power of the model is very high. The R-squares for equations 2 and 5 in panel A (1995-
2015) were 0.57 and 0.65, respectively. In panel B (2000-2015) the R-squares for equations 2 and 5 were
even higher: 0.62 and 0.66, respectively. Even in the shorter one-decade period of panel C, the R-
squares were still 0.55 and 0.56. The slightly lower R-squares of panel C are not surprising because
business cycle factors will reduce the precision of the growth figures for the shorter period.
The EFW coefficients are not only positive and significant but they are also large in magnitude. In
column 2 of Table 15, Panel A (1995-2015), the coefficient of 0.81 for EFW in 1995 indicates that, all else
constant, a one unit increase in the initial EFW summary rating enhanced the annual growth rate of per
capita GDP by 0.81 percent during the two decades. Similarly, the coefficient of 0.73 for the change in
EFW during 1995-2015 indicates that, other things constant, a one unit increase in EFW is associated
with a 0.73 increase in the annual growth of per capita GDP during 1995-2015. In column 5 of Table 15,
Panel A, the coefficient of 0.93 for the average EFW rating during 1995-2015 indicates that, ceteris
paribus, a one unit increase in the average EFW summary rating during 1995-2015 increased the annual
growth of per capita GDP by 0.93 percent during the two decades. Consider, for instance, Ukraine and
Poland. The average EFW rating for Ukraine during 1995-2015 was 5.03. The parallel figure for Poland
was 6.64. The difference of 1.61 units (6.64 minus 5.03) indicates that, all else equal, the predicted
annual growth rate for Poland during the period would be 1.5 percent (1.61 multiplied by 0.93) larger
than that of Ukraine. See Equation 5 of Table 15, Panel A. The differences in standard of living implied by
an additional 1.5 percent annual growth rate over an extended period of time are substantial. For
example, a 1.5 percent higher growth rate over a 30-year period will result in a 56 percent larger
income. In the period 1995-2015, the actual annual growth rate for Poland was 2.15 percent larger than
that of Ukraine (4.11 minus 1.96, see Table 3).
In the more comprehensive model, the dummy variable for the 82 developing economies was
insignificant. This indicates that, after adjustment for the factors of the model, the growth rates of the
developing economies were not significantly different than that of the 21 high income countries. The
dummy for the FCP economies was also insignificant, except in panel B.
In Table 15, equations 3 and 6 differ from equations 2 and 5 in that the dummy for the FCP economies is
now separated into three distinct groups (high, medium, and low 2015 summary EFW ratings). The
pattern of the coefficients (and significance levels) for the continuous variables remains the same. The
separation of the FCP economies into three distinct groups increases the explanatory power of the
model. The R-squares for equations 3 and 6 for the two-decade period (panel A) were 0.59 and 0.66,
respectively. For the 15-year period (panel B), the R-squares were 0.63 and 0.69, respectively. For the
10-year period (panel C), the R-squares were 0.56 and 0.57, respectively.
The dummy for the FCP group with a 2015 EFW rating above 7.5 was always significant, indicating that
these economies grew more rapidly than the 21 countries in the high-income group. In contrast, the
dummy for the FCP group with the lowest EFW rating (less than 7 in 2015) was always insignificant. The
dummy for the middle group was always positive but it was significant in only three of the six equations.
Economic freedom exerted not only a positive impact on the growth rates of all economies but the
pattern of the dummies for the FCP countries is consistent with the view that higher EFW summary
ratings exerted an additional positive impact on the growth rates of these economies.
Prior models of cross-country variation in economic growth have generally had R-squares of less than 50
percent (Barro 2001; Dawson 1998 and 2003; Gwartney, Lawson, and Holcombe 1999; Hall, Sobel, and
Crowley 2010; Justesen 2008). The explanatory power of our model is substantially higher than is
generally obtained for cross-country growth models. This is particularly true for the 15 and 20-year
growth analysis. Measurement of the growth of per capita GDP over 15 and 20-year periods minimizes
measurement error as a result of business cycle effects. Therefore, these growth rates are a more
accurate measure of an economy’s long-term sustainable growth rate. The variables of our model are
factors that economic theory indicates will impact long-term growth. The sign, magnitude, and statistical
significance of these variables are indicative of their importance as determinants of long-term growth.
The economic freedom variable is always positive and highly significant, generally at the 1 percent level.
This provides evidence that economic freedom exerts a strong and persistent impact on the long-term
growth rate of per capita GDP.

Table 15 – Panel A: Regression Analysis (1995-2015)
Notes: Robust t statistics in parentheses. * p < 0.1, ** p < 0.05, *** p < 0.01. Top EFW Group: 2015 EFW >7.50.
Middle EFW Group: 2015 EFW between 7.00 and 7.50. Bottom EFW Group: 2015 EFW < 7.00. Net foreign direct
investment and net fuel exports are the averages over the period.
(1) (2) (3) (4) (5) (6)
Log of per capita GDP (2011 PPP dollars) in 1995 -0.73*** -1.59*** -1.53*** -0.88*** -1.70*** -1.71***
(-3.40) (-4.29) (-4.12) (-5.27) (-6.20) (-5.64)
Economic Freedom in 1995 0.81*** 0.85*** 0.71***
(3.85) (3.56) (2.92)
Change in Econ. Freedom 1995-2015 0.57** 0.73*** 0.60**
(2.20) (2.81) (2.27)
Average Econ. Freedom 1995-2015 0.93*** 0.93*** 0.83***
(3.62) (3.32) (2.92)
Dummy: Formerly Centrally Planned (FCP) 2.09*** 0.90 2.45*** 1.09
(4.34) (1.36) (5.07) (1.62)
FCP Top EFW Group 1.80** 1.75**
(2.42) (2.36)
FCP Middle EFW Group 0.70 0.83
(1.23) (1.39)
FCP Bottom EFW Group -0.60 0.23
(-0.66) (0.19)
Dummy: Other Developing Economies 0.28 -0.17 -0.17 0.22 0.04 -0.08
(0.74) (-0.34) (-0.34) (0.56) (0.08) (-0.14)
Log of population in 2015 0.14* 0.18** 0.17** 0.18**
(1.73) (2.14) (2.03) (2.18)
% Female population age 25-59 in 1995 0.21*** 0.21*** 0.21*** 0.22***
(3.58) (3.62) (3.88) (3.87)
Change in % of Fem. Pop. Age 25-59 from 1995 to 2015 0.18*** 0.18*** 0.15*** 0.16***
(4.54) (4.48) (4.13) (4.24)
Net foreign direct investment (1995-2015) 0.02** 0.03** 0.03** 0.03**
(2.32) (2.59) (2.35) (2.49)
Net fuel exports (1995-2015) 0.05*** 0.04*** 0.06*** 0.06***
(3.15) (3.02) (5.10) (4.75)
Dummy: Middle East oil exporters -2.54*** -2.47*** -2.60*** -2.60***
(-2.80) (-2.70) (-2.84) (-2.76)
Intercept -3.85** -13.32*** -12.61*** -4.64** -14.19*** -13.85***
(-2.38) (-5.25) (-5.12) (-2.34) (-6.67) (-6.21)
Number of observations 114.00 114.00 114.00 122.00 122.00 122.00
R-squared 0.26 0.57 0.59 0.38 0.65 0.66
Dependent Variable: Growth of real per capita GDP, 1995-2015

Table 15 – Panel B: Regression Analysis (2000-2015)
Notes: Robust t statistics in parentheses. * p < 0.1, ** p < 0.05, *** p < 0.01. Top EFW Group: 2015 EFW >7.50.
Middle EFW Group: 2015 EFW between 7.00 and 7.50. Bottom EFW Group: 2015 EFW < 7.00. Net foreign direct
investment and net fuel exports are the averages over the period.
(1) (2) (3) (4) (5) (6)
Log of per capita GDP (2011 PPP dollars) in 1995 -0.85*** -1.84*** -1.78*** -0.94*** -1.75*** -1.78***
(-3.59) (-5.02) (-4.84) (-5.38) (-5.72) (-5.75)
Economic Freedom in 1995 0.79*** 0.93*** 0.83***
(3.55) (3.92) (3.29)
Change in Econ. Freedom 1995-2015 0.62** 0.86*** 0.76**
(2.08) (3.01) (2.55)
Average Econ. Freedom 1995-2015 0.86*** 1.00*** 0.87***
(3.11) (3.44) (2.90)
Dummy: Formerly Centrally Planned (FCP) 2.39*** 1.34** 2.72*** 1.72**
(4.54) (1.99) (5.44) (2.46)
FCP Top EFW Group 2.18*** 2.53***
(2.92) (3.49)
FCP Middle EFW Group 1.06* 1.43**
(1.74) (2.28)
FCP Bottom EFW Group 0.53 0.50
(0.59) (0.45)
Dummy: Other Developing Economies 0.65 0.47 0.48 0.66 0.70 0.53
(1.60) (0.90) (0.88) (1.59) (1.39) (1.00)
Log of population in 2015 0.23** 0.26*** 0.29*** 0.31***
(2.60) (2.88) (3.31) (3.58)
% Female population age 25-59 in 2000 0.23*** 0.23*** 0.20*** 0.22***
(4.26) (4.21) (3.62) (3.92)
Change in % of Fem. Pop. Age 25-59 from 2000 to 2015 0.15*** 0.15*** 0.12*** 0.14***
(3.83) (3.67) (3.54) (3.54)
Net foreign direct investment (2000-2015) 0.02* 0.02** 0.02** 0.03***
(1.94) (2.13) (2.45) (2.69)
Net fuel exports (2000-2015) 0.06*** 0.06*** 0.06*** 0.06***
(4.44) (4.13) (5.53) (4.81)
Dummy: Middle East oil exporters -2.53*** -2.48** -2.78*** -2.80***
(-2.67) (-2.59) (-2.83) (-2.72)
Intercept -4.10** -15.65*** -15.00*** -4.55** -15.08*** -14.76***
(-2.38) (-6.45) (-6.21) (-2.13) (-7.19) (-7.01)
Number of observations 114.00 114.00 114.00 122.00 122.00 122.00
R-squared 0.30 0.62 0.63 0.38 0.66 0.69
Dependent Variable: Growth of real per capita GDP, 2000-2015
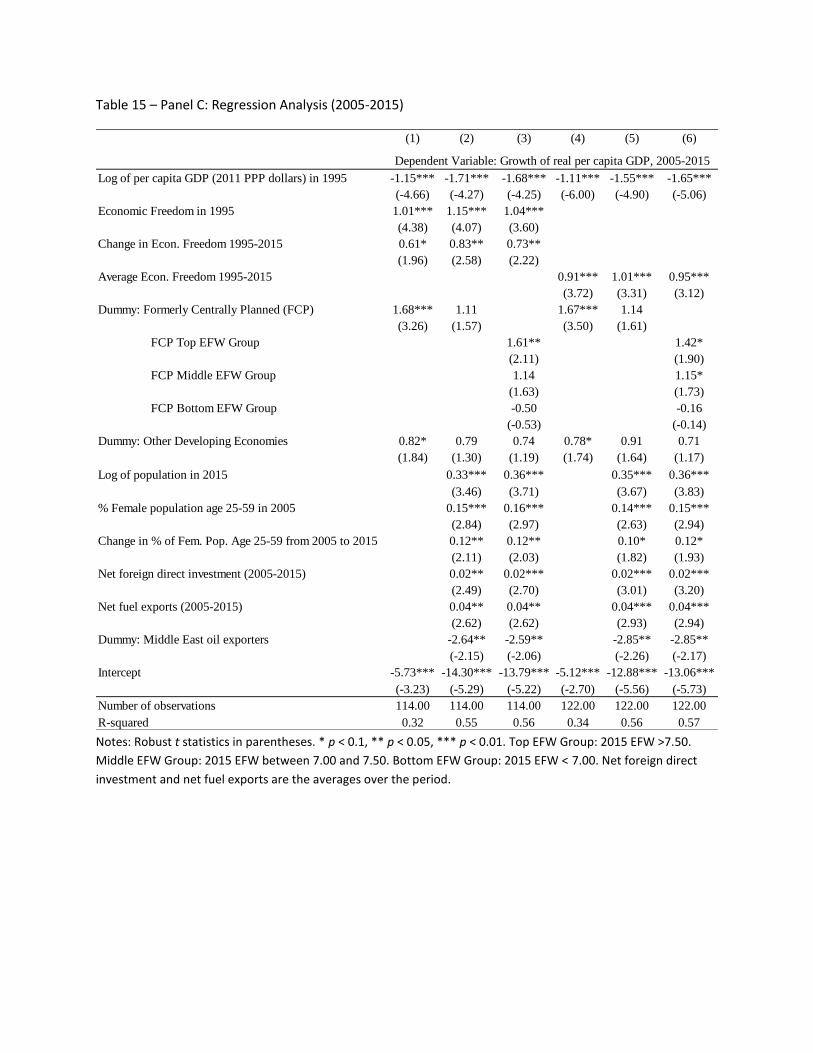
Table 15 – Panel C: Regression Analysis (2005-2015)
Notes: Robust t statistics in parentheses. * p < 0.1, ** p < 0.05, *** p < 0.01. Top EFW Group: 2015 EFW >7.50.
Middle EFW Group: 2015 EFW between 7.00 and 7.50. Bottom EFW Group: 2015 EFW < 7.00. Net foreign direct
investment and net fuel exports are the averages over the period.
(1) (2) (3) (4) (5) (6)
Log of per capita GDP (2011 PPP dollars) in 1995 -1.15*** -1.71*** -1.68*** -1.11*** -1.55*** -1.65***
(-4.66) (-4.27) (-4.25) (-6.00) (-4.90) (-5.06)
Economic Freedom in 1995 1.01*** 1.15*** 1.04***
(4.38) (4.07) (3.60)
Change in Econ. Freedom 1995-2015 0.61* 0.83** 0.73**
(1.96) (2.58) (2.22)
Average Econ. Freedom 1995-2015 0.91*** 1.01*** 0.95***
(3.72) (3.31) (3.12)
Dummy: Formerly Centrally Planned (FCP) 1.68*** 1.11 1.67*** 1.14
(3.26) (1.57) (3.50) (1.61)
FCP Top EFW Group 1.61** 1.42*
(2.11) (1.90)
FCP Middle EFW Group 1.14 1.15*
(1.63) (1.73)
FCP Bottom EFW Group -0.50 -0.16
(-0.53) (-0.14)
Dummy: Other Developing Economies 0.82* 0.79 0.74 0.78* 0.91 0.71
(1.84) (1.30) (1.19) (1.74) (1.64) (1.17)
Log of population in 2015 0.33*** 0.36*** 0.35*** 0.36***
(3.46) (3.71) (3.67) (3.83)
% Female population age 25-59 in 2005 0.15*** 0.16*** 0.14*** 0.15***
(2.84) (2.97) (2.63) (2.94)
Change in % of Fem. Pop. Age 25-59 from 2005 to 2015 0.12** 0.12** 0.10* 0.12*
(2.11) (2.03) (1.82) (1.93)
Net foreign direct investment (2005-2015) 0.02** 0.02*** 0.02*** 0.02***
(2.49) (2.70) (3.01) (3.20)
Net fuel exports (2005-2015) 0.04** 0.04** 0.04*** 0.04***
(2.62) (2.62) (2.93) (2.94)
Dummy: Middle East oil exporters -2.64** -2.59** -2.85** -2.85**
(-2.15) (-2.06) (-2.26) (-2.17)
Intercept -5.73*** -14.30*** -13.79*** -5.12*** -12.88*** -13.06***
(-3.23) (-5.29) (-5.22) (-2.70) (-5.56) (-5.73)
Number of observations 114.00 114.00 114.00 122.00 122.00 122.00
R-squared 0.32 0.55 0.56 0.34 0.56 0.57
Dependent Variable: Growth of real per capita GDP, 2005-2015

6. Life Satisfaction, Economic Freedom, and the Former Centrally Planned Economies
It is important to analyze the impact of economic freedom on economic growth and per capita income.
But, life is about more than goods and services. At the most basic level, life is about making choices and
controlling your life in a manner that generates satisfaction. Thus, it is highly important to examine
factors, including economic freedom, that facilitate the ability of individuals to control their life and
shape it in a manner that generates life satisfaction. In recent years, several researchers have addressed
this topic. See Bjørnskov, Dreher, and Fischer (2010), Nikolaev (2014), Pitlik and Rode (2016), Rode
(2013), and Verme (2009).
While communism reduced the ability of individuals to choose for themselves and control their life, its
collapse resulted in disruptive changes, anxiety, and uncertainty about the future. This situation reduced
the life satisfaction for many living in these countries. The data of the World Values Survey is consistent
with this view.
The World Values Survey (WVS) contains the following question: “All things considered, how satisfied
are you with your life as a whole these days?” Respondents answered on a ten-point scale, ranging from
dissatisfied (1) to satisfied (10). This variable was used as a measure of life satisfaction.
The WVS has conducted six different survey waves since the 1980s. The surveys provide individual data
on life satisfaction and numerous other personal variables for representative samples that generally
include between 1,200 and 1,500 individuals from each country in the survey. Since the 1990s, each
survey wave has typically included approximately 60 countries. In addition to the individual data from
the WVS, country specific variables on real per capita GDP (measured in 2011 PPP dollars), mean
summary EFW ratings, Polity IV measure of democracy, and ethnic and language fractionalization were
also included in the data set. Dummy variables were also used to identify the survey wave period, Latin
American countries, and the FCP economies. These data were available for over 220,000 individuals.
Table 16 presents the results of regression analysis with life satisfaction as the dependent variable and a
set of personal attributes and country specific measures as independent variables. The following
variables representing individual characteristics are included in the model: Life control (10-point scale),
employed (dummy = 1), relative income compared to others in the country (10-point scale), male
(dummy = 1), age 13-29 (dummy = 1), age 60 and over (dummy = 1), married and living together
(dummy = 1), divorced or separated (dummy = 1), self-employed (dummy = 1), and years of schooling.
All of these individual specific variables are significant and have the expected sign. Regression 1 also
includes country specific variables for per capita GDP, EFW, Polity IV measure of democracy, ethnic
fractionalization, and language fractionalization. The ethnic fractionalization variable is positive and the
language fractionalization negative. As expected, per capita GDP, economic freedom, and democracy all
are positive and highly significant. The dummy indicator for Latin America is also positive and highly
significant. This is consistent with the findings of other researchers that people living in Latin American
countries have an elevated level of life satisfaction, particularly when account is taken for their relatively
low-income status.
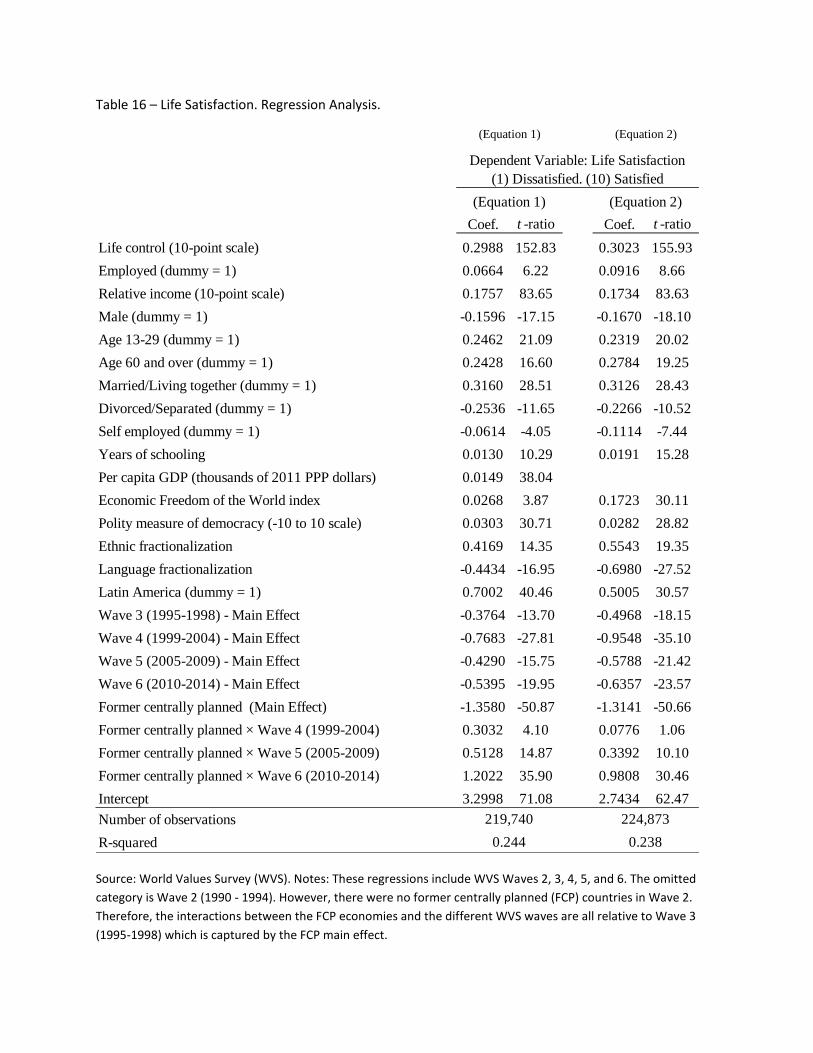
Table 16 – Life Satisfaction. Regression Analysis.
Source: World Values Survey (WVS). Notes: These regressions include WVS Waves 2, 3, 4, 5, and 6. The omitted
category is Wave 2 (1990 - 1994). However, there were no former centrally planned (FCP) countries in Wave 2.
Therefore, the interactions between the FCP economies and the different WVS waves are all relative to Wave 3
(1995-1998) which is captured by the FCP main effect.
Coef. t -ratio Coef. t -ratio
Life control (10-point scale) 0.2988 152.83 0.3023 155.93
Employed (dummy = 1) 0.0664 6.22 0.0916 8.66
Relative income (10-point scale) 0.1757 83.65 0.1734 83.63
Male (dummy = 1) -0.1596 -17.15 -0.1670 -18.10
Age 13-29 (dummy = 1) 0.2462 21.09 0.2319 20.02
Age 60 and over (dummy = 1) 0.2428 16.60 0.2784 19.25
Married/Living together (dummy = 1) 0.3160 28.51 0.3126 28.43
Divorced/Separated (dummy = 1) -0.2536 -11.65 -0.2266 -10.52
Self employed (dummy = 1) -0.0614 -4.05 -0.1114 -7.44
Years of schooling 0.0130 10.29 0.0191 15.28
Per capita GDP (thousands of 2011 PPP dollars) 0.0149 38.04
Economic Freedom of the World index 0.0268 3.87 0.1723 30.11
Polity measure of democracy (-10 to 10 scale) 0.0303 30.71 0.0282 28.82
Ethnic fractionalization 0.4169 14.35 0.5543 19.35
Language fractionalization -0.4434 -16.95 -0.6980 -27.52
Latin America (dummy = 1) 0.7002 40.46 0.5005 30.57
Wave 3 (1995-1998) - Main Effect -0.3764 -13.70 -0.4968 -18.15
Wave 4 (1999-2004) - Main Effect -0.7683 -27.81 -0.9548 -35.10
Wave 5 (2005-2009) - Main Effect -0.4290 -15.75 -0.5788 -21.42
Wave 6 (2010-2014) - Main Effect -0.5395 -19.95 -0.6357 -23.57
Former centrally planned (Main Effect) -1.3580 -50.87 -1.3141 -50.66
Former centrally planned × Wave 4 (1999-2004) 0.3032 4.10 0.0776 1.06
Former centrally planned × Wave 5 (2005-2009) 0.5128 14.87 0.3392 10.10
Former centrally planned × Wave 6 (2010-2014) 1.2022 35.90 0.9808 30.46
Intercept 3.2998 71.08 2.7434 62.47
Number of observations
R-squared
(Equation 1) (Equation 2)
Dependent Variable: Life Satisfaction
(1) Dissatisfied. (10) Satisfied
(Equation 1) (Equation 2)
219,740 224,873
0.244 0.238

Turning to the dummy for former centrally planned countries, the main effect of this variable is negative
(1.358 units) and highly significant. This indicates that during the period of WVS survey wave 3 (1995-
1998), holding all else constant, individuals in FCP countries were significantly less satisfied with their life
than individuals in other countries. However, this effect has been partially mitigated with the passage of
time as indicated by the positive and increasingly significant interactions between the FCP dummy and
the subsequent WVS waves – waves 4 (1999-2004), 5 (2005-2009), and 6 (2010-2014) –. By 2010-2014
(wave 6) individuals living in FCP economies are, on average, significantly more satisfied with their lives
(1.2022 units) than was true during the 1995-1998 wave 3, and they are closing the gap relative to the
life satisfaction enjoyed by individuals living in other countries.
Regression 2 of Table 16 drops out the country specific per capita GDP variable from the model. Note
that this causes the size of the coefficient and significance of the EFW variable to increase sharply. The
size and significance of the EFW coefficient rose from 0.0268 (t-ratio = 3.87) in regression 1 to 0.1723 (t-
ratio = 30.11) in regression 2. This is because of the strong positive impact of economic freedom on per
capita income. As a result, the coefficient size of EFW in regression 1 is depressed because a sizeable
portion of its impact is reflected by the per capita income variable. Once the latter is omitted from the
model, the EFW variable increases in both size and significance. However, omission of the per capita
income variable does not alter the pattern of any of the other variables in the model, including the FCP
variables across time. Since wave 4 (1999-2004), the FCP variable becomes larger and larger in
magnitude and increasingly significant over time, partially mitigating the negative effect observed during
wave 3 (1995-1998), just as was the case for regression 1.
The analysis of this section supplements our prior analysis of economic growth. It illustrates that
economic freedom exerts a positive impact not only on the growth of real per capita GDP, but also on
the life satisfaction of people. Further, it also shows that the life satisfaction of individuals in FCP
countries is more and more like that of those in other countries. During the most recent (2010-2014)
World Values Survey, the earlier life satisfaction gap between individuals living in FCP countries and
similar individuals in other countries was virtually eliminated.2
2 One of the co-authors, (Gwartney) taught in a Master’s program in Economics at Central European University
during 1993-1994. The 50 students in the program were all from former centrally planned countries. On the day of
her graduation, a young woman from Bulgaria ask Gwartney, “Do you believe that Bulgaria will ever be a normal
country?” The life satisfaction data of the latest World Values survey indicates that Bulgaria and other FCP
countries are approaching normalcy.

7. Area Ratings and Identifying the Strengths and Weaknesses of the FCP Economies
In addition to the summary rating, the Economic Freedom of the World data provides country ratings for
five areas: (1) size of government, (2) legal structure and protection of property rights, (3) access to
sound money, (4) international exchange, and (5) regulation of credit, labor and business. The area
ratings provide insight on both the strengths and weaknesses of economies. They also make it possible
to track the source of changes in economic freedom of the FCP economies and compare their ratings
with other European countries.
Table 17 provides the mean area ratings in each of the five areas for both the FCP economies and the 16
high-income European countries during 1995-2015. Look at the mean ratings for Areas 1, 3, 4, and 5. In
each of these areas, the mean rating of the FCP economies rose substantially during 1995-2015 and
their ratings also improved relative to the 16 high-income European countries. The high-income
countries have low ratings in Area 1 (size of government). Thus, in this area, the mean rating for the FCP
economies was higher than the mean for the high-income European countries. Moreover, the difference
expanded during the two decades. In 1995, the mean Area 1 rating gap (FCP countries minus the
European 16) was 0.46 (4.46 minus 4.00). By 2015, the comparable mean rating gap for Area 1 was 1.32
(6.26 minus 4.94).
In areas 3, 4, and 5 the mean ratings of the FCP countries were persistently lower than those of the 16
high-income European economies. However, the mean rating of the FCP countries rose steadily
throughout 1995-2015 and the gap compared to the high-income European group narrowed. In Area 3
(Access to Sound Money) the rating improvement was huge and the narrowing of the gap dramatic. In
1995, the mean rating of the FCP countries was only 3.27 compared to 9.63, a gap of 6.63 units. By 2015,
however, the mean Area 3 rating of the FCP countries had risen to 8.75 and the gap narrowed to only
0.76 units. While the gains were smaller for areas 4 (international exchange) and 5 (regulation), the
pattern was the same: the mean rating of the FCP group rose substantially and the gap compared with
the high-income European countries narrowed.
Now, take a look at the ratings in Area 2 (legal structure and protection of property rights). In contrast
with the other 4 areas, the mean rating of the FCP countries changed little in this area. The mean Area 2
rating of the FCP economies was 5.68 in 1995, 5.45 in 2005, and 5.48 in 2015. Further, the gap relative
to the high-income European economies was 2.13 units in 1995, but it had expanded to 2.40 units in
2015.

Table 17: Mean area ratings for the 25 former centrally planned (FCP) economies and the 16 high-
income European countries during 1995-2015.
Area Set of countries 1995 2000 2005 2010 2015
Area1
25 FCP 4.46 5.48 6.32 6.17 6.26
16 high-income European 4.00 5.04 5.38 4.76 4.94
Gap -0.46 -0.43 -0.95 -1.41 -1.32
Area2
25 FCP 5.68 5.81 5.45 5.60 5.48
16 high-income European 7.81 8.08 8.13 7.91 7.88
Gap 2.13 2.27 2.68 2.31 2.40
Area3
25 FCP 3.27 6.40 8.10 8.58 8.75
16 high-income European 9.63 9.52 9.48 9.34 9.51
Gap 6.36 3.12 1.38 0.76 0.76
Area4
25 FCP 7.36 7.55 7.25 7.33 7.80
16 high-income European 8.83 8.98 8.16 8.01 8.14
Gap 1.47 1.43 0.91 0.68 0.33
Area5
25 FCP 4.89 6.41 7.01 7.21 7.39
16 high-income European 6.70 7.58 7.80 7.63 7.98
Gap 1.81 1.17 0.79 0.42 0.60
Source: 2017 Economic Freedom of the World Report. The five areas are: (1) size of government, (2)
legal structure and protection of property rights, (3) access to sound money, (4) international exchange,
and (5) regulation of credit, labor and business. See Table 14 for the list of the 16 high-income European
countries.

Perhaps the patterns observed in Table 17 are unduly influenced by the FCP countries that have largely
failed to move toward liberalization. In order to see if this is the case, the mean area ratings were also
derived for only the 11 FCP countries that are now part of the European Union. These countries are:
Czech Republic, Estonia, Hungary, Latvia, Lithuania, Slovak Republic, Slovenia, Poland, Romania,
Bulgaria, and Croatia. These countries constitute four of the seven countries in the most-free FCP group
and seven of the nine countries in the middle group. None of these countries were in the least-free
group of the FCP countries. Thus, with only a few exceptions, these countries are the most economically
liberal of the former centrally planned economies.
Table 18 presents the mean area ratings for the 11 FCP countries that now belong to the European
Union and compares them with the 16 high-income European countries. The pattern is the same as was
observed in Table 17. The mean ratings of the FCP economies increased substantially in Areas 1, 3, 4,
and 5 and they improved relative to the high-income European countries. As in the case when all 25 of
the FCP economies were considered, the mean Area 1 rating of the 11 FCP countries that are now part
of the EU was higher than the mean Area 1 rating of the high-income European countries, and the gap
widened during the two decades. Initially, the mean Area 3 and 4 ratings of the 11 FCP economies were
lower than those of the 16 high-income European countries, but this gap was totally eliminated by the
end of the period. In 2015, the Area 3, and 4 mean ratings of the 11 FCP economies were virtually
identical with the mean ratings of the high-income European countries. Similarly, the Area 5 gap was
very small, 0.28 units in 2015, down from 1.53 units in 1995.
However, the situation for Area 2 was once again dramatically different. The mean Area 2 rating for the
11 FCP countries that are now EU members changed only slightly during the two decades. The mean
Area 2 rating for this group rose from 5.97 in 1995 to 6.06 in 2005 and 6.09 in 2015. Moreover, the Area
2 mean rating of these countries was approximately 2 units less than the figure for the high-income
European countries throughout the two decades.
Weakness in the legal structure area is a major problem for almost all of the FCP economies. Only one of
the 25 FCP economies had a 2015 Area 2 rating above 7. Estonia’s Area 2 rating in 2015 was 7.51, but
the next highest Area 2 rating among the FCP group in 2015 was Georgia with a rating of 6.57. Only
seven of the former centrally planned economies (Georgia, the three Baltic countries, Czech Republic,
Hungary, and Slovenia) had Area 2 ratings of more than 6.0 in 2015. Thus, 18 of the 25 FCP economies
had Area 2 ratings of two or more units below the 16 high-income European countries.
Moreover, there is evidence the situation is worsening in several countries. For example, Poland’s Area
2 rating in 2015 was 5.89, down from 6.21 in 2010. The Area 2 rating of the Slovak republic was 5.78 in
2010 and 5.64 in 2015, down from 6.63 in 2005. Hungary’s Area 2 rating fell from 6.66 in 2005 to 6.04 in
2015.

Table 18: Mean area ratings for the 11 former centrally planned (FCP) economies that became members
of the European Union, and the 16 high-income European countries during 1995-2015.
Area Set of countries 1995 2000 2005 2010 2015
Area1
11 FCP (EU Members) 4.09 5.30 5.85 5.60 5.87
16 high-income European 4.00 5.04 5.38 4.76 4.94
Gap -0.09 -0.25 -0.47 -0.85 -0.93
Area2
11 FCP (EU Members) 5.97 6.04 6.06 6.06 6.09
16 high-income European 7.81 8.08 8.13 7.91 7.88
Gap 1.83 2.04 2.07 1.85 1.79
Area3
11 FCP (EU Members) 3.75 6.94 8.91 9.32 9.51
16 high-income European 9.63 9.52 9.48 9.34 9.51
Gap 5.88 2.59 0.57 0.01 0.00
Area4
11 FCP (EU Members) 7.64 7.92 7.86 7.86 8.19
16 high-income European 8.83 8.98 8.16 8.01 8.14
Gap 1.18 1.07 0.30 0.14 -0.06
Area5
11 FCP (EU Members) 5.18 6.68 7.24 7.40 7.70
16 high-income European 6.70 7.58 7.80 7.63 7.98
Gap 1.53 0.90 0.55 0.23 0.28
Source: 2017 Economic Freedom of the World Report. The five areas are: (1) size of government, (2)
legal structure and protection of property rights, (3) access to sound money, (4) international exchange,
and (5) regulation of credit, labor and business. The 11 FCP economies members of the EU are: Estonia,
Lithuania, Latvia, Romania, Czech Republic, Bulgaria, Poland, Slovak Republic, Hungary, Croatia, and
Slovenia. See Table 14 for the list of the 16 high-income European countries.

As we have shown, the FCP economies have grown rapidly and closed the income gap relative to the
high-income countries of both Europe and the world. However, unless the deterioration in the legal
structure of these countries is reversed and improved, it is unlikely these countries will continue to grow
rapidly and close the income gap relative to high-income countries.
The legal system of a country is vitally important for sustained growth and achievement of a high per
capita income. If investors – domestic as well as foreign – cannot count on protection of property rights
and unbiased enforcement of contracts, they will be reluctant to undertake capital projects. In turn,
weak investment will slow not only capital formation, but also entrepreneurial activities, dissemination
of technology, and dynamic growth. There is already some evidence this is happening in the FCP
countries. Net foreign direct investment fell sharply during 2011-2015 (see Table 6). As Table 3 shows,
the growth of per capita real GDP during the past five years has slowed. Perhaps these changes are
caused by other factors, but they are precisely the outcomes one would expect from a poorly operating
legal system.
8. Implications and Lessons for the Future
In many ways, the transition of the former centrally planned (FCP) economies from socialism to markets
has gone well. In 2015, seven of the 25 FCP economies ranked in the top quartile of the 2015 EFW index
and another nine were classified in the second quartile. Trade liberalization, more stable monetary
regimes, lower marginal tax rates, and deregulation have all contributed to the movement of FCP
countries toward economic freedom. Further, the economic record of these countries is impressive.
They have grown rapidly, achieved large increases in international trade, attracted substantial foreign
investment, and made progress against poverty. They have closed the income gap relative to the high-
income countries of Europe and the world. Moreover, with only a few exceptions, the FCP countries are
now functioning democracies and government corruption has declined.
However, the FCP countries also have a major shortcoming: their legal systems are weak and little
progress has been made in this area. Given their historic background, this is not surprising. Under
socialism, legal systems are designed to serve the interests of the government. Judges, lawyers, and
other judicial officials are trained and rewarded for serving governmental interests. Protection of the
rights of individuals and private businesses and organizations is unimportant under socialism.
It is a major challenge to convert a socialist legal system into one that enforces contracts in an unbiased
manner, protects property rights, permits markets to direct economic activity, and operates under rule
of law principles. Obviously, this is a political as well as economic issue. Economists have provided
policy-makers with step by step directions about how to achieve monetary and price stability, liberalized
trade regimes, and adopt tax structures more consistent with growth and prosperity. During recent
decades, progress has been made in each of these areas. But, a recipe for developing a sound legal
system is largely absent. We know what a sound legal system looks like, but we have failed to explain
how it can be achieved. Going forward, economists and other researchers need to provide better
direction in this area. Of course, development of a sound strategy to achieve a high-quality legal system
does not mean that it will be adopted. However, without a strategy, it is a virtual certainty that the
political process will choose a legal system characterized by arbitrary powers, corruption, and absence
of the rule of law. In our judgment, development of a viable strategy to achieve a sound legal system is
the most important challenge confronting those interested in the future prosperity of not only the FCP
economies, but others throughout the world.
References
Barro, R. (2001). “Human Capital and Growth.” The American Economic Review, 91(2), 12-17.
Berggren, N. (2003) “The Benefits of Economic Freedom: A Survey.” Independent Review 8(2): 193-211.
Bjørnskov, C.; Dreher, A.; and Fischer, J. A. V. (2010) “Formal Institutions and Subjective Well-Being:
Revisiting the Cross-Country Evidence.” European Journal of Political Economy 26(4): 419-430.
Connors, J., and Montesinos, H. M. (2017) “Methods to Regularize and Improve World Bank Poverty
Data.” Working paper, Florida State University.
Dawson, J. W. (1998) “Institutions, Investment, and Growth: New Cross-Country and Panel Data
Evidence.” Economic Inquiry 36(4): 603-619.
_________ (2003) “Causality in the Freedom-Growth Relationship.” European Journal of Political
Economy 19(3): 479-495.
De Haan, J.; Lundström, S.; and Sturm, J. (2006) “Market-Oriented Institutions and Policies and Economic
Growth: A Critical Survey.” Journal of Economic Surveys 20(2): 157-191.
Faria, H. J., and Montesinos, H. M. (2009) “Does economic freedom cause prosperity? An IV approach.”
Public Choice 141(1), 103-127.
Faria, H. J.; Montesinos, H. M.; Morales, D. R.; Navarro, C. E. (2016). “Unbundling the roles of human
capital and institutions in economic development.” European Journal of Political Economy 45: 108-
128. Available at: http://www.sciencedirect.com/science/article/pii/S0176268016301057
Feldmann, H. (2017). “Economic freedom and human capital investment.” Journal of Institutional
Economics 13(2), 421-445.
Freedom House (2017). Freedom in the World – 2017 report. New York: Freedom House. Available at
https://freedomhouse.org.
Gwartney, J. D.; Lawson R. A.; and Holcombe, R. G. (1999). “Economic Freedom and the Environment for
Economic Growth.” Journal of Institutional and Theoretical Economics 155(4): 643-663.
Gwartney, J.; Lawson, R.; and Hall, J. (2017). Economic Freedom of the World: 2017 Annual Report.
Vancouver, B.C.: Fraser Institute. Available at https://www.fraserinstitute.org.
Hall, J. C.; Sobel, R. S.; and Crowley, G. R. (2010). “Institutions, Capital, and Growth.” Southern Economic
Journal, 77(2): 385-405.
Institute for Comparative Survey Research (2017). World Values Survey. Available at
www.worldvaluessurvey.org.
Justesen, M. K. (2008). “The Effect of Economic Freedom on Growth Revisited: New Evidence on
Causality from a Panel of Countries 1970–1999.” European Journal of Political Economy 24(3): 642-
660.
Marshall, M.; Gurr, T. R.; and Jaggers, K. (2016). “Political Regime Characteristics and Transitions, 1800-
2016.” Polity™ IV Project. Available at http://www.systemicpeace.org.
Nikolaev, B. (2014). “Economic Freedom and Quality of Life: Evidence from the OECD’s Your Better Life
Index.” Journal of Private Enterprise 29(3): 61-96.
Nystrom, K. (2008). “The institutions of economic freedom and entrepreneurship: Evidence from panel
data.” Public Choice, 136(3): 269-282.
Pitlik, H., and Rode, M. (2016). “Free to choose? Economic freedom, relative income, and life control
perceptions.” International Journal of Wellbeing, 6(1): 81-100.
Rode, M. (2013). “Do Good Institutions Make Citizens Happy, or Do Happy Citizens Build Better
Institutions?” Journal of Happiness Studies, 14(5): 1479-1505.
Transparency International (2016). Corruption Perceptions Index. Available at
https://www.transparency.org.
Verme, P. (2009). “Happiness, Freedom, and Control.” Journal of Economic Behavior and Organization,
71(2): 146-161.
World Bank (2017). World Development Indicators. Available at http://databank.worldbank.org/wdi.

Addendum: A More Detailed Look at Ten Success Stories
Thirteen of the 25 former centrally planned (FCP) economies achieved an annual growth rate of per
capita GDP of 3.4 percent or higher during the two decades following 1995. The growth rates of three of
these countries – Kazakhstan, Bosnia and Herzegovina, and Azerbaijan – were elevated by extra-
ordinary conditions: rising oil prices in the cases of Kazakhstan and Azerbaijan and an abnormally low
initial income level in the aftermath of the civil war in the case of Bosnia and Herzegovina. Furthermore,
the political institutions of these three countries are weak. Therefore, they are not included in this
section. This leaves us with 10 countries that have navigated the transition from central planning to
market direction most successfully. We will take a closer look at each of them, including specific changes
that have enhanced their past performance and troublesome factors that are likely to slow their future
growth and development.
Georgia (ranked 8th worldwide in 2015 EFW)
Georgia began a major program of economic liberalization in 2004 under the administration of president
Mikheil Saakashvili. The reforms included adoption of a flat rate tax, deregulation of business, and
relaxation of trade barriers. Since 2009, Georgia has taxed personal income at a flat rate of 20 percent.
These economic reforms exerted a substantial impact on economic freedom. Georgia’s EFW rating rose
to 7.07 in 2004 to 7.50 in 2010 and 8.01 in 2015. Georgia is currently the highest ranked FCP economy in
the EFW index. In 2015, Georgia ranked 8th worldwide among the 159 countries included in the index.
While the per capita income of this nation of approximately 4 million people is low, its growth rate has
been impressive. Since 2000, it has been one of the world’s fastest growing economies. Georgia’s per
capita GDP (measured in 2011 PPP dollars) rose from $2295 in 1995 to $9025 in 2015, approximately a
fourfold increase over the two decades. This translates to an annual growth rate of 7.1 percent. During
the most recent decade, the Georgian economy continued to grow at an impressive rate, more than 6
percent annually.
Given its low per capita income, it is not surprising that Georgia’s poverty rate is relatively high.
Georgia’s moderate poverty rate along with that of Tajikistan was the highest among the FCP
economies. But progress has been made in this area. Following the move toward economic
liberalization, Georgia’s moderate poverty rate fell from 43 percent in 2000 to 29 percent in 2015 (see
Table 7).
Both expansion in international trade and a high rate of net foreign direct investment played a major
role in Georgia’s economic success. The average size of Georgia’s trade sector (imports plus exports as a
share of GDP) rose from 55 percent during 1996-2000 to 100 percent during 2011-2015. This nearly 90
percent increase in the relative size of the trade sector is one of the largest among the FCP group.
Similarly, net foreign direct investment into the Georgian economy has been impressive. Measured as a
share of GDP, net foreign direct investment was 11.9 percent during 2006-2010 and 8.1 percent in 2011-
2015, up from 5.4 percent during 1996-2000. As previously mentioned, foreign direct investment is

almost entirely private. Thus, the increase in FDI indicates that investors have confidence in the future of
the Georgian economy. Because FDI is a source of not only financing for physical capital, but also
innovation and entrepreneurial talent, it is a highly important driver of economic growth.
Georgia has narrowed the income gap compared to the 21 long-standing high-income countries of the
world. In 1995 Georgia’s per capita income was only 6.7 percent of the per capita GDP of the high-
income group. By 2015, the parallel figure had risen to 20.3 percent. See Table 13.
How does Georgia fare with regard to political institutions? Freedom House assigned it a rating of 3 for
both civil liberties and political rights in 2015, where 1 is the highest rating and 7 the lowest. Both of
these ratings were modestly higher than the ratings of earlier years. Georgia’s Polity IV score for
democracy was 7 in 2015, up from 5 in 2000. (Remember, this scale ranges from -10 indicating least
democratic to +10 indicating most democratic.) Its Polity IV score for constraints on the executive in
2015 was 6 (on a 7-point scale) up from a 5 during earlier years. Finally, Transparency International
assigned Georgia a 2015 score of 52 (100-point scale) on its Corruption Perception Index, up from 23 in
2005. Among the FCP economies, only the three Baltic states, Czech Republic, Poland, and Slovenia
registered a higher 2015 rating than Georgia on this measure. Summarizing, Georgia’s rating in the areas
of civil liberties, political rights and democracy, and absence of corruption all have room for additional
improvement, but they have been moving in the right direction.
Georgia’s EFW ratings in areas 1 (size of government), 3 (access to sound money), 4 (international
trade), and 5 (regulation) are high and they have been improving. This is a reflection of the liberalization
policies followed since 2004. However, like other FCP economies, legal structure is a weakness of the
Georgian economy. Georgia’s 6.57 2015 rating was the second highest among the FCP countries, trailing
only the 7.51 rating of Estonia. But, Georgia’s Area 2 rating is still 1.3 units below the average of the 16
high-income European countries. Without continued improvement in the legal structure area, Georgia’s
“economic miracle” is likely to stall in the near future.
Baltic States: Estonia, Lithuania, and Latvia (ranked 10th, 13th, and 17th worldwide respectively in 2015
EFW)
All three of these countries had 2015 EFW summary ratings greater than 7.5 and they all ranked in the
Top 20 among the world’s freest economies. Moreover, all three have achieved remarkable increases in
economic freedom since the mid-1990s. Estonia’s EFW summary rating rose from 6.12 in 1995 to 7.48 in
2000, and on to 7.95 in 2015. The movements toward economic freedom of Lithuania and Latvia have
been equally impressive. Lithuania’s summary EFW rating rose from 5.51 in 1995 to 6.90 in 2000, and to
7.92 in 2015. Latvia’s EFW rating followed a similar path climbing from 5.59 in 1995 to 7.13 in 2000, and
to 7.75 in 2015. Worldwide, in 2015 Estonia ranked 10th, Lithuania 13th, and Latvia 17th among the 159
countries included in the EFW report. In contrast, Estonia ranked 57th, Lithuania 80th, and Latvia 75th
among the 123 countries for which data were available in 1995. The increases in the EFW ratings and
rankings of these three small countries since 1995 reflect a truly remarkable record of economic
liberalization.
The Baltic states were among the first FCP economies to move to a flat rate personal income tax system.
The initial rates adopted during the mid-1990s were relatively high: 24 percent in Estonia, 33 percent in
Lithuania, and 25 percent in Latvia. These rates have gradually been reduced. In 2015, the flat rates
were 20 percent in Estonia, 15 percent in Lithuania, and 23 percent in Latvia. Flat rate tax policies, along
with a liberal trade regime and deregulation of business since 2005 were major contributors to the rising
EFW ratings of the Baltic states.
The movement toward economic freedom has been accompanied by solid economic growth. During
1995-2015, the per capita GDP of Estonia grew at an annual rate of 4.49 percent, Lithuania 5.44 percent
and Latvia 5.26 percent. Growth rates in this range result in the doubling of per capita income
approximately every 15 years. As the result of their rapid growth, the Baltic states have narrowed the
income gap relative to the world’s 21 high-income economies. In 1995, Estonia’s per capita income was
only 33 percent of the 21 high-income countries, but by 2015 the relative income of Estonia had risen to
61.6 percent of the figure for the high-income group. Lithuania and Latvia also narrowed the income gap
relative to the 21 high-income countries. In 1995 the per capita incomes of Lithuania and Latvia were
only 27 percent and 24 percent of the mean income of the 21 countries with the highest incomes.
However, by 2015 the per capita income of Lithuania and Latvia had risen to 61 percent and 52 percent
respectively of the comparable figure for the 21 high-income economies. See Table 13.
Large and expanding trade sectors accompanied the rapid growth of the Baltic states. Estonia’s trade
sector was already quite large (144 percent of GDP) during the late 1990s, but by 2011-2015 it had risen
to 164 percent of GDP. Measured as a share of GDP, the size of the trade sector of Lithuania rose from
88 percent during 1996-2000 to 159 percent during 2011-2015. Similarly, the trade sector of Latvia rose
from 86 percent of GDP during 1996-2000 to 122 percent of GDP during 2011-2015. See Table 5.
The net foreign direct investment (FDI) of Estonia was high throughout most of 1995-2011, but
considerably lower in Lithuania and Latvia. Measured as a share of GDP, Estonia’s net FDI was 6.3
percent during the late 1990s, and more than 11 percent during 2001-2010 before receding to 4.1
percent during 2011-2015. On the other hand, the net FDI in Lithuania and Latvia was in the 2 percent to
5 percent of GDP range throughout most of the two-decade period. See Table 6.
The poverty rate in the Baltic states was relatively low and it declined throughout most of the period,
reflecting their high per capita income and rapid growth. The moderate poverty rate of Estonia was only
5 percent in 1995 and it declined steadily to less than 1 percent in 2015. The moderate poverty rate was
much higher (25 percent) in Lithuania in 1995, but it declined substantially, receding to less than 1
percent in 2015. The moderate poverty rate of Latvia rose to 15 percent in 2000, but by 2015 it was also
in the 1 percent range. See Table 7.
The strong economic performance of the Baltic states has occurred within a framework of civil liberties,
political democracy, and minimal corruption. The civil liberties and political rights of the Baltic states
were rated as “free” (rating of either 1 or 2 on a 7-point scale) by Freedom House throughout 1995-
2015. In 2015, both Estonia and Lithuania received a rating of 1, the highest Freedom House rating for

both civil liberties and political rights. Latvia’s 2015 rating was slightly lower in both areas, with a rating
of 2. See Tables 8 and 9.
The Baltic states also received high Polity IV ratings for both democracy and constraints on the
executive. Lithuania achieved the highest possible Polity IV ratings – a 10 for democracy and 1 for
constraints on the executive – throughout the entire 1995-2015 period. The 2015 Polity IV ratings for
democracy of Estonia and Latvia were slightly lower, a 9 for Estonia and an 8 for Latvia. Estonia and
Latvia, like Lithuania, also received the highest Polity IV rating for constraints on the executive
throughout the two decades. See Tables 10 and 11.
Turning to the Corruption Perception Index (CPI) of Transparency International, all three of the Baltic
states have achieved steady improvements in their ratings. Estonia’s CPI rating (on a 100-point scale in
which higher numbers are indicative of less corruption) rose from 57 in 2000 to 70 in 2015. The CPI
ratings of Lithuania and Latvia were a little lower than Estonia, but they followed a similar path. The CPI
of Lithuania rose from 41 in 2000 to 61 in 2015, while the rating for Latvia rose from 34 in 2000 to 55 in
2015. See Table 12.
During the past two decades, the Baltic states made modest reductions in the relative size of
government, moved toward monetary stability and eventually joined the European Monetary Union,
and reduced both trade and regulatory barriers. Their EFW ratings in Areas 1, 3, 4, and 5 reflect these
moves toward economic liberalization. Compared to other FCP countries, the Area 2 (legal structure)
ratings of the Baltic states are high and improving. Estonia’s 7.51 Area 2 rating in 2015 is the highest
among the FCP countries and only slightly lower than the average Area 2 rating (7.88) of the 16 high-
income European economies. The 2015 Area 2 ratings of Lithuania and Latvia were a full point lower
than Estonia’s. This is an area where they need to improve.
In summary, the Baltic states are among the most economically free countries in the world. Their 2015
EFW ratings place them in the Top 20 worldwide. Similarly, their growth rates were among the top 15
worldwide during 1995-2015. The per capita GDP of each more than doubled during this period. Their
political institutions are also democratic with constraints on the powers of the executive and a low level
of corruption. Their location is also advantageous – it facilitates their economic integration with
Scandinavian and other northern European countries. Clearly, these three economies made the
transition from central planning to a free market economy in a highly successful manner. If they
continue on a path of economic liberalization, their economic future should be bright.
Romania (ranked 20th worldwide in 2015 EFW)
In 2015, the EFW rating of Romania was 7.75, ranking it 20th among the 159 countries for which the
EFW data were available. Two decades ago, economic liberalization of this level would have seemed like
an impossible dream. Romania’s 1995 EFW rating was 3.83, placing it 118th among the 123 countries
included in the EFW index that year. The situation improved only modestly during the next five years. In
2000, Romania’s EFW rating was 5.37, pushing its ranking up to 107th among the 123 countries rated.

However, beginning in the early years of this century, Romania moved rapidly toward economic
liberalization. Its EFW rating rose to 7.24 in 2005 and on to 7.72 in 2015. This is a remarkable shift
toward economic freedom during the first 15 years of this century.
Adoption of a flat rate personal income tax, movements toward sound money, and reductions in tariff
rates and other trade restrictions were key elements of Romania’s economic liberalization. Romania’s
top marginal tax rate was 60 percent in 1995 and 40 percent in 2000. In 2005, however, a flat personal
income tax rate of 16 percent was adopted, and that rate remains in effect. After experiencing inflation
rates of 35 percent in 1995 and 46 percent in 2000, Romania moved to a regime of inflation targeting.
Under this system, the inflation rate has declined steadily to rates of less than 10 percent since 2005 and
less than 5 percent since 2012. The mean tariff rate fell from 18.8 percent in 1995 to approximately 5
percent during the last decade. Romania joined the European Union in 2007, and this contributed to
additional trade liberalization. As a result, Romania’s rating in Area 4 (Freedom to Trade Internationally)
in the EFW index rose from 5.54 in 1995 to 7.79 in 2005 and to 8.48 in 2015.
Reflecting its failure to reform, Romania’s per capita GDP stagnated during 1995-2000. Measured in
2011 PPP dollars, Romania’s per capita GDP in 2000 was $10,523, slightly lower than the 1995 figure of
$10,546. However, as economic reforms were adopted, real economic growth accelerated. Per capita
GDP rose to $14,656 in 2005 and $20,538 in 2015. Thus, per capita GDP approximately doubled during
2000-2015, as the Romanian economy grew at an impressive annual rate of 4.56 percent during this 15-
year period. See Tables 2 and 3.
The economic reforms led to broad improvement in performance. As trade barriers declined, the size of
the trade sector increased. Measured as a percent of GDP, Romania’s international trade expanded from
61 percent in the late 1990s to 81 percent during 2011-2015. Romania’s net foreign direct investment
also increased. During the first decade of this century, its net FDI comprised approximately 5 percent of
GDP. See Tables 5 and 6.
The moderate poverty rate (income of less than $3.10 per day measured in 2011 dollars) rose during the
stagnation of the late 1990s and the initial phase of the reforms, soaring to 19.8 percent in 2005. But, it
subsequently declined sharply, receding to 4 percent in 2015. See Table 7.
Turning to political institutions, Romania has shown improvement in this area. On the Freedom House
scale of 1 to 7 (where 1 is the highest rating), Romania’s 1995 ratings were 3 for civil liberties and 4 for
political rights. However, Romania’s rating in both of these areas rose to 2 (placing it in the “free”
category) in 2000 and it has remained there ever since. Romania’s Polity IV score for democracy was 9 in
2015, up from 8 in 2000 and 5 in 1995. (the Polity scale ranges from -10 indicating least democratic to
+10 indicating most democratic.) Romania’s Polity IV score for constraints on the executive in 2015 was
7 (the highest possible rating) up from a 5 in 1995. Finally, Transparency International assigned Romania
a score of 46 (on a 100-point scale) on its Corruption Perception Index in 2015, up from 29 in 2000 and
30 in 2005. See Tables 8-12. Thus, Romania’s ratings in the areas of civil liberties, political rights, and
democracy are among the highest of the FCP countries. While there has been improvement in the
control of corruption, this is a major shortcoming where additional improvement is needed.

The weakness of its legal system is the most important current deficiency confronting the Romanian
economy. Romania’s 2015 EFW Area 2 rating was 5.95, up only modestly from 5.46 in 2000. This Area 2
rating is approximately 3 points lower than the average of the 16 high-income European economies.
Romania’s ratings are particularly low for the following legal system Area 2 components: A (judicial
independence), B (impartial courts), C (protection of property rights), E (integrity of the legal system), F
(legal enforcement of contracts) and H (reliability of the police). The 2015 rating for each of these
components was less than 6.0 (on the EFW’s 10-point scale). Moreover, compared to the high-income
European countries, the gap for most of these components was huge. Without substantial improvement
in these legal protection areas, it is unlikely that Romania will continue to grow rapidly and narrow the
gap compared to the high-income countries of the world.
Armenia (ranked 29th worldwide in 2015 EFW)
There were not EFW data available for Armenia prior to 2004. In 2005, the EFW rating for Armenia was
7.31, placing it 44th among the 141 countries included in the index that year. By 2015, Armenia’s EFW
rating had risen to 7.6, ranking it 29th among the 159 countries included in the index in 2015. Armenia’s
2015 EFW is the sixth highest among the 25 FCP economies.
Improved monetary policy has helped push Armenia’s EFW rating upward. Following hyper-inflation in
the early 1990s, Armenia’s inflation rates have been relatively low since 2000. The average inflation rate
in the period 2000-2015 was 4.14 percent, with a maximum of 9.01 percent in 2008.
Following the Nagorno-Karabakh War, Armenia’s per capita GDP was $2,173 in 1995. By 2005, it was
$5,357 (more than doubled). By 2015, it was $8,180. The implied growth rate of annual per capita GDP
during the 20-year period 1995-2015 was 6.85 percent. See Tables 2 and 3.
The size of the trade sector of Armenia, measured as imports plus exports as a percent of GDP, was
relatively stable during the period 1995-2015 ranging around 75 percent. Armenia’s net foreign direct
investment averaged 5.6 percent in 1996-2000, before increasing to 7.4 percent in 2006-2010, but
receding to 3.9 percent in 2011-2015. See Tables 5 and 6.
Consistent with Armenia’s impressive growth of per capita GDP, the percent of people living below the
moderate poverty line (income of less than $3.10 per day measured in 2011 dollars) has declined since
2000. Moderate poverty rates were 41.4 in 1995, 47.6 in 2000, 24.7 in 2005, 21.7 in 2010, and 15.2 in
2015. See Table 7.
The political institutions of Armenia generally received the lowest ratings among the group of seven
most economically free FCP economies. On the Freedom House scale of 1 to 7 (where 1 is the highest
rating), Armenia’s 1995 rating for both civil liberties and political rights was 4. In 2015, Armenia’s civil
liberties rating was still 4, and the comparable figure for political rights was 5. The Polity IV rating for
Armenia rose from 3 in 1995 to 5 in 2015 on a scale ranging from -10 (least democratic) to +10 (most
democratic.) Armenia’s Polity IV score for constraints on the executive in 2015 was 5 up from a 3 in 1995

on a scale ranging from 1 (least constraints) to 7 (most constraints). Finally, Transparency International
assigned Armenia a score of 35 (on a 100-point scale) on its Corruption Perception Index in 2015, up
from 25 in 2000. See Tables 8-12.
With growth rates of 6.85 percent over a 20-year period, Armenia is a clear success story among the FCP
economies. Nevertheless, there is room for improvement in Armenia’s political and economic
institutions. Even though Armenia shows improvement in all EFW areas since 2004, the 2015 rating in
Area 2 (Legal System and Property Rights) was 5.78, still a relatively low rating.
The deficiencies of Armenia’s legal system are widespread. Its 2015 ratings for the following Area 2
components were less than 6.0 (on the EFW’s 10-point scale): A (judicial independence), B (impartial
courts), C (protection of property rights), D (Military interference in rule of law and politics), E (integrity
of the legal system), F (legal enforcement of contracts), and H (reliability of the police). If Armenia is
going to sustain its impressive rate of growth, it needs to make substantial improvements in its legal
system and continue moving forward with economic liberalization.
Albania (ranked 32nd worldwide in 2015 EFW)
In 1995, the EFW rating of Albania was 5.1, placing it 96th among the 123 countries included in the index
that year. Albania was, therefore, in the least-free EFW quartile in 1995. By 2000, the rating of Albania
had increased to 6.20, pushing its rank up to 73rd among the same 123 countries, an increase of 23
positions in the worldwide EFW ranking. By 2015, the summary EFW rating of Albania had increased to
7.54, placing it 32nd among the 159 countries included in the most recent year. This 2015 rating placed
Albania in the most-free EFW quartile worldwide and among the 7 most economically free FCP
economies.
The substantial increase in the EFW summary rating of Albania stems largely from improvements in
monetary policy, reductions in trade barriers, and lower top marginal tax rates. Following triple-digit
inflation rates in the early-1990s, the monetary policy of Albania shifted dramatically toward restriction
during the late 1990s. Since 2002, inflation rates in Albania have been lower than 5 percent. The EFW
Area 3 rating (Access to Sound Money) of Albania rose to 9.59 in 2015 from 3.26 in 1995. In Area 4
(Freedom to Trade Internationally), the rating of Albania was 8.11 in 2015 up from 5.90 in 1995.
Reductions in mean tariff rates from 7.29 percent in 2000 to 3.80 percent in 2015 have contributed to
this result. In EFW Area 1 (Size of Government), the rating of Albania was 6.54 in 1995 and 7.96 in 2015.
The flat personal income tax rates of 25 percent in 2005, 20 percent in 2006, 10 percent from 2007 to
2013, and 23 percent since 2014, have contributed to the higher rating in this area.
Reflecting the improvements in economic institutions, Albania grew at an annual rate of 5.03 percent
over the 20-year period 1995-2015. This impressive growth rate allowed Albanians to almost triple their
per capita income, from $4,129 in 1995 to $11,025 in 2015. The growth rates have slowed in the more
recent periods: 4.78 percent in 2000-2015 and 3.78 in 2005-2015. See Tables 2 and 3. While the most
recent growth rates are still impressive, the slowing down is consistent with a more modest economic
liberalization since 2005 as compared to the reforms that took place in the prior decade.
As expected, lower tariff rates and, in general, more freedom to trade internationally, resulted in large
increases in the trade sector of Albania. Measured as imports plus exports as a percent of GDP, the size
of the trade sector in Albania almost doubled from 47 percent in 1996-2000 to 82 percent in 2011-2015.
Similarly, economic liberalization fostered foreign direct investment (FDI) into the Albanian economy. As
a percent of GDP, net FDI almost quadrupled in the 20-year period 1995-2015. Measured as a percent of
GDP, net FDI in Albania averaged 2.3 percent in the period 1996-2000, 3.8 percent in 2001-2005, 7.9
percent in 2006-2010, and 8.6 percent in 2011-2015. See Tables 5 and 6.
The moderate poverty rate (income of less than $3.10 per day measured in 2011 dollars) in Albania has
been steadily declining since 1995. It fell slightly from 12.9 percent in 1995 to 12.1 percent in 2000. But,
the reduction in the moderate poverty rate has accelerated since 2000, receding to 9.8 percent in 2005
and 6.4 percent in 2015. See Table 7.
Albania has shown small improvements in the area of political institutions, but there remains much
progress to be made in this area. On the Freedom House scale of 1 to 7 (where 1 is the highest rating),
Albania’s 1995 ratings were 4 for civil liberties and 3 for political rights. By 2015, the civil liberties rating
for Albania rose to 3, but its political rights rating remained at 3. In both of these areas, Albania has
been in the “partly free” category since 1995. However, Albania’s Polity IV score for democracy rose
from 5 in 1995 to 9 in 2015. (Remember, this scale ranges from -10 indicating least democratic to +10
indicating most democratic.) Its Polity IV score for constraints on the executive in 2015 was 7 (the
highest possible rating) up from a 5 in 1995. Finally, Transparency International assigned Albania a score
of 36 (on a 100-point scale) on its Corruption Perception Index in 2015, up from 24 in 2005. See Tables
8-12.
Albania’s ratings in EFW Area 2 (Legal System and Property Rights) and Area 5 (Regulation) are
particularly low. The legal system deficiencies are both widespread and severe. Its 2015 ratings for the
following Area 2 components were less than 5.0 (on the EFW’s 10-point scale): A (judicial
independence), B (impartial courts), C (protection of property rights), E (integrity of the legal system),
and F (legal enforcement of contracts). For example, Albania’s 2015 rating for independence of the
judiciary was 2.75 and its rating for impartial courts was 2.97. Only two of the FCP economies (Moldova
and Ukraine) had a lower 2015 component rating for judicial independence. Similarly, only six FCP
countries (Slovak Republic, Croatia, Serbia, Bosnia, Moldova, and Ukraine) had a lower 2015 component
rating for impartial courts.
In spite of weak political and legal institutions, Albania’s growth rate has been impressive. Economic
liberalization has been the major underlying factor of this growth. However, without improvements in
the political, legal, and regulatory institutions, this rapid growth is unlikely to be sustained.
Bulgaria (ranked 48th worldwide in 2015 EFW)

The 1995 EFW rating of Bulgaria was 4.82, placing it 101st among the 123 countries included in the
index. In 2000, Bulgaria’s EFW rating was 5.52, placing it 104th among the same set of 123 countries. By
2005, Bulgaria’s EFW rating rose to 6.95 placing it 64th among the 141 countries included in the index
that year. In 2015, the EFW rating of Bulgaria was 7.39, placing it 48th among the 159 countries included.
Among the FCP economies, Bulgaria has had the second largest increase in EFW since 1995, second only
to Romania.
A substantial share of the increase in Bulgaria’s EFW rating stems from its improvement in Area 3 (Sound
Money). During 1996-1997, Bulgaria experienced hyperinflation (an inflation rate of 50 percent or more
per month). Moreover, it had defaulted on its international debt and the real economy was in shambles.
It was against this background that Bulgaria adopted a currency board in July of 1997. Under a currency
board system, a monetary authority issues a domestic currency that is convertible into an anchor
currency at a fixed rate. Credibility is achieved because the monetary authority is required to hold
foreign reserves in the anchor currency that are sufficient to fully cover the domestic currency issued.
Since the 1999 launch of the euro, the Bulgarian lev has been tied to the euro at a 1.95:1 ratio.
The currency board soon brought the hyperinflation under control. From 2001 to 2007, the inflation rate
averaged 6 percent and was never above 10 percent. After a brief spike upward in 2008, the inflation
rate in Bulgaria averaged 1.68 percent during 2009-2015. Bulgaria’s EFW rating in access to sound
money (Area 3 of EFW) reflects these changes. Its Area 3 rating rose from 1.99 in 1995 to 8.89 in 2005
and 9.36 in 2015.
Bulgaria has also adopted important reforms in other areas. The top marginal income tax rates in
Bulgaria were 50 percent in 1995, 38 percent in 2000, 29 percent in 2001, and 24 percent in 2005. In
2008, Bulgaria adopted a flat marginal income tax rate of 10 percent, culminating a path of steady
reductions in personal income tax rates. This 10 percent flat tax remains in affect.
Trade liberalization also contributed to Bulgaria’s increased EFW rating. Its rating in Area 4
(international exchange) rose from 7.22 in 2005 to 8.13 in 2015. Bulgaria joined the European Union in
2007, and the EU’s lower tariffs contributed to its higher Area 4 rating during this period.
Bulgaria has achieved remarkable growth since 2000. During 2000-2015, the per capita GDP of Bulgaria
expanded at an annual rate of 4.36 percent. As a result, Bulgaria’s per capita GDP nearly doubled during
a 15-year period, increasing from $8,958 in 2000 to $17,000 in 2015. See Tables 2 and 3.
Bulgaria is now more fully integrated into the world economy. The size of the trade sector (imports plus
exports as a percent of GDP) was similar in 1996-2000 (88 percent) and 2001-2005 (85 percent).
However, the figure rose to 111 percent during 2006-2010 and to 126 percent during 2011-2015. See
Table 5. Net foreign direct investment in Bulgaria, as a percent of GDP, rose steadily from 4.6 percent in
1996-2000 to 16.8 in 2006-2010, before dipping to 3.9 percent in 2011-2015. This recent drop in net FDI
is a troublesome sign for this economy. See Table 6.
The percent of people living below the moderate poverty line in Bulgaria (income of less than $3.10 per
day measured in 2011 dollars) has been relatively small and stable during the 20-year period 1995-2015.

The moderate poverty rate was 1.1 percent in 1995, it rose to 5.0 percent in 2000, and it has fluctuated
below the 5 percent level since 2000. See Table 7.
The ratings of Bulgaria’s political institutions have been relatively stable. On the Freedom House scale of
1 to 7 (where 1 is the highest rating), Bulgaria’s ratings were 2 for civil liberties and 2 for political rights
in both 1995 and 2015. Its Polity IV score for democracy increased from 8 in 1995 to 9 in 2015 on a scale
ranging from -10 (least democratic) to +10 (most democratic.) Bulgaria’s Polity IV score for constraints
on the executive has been consistently 7 (the highest possible rating) throughout 1995-2015. Finally,
Transparency International assigned Bulgaria a score of 41 (on a 100-point scale) on its Corruption
Perception Index in 2015, up from 40 in 2000 and 35 in 2005.
Like other FCP economies, the 2015 EFW rating of Bulgaria in the legal structure and protection of
property rights (Area 2) is low. Further, its rating in this area has declined from 6.57 in 1995 to 4.98 in
2005 and to 4.88 in 2015. The problems in this area are widespread. Bulgaria’s 2015 ratings were 5.0 or
less (on the EFW’s 10-point scale) for seven of the nine EFW components in this area: A (judicial
independence), B (impartial courts), C (protection of property rights), E (integrity of the legal system), F
(legal enforcement of contracts), H (reliability of police) and I (business costs of crime). These
weaknesses undermine the confidence of investors. The recent decline in foreign direct investment (see
Table 6) may already reflect this factor. Without improvement in its legal system, it is unlikely that
Bulgaria will be able to sustain its recent growth performance.
Poland (ranked 51st worldwide in 2015 EFW)
In 1995, Poland’s EFW summary rating was 5.28, which placed it 90th among the 123 countries in the
index. Since 1995, Poland’s EFW rating has steadily improved. It rose to 6.58 in 2000, 6.89 in 2005, 7.12
in 2010, and 7.34 in 2015. Thus, Poland’s EFW summary rating increased by 2 full points during the two
decades. In 2015, Poland ranked 51st worldwide among the 159 countries in the EFW index.
Poland’s steady increase in economic freedom has been accompanied by strong economic growth.
During 1995-2015, per capita GDP grew at an annual rate of 4.11 percent. As a result, Poland’s per
capita GDP more than doubled, increasing from $11,300 in 1995 to $25,299 in 2015. The 2015 figure
was the sixth highest among the FCP countries.
Poland’s economic growth has been enhanced by increased openness and growth of international trade.
The trade sector (imports plus exports as a share of GDP) of Poland rose sharply from 53 percent during
1996-2000 to 79 percent in 2006-2010 and 91 percent during 2011-2015. See table 5. Poland joined the
European Union in 2004. This substantially expanded the size of its tariff-free market and contributed to
the subsequent rapid expansion in the size of its trade sector. Net foreign direct investment has been
substantial and steady. Net FDI averaged approximately 3 percent of GDP during the two decades. See
Table 6.

Poland’s poverty rate was relatively low throughout 1995-2015. The moderate poverty rate (income per
day of less than $3.10 measured in 2011 dollars) was less than 1 percent in 2015 and it was less than 2
percent throughout 1995-2015. See Table 7.
The political institutions of Poland are among the highest rated of the countries in the FCP group.
Freedom House has assigned Poland its highest rating of 1 (on a 7-point scale) for both civil liberties and
political rights every year since 2005. Poland is one of only four (the other three are Lithuania, Slovak
Republic, and Slovenia) FCP countries that received the highest 2015 Freedom House ratings for both
civil liberties and political rights. Poland’s Polity IV score for democracy was 10 each year during 2005-
2015, up from 9 in 1995. (Remember, this scale ranges from -10 indicating least democratic to +10
indicating most democratic.) Poland’s Polity IV rating for constraints on the executive was a 7, the
highest possible score, throughout 1995-2015. Lastly, Poland’s score on the Transparency International
Corruption Perception Index was 41 (on a 1-100 scale) in 2000; it dipped to 34 in 2005, but rebounded
to 53 in 2010 and 62 in 2015. See Tables 8-12.
Poland has registered steady improvements in EFW areas 3 (Access to Sound Money), 4 (International
Trade), and 5 (Regulation). Its recent low and stable rates of inflation stand in stark contrast with the
monetary and price instability of the early 1990s. Poland’s Area 3 rating was 9.39 in 2010 and 9.62 in
2015, up from 6.03 in 1995. Poland’s Area 4 EFW rating rose from 7.20 in 1995 to 7.95 in 2015. In Area
5, Poland’s ratings were 4.3 in 1995, 6.98 in 2005, and 7.64 in 2015.
As in the case of other FCP countries, the legal structure (Area 2) is a major weakness of the Polish
economy. During 2000-2015, Poland’s Area 2 ratings ranged from a low of 5.03 in 2003 to a high of 6.32
in 2011. In 2015, its area2 EFW rating was 5.79. This is more than two full points below the 7.88 average
Area 2 rating of the 16 high-income European countries. In five of the nine area-2 components, the 2015
ratings of Poland were less than 6.0 (on the EFW’s 10-point scale). These five components were: A
(judicial independence), B (impartial courts), C (protection of property rights), F (legal enforcement of
contracts), and H (reliability of the police).
Further, the recent actions of the Law and Justice party (PiS) has politicized the judicial system and
weakened the rule of law. Legislation adopted in 2017 empowers the minister of justice with the
authority to dismiss judges of the common courts for reasons most deemed to be purely political.
Additional legislation that would provide the executive branch with the authority to effectively control
the Polish judiciary, including dismissal of Supreme Court justices, is under serious consideration. Unless
this situation is reversed, investor’s confidence and capital formation will decline. In turn, this will
undermine the future growth of the Polish economy.
Slovak Republic (ranked 53rd worldwide in 2015 EFW)
Following the breakup of Czechoslovakia into the Czech and Slovak Republics in 1992, the latter faced a
very difficult situation. Under communism, the Slovakia region was heavily involved in defense
production. As these facilities were closed, unemployment in the Slovak Republic soared. This created

an unstable situation. As the Slovak Republic began the transition from communism, privatization and
economic reforms were slow to come. The 1995 economic freedom rating of the Slovak Republic was
5.25, placing it 83rd among the 123 countries in the index. Slovakia’s summary EFW rating improved to
6.85 in 2000, moving it up to 57th among the 123 countries ranked that year. Additional reforms,
including the adoption of a flat rate personal income tax in 2004, were undertaken and the 2005 rating
climbed to 7.63. In 2005, the Slovak republic ranked 20th among the 141 countries in the index. Since
2005, however, both the EFW rating and ranking of the Slovak Republic have steadily declined. By 2015,
Slovakia’s rating had fallen to 7.31 and its ranking slipped to 53rd among the 159 countries currently in
the index. Thus, since adoption of the 19 percent flat rate tax in 2004, Slovakia’s zeal for economic
liberalization has waned. Even this iconic reform has now been partially reversed.
The economy of the Slovak Republic grew rapidly during 1995-2015, particularly during the first decade
of this century. During the two decades following 1995, per capita GDP grew at an annual rate of 3.88
percent. As a result, per capita GDP more than doubled, increasing from $13,184 in 1995 to $28,254 in
2015. The 2015 figure was the third highest among the FCP group, trailing only the Czech Republic and
Slovenia.
Declining trade barriers and growth of the trade sector have played a key role in the growth of the
Slovak economy. The trade sector (imports plus exports as a share of GDP) of the Slovak Republic soared
from 110 percent during 1996-2000 to 157 percent in 2006-2010, and 180 percent during 2011-2015.
Even though it is more populous than several of the other FCP economies, Slovakia’s trade sector is the
largest among this group. See Table 5. The Slovak Republic joined the European Union in 2004. This
expanded the size of its tariff-free market and thereby contributed to the rapid growth of Slovakia’s
trade sector. Net foreign direct investment also increased. During the first decade of this century, net
FDI averaged more than 5 percent of GDP.
Unlike many other FCP economies, the poverty rate in the Slovak Republic has been low since the mid-
1990s. The moderate poverty rate (income per day of less than $3.10 measured in 2011 dollars) was less
than 1 percent in 2015 and it never rose above 3 percent during 1995-2015.
The political institutions of the Slovak Republic are among the best in the FCP group. Freedom House
has assigned the Slovak Republic its highest rating of 1 (on a 7-point scale) for both civil liberties and
political rights every year since 2005. Slovakia’s Polity IV score for democracy was 10 in both 2010 and
2015, up from 9 in 2000 and 2005 and 7 in 1995. (the Polity scale ranges from -10 indicating least
democratic to +10 indicating most democratic.) Regarding constraints on the executive, Polity IV gave
the Slovak Republic its highest rating of 7 throughout 2000-2015. The Slovak Republic is one of only four
FCP countries (the other three were Lithuania, Poland, and Slovenia) to receive the highest Freedom
House ratings for both civil liberties and political rights and the highest Polity scores for both democracy
and constraints on the executive. Lastly, Transparency International assigned the Slovak Republic a score
of 51 (on a 100-point scale) on its perception of corruption index in 2015, up from 35 in 2000 and 43 in
2005. See Tables 8-12. The Transparency International score is well below that of the Czech Republic,
the Baltic states, and several other FCP countries. There is plenty of room for improvement in this area.
Polls indicate that the confidence of citizens in the country’s public institutions has been declining and

that corruption in government is a major reason underlying the decline. Reductions in corruption would
help make the political institutions of the Slovak Republic both stronger and more trustworthy.
The EFW area ratings reveal a great deal about both the strengths and weaknesses of the Slovak
economy. Steady improvements have been achieved in EFW areas 3 (access to sound money) and 4
(international trade). Slovakia’s Area 3 rating rose from 6.69 in 1995 to 9.15 in 2005 and 9.74 in 2015. In
2009, the Slovak Republic joined the European Monetary Union and adopted the euro as its currency.
This enhanced confidence in its monetary arrangements and contributed to its high Area 3 ratings of
recent years. The Area 4 EFW rating of the Slovak Republic also rose steadily from 6.93 in 1995 to 8.15 in
2005 and 8.30 in 2015. The picture for Area 5 (Regulation), however, is more mixed. Slovakia’s Area 5
rating rose substantially from 4.90 in 1995 to 7.77 in 2005. However, during the past decade, it has
receded to 7.42 in 2010 and 7.36 in 2015. Some argue that regulations mandated by the EU have been a
major contributing factor underlying the increased regulation and declining Area 5 rating since 2005.
As in the case of other FCP countries, the legal system (Area 2) is a major weakness of the Slovak
Republic. Moreover, the evidence indicates that little progress has been made in this area. Slovakia’s
EFW Area 2 ratings were 6.55 in 1995, 6.35 in 2000, and 6.63 in 2005. However, since 2005, the trend
has been downward. Slovakia’s Area 2 rating fell to 5.78 in 2010 and 5.64 in 2015. Thus, its Area 2 rating
declined a full point between 2005 and 2015. In 2015, Slovakia’s Area 2 ratings were particularly low for
the following components: (A) Judicial independence, 3.04; (B) Impartial courts, 2.0; (C) Protection of
property rights, 5.29; (F) Legal enforcement of contracts, 3.33; and (H) Reliability of police, 4.31.
While the growth rate of the Slovak Republic was impressive during 1995-2015, troublesome signs are
now present. These include high levels of corruption, increased regulation (as indicated by the recent
declines in the Area 5 rating), and most importantly, weakness of its legal system. Without
improvements in these areas, it is unlikely that the Slovak Republic will maintain its strong growth in the
future.