Embed Size (px)
Citation preview
An Examination of Technological Capability Development
in the Thailand Automotive Industry: The Role of Thai Government Policy from
1960-2009
Charuspong Samarnbutr
2012
The Thesis is Submitted in Fulfilment of
the Requirements for the Award of the Degree of
Doctor of Philosophy of the University of Portsmouth

i
Declaration
This thesis is submitted in fulfilment of the requirements for the award of Doctor of
Philosophy of University of Portsmouth.
Whilst registered as a candidate for the above degree, I have not been registered for any other
research award. The results and conclusions embodies in this thesis are the work of the
named candidate and have not been submitted for any other academic award.
I hereby give consent for my dissertation, if accepted, to be available for photocopying and
inter-library loan, and for the title and summary to be made available to outside organisations.
Signed _____________________________
Charuspong Samarnbutr
ii
Acknowledgement
I would like to express my most sincere appreciate and gratitude to my supervisors, Dr. Paul
Trott and Dr. Andreas Hoecht for their assistance in the completion of this thesis. Dr. Paul
Trott has spent an enormous amount of time over guiding, commenting and supporting this
research. I also want to acknowledge the large influence that Dr. Andreas Hoecht has had on
my constructive ideas and invaluable suggestions.
I am very grateful for the support given by all of the government agencies in Thailand who
willingly gave information and assistance. In particular, I acknowledge the Excise
Department, Ministry of Finance, Department of Industrial Promotion, Ministry of Industry,
and Board of Investment (BOI). Without these support information, the work would not have
progressed successfully.
I am very pleased to thank the executives in the Excise Department of Thailand for their
assistance in making contact with Thai automotive industry and for assistance in sending out
the questionnaires.
Thank to my sponsors, the Royal Thai Government Scholarship, Excise Department, and
Thai Embassy London, who financially supported me throughout this study. Without their
support, I would never have been able to undertake this study
I would like to dedicate this work to my brother and all of my family members for
supporting me up all the time, especially when times were so tough no end could be seen to
this challenge, I am truly blessed.
iii
Abstract
Thailand’s automotive industry has grown steadily since the 1960s making Thailand one of
the world’s largest vehicle producers. Indeed, when it comes to Pick-up trucks, Thailand is
the main manufacturing base for the following firms: Mitsubishi, Ford, Isuzu, Toyota and
Nissan. While this may seem impressive, what remains unclear is whether these
improvements have been matched with similar levels of technological capability development
within Thailand.
This study examines the growth of the Thai automotive industry and the influence of
government policy from 1960-2009 on this industry. For the past 49 years the Thai
government has encouraged and helped to develop an automobile industry within its borders
and it has deployed a range of industrial policies to enhance the technological capabilities of
local auto part firms. It is against this background that this study examines the level and
extent of technological capability development within the Thai automobile industry. To this
end, the study initially identifies the key concepts, ‘organisation & organisational learning’,
‘international strategic alliance’, ‘technology transfer’, and ‘innovation strategies’, as well as
their related factors, and uses them to create the study’s conceptual framework. The
important role of government policies is later added as a key concept in the conceptual
framework.
Evidence is presented from a survey of over 300 Thai automotive firms and in-depth elite
interviews through three phases of research. The key findings of this study are that while the
production figures in Thailand’s automotive industry have grown, these improvements have
not been equally matched by similar levels of technological capability development. The
other key finding is that the ten factors related to the key concepts mentioned above have an
effect on the development of technological capability in the Thai automotive industry.
The study contributes to the existing literature by developing an innovative conceptual
framework called the Model of Technological Capability Development for the Automotive
Parts Industry in Thailand. In addition, the research provides suggestions on how the Thai
automotive industry can develop a technological capability strategy based on data obtained
from the executives of automotive firms. The key findings of this study provide policy
implications for the automotive industry and government bodies. It was also found that this
study can be generalised to other ASEAN countries.
iv
Table of Contents
Declaration .......................................................................................................................... i
Acknowledgements .............................................................................................................. ii
Abstract .......................................................................................................................... iii
Table of Contents ............................................................................................................... iv
List of Figures................................................................................................................... xiv
List of Tables ..................................................................................................................... xv
List of Abbreviations ...................................................................................................... xviii
Glossary of Terms ............................................................................................................ xix
Chapter 1: Introduction ..................................................................................................... 1
1.1 The Rationale and Importance of the Research ............................................................. 1
1.2 Current State of Knowledge and Research Questions .................................................. 3
1.2.1 Overview of Research Context .......................................................................... 3
1.2.2 Theoretical Background .................................................................................... 5
1.2.3 Knowledge Gaps and Research Questions ......................................................... 7
1.3 Overview of the Limitations of Research .................................................................... 9
1.4 Overview of the Conceptual Framework .................................................................... 10
1.5 Contributions of the Dissertation to the Area of Study ................................................ 12
1.6 Overview of the Research Design ............................................................................. 13
1.7 Principal Findings ..................................................................................................... 15
1.7.1 Phase I: In-depth Interviews ........................................................................... 16
1.7.2 Phase II: Factors Affecting the Technological Capability Development of
Local Thai Auto Parts Firms .......................................................................... 16
1.7.3 Phase III: Other Important Issues in Developing the Thai Automotive Industry . 17
1.8 Structure of the Research ........................................................................................... 18
Chapter 2: Research Context: Overview and Development of the Thai Automotive
Industry ......................................................................................................... 21
2.1 Introduction ............................................................................................................... 21
2.2 Overview of the Thai Automotive Industry ................................................................ 23
2.2.1 Automotive Assembler and Production Capacity ............................................ 23
2.2.2 Employment in the Thai Automotive Industry ................................................ 24
v
2.2.3 Auto-Parts Suppliers ....................................................................................... 25
2.2.4 Productions, Domestic Sales, and Exports in the Thai Automotive Industry .... 25
2.2.5 Thai Automotive Production Network ............................................................. 26
2.2.6 ASEAN Production and Trade Network .......................................................... 27
2.3 The Role of Government Policies in Automotive Industry Development
from 1960-2009 ........................................................................................................ 28
2.3.1 The Simple Assembly Phase (1960-1970) ....................................................... 28
2.3.2 The First Phase of Localisation (1971-1977) ................................................... 30
2.3.3 The Second Phase of Localisation (1978-1986) ............................................... 30
2.3.4 Liberalisation Phase (1987-1996) .................................................................... 32
2.3.5 Financial Crisis Phase (1997-2003) ................................................................. 33
2.3.6 Detroit of Asia Phase (2004-2010) .................................................................. 34
2.4 The Role of the Private Sector in Automotive Industry Development
from 1960-2009 ........................................................................................................ 35
2.4.1 The Role of the Private Sector during the Simple Assembly Phase (1960-1970) .. 35
2.4.2 The Role of the Private Sector during the First Localisation Phase (1971- 1977) .. 35
2.4.3 The Role of the Private Sector during the Second Localisation Phase
(1978-1986) .................................................................................................... 36
2.4.4 The Role of Private Sector during the Liberalisation Phase (1987-1996) ......... 36
2.4.5 The Role of Private Sector during the Financial Crisis Phase (1997-2003) ...... 36
2.4.6 The Role of Private Sector during the Detroit of Asia Phase (2004-2010) ....... 37
2.5 Summary of Tariff and Taxes of Completely Built-Up (CBU) and Completely
Knocked-Down (CKD) Vehicles ............................................................................... 37
2.6 Conclusion ................................................................................................................. 38
Chapter 3: Literature Review: Technological Capability Development, Technology
Transfer, Innovation Strategies, Organisation & Organisational
Learning, and International Strategic Alliance ........................................... 40
3.1 Introduction ............................................................................................................... 40
3.2 Classifications of Capability Development and Related Terms .................................. 41
3.2.1 Production Capability ..................................................................................... 41
3.2.2 Technological Capability ................................................................................ 42
3.2.3 Absorptive Capability ..................................................................................... 44
3.3 Technological Capability Development...................................................................... 45
vi
3.4 Factors Affecting the Success of Technology Capability Development ...................... 46
3.5 Research and Development (R&D) ............................................................................ 49
3.5.1 Role of R&D in Technological Capability Development ................................. 49
3.5.2 R&D: Sole Indicator for Technological Capability Development .................... 49
3.5.3 R&D and the Thai Automotive Industry .......................................................... 50
3.6 Technology Transfer .................................................................................................. 51
3.6.1 Definitions of Technology Transfer ................................................................ 51
3.6.2 Technology Transfer Process .......................................................................... 52
3.6.3 Factors Regarding Technology Transfer Affecting Technological
Capability Development in the Thai Automotive Industry ................................. 53
3.6.3.1 Type of Industry ............................................................................... 53
3.6.3.2 Sources of Components .................................................................... 54
3.6.3.3 Need of Foreign Technicians or Expert Assistance .............................. 54
3.7 Innovation Strategies ................................................................................................... 55
3.7.1 Innovation ....................................................................................................... 55
3.7.2 Innovation Strategy with Application .............................................................. 56
3.7.3 Factors in Innovation Strategies Affecting Technological Capability
Development .................................................................................................. 58
3.8 Important Concepts of Organisation ............................................................................. 59
3.8.1 Organisational Size ......................................................................................... 60
3.8.2 Organisational Culture .................................................................................... 60
3.8.3 Organisational Life Cycle ............................................................................... 61
3.9 Organisational Learning Theory and Concepts ........................................................... 62
3.9.1 Organisational Learning Theory ...................................................................... 62
3.9.2 Characteristics of Organisational Learning ..................................................... 63
3.9.3 Organisational Intelligence.............................................................................. 64
3.10 Factors in Organisations and Organisational Learning Affecting Technology
Capability Development .......................................................................................... 65
3.10.1 Size of Company ........................................................................................... 65
3.10.2 Nationality of Ownership ............................................................................. 66
3.10.3 Methods of Acquiring Technology ................................................................ 66
3.10.4 Reasons of Investment .................................................................................. 67
3.11 International Strategic Alliance ................................................................................ 68
3.11.1 Creation of International Strategic Alliances ................................................. 68
vii
3.11.2 Terms and Types of International Strategic Alliances .................................... 69
3.11.3 Types of Ownership in Thai Business ........................................................... 70
3.11.4 Strategic Alliance with Management Issues .................................................. 70
3.12 Factors Related to International Strategic Alliance Affecting Technological
Capability Development .......................................................................................... 72
3.12.1 Types of Company Ownership ...................................................................... 72
3.12.2 Ability to Obtain Exclusive Contracts from the Automobile Industry ............ 73
3.12.3 Ability to Obtain General Contracts to Manufacture for Other Firms ............. 73
3.13 Conclusion ............................................................................................................... 74 Chapter 4: Development of the Conceptual Framework ................................................. 76
4.1 Introduction .............................................................................................................. 76
4.2 The Development of the Conceptual Framework ....................................................... 76
4.2.1 The Use of Phase I as Part of the Creation of the Conceptual Framework ........ 78
4.2.2 The Conceptual Framework Concerning the Development of
Technological Capability in the Thai Automotive Industry.............................. 78
4.3 Rationales for Key Concepts in the Conceptual Framework ....................................... 80
4.3.1 The Rationale for Utilising Organisation & Organisational Learning Theory
in Studying Technological Capability Development ...................................... 80
4.3.2 The Rationale for Integrating Technology Transfer, Organisational
Learning Theory, and the Development of Technological Capability ............. 81
4.3.3 The Rationale for Integrating Organisational Learning and International
Alliances ........................................................................................................ 81
4.3.4 The Rationale for Integrating Innovation and Technology Transfer ................. 82
4.3.5 The Rationale for Integrating Organisational Learning, Innovation, and
Technology Capability Development .............................................................. 82
4.3.6 The Rationale for the Importance of Government Policies as a Key
Concept in the Conceptual Framework ........................................................... 83
4.4 The Implementation of the Conceptual Framework .................................................... 84
4.5 Conclusion ................................................................................................................. 84
Chapter 5: Research Methodology ................................................................................... 86
5.1 Introduction .............................................................................................................. 86
viii
5.2 Phase I: In-depth Elite Interview ................................................................................ 89
5.2.1 Research Objectives and Questions for Phase I ............................................... 89
5.2.2 Data Collection Method for Phase I ................................................................ 90
5.2.3 Interview Instruments for Phase I .................................................................... 90
5.2.4 The Sample for Phase I ................................................................................... 92
5.2.5 Data Analysis for Phase I ................................................................................ 93
5.3 Phase II: Mail Survey ................................................................................................. 93
5.3.1 Research Objectives and Questions for Phase II .............................................. 93
5.3.2 Data Collection Method for Phase II ............................................................... 93
5.3.3 The Survey Instruments for Phase II ............................................................... 94
5.3.3.1 Development of Questions for Structured Questionnaire for Phase II ... 94
5.3.3.2 Validation Process of the Phase II Instrument with the
Item- Objective Congruence (IOC) Index. ..................................... 102
5.3.4 The Sampling Method for Phase II ................................................................ 103
5.3.5 Data Analysis for Phase II ............................................................................ 103
5.4 Phase III: In-depth Interview .................................................................................... 108
5.4.1 Research Objectives for Phase III .................................................................. 108
5.4.2 Data Collection Method for Phase III ............................................................ 108
5.4.3 The Interview Instruments for Phase III ........................................................ 109
5.4.4 The Sampling Method for Phase III .............................................................. 110
5.4.5 Data Analysis for Phase III ........................................................................... 110
5.5 Rationale for Research Methods and Techniques in Phase I, II, and III..................... 111
5.5.1 Rationale for Employing Face-to-Face In-depth Interviewing ....................... 112
5.5.2 Rationale for Employing Multi-Method Research ......................................... 114
5.5.3 Rationale for Alternatives of the Mixed Research Method............................. 115
5.6 Conclusion ............................................................................................................... 117
Chapter 6: Phase I Qualitative Data Analysis of Automotive Industry Executives .... 119
6.1 Introduction ............................................................................................................. 119
6.2 Phase I Sample and Instrument Description ............................................................. 121
6.3 Phase I Findings: The Government Role in the Development of the Thai
Automotive Industry from 1960-2009 ..................................................................... 122
ix
6.3.1 Findings and Discussion of the Documentary Research (Exploring
the Roles of Thai Government Policy in the Development of the Thai
Automotive Industry from 1960-2009) ......................................................... 123
6.3.2 Findings and Discussion of Exploratory Research in Further Exploring
the Roles of Thai Government Policy in the Development of the Thai
Automotive Industry from 1960-2009 .......................................................... 125
6.3.2.1 Regulation ...................................................................................... 125
6.3.2.2 Taxation ......................................................................................... 126
6.3.2.3 Incentives ....................................................................................... 127
6.4 Summary of Findings. .............................................................................................. 128
6.5 Conclusion. .............................................................................................................. 132
Chapter 7: Phase II Quantitative Data Analysis: The Development of Technological
Capability of the Thai Automotive Industry.............................................. 134
7.1 Introduction ............................................................................................................. 134
7.2 Phase II Sample and Instrument Description ............................................................ 134
7.3 Phase II Findings: Factors Affecting Technological Capability Development in
the Thai Automotive Industry ................................................................................. 136
7.3.1 Collected Data from Auto-Part Manufacturing Companies ............................ 136
7.3.1.1 Size of the Company (X1) ................................................................. 136
7.3.1.2 Nationality of Ownership (X2) ........................................................... 137
7.3.1.3 Type of Industry (X3) ........................................................................ 138
7.3.1.4 Reason for Investing in the Industry (X4). .......................................... 139
7.3.1.5 Type of Ownership (X5) .................................................................... 140
7.3.1.6 Obtainment of Exclusive Contracts (X6) ............................................ 141
7.3.1.7 Obtainment of General Contracts to Manufacture (X7) ..................... 142
7.3.1.8 Product Technology Type (X8) .......................................................... 143
7.3.1.9 Ability to Modify Production or Products (X9) .................................. 143
7.3.1.10 Consideration of Investment in Research and Design (X10). ............. 144
7.3.1.11 Source of Component Parts (X11)..................................................... 145
7.3.1.12 Method of Acquiring Technology (X12) ........................................... 146
7.3.1.13 Need of Foreign Technicians or Experts Assistance (X13) ................ 147
7.3.1.14 Government Policies to Promote Technological Capability
Development (X14) ......................................................................... 148
x
7.3.1.15 Government Incentive Supporting the Firm (X15) ......................... 149
7.3.1.16 Concern about Government Regulations (X16) .............................. 151
7.3.1.17 Concern about Government Taxes (X17) ....................................... 152
7.3.1.18 Satisfaction with Government Policy (X18) ................................... 153
7.3.1.19 Existence of R&D Activities (Y) .................................................. 154
7.3.2 Chi-Square Tests and Cramer’s V ................................................................. 154
7.3.3 Logistic Regression ....................................................................................... 159
7.3.3.1 Assumption Test by Multicollinearity Check .................................. 160
7.3.3.2 Calculation of Logistic Regression ................................................. 161
7.4 Conclusion ............................................................................................................... 172
Chapter 8: Phase III Qualitative Data Analysis of Current Technological
Capability in the Thai Automotive Industry.............................................. 175
8.1 Introduction ............................................................................................................. 175
8.2 Phase III Sample and Instrument Description ........................................................... 175
8.3 Review of Findings from Phase II: 12 Significant Variables that Cause
Technological Capability Development .................................................................. 177
8.4 Phase III Findings: Three New Issues Involved ........................................................ 183
8.4.1 The Role of Clustering in the Thai Automotive Industry ...................................... 184
8.4.2 Technology Transfer between MNE and Thai Auto-Part Firms ........................... 186
8.4.2.1 Importance of MNE Technology Transfer .................................... 186
8.4.2.2 The Local Part Procurements of Japanese MNE Auto Assemblers ...... 187
8.4.2.3 The Local Part Procurements of Western MNE Auto Assemblers ....... 188
8.4.2.4 Technology Transfer Patterns between First-Tier Suppliers and
MNE Japanese Automakers ......................................................... 188
8.4.2.5 Technology Transfer to Lower-Tier Suppliers ................................ 189
8.4.3 The Pick-up Truck Phenomenon ................................................................... 189
8.4.3.1 Thailand as Pickup Production Base ............................................... 189
8.4.3.2 The Unintended Outcome of the Tax Policy ................................... 190
8.5 Conclusion ............................................................................................................... 192
Chapter 9: Discussion of Findings and Development of the Model............................... 194
9.1 Introduction ............................................................................................................. 194
9.2 Discussion of Findings of Phase I: In-depth Elite Interviews .................................... 194
xi
9.2.1 Regulations ................................................................................................... 194
9.2.2 Incentives ..................................................................................................... 195
9.2.3 Taxes ............................................................................................................ 196
9.3 Discussion of Findings of Phase II: Survey .............................................................. 197
9.3.1 Organisation & Organisational Learning ....................................................... 197
9.3.1.1 Nationality of Ownership of the Establishment (X2) ....................... 198
9.3.1.2 Method of Acquiring Technology (X12) .......................................... 198
9.3.1.3 Company Size (X1) ......................................................................... 198
9.3.2 International Strategic Alliance ..................................................................... 199
9.3.2.1 Type of Company Ownership (X5) ................................................. 199
9.3.2.2 Ability to Obtain Exclusive Contracts from the Automobile
Industry (X6)................................................................................ 200
9.3.3 Innovation Strategies .................................................................................... 200
9.3.3.1 Ability to Modify Productions or Products (X9) .............................. 200
9.3.3.2 Consideration of Investment in Research and Design (X10) ............. 201
9.3.4 Technology Transfer ..................................................................................... 201
9.3.4.1 Need for Foreign Technicians or Expert Assistance (X13) ............... 202
9.3.4.2 Type of Industry (X3) ..................................................................... 202
9.3.5 Government Policies ..................................................................................... 203
9.3.5.1 Government Taxes of Concern (X17) .............................................. 203
9.3.5.2 Government Incentives (X15) .......................................................... 203
9.3.5.3 Government Regulations of Concern (X16) ..................................... 204
9.4 Discussion of the Findings of the Phase III Semi-Structured In-depth Interviews ..... 204
9.4.1 Discussion of Expert Opinions on Phase II Factors ....................................... 205
9.4.2 Three Issues Uncovered by Phase III............................................................. 208
9.5 Research Findings of this Study Compared with the Literature Review .................... 210
9.6 Developing the Empirical Conceptual Framework and Its Implementation ............... 213
9.7 Conclusion ............................................................................................................... 215
Chapter 10: Conclusion, Contributions and Implications ............................................. 217
10.1 Introduction ........................................................................................................... 217
10.2 Evaluation of Main Models Developed in this Study .............................................. 217
10.2.1 Development and Contributions of the Conceptual Framework ................... 217
10.2.2 Development and Contributions of the Technological Capability Matrix ..... 218
xii
10.3 Evaluation of the Findings of Research Questions .................................................. 219
10.3.1 Phase I: The Role of Government Policies in the Development of the
Thai Automotive Industry .......................................................................... 219
10.3.2 Phase II: Factors Affecting the Technological Capability Development
of Local Thai Auto-Part Firms ................................................................... 221
10.3.3 Phase III: Important Issues in Developing the Thai Automotive Industry .... 224
10.4 Generalisability of Research Findings .................................................................... 226
10.4.1 ASEAN....................................................................................................... 227
10.4.2 The Automotive Industry in ASEAN........................................................... 227
10.4.3 Government Involvement ............................................................................ 229
10.5 Contribution and Implication of the Study .............................................................. 230
10.5.1 Theoretical Contribution and Implications................................................... 230
10.5.2 Practical Contribution and Implications ....................................................... 232
10.5.2.1 Contribution and Implications for the Thai Government ............... 232
10.5.2.2 Contribution and Implications for Thai Auto Part Firms ............... 233
10.5.3 Pedagogical Contribution and Implications ................................................. 234
10.6 Limitations of the Research .................................................................................... 234
10.6.1 Limitations of the Literature Reviewed ....................................................... 235
10.6.2 Limitations of the Conceptual Framework ................................................... 235
10.6.3 Limitations of Research Activity Execution ................................................ 236
10.6.4 Limitations of Research Methods Employed and Techniques Used ............. 236
10.6.5 Limitations of Data Analysis ....................................................................... 237
10.6.6 Limitations of Integrating Findings Across a Mixed Methods Approach ..... 237
10.7 Implications for Future Research ............................................................................ 238
References ....................................................................................................................... 239
Appendices ...................................................................................................................... 258
Appendix I Example of Semi-Structured Interview Questions for Automotive
Industry Executives for Phase I................................................................... 258
Appendix II ................................................................................................................... 262
Appendix II.I Structured Survey Questionnaire for Phase II (English Version) ...... 262
Appendix II.II Structured Survey Questionnaire for Phase II (Thai Version) .......... 267
xiii
Appendix III Example of Structured Interview Question for Automotive
Industry Executives for Phase III ............................................................ 274
Appendix IV .................................................................................................................. 279
Appendix IV.I Validation Process of Phase II Instrument ...................................... 279
Appendix IV.II The First Trial Questionnaire and the Pilot-Test Results
(Before the IOC Evaluation) ........................................................ 284
xiv
List of Figures
Figure 1.1 Conceptual Framework ...................................................................................... 11
Figure 1.2 Overview of Research Design ............................................................................ 14
Figure 1.3 Structure of the Research .................................................................................... 18
Figure 2.1 Assembler and Supplier Relations ...................................................................... 27
Figure 3.1 Absorptive Capacity Model ................................................................................ 45
Figure 3.2 Technology Transfer as a Knowledge-Internalisation Process ............................. 52
Figure 4.1 Domains of Knowledge Used to Develop the Conceptual Framework ................ 77
Figure 4.2 The Conceptual Framework of the Research ....................................................... 79
Figure 5.1 Research Design of the Study ............................................................................. 87
Figure 5.2 Stages of the Research Process for Phase I ......................................................... 89
Figure 6.1 Research Proposition in Phase I ........................................................................ 120
Figure 7.1 Research Proposition in Phase II and Phase III ................................................. 135
Figure 8.1 Research Proposition in Phase III. .................................................................... 176
Figure 8.2 Thai Automotive Cluster Structure ................................................................... 186
Figure 8.3 A Pick-up Truck as an All-Purpose Commercial Vehicle .................................. 190
Figure 8.4 A One Ton Pick-up Truck as a Passenger Car ................................................... 191
Figure 8.5 A One Ton Pick-up Truck as a Bus................................................................... 191
Figure 8.6 A One Ton Pick-up Truck as a Cargo Truck ..................................................... 192
Figure 9.1 The Model of Technological Capability Development for the Automotive
Part Industry in Thailand (Empirical Conceptual Framework) .......................... 214
xv
List of Tables
Table 1.1 Contributions of the Study ................................................................................... 12
Table 2.1 Production Capacity (Units) of Assemblers in Thailand ....................................... 23
Table 2.2 Employment in the Thai Automotive Industry and Related Industries .................. 24
Table 2.3 First Tier Suppliers Categorised by Parts’ Functions. ........................................... 25
Table 2.4 Production, Domestic Sales, and Exports of Commercial and Passenger Vehicles .. 26
Table 2.5 Summary of Thai Automotive Developments and the Establishment
of Assembler Companies under Government Policies 1960-1970 ........................ 29
Table 2.6 Summary of Thai Automotive Developments under Government
Policies 1971-1977 ............................................................................................ 30
Table 2.7 Summary of Thai Automotive Developments under Government
Policies 1978-1986 ............................................................................................ 31
Table 2.8 Summary of Thai Automotive Developments under Government
Policies 1987-1996 ............................................................................................ 32
Table 2.9 Summary of Thai Automotive Developments under Government
Policies 1997-2003 ............................................................................................ 34
Table 2.10 Tariff and Taxes (Per cent) in the Thai Automotive Industry up until 2008 .................. 38
Table 3.1 Technological Capability Matrix.......................................................................... 43
Table 3.2 Key Concepts Affecting the Success of Technological Capability
Development in this Study .................................................................................. 47
Table 3.3 Innovation Strategies of Technology-Intensive Firms and Characteristics
of the Strategy, and Relating Factors Affecting Technological Capability
Development ...................................................................................................... 57
Table 3.4 Number of Employees in Each Size of Firm ........................................................ 60
Table 3.5 Channel for Technology Acquisition ................................................................... 67
Table 5.1 Participant List for Phase I ................................................................................... 92
Table 5.2 Measurement Items for Part 1 of the Survey Questionnaire .................................. 95
Table 5.3 Issues Addressed by Phase I that Influenced Questions (Part 2) for Phase II ........... 99
Table 5.4 Measurement Items for Part 3 of the Survey Questionnaire ................................ 100
Table 5.5 Stages in the Quality Control Process of the Phase II Questionnaire ................... 102
Table 5.6 Cramer’s V Scores and Levels of Association (or Relationship)......................... 107
Table 5.7 Participant List for Phase III .............................................................................. 111
xvi
Table 5.8 Qualitative Research Techniques ....................................................................... 113
Table 5.9 Comparison among Mixed Methods, Qualitative and Quantitative Research ...... 114
Table 5.10 Range of Mixed Research Methods .................................................................. 116
Table 6.1 Set of Questions for Government Officers ......................................................... 121
Table 6.2 Set of Questions for the Company Managers. .................................................... 122
Table 6.3 Six Phases of Thai Government Policy Affecting Technological Capability
Development in the Thai Automotive Industry ................................................. 123
Table 6.4 Summary of Findings: Government Officers ...................................................... 128
Table 6.5 Summary of Findings: Automobile Companies .................................................. 130
Table 7.1 Number of Employees ....................................................................................... 137
Table 7.2 Nationality of Ownership ................................................................................... 138
Table 7.3 Industry Types ................................................................................................... 139
Table 7.4 Reasons for Investing in the Industry ................................................................. 140
Table 7.5 Type of Company Ownership ............................................................................ 140
Table 7.6 Method of Obtainment of Exclusive Contracts...................................................... 141
Table 7.7 Method of Obtainment of General Contracts from Other Firms ............................. 142
Table 7.8 Product Technology Type .................................................................................. 143
Table 7.9 Type of Modification ......................................................................................... 144
Table 7.10 Consideration of Investment in Research and Design ....................................... 145
Table 7.11 Sources of Component Parts ............................................................................ 145
Table 7.12 Method of Acquiring Technology. ................................................................... 146
Table 7.13 Need for Foreign Technicians or Experts Assistance. ....................................... 148
Table 7.14 Government Policies to Promote Technological Capability Development ......... 149
Table 7.15 Government Incentive Supporting the Firm ..................................................... 150
Table 7.16 Concern about Government Regulations .......................................................... 151
Table 7.17 Government Taxes of Most Concern ................................................................ 152
Table 7.18 Satisfaction with Government Policy .................................................................... 153
Table 7.19 Existence of R&D Activities in the Company .................................................. 154
Table 7.20 Results of Chi-Square Test for All Independent Variables in the
Conceptual Framework .................................................................................. 156
Table 7.21 All Factors with Cramer’s V Scores and Their Levels of Association............... 158
Table 7.22 All Factors for Each Key Concept Having Relationships with the Existence
of R&D Activities (Results from Chi-Square Test and Cramer’s V) ................ 159
Table 7.23 Logistic Regression for Organisation & Organisational Learning ..................... 162
xvii
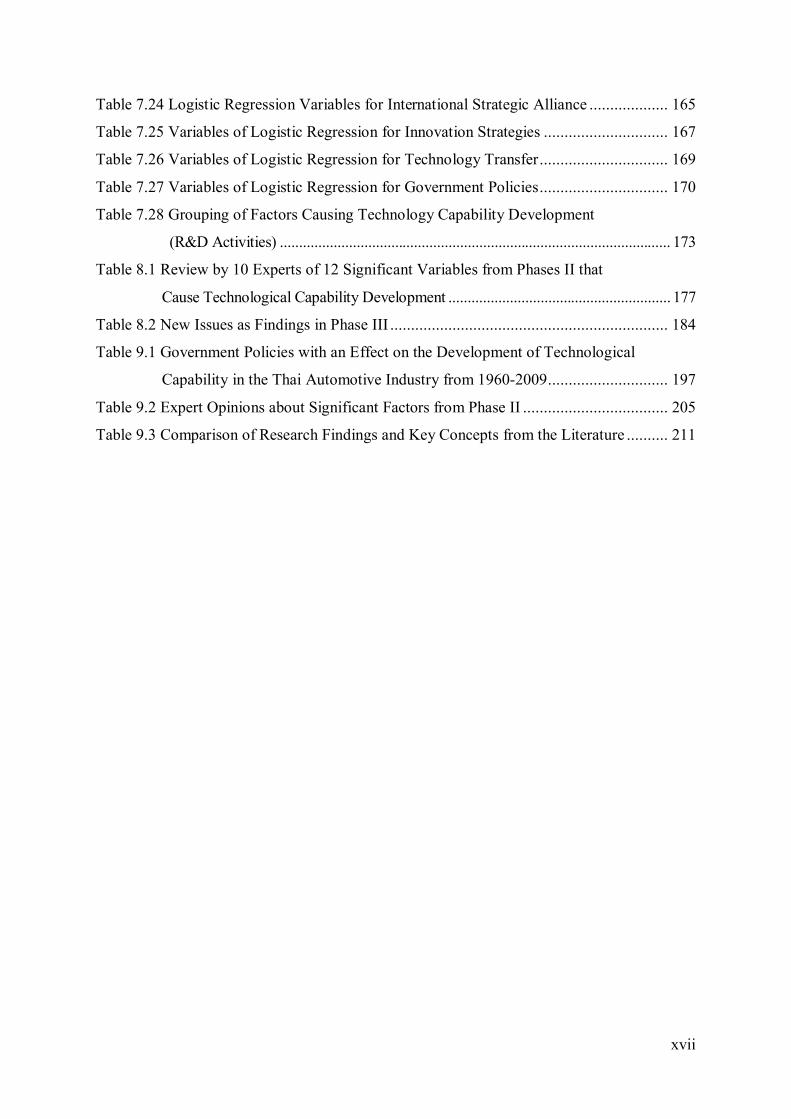
Table 7.24 Logistic Regression Variables for International Strategic Alliance ................... 165
Table 7.25 Variables of Logistic Regression for Innovation Strategies .............................. 167
Table 7.26 Variables of Logistic Regression for Technology Transfer ............................... 169
Table 7.27 Variables of Logistic Regression for Government Policies ............................... 170
Table 7.28 Grouping of Factors Causing Technology Capability Development
(R&D Activities) ...................................................................................................... 173
Table 8.1 Review by 10 Experts of 12 Significant Variables from Phases II that
Cause Technological Capability Development .......................................................... 177
Table 8.2 New Issues as Findings in Phase III ................................................................... 184
Table 9.1 Government Policies with an Effect on the Development of Technological
Capability in the Thai Automotive Industry from 1960-2009 ............................. 197
Table 9.2 Expert Opinions about Significant Factors from Phase II ................................... 205
Table 9.3 Comparison of Research Findings and Key Concepts from the Literature .......... 211
xviii
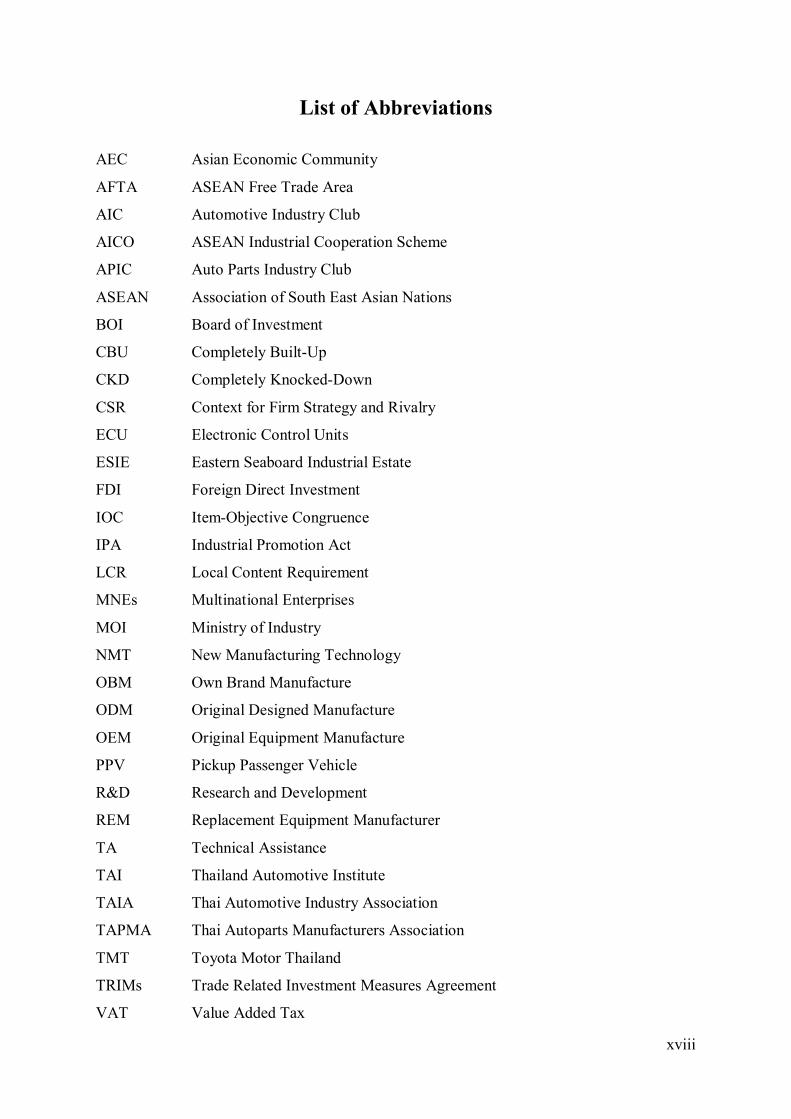
List of Abbreviations
AEC Asian Economic Community
AFTA ASEAN Free Trade Area
AIC Automotive Industry Club
AICO ASEAN Industrial Cooperation Scheme
APIC Auto Parts Industry Club
ASEAN Association of South East Asian Nations
BOI Board of Investment
CBU Completely Built-Up
CKD Completely Knocked-Down
CSR Context for Firm Strategy and Rivalry
ECU Electronic Control Units
ESIE Eastern Seaboard Industrial Estate
FDI Foreign Direct Investment
IOC Item-Objective Congruence
IPA Industrial Promotion Act
LCR Local Content Requirement
MNEs Multinational Enterprises
MOI Ministry of Industry
NMT New Manufacturing Technology
OBM Own Brand Manufacture
ODM Original Designed Manufacture
OEM Original Equipment Manufacture
PPV Pickup Passenger Vehicle
R&D Research and Development
REM Replacement Equipment Manufacturer
TA Technical Assistance
TAI Thailand Automotive Institute
TAIA Thai Automotive Industry Association
TAPMA Thai Autoparts Manufacturers Association
TMT Toyota Motor Thailand
TRIMs Trade Related Investment Measures Agreement
VAT Value Added Tax
xix
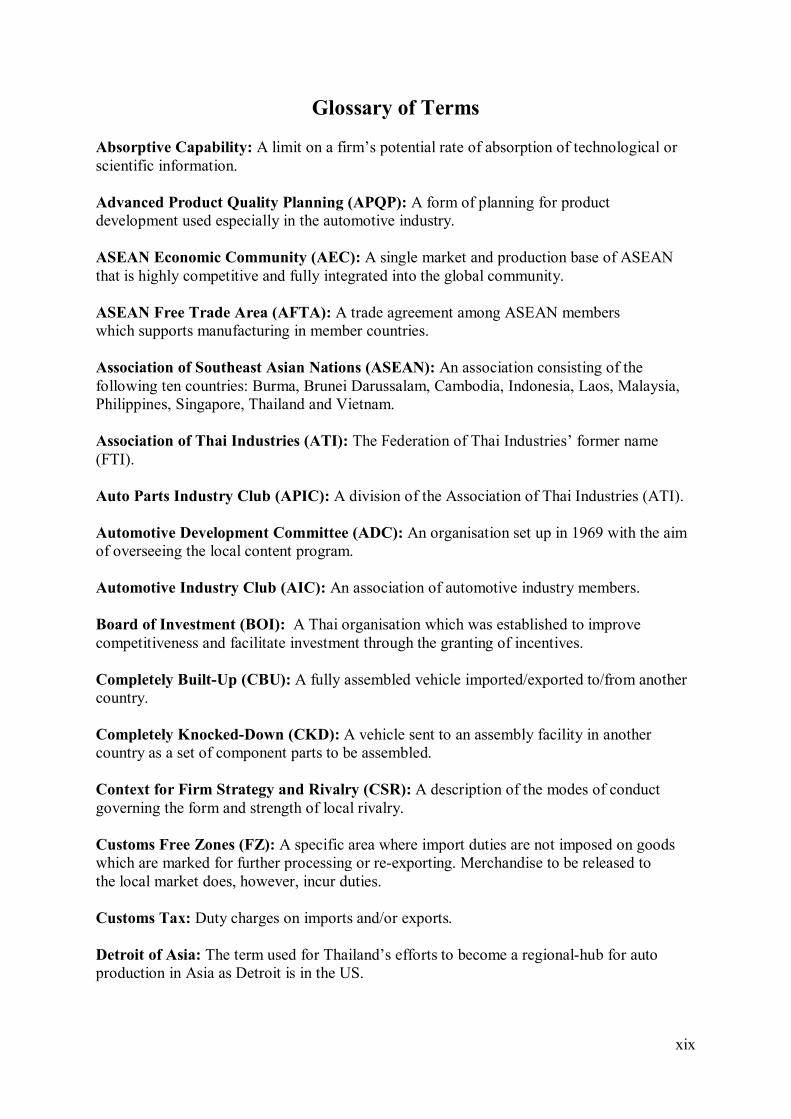
Glossary of Terms Absorptive Capability: A limit on a firm’s potential rate of absorption of technological or scientific information. Advanced Product Quality Planning (APQP): A form of planning for product development used especially in the automotive industry. ASEAN Economic Community (AEC): A single market and production base of ASEAN that is highly competitive and fully integrated into the global community. ASEAN Free Trade Area (AFTA): A trade agreement among ASEAN members which supports manufacturing in member countries. Association of Southeast Asian Nations (ASEAN): An association consisting of the following ten countries: Burma, Brunei Darussalam, Cambodia, Indonesia, Laos, Malaysia, Philippines, Singapore, Thailand and Vietnam. Association of Thai Industries (ATI): The Federation of Thai Industries’ former name (FTI). Auto Parts Industry Club (APIC): A division of the Association of Thai Industries (ATI). Automotive Development Committee (ADC): An organisation set up in 1969 with the aim of overseeing the local content program. Automotive Industry Club (AIC): An association of automotive industry members. Board of Investment (BOI): A Thai organisation which was established to improve competitiveness and facilitate investment through the granting of incentives. Completely Built-Up (CBU): A fully assembled vehicle imported/exported to/from another country. Completely Knocked-Down (CKD): A vehicle sent to an assembly facility in another country as a set of component parts to be assembled. Context for Firm Strategy and Rivalry (CSR): A description of the modes of conduct governing the form and strength of local rivalry. Customs Free Zones (FZ): A specific area where import duties are not imposed on goods which are marked for further processing or re-exporting. Merchandise to be released to the local market does, however, incur duties. Customs Tax: Duty charges on imports and/or exports. Detroit of Asia: The term used for Thailand’s efforts to become a regional-hub for auto production in Asia as Detroit is in the US.
xx
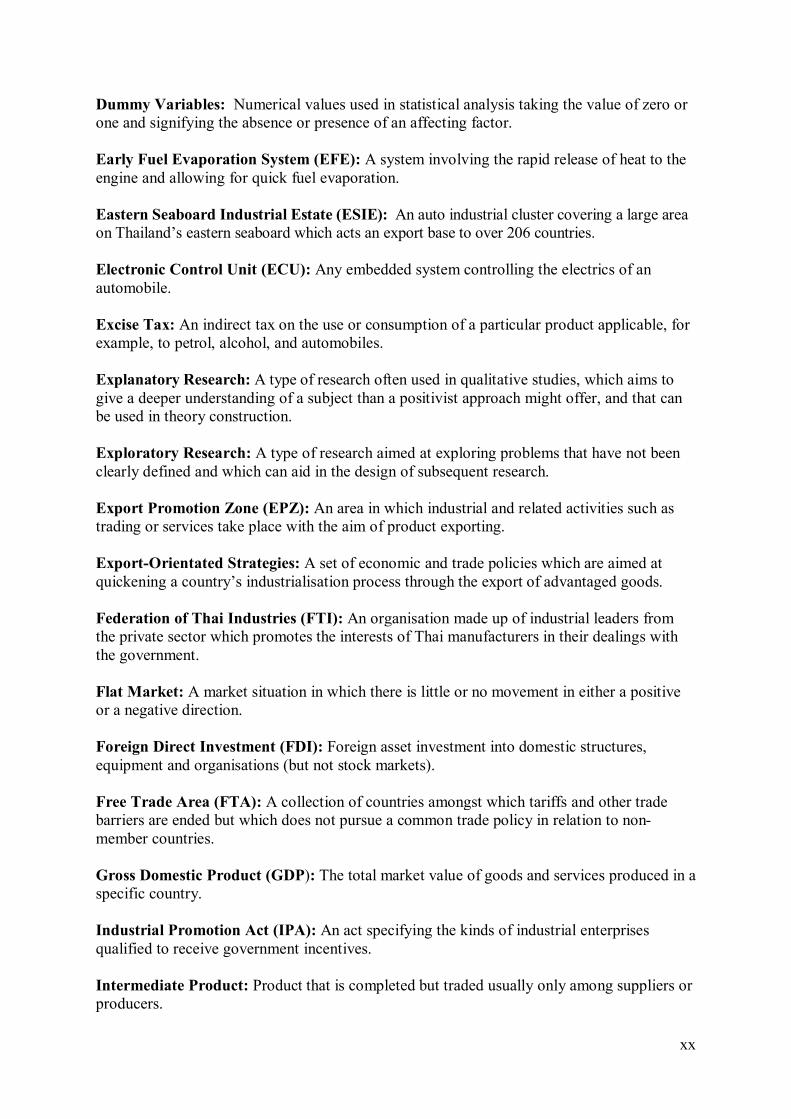
Dummy Variables: Numerical values used in statistical analysis taking the value of zero or one and signifying the absence or presence of an affecting factor. Early Fuel Evaporation System (EFE): A system involving the rapid release of heat to the engine and allowing for quick fuel evaporation. Eastern Seaboard Industrial Estate (ESIE): An auto industrial cluster covering a large area on Thailand’s eastern seaboard which acts an export base to over 206 countries. Electronic Control Unit (ECU): Any embedded system controlling the electrics of an automobile. Excise Tax: An indirect tax on the use or consumption of a particular product applicable, for example, to petrol, alcohol, and automobiles. Explanatory Research: A type of research often used in qualitative studies, which aims to give a deeper understanding of a subject than a positivist approach might offer, and that can be used in theory construction. Exploratory Research: A type of research aimed at exploring problems that have not been clearly defined and which can aid in the design of subsequent research. Export Promotion Zone (EPZ): An area in which industrial and related activities such as trading or services take place with the aim of product exporting. Export-Orientated Strategies: A set of economic and trade policies which are aimed at quickening a country’s industrialisation process through the export of advantaged goods. Federation of Thai Industries (FTI): An organisation made up of industrial leaders from the private sector which promotes the interests of Thai manufacturers in their dealings with the government. Flat Market: A market situation in which there is little or no movement in either a positive or a negative direction. Foreign Direct Investment (FDI): Foreign asset investment into domestic structures, equipment and organisations (but not stock markets). Free Trade Area (FTA): A collection of countries amongst which tariffs and other trade barriers are ended but which does not pursue a common trade policy in relation to non-member countries. Gross Domestic Product (GDP): The total market value of goods and services produced in a specific country. Industrial Promotion Act (IPA): An act specifying the kinds of industrial enterprises qualified to receive government incentives. Intermediate Product: Product that is completed but traded usually only among suppliers or producers.
xxi
Item-Objective Congruence (IOC) index: A method of content validation which aims at evaluating the appropriateness of index content using a score of the degree of relationship between each item and its object from -1 to +1. Kaizen: A Japanese process of quality assurance that involves continual improvements in operations. Liberalisation Policy: A relaxation of restrictions by government, commonly in social or economic policy. Local Content Regulation (LCR): A government policy requiring a specified minimum percentage of indigenous content to be used in the manufacture of a particular product. Localisation Policy: A policy focused on encouraging indigenous businesses which are involved in the sustainable use of local resources, which employ locals at decent wages and which primarily serve local consumers. Market Fragmentation: The segmentation of a previously homogeneous market with new segments having their own particular needs and preferences. Multinational Enterprises (MNEs): A corporate entity that manufactures or delivers services internationally. Non-Tariff Barriers: Trade barriers, other than tariffs, restricting imports. One-Ton Pick-Ups: A light motor vehicle with a rear cargo area that could originally carry a maximum payload of one-ton. (Most modern pickups can carry significantly more). Organisational Culture: The particular values and behaviours which together form the socio-cultural environment of an organisation. Organisational Learning: A continuous process of development which affects an organisation and improves its ability to deal with internal and external change. Organisational Life Cycle (OLC): A model that suggests that businesses generally progress through a distinct series of developmental stages. Parent Company: A company that controls operations in another company due to having sufficient voting stock to influence or elect its board of directors. Pickup Passenger Vehicle (PPV): A Sport Utility Vehicle (SUV) base on pickup truck platform. Pilot: A small-scale test carried out to check conditions before the full scale launching of a project. Production Capacity: The volume of product an enterprise can generate, given its current resources, over a set period. QS9000: A quality standard jointly developed by General Motors, Chrysler, and Ford.
xxii
Regional Hub Position: A focal point or centre of interest around which regional commerce and/or transportation revolve. Research and Development (R&D): Activities carried out by an enterprise aimed at discovering new products or procedures, or ways of improving existing products or procedures. Rural Tax: A tax addition to excise taxes (10 per cent of excise tax in Thailand). Small to Medium Enterprises (SMEs): Businesses whose head-counts put them in a category above small businesses but below big business. The exact numbers determining their categorisation may vary. Technological Capability: Including systems of activities, skills, knowledge bases, and values that create operational and other advantages for a firm. Technology Transfer: The process or processes relating to the movement of technological knowledge amongst organisations. Thai Automotive Institute (TAI): An organisation set up with the aim of formulating policies to aid the development of the country's automotive industry. Thai Autoparts Manufacturers Association (TAPMA): A union amongst private auto parts manufacturing companies aimed at developing, supporting and protecting the Thai autopart industry. Trade Related Investment Measures Agreement (TRIMs): A WTO agreement applying to regulations signature countries apply to foreign investors, particularly concerning industrial issues. Triangulation: Involving the use of more than two methods in a study in order to offer of further level of checking or confirmation of results. Value Added Tax (VAT): A consumption tax placed on a product at each stage of its production and distribution (as opposed to a sales tax, which is levied only when the product is ready for sale). World Trade Organization (WTO): An organisation set up to oversee and enforce rules concerning international trade.
1
Chapter 1
Introduction
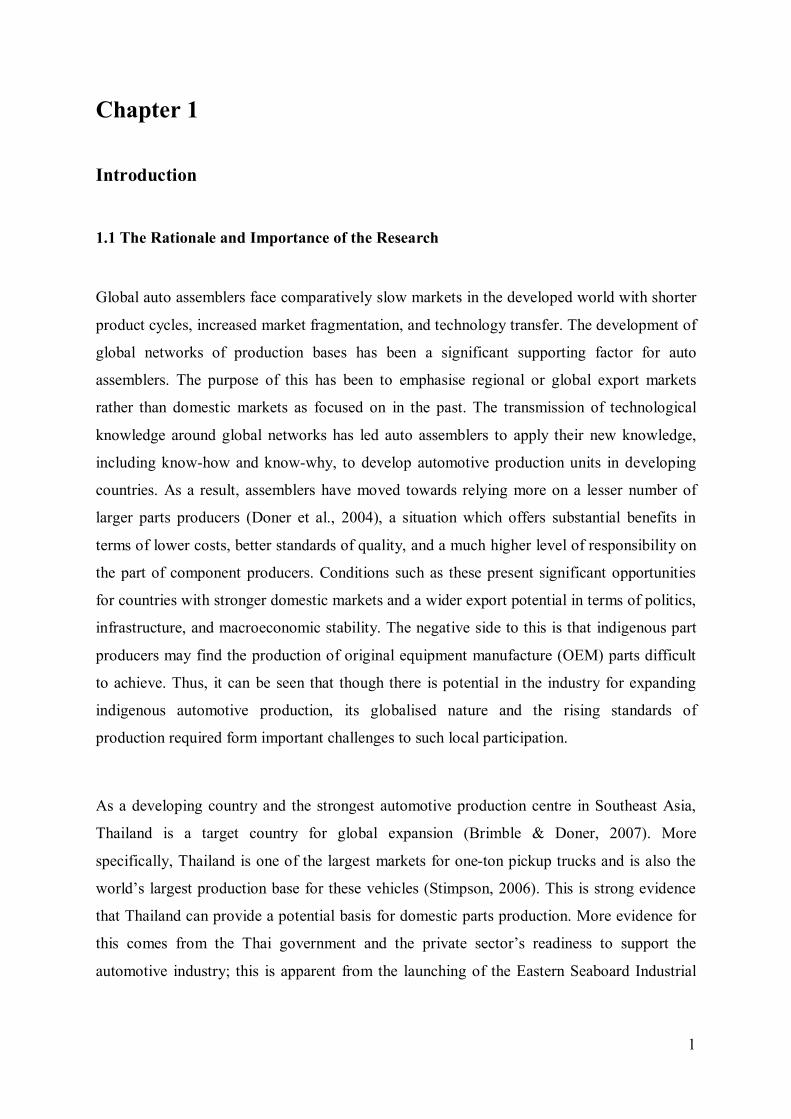
1.1 The Rationale and Importance of the Research
Global auto assemblers face comparatively slow markets in the developed world with shorter
product cycles, increased market fragmentation, and technology transfer. The development of
global networks of production bases has been a significant supporting factor for auto
assemblers. The purpose of this has been to emphasise regional or global export markets
rather than domestic markets as focused on in the past. The transmission of technological
knowledge around global networks has led auto assemblers to apply their new knowledge,
including know-how and know-why, to develop automotive production units in developing
countries. As a result, assemblers have moved towards relying more on a lesser number of
larger parts producers (Doner et al., 2004), a situation which offers substantial benefits in
terms of lower costs, better standards of quality, and a much higher level of responsibility on
the part of component producers. Conditions such as these present significant opportunities
for countries with stronger domestic markets and a wider export potential in terms of politics,
infrastructure, and macroeconomic stability. The negative side to this is that indigenous part
producers may find the production of original equipment manufacture (OEM) parts difficult
to achieve. Thus, it can be seen that though there is potential in the industry for expanding
indigenous automotive production, its globalised nature and the rising standards of
production required form important challenges to such local participation.
As a developing country and the strongest automotive production centre in Southeast Asia,
Thailand is a target country for global expansion (Brimble & Doner, 2007). More
specifically, Thailand is one of the largest markets for one-ton pickup trucks and is also the
world’s largest production base for these vehicles (Stimpson, 2006). This is strong evidence
that Thailand can provide a potential basis for domestic parts production. More evidence for
this comes from the Thai government and the private sector’s readiness to support the
automotive industry; this is apparent from the launching of the Eastern Seaboard Industrial
2
Estate (ESIE) in which most of the top auto part manufacturers have now set up their plants
(Brimble & Doner, 2007).
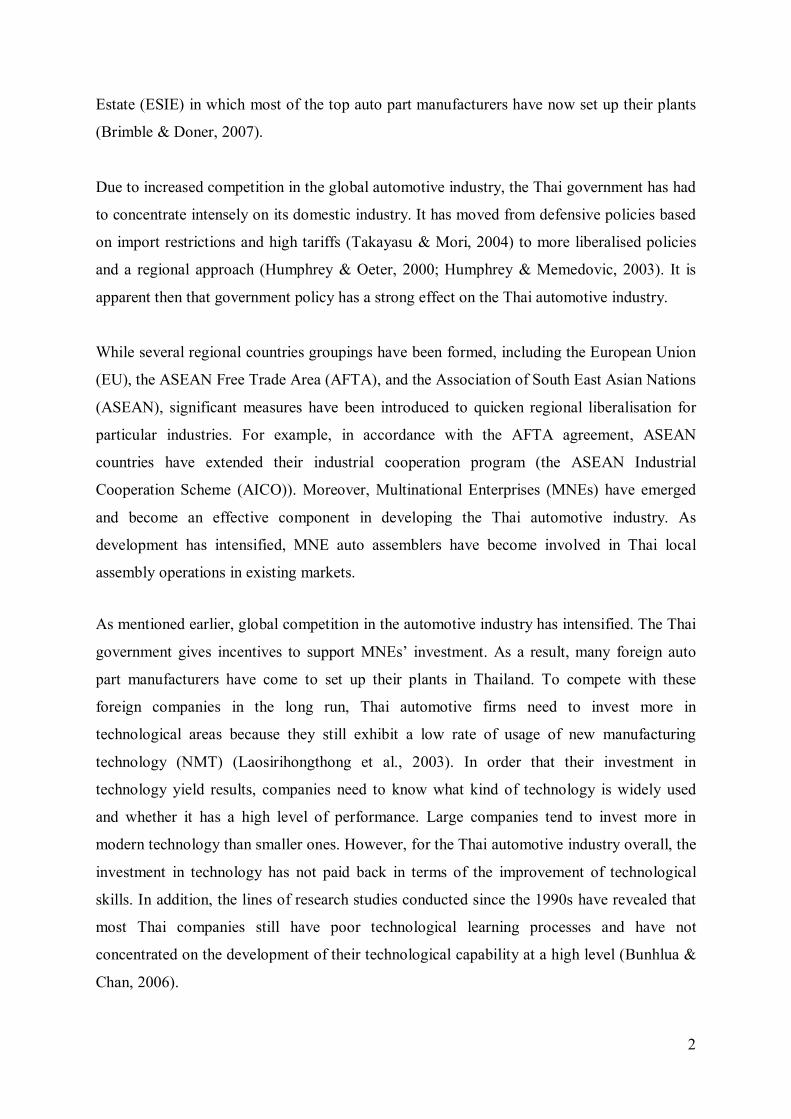
Due to increased competition in the global automotive industry, the Thai government has had
to concentrate intensely on its domestic industry. It has moved from defensive policies based
on import restrictions and high tariffs (Takayasu & Mori, 2004) to more liberalised policies
and a regional approach (Humphrey & Oeter, 2000; Humphrey & Memedovic, 2003). It is
apparent then that government policy has a strong effect on the Thai automotive industry.
While several regional countries groupings have been formed, including the European Union
(EU), the ASEAN Free Trade Area (AFTA), and the Association of South East Asian Nations
(ASEAN), significant measures have been introduced to quicken regional liberalisation for
particular industries. For example, in accordance with the AFTA agreement, ASEAN
countries have extended their industrial cooperation program (the ASEAN Industrial
Cooperation Scheme (AICO)). Moreover, Multinational Enterprises (MNEs) have emerged
and become an effective component in developing the Thai automotive industry. As
development has intensified, MNE auto assemblers have become involved in Thai local
assembly operations in existing markets.
As mentioned earlier, global competition in the automotive industry has intensified. The Thai
government gives incentives to support MNEs’ investment. As a result, many foreign auto
part manufacturers have come to set up their plants in Thailand. To compete with these
foreign companies in the long run, Thai automotive firms need to invest more in
technological areas because they still exhibit a low rate of usage of new manufacturing
technology (NMT) (Laosirihongthong et al., 2003). In order that their investment in
technology yield results, companies need to know what kind of technology is widely used
and whether it has a high level of performance. Large companies tend to invest more in
modern technology than smaller ones. However, for the Thai automotive industry overall, the
investment in technology has not paid back in terms of the improvement of technological
skills. In addition, the lines of research studies conducted since the 1990s have revealed that
most Thai companies still have poor technological learning processes and have not
concentrated on the development of their technological capability at a high level (Bunhlua &
Chan, 2006).
3
In this respect, the development of technological capability in the Thai automotive industry
with a focus on local Thai auto parts companies is worth examining in this dissertation.
1.2 Current State of Knowledge and Research Questions
To identify knowledge gaps and critical problems in the Thai automotive industry (as
outlined in Section 1.2.3), the researcher reviewed the research context and theoretical
background, and conducted the Phase I interviews. After reviewing these materials and Phase
I findings, the research questions relating to these knowledge gaps and aiming to solve
critical problems were composed.
1.2.1 Overview of Research Context
To clearly understand the research context for this study, a summary of the Thai automotive
industry and related parties is presented as follows:
1) The Thai Automotive Industry
The Thai automotive industry, which employs over one hundred thousand people (see Table
2.2 in Chapter 2), has been successful as a result of both the strong growth of global markets
and effective government policies. Thailand, unlike China and Malaysia, has not pursued a
national car brand and has focused on becoming the top vehicle assembler and auto part
supplier in the region (Abdulsomad, 2003). Some signs of success include the following:
Thai automotive production capacity has dramatically increased and was more than two
million units in 2010 (see Table 2.1 in Chapter 2). In addition, about half of its annual car
production was exported, and the export revenues on completely built-up (CBU) cars are
twice those on completely knocked-down (CKD) cars. Also, Thailand is the top producer of 1
ton pickup trucks in the world (Khenkum, 2007). These data revealed that Thailand’s master
plan of becoming a global production base has given impressive results. All details, tables,
and figures used to support the study are presented in Chapter 2.
Japanese carmakers have the highest production capacities (see Table 2.1 in Chapter 2)
compared with European and American carmakers. Auto part suppliers are either owned by
Thais or joint ventures and come in three types in the automotive network: first-tier suppliers
4
(who work closely with experts from carmakers), second-tier suppliers (who work with first-
tier suppliers), and general suppliers (See Figure 2.1 in Chapter 2). In addition, automotive
associations founded by the private sector, such as TAPMA, TAIA, TAI, have had an
important role in negotiating with the government concerning policy issues beneficial to the
path of industrial development (see more details in Chapter 2).
2) Government and Policies
Thai government policies regarding the automotive and parts industry have shifted from high
to low local protection and from being more import-oriented to more export-oriented.
Government policies can be divided into six phases as follows:
The first three phases from 1960 to 1986 comprise of the Simple Assembly Phase, the First
Localisation Phase, and the Second Localisation Phase. In the first year of the Thai
automotive industry with only 500 assembled cars, local companies had no experience. CBU
& CKD regulations for passenger cars, commercial cars and trucks were implemented to
protect international competition, and tax exemptions were created to promote local auto
parts suppliers (see Section 2.3.1 in Chapter 2). In the middle of the 1970s, Local Content
Requirements (LCR) were introduced, and became stricter over the years. During these
phases the number of assemblers and suppliers increased significantly.
The last three phases from 1987 to 2010 were the Liberalisation Phase, the Financial Crisis
Phase, and the Detroit of Asia Phase. Thailand signed many trade agreements as more openings
into international markets became available. To meet these agreements, CBU and CKD
regulations became less strict, and LCR would be lifted by 2000 (see Section 2.3.5). As a
result, many carmakers decided to set up new plants and use Thailand as an export base.
Again, the Thai government at that time made the right decision to become export focused.
The Thai economic crisis in 1997 adversely affected the Thai automotive industry at first, but
a few years later, a new surge of MNE inflows set a strong path of growth for the industry
(Abdulsomad, 2003). Thailand’s goal of becoming the “Detroit of Asia” became feasible
from that time. More details about the six phases of government policies, Thai government’s
international trade policies, and important tax policies are discussed in Chapter 2.
5
Carmakers, suppliers, automotive associations, and the government have played crucial roles
throughout the history of the Thai automotive industry. However, without government policy
support and international technology transfer, Thai automotive companies, especially auto
parts firms, would have a hard time surviving in this competitive industry (according to
information from the Phase I in-depth interviews). Thus, these Thai companies need to carry
out strategic reviews of their production processes in order to develop technological
capability through technology transfer or through the launching of more R&D activities.
Topics related to the development of technological capability are investigated by the
literature review in the next section.
1.2.2 Theoretical Background
A company’s technological capabilities are the key to successful development and the
development of technological capability is the area this study focuses on.
An organisation that wants to develop its technological capabilities step by step can follow
the road map of the Technological Capability Matrix which is divided into three areas,
investment, production, and linkage (Table 3.1 in Chapter 3) (Modified from Lall, 1992; Bell
& Pavitt, 1995). As various research and development (R&D) activities are at the advanced
level in this matrix, R&D can be used as the sole indicator for technology capability
development in this study. Abeysinghe and Paul’s (2006) and other researcher’s (whose
findings are outlined in more detail in Section 3.5.2 of Chapter 3) have also claimed that
R&D can be used as the sole indicator of technological development. The success of R&D
depends on continuous support from top executives of Thai assemblers and suppliers because
R&D involves future-oriented, long-term activities in science or technology (Johansson &
Lööf, 2008). From Table 3.2, the key concepts from the literature review are ‘technology
transfer’, ‘innovation strategies’, ‘organisation & organisational learning’, and ‘international
strategic alliance’. When assemblers or suppliers in Thailand work to improve in all of these
areas aligned to R&D activities, they can more easily reach an advanced level of
technological capability. However, this claim has to be tested by statistical tools in Chapter 7.
It is found that ‘technology transfer’ from technology owners to recipients (Cohen &
Levinthal, 1989; Jensen & Meckling, 1992), including local suppliers, is a real shortcut for
6
enhancing technological and production skills. Thai suppliers including top executives and
employees need to have the ambition to work on effective production process and reliable
quality control to make sure that they will be recipients of MNE technology transfer.
Technology transfer can take place through various means in each industry, and the factors
involved are: type of industry, sources of component parts, and need for foreign technicians
or expert assistance. With regard to ‘innovation strategies’, the company needs to perform
both pro-active and re-active strategies (Van Der Panne et al., 2003; Johne & Snelson, 1988).
Innovation strategies can also be divided into four approaches (Trott, 2005; Maidique and
Patch, 1988 and Freeman, 1982b) (see Section 3.7.2 Chapter 3). Top executives need to have
a strong commitment and manage an innovation strategy that fits the company’s product
technology type, strengths, and core competencies.
Regarding the topic of ‘organisation’, larger organisations have higher capital, and
consequently a better chance to develop their technological capabilities. Top management
practice also directly impacts organisational culture (Robbins, 2005). Good leadership is
essential especially at the set-up stage of an organisation (Daft, 2010). Business owners need
to have strong experience or know about how to access technological knowledge in order that
their organisations can be successful at the long run.
‘Organisational learning’ can be divided into three parts: memory, interpretation, and
adaptation (action) (Huber, 1991; Balasubramanian, 1994). To improve learning processes,
firms need to be concerned about action-outcome linkages (PBM SIG, 2001). They should
compare their actions with expected outcomes and then adapt these actions to achieve more
challenging goals than those of their competitors. Firms need to utilise organisational
intelligence for sustainable growth and to reach the highest level of technological capabilities
(Grant, 1991). After a review of related research studies, organisation and organisational
learning were found to relate to the factors: size of the company, nationality of ownership,
reasons for investing in the industry, and methods of acquiring technology, which cause the
development of technological capabilities in the auto part manufacturing business.
Considering ‘international strategic alliance’, MNEs have alliances for different purposes,
time frames and types. These alliances can be used for globalising MNEs’ value chains
(Dunning, 1998). The creation of joint ventures is a popular form used by MNEs to access
7
international businesses. The reason is that they do not only benefit from their partners’
strengths but also internalise their production and keep know-how confidential (Czinkota et
al, 2005). It can be seen from the literature review of international strategic alliances that the
factors proven to have an effect on technological progress are type of ownership and type of
contracts (exclusive or general).
More details about the topics of technology transfer, innovation strategies, organisation,
organisational learning, international strategic alliance, and technological capability
development are discussed in Chapter 3.
1.2.3 Knowledge Gaps and Research Questions
A number of studies concerning the automotive industry, MNEs, and/or technological
capability development have been carried out in developed countries, but they have rarely
been conducted in the context of a developing country. To carry out the research in a Thai
context, the researcher reviewed the research context and the relevant literature, and
conducted the Phase I in-depth interviews.
In the Thai automotive industry, carmakers have transferred technologies to suppliers in their
automotive networks. In the network, first-tier suppliers or joint ventures have better
opportunities to obtain exclusive contracts to produce major automotive components and
learn production and technological techniques from carmakers. Most Thai suppliers in the
second and third tier lack opportunities to win purchasing orders for major auto parts and thus
miss out on learning know-how from these carmakers. Also, Thai suppliers do not have the
basic technological knowledge required to access higher skills because they do not invent
machines and technologies themselves. As a result, Thai suppliers still cannot reach an
advanced level of technological capabilities (as mentioned at the end of Section 1.1).
Moreover, according to the expert opinions in Phase I, Thai suppliers cannot produce
sophisticated parts, such as Electronic Control Units (ECU), and are still weak in developing
their technological capabilities. To solve these problems, the broad questions “Who plays a
key role in solving this problem?” and “What effective remedies need to be introduced?” are
examined. These questions are part of the refining of the research questions.
8
Thai suppliers dedicate almost all their working hours to solving the problems of low
efficiency of production and poor quality control, and they have few opportunities to learn
new technologies (according to the expert opinions in Phase I). Judging by the success of
government policies as shown in the growth of the Thai automotive industry in past decades,
the Thai government may be able to adjust its policies to further support technology
capability development beyond the “Detroit of Asia” phase. In other words, the concept of
government policies can complete the conceptual framework, as the final key concept, and
help to address the knowledge gap of the developing country context (see Figure 1.1).
Therefore, this study should investigate government policies to discover which old and which
current policies have a positive impact on the development of the automotive industry and
can help to improve technological capability development in the future. In this study, the first
research question is as follows:
RQ1: What government policies were used to develop technological capability in the
Thai automotive industry from 1960-2009?
At this point, from the literature review, the Thai research context and the answers to RQ1,
the key concepts included in this study, technology transfer, innovation strategies,
organisation & organisational learning, international strategic alliance, and government
policies (as a new key concept obtained from RQ1) are claimed to have an effect on
technology capability development. Consequently, the remedy for the unsuccessful
development of technological capabilities in the Thai automotive industry is the improvement
of these five key concepts. However, before the improvement takes place, factors related to
each key concept need to be investigated. Then, to make sure that these factors fit the Thai
context, they will be tested with statistical tools in the process analysis later. Therefore, the
second research question for this study is:
RQ2: What factors have affected the technological capability development of local Thai
auto parts firms?
To answer both research questions, three phases of research are used as outlined in Section
1.6.
9
1.3 Overview of the Limitations of Research
This study has limitations in parts of the research context, the literature reviews, the research
execution and techniques, the conceptual framework, and data analysis.
The dissertation covers the topics of technological capability development, and related factors
in the Thai automotive industry. The research context and literature reviews of these topics
are presented in Chapter 2 and 3. However, some data from government departments are
inaccessible and obsolete, and new data have still not been published. Another problem with
the data in this study is their inconsistent presentation. The data in the tables refer to different
time periods, so they are hard to use for comparative purposes. In addition, many of the
research papers examined in the study were conducted in industries other than the automotive
industry. Considering this, the researcher decided to use the latest data and research papers
from reliable sources to meet the objectives of each chapter.
Regarding the research activity execution and research techniques, the study comprises of
three phases. The Phase III in-depth interviews involved ten top executives from government
departments, leading automotive companies and automotive associations. The limitation of
the nature of using the qualitative method with a small number of interviewees is in terms of
its reliability. The findings of three new issues in this phase cannot be generalised to the
automotive industry. However, future research, similar to Phase II, involving the use of a
survey with a large sample size and with statistical tools to test the data can correct this
problem for Phase III. In addition, the Phase II Survey involved a multiple choice
questionnaire divided into the following sections: background questions, government
policies, and technological capabilities. This questionnaire format facilitates the respondents
and saves their time. However, the researcher cannot probe for further details.
There is a limitation to the conceptual framework (see Figure 1.1). The key concepts of
‘organisation & organisational learning’, ‘technology transfer’, ‘international strategic
alliance’, ‘innovation strategies’ and ‘government policies’ that cause the development of
technological capability are included. However, some concepts from the theoretical
background were omitted because very few research studies related to technological
capability development rely on them. The list of fields or concepts of research studies that
10
have been conducted and are supported by realisable evidence and strong models, are in
Table 3.2 of Chapter 3.
In the data analysis, the logistic regression model in this study includes five different
equations for the five key concepts shown in Section 9.3 of Chapter 9. Each equation
represents a causal relationship between the group of factors in a key concept and the
development of technological capability. Having an individual equation for each key concept
has the advantage of prioritising influential factors in each key concept in terms of the
development of technology capability and facilitates the sharing of responsibilities among
concerned parties from government departments and automotive industries in their dealing
with different groups of factors. However, the limitation of these equations is that they cannot
be used to predict the probability of the existence of technological capability development in
a specific company.
More details of the limitations of the research are presented in Chapter 10.
1.4 Overview of the Conceptual Framework
This study follows a specific sequence of discussion that leads to the development of its
conceptual framework (see Chapter 4). The conceptual framework comprises of five key
concepts. The first four key concepts (organisation & organisational learning, technology
transfer, international strategic alliance, and innovation strategies) influencing the
development of technological capability are garnered from the literature review. Although
these key concepts are derived from different disciplines and areas of research, it has been
essential to integrate them to study and understand the development of technological
capability in the Thai automotive industry. The rationale for integrating each of these key
concepts into the development of the conceptual framework is discussed in Section 3.4 in
Chapter 3 and Section 4.3.1 to 4.3.6 in Chapter 4.
From the research context and Phase I findings, government policies are introduced as the
last key concept of the conceptual framework. The conceptual framework is the core of the
study as it connects with every element of the research (see Figure 1.1 and more details in
Chapter 4).
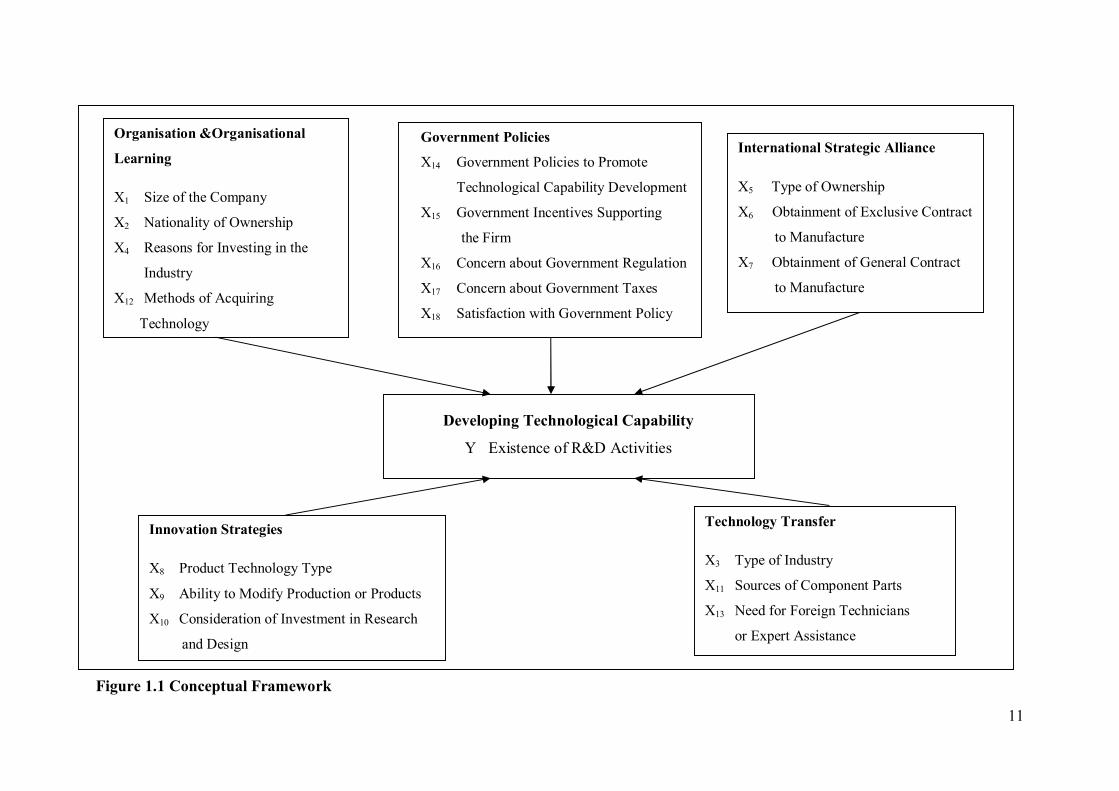
11
Figure 1.1 Conceptual Framework
Organisation &Organisational
Learning
X1 Size of the Company
X2 Nationality of Ownership
X4 Reasons for Investing in the
Industry
X12 Methods of Acquiring
Technology
Developing Technological Capability
Y Existence of R&D Activities
International Strategic Alliance
X5 Type of Ownership
X6 Obtainment of Exclusive Contract
to Manufacture
X7 Obtainment of General Contract
to Manufacture
Innovation Strategies
X8 Product Technology Type
X9 Ability to Modify Production or Products
X10 Consideration of Investment in Research
and Design
Technology Transfer
X3 Type of Industry
X11 Sources of Component Parts
X13 Need for Foreign Technicians
or Expert Assistance
Government Policies
X14 Government Policies to Promote
Technological Capability Development
X15 Government Incentives Supporting
the Firm
X16 Concern about Government Regulation
X17 Concern about Government Taxes
X18 Satisfaction with Government Policy
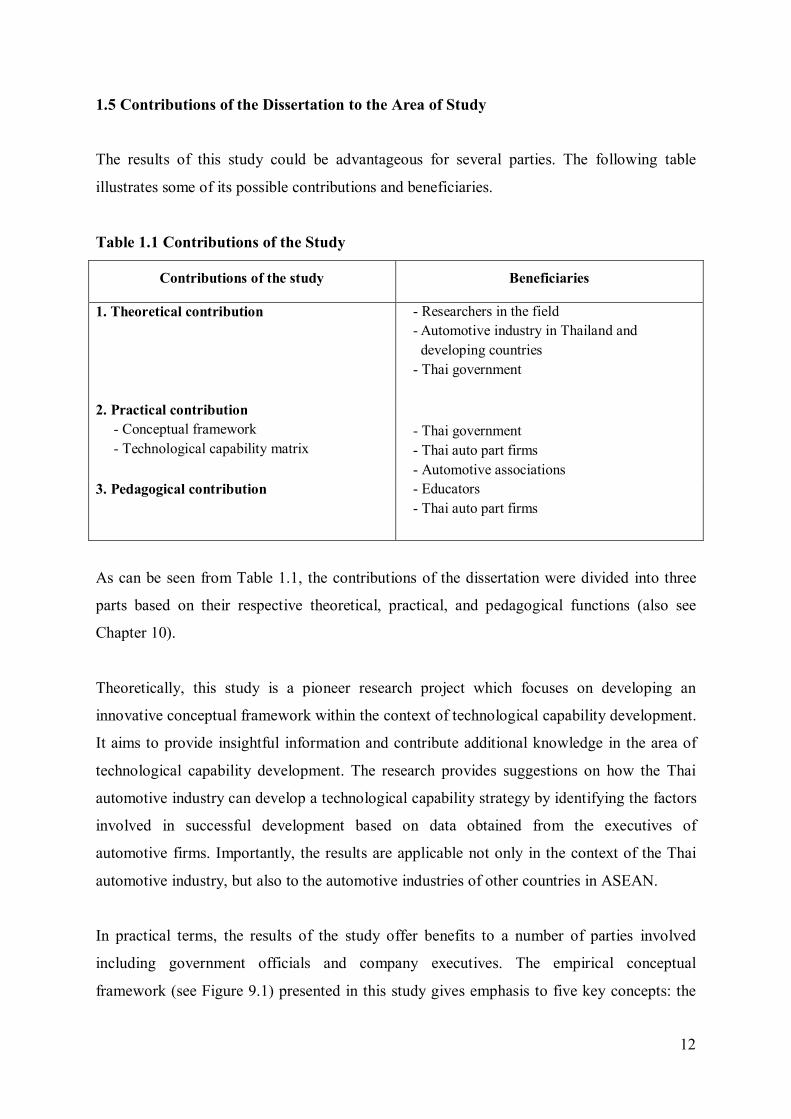
12
1.5 Contributions of the Dissertation to the Area of Study
The results of this study could be advantageous for several parties. The following table
illustrates some of its possible contributions and beneficiaries.
Table 1.1 Contributions of the Study
Contributions of the study Beneficiaries
1. Theoretical contribution - Researchers in the field - Automotive industry in Thailand and developing countries - Thai government
2. Practical contribution - Conceptual framework - Technological capability matrix
- Thai government - Thai auto part firms - Automotive associations
3. Pedagogical contribution - Educators - Thai auto part firms
As can be seen from Table 1.1, the contributions of the dissertation were divided into three
parts based on their respective theoretical, practical, and pedagogical functions (also see
Chapter 10).
Theoretically, this study is a pioneer research project which focuses on developing an
innovative conceptual framework within the context of technological capability development.
It aims to provide insightful information and contribute additional knowledge in the area of
technological capability development. The research provides suggestions on how the Thai
automotive industry can develop a technological capability strategy by identifying the factors
involved in successful development based on data obtained from the executives of
automotive firms. Importantly, the results are applicable not only in the context of the Thai
automotive industry, but also to the automotive industries of other countries in ASEAN.
In practical terms, the results of the study offer benefits to a number of parties involved
including government officials and company executives. The empirical conceptual
framework (see Figure 9.1) presented in this study gives emphasis to five key concepts: the
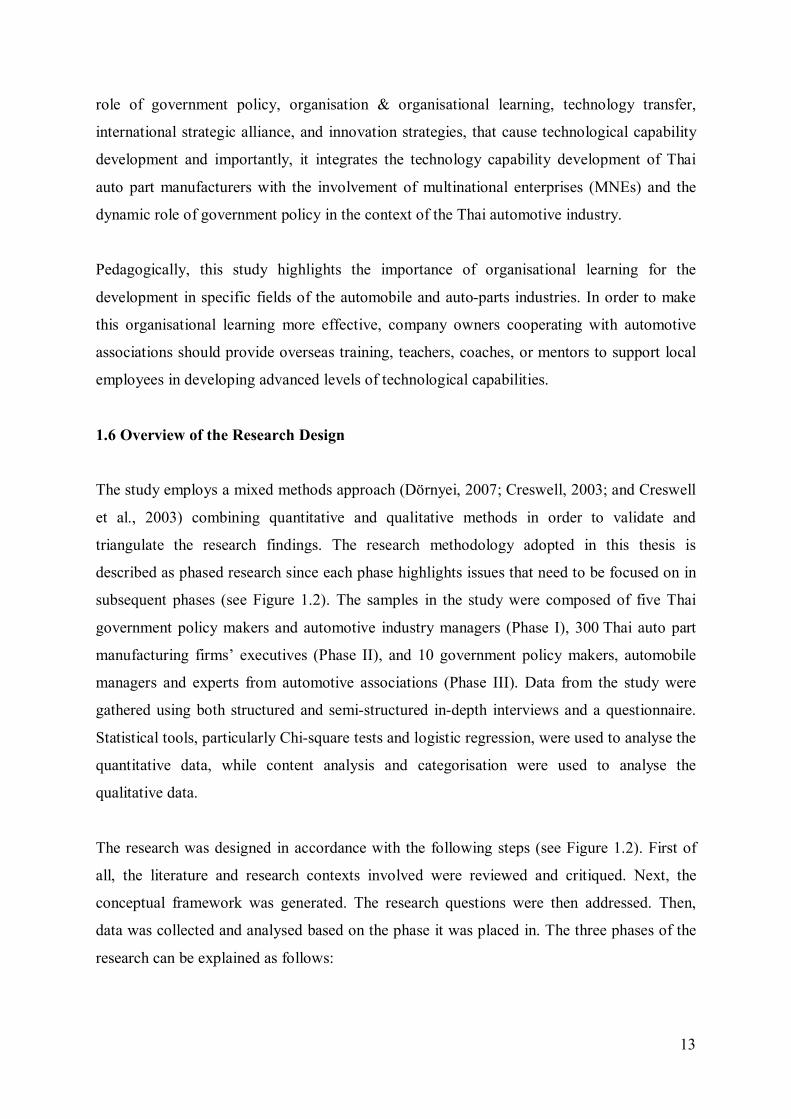
13
role of government policy, organisation & organisational learning, technology transfer,
international strategic alliance, and innovation strategies, that cause technological capability
development and importantly, it integrates the technology capability development of Thai
auto part manufacturers with the involvement of multinational enterprises (MNEs) and the
dynamic role of government policy in the context of the Thai automotive industry.
Pedagogically, this study highlights the importance of organisational learning for the
development in specific fields of the automobile and auto-parts industries. In order to make
this organisational learning more effective, company owners cooperating with automotive
associations should provide overseas training, teachers, coaches, or mentors to support local
employees in developing advanced levels of technological capabilities.
1.6 Overview of the Research Design
The study employs a mixed methods approach (Dörnyei, 2007; Creswell, 2003; and Creswell
et al., 2003) combining quantitative and qualitative methods in order to validate and
triangulate the research findings. The research methodology adopted in this thesis is
described as phased research since each phase highlights issues that need to be focused on in
subsequent phases (see Figure 1.2). The samples in the study were composed of five Thai
government policy makers and automotive industry managers (Phase I), 300 Thai auto part
manufacturing firms’ executives (Phase II), and 10 government policy makers, automobile
managers and experts from automotive associations (Phase III). Data from the study were
gathered using both structured and semi-structured in-depth interviews and a questionnaire.
Statistical tools, particularly Chi-square tests and logistic regression, were used to analyse the
quantitative data, while content analysis and categorisation were used to analyse the
qualitative data.
The research was designed in accordance with the following steps (see Figure 1.2). First of
all, the literature and research contexts involved were reviewed and critiqued. Next, the
conceptual framework was generated. The research questions were then addressed. Then,
data was collected and analysed based on the phase it was placed in. The three phases of the
research can be explained as follows:
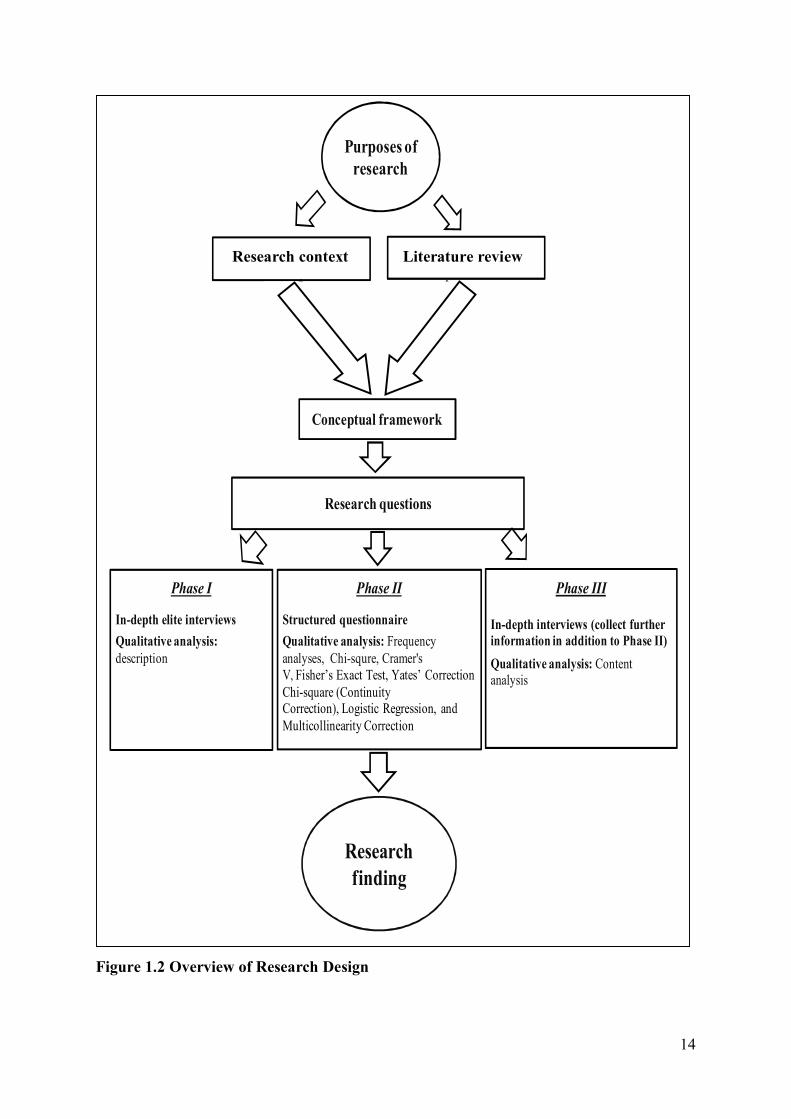
14
Figure 1.2 Overview of Research Design
Literature review I, II Research context I, II
Conceptual framework
Research questions
Phase I
In-depth elite interviewsQualitative analysis: description
Phase II
Structured questionnaireQualitative analysis: Frequency analyses, Chi-squre, Cramer's V, Fisher’s Exact Test, Yates’ Correction Chi-square (Continuity Correction), Logistic Regression, and Multicollinearity Correction
Phase III
In-depth interviews (collect further information in addition to Phase II)Qualitative analysis: Content analysis
Purposes of research
Research finding
Theoretical framework
Research context Literature review
15
Phase I included in-depth elite interviews with five Thai government policy makers and
automotive firm managers. The data collected from this phase were explored by qualitative
analysis in order to understand development in Thailand’s automotive industry and the role
that government policies play in this process.
In Phase II, a mail survey with a structured questionnaire was conducted with 300 Thai auto-
part manufacturing company managers (the response rate was 78%). This was aimed at
identifying important factors influencing the development of technological capabilities in the
Thai automotive industry. A range of quantitative analysis techniques (Frequency Analyses,
Chi-square, Cramer’s V, Fisher’s Exact Test, Yates’ Correction Chi-square (Continuity
Correction), Logistic Regression, and Multicollinearity Correction) were employed to analyse
the data gathered in this phase.
In Phase III, semi-structured face-to-face in-depth interviews were conducted with 10 leading
government policy makers, automotive firm managers and experts from automotive
associations to confirm the validity of significant factors from the Phase II Survey and further
identify important issues that could not be uncovered by previous phases. In addition, this
phase aimed to understand certain perceptual and attitudinal opinions of the respondents toward
the development of technological capabilities but within a qualitative research format. In this
phase the data was analysed, similarly to Phase I by using qualitative analysis methods, in order
to provide in-depth insights into issues and employ them in real business arenas.
After the three phrases of the research have been completed the research questions are
answered. It is hoped the knowledge gained can contribute to the development of technological
capabilities in the Thai automotive industry.
In the following section, the research findings from the three phases are discussed.
1.7 Principal Findings
This section presents the findings of three phases of study as the following.
16
1.7.1 Phase I: In-depth Interviews
The discussion concerning government policies in Chapter 2 and the expert opinions in Phase
I suggest that government incentives, regulations, and taxes affect the development of
technological capabilities in the Thai automotive industry. These policies are described below
and are utilised as inputs for Phase II.
The study in Phase I found three significant government incentives. The Board of Investment
(BOI) offers MNEs and local companies promotions in order to motivate them to install
updated production lines in Thailand. Thai employees can then learn through the experience
of these new technologies. R&D tax deduction has a direct impact on the development of the
technology capabilities of these companies. And the Thai Automotive Institute (TAI), for its
part introduces consulting programs for Thai suppliers who lack necessary technical skills.
Government regulations directly impact on the operations of companies in the Thai
automotive industry. Local Content Requirements (LCR), Completely Built-Up (CBU) and
Completely Knocked-Down (CKD) regulations have generated revenues for local suppliers
by impelling MNEs (carmakers) to use local auto parts. In addition, emission regulations that
force suppliers to improve their production techniques have already been implemented as
international standards. Government taxes including Excise taxes, Custom taxes and Value
Added Tax (VAT) also encourage carmakers to use local parts in their assembling processes.
The growth of the Pick-up industry in particular has resulted from the Excise tax mechanism.
The more parts these suppliers produce, the more technological skills they have.
1.7.2 Phase II: Factors Affecting the Technological Capability Development of Local
Thai Auto Parts Firms
After all 18 factors in the conceptual framework in Figure 1.1 were tested by the Chi-Square
Test and logistic regression techniques, some factors were rejected. As a result, only 10
factors remained as shown in the list below (presented as the factors related to the five key
concepts and put in order). Also, they were presented as elements of the empirical conceptual
framework in Figure 9.1 in Chapter 9. Their validity was confirmed by experts in Chapter 8,
and their findings discussed in Chapter 9.
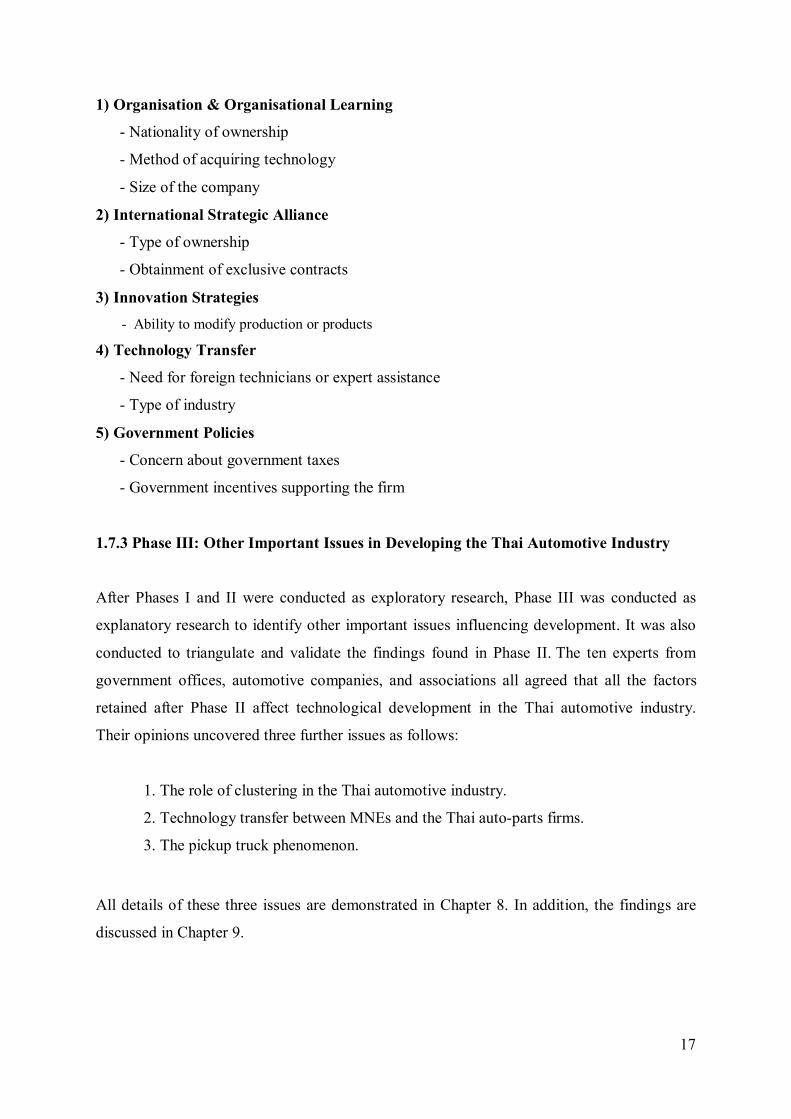
17
1) Organisation & Organisational Learning
- Nationality of ownership
- Method of acquiring technology
- Size of the company
2) International Strategic Alliance
- Type of ownership
- Obtainment of exclusive contracts
3) Innovation Strategies - Ability to modify production or products 4) Technology Transfer
- Need for foreign technicians or expert assistance
- Type of industry 5) Government Policies
- Concern about government taxes
- Government incentives supporting the firm
1.7.3 Phase III: Other Important Issues in Developing the Thai Automotive Industry
After Phases I and II were conducted as exploratory research, Phase III was conducted as
explanatory research to identify other important issues influencing development. It was also
conducted to triangulate and validate the findings found in Phase II. The ten experts from
government offices, automotive companies, and associations all agreed that all the factors
retained after Phase II affect technological development in the Thai automotive industry.
Their opinions uncovered three further issues as follows:
1. The role of clustering in the Thai automotive industry.
2. Technology transfer between MNEs and the Thai auto-parts firms.
3. The pickup truck phenomenon.
All details of these three issues are demonstrated in Chapter 8. In addition, the findings are
discussed in Chapter 9.
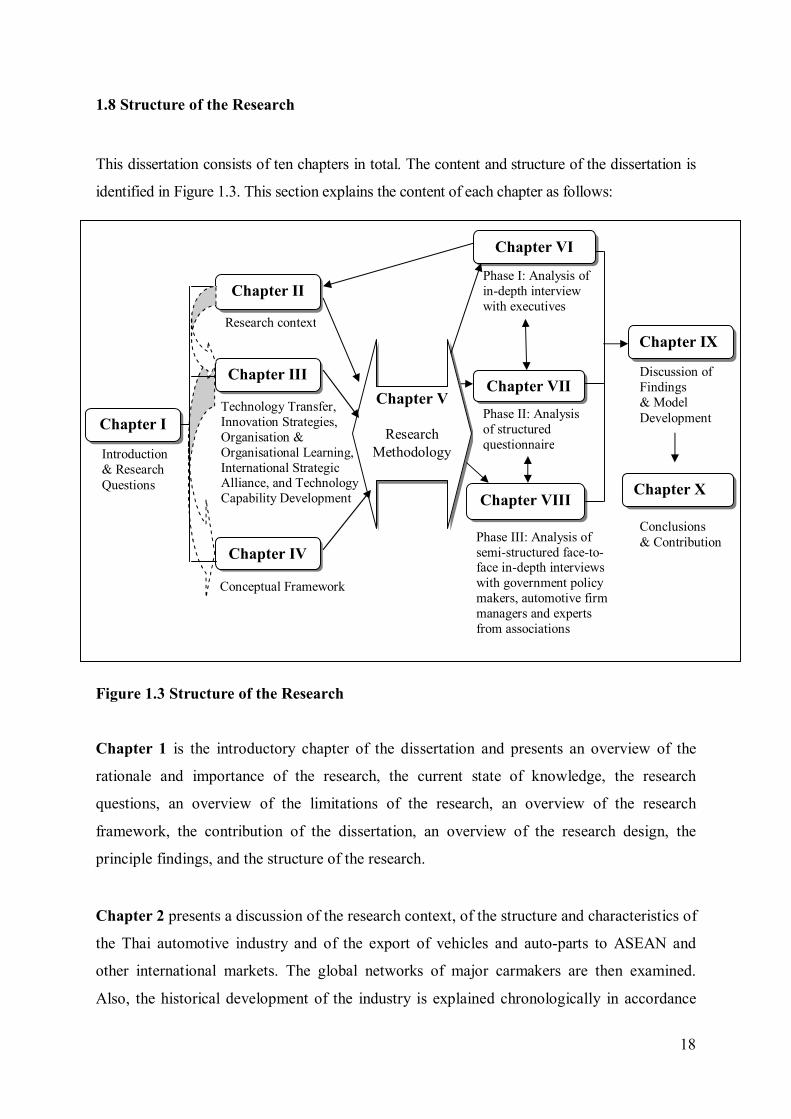
18
1.8 Structure of the Research
This dissertation consists of ten chapters in total. The content and structure of the dissertation is
identified in Figure 1.3. This section explains the content of each chapter as follows:
Figure 1.3 Structure of the Research
Chapter 1 is the introductory chapter of the dissertation and presents an overview of the
rationale and importance of the research, the current state of knowledge, the research
questions, an overview of the limitations of the research, an overview of the research
framework, the contribution of the dissertation, an overview of the research design, the
principle findings, and the structure of the research.
Chapter 2 presents a discussion of the research context, of the structure and characteristics of
the Thai automotive industry and of the export of vehicles and auto-parts to ASEAN and
other international markets. The global networks of major carmakers are then examined.
Also, the historical development of the industry is explained chronologically in accordance
Introduction & Research Questions
Chapter I
Research context
Chapter III
Conceptual Framework
Chapter IV
Chapter II
Chapter V
Research Methodology
Phase I: Analysis of in-depth interview with executives
Chapter VI
Phase II: Analysis of structured questionnaire
Chapter VII
Phase III: Analysis of semi-structured face-to-face in-depth interviews with government policy makers, automotive firm managers and experts from associations
Chapter VIII
Discussion of Findings & Model Development
Chapter IX
Chapter X
Conclusions & Contribution
Technology Transfer, Innovation Strategies, Organisation & Organisational Learning, International Strategic Alliance, and Technology Capability Development
19
with an evaluation of the salient role of Thai government policy and the private sector from
1960-2009. The impact on Thai government policies both of attending ASEAN and of
signing international trade agreements is also discussed.
Chapter 3 includes a critical review of the literature on technology capability development
with its progressive levels. The concept of R&D and its role are presented. In addition, the
technological capability matrix and other research findings are used to support the evidence
for R&D as a sole indicator of technology capability development. Also, the four key
concepts of technology transfer, innovation strategies, organisation & organisational learning,
and international strategic alliance, with their related factors are discussed. Lastly, support,
from external research in various fields, for the rationale concerning the causal relationship
between technology capability development and the four key concepts, is presented.
Chapter 4 presents the conceptual framework’s development and implementation. The
rationales for the inclusion of the key concepts in the conceptual framework (organisation &
organisational learning, international strategic alliance, innovation strategies, technology
transfer, and technology capability development) are presented and the use of Phase I to fill
the gap in the literature review is discussed.
Chapter 5 provides the research methodology, and the following topics are presented:
Overview and research objectives of Phase I (In depth elite interviews), Phase II (Mail
survey), and Phase III (Semi-structured in-depth interview). The data collection method,
survey instruments, sampling processes, and data analysis for each phase are discussed. To
control the quality of the data collection, the development of the questionnaire and validation
processes with the IOC index are demonstrated. Statistical tools (used in Chapter 7), the
rationale and strengths & weaknesses for the qualitative and quantitative research methods
and the rationale for employing the mixed research methods are presented.
Chapter 6 presents the qualitative data analysis of the in-depth elite interviews (Phase I)
conducted with five executives from government departments and automotive companies.
The main objective of this chapter is to provide primary data about the development of the
Thai automotive industry. The development process and the role that government policies
20
play in this process are revealed. Management perceptions towards the technology capability
development of the Thai automotive industry are also explored.
Chapter 7 presents the Phase II Survey which includes the quantitative data analysis of the
300 structured questionnaires returned from Thai auto-part companies. Various statistical
tools, particularly Chi-square tests and Logistic Regression, are employed to test all the
factors in the conceptual framework. This chapter also explains the results of the statistical
analysis and the significant factors affecting the development of the technological capability
of the Thai automotive industry.
Chapter 8 involves Phase III of the study and includes a qualitative data analysis of the semi-
structured in-depth interviews with 10 leading government policy makers and leading
automotive experts. These interviewees give explanations of the significant factors discovered
in the Phase II Survey and share opinions about other issues that affect the development of
technological capabilities in the Thai automotive industry.
Chapter 9 provides a discussion of the key findings, as revealed from Phase I, II, and III of
the research. The answers for two research questions are demonstrated. The logistic
regression models for each key concept are presented and discussed. In addition, the
empirical conceptual framework is developed and used as a “Model of Technological
Capability Development for the Automotive Part Industry in Thailand.”
Chapter 10 presents the conclusion, contributions and implications of the dissertation. This
chapter also evaluates the findings of the research questions. In addition, the topics of the
generalisability of the research findings, the limitations of the research, and the implications
for future research are presented.
21
Chapter 2
Research Context: Overview and Development of the Thai Automotive
Industry
2.1 Introduction
Thailand’s automotive industry has been continuingly growing since 1960. During that time,
it has passed through several transformative steps. Firstly, geographically, the global
automotive market has been driven significantly by massive demand from emerging markets
and is expected to grow further based on promising markets such as China, India, and
ASEAN (Deloitte Touche Tohmatsu, 2009). Secondly, in terms of the structure of the
industry, the linkage between assemblers and suppliers has been developed and restructured
internationally based on the concepts of centralisation and decentralisation (Brown, 2004).
Thirdly, since 1991, liberalisation has greatly freed up the flow of capital into Thailand as the
Thai government in cooperation with the Thai private sector started a process of deregulating
the sector, which had formerly been closely protected, allowing for its integration into the
wider regional and global market (Tanaphat, 2002). Fourthly, financial assistance was
extended by major assemblers to their subsidiaries, as well as to their part makers in
Thailand, in order to keep them operational during the financial crisis of the late nineties
(Yasamutr, 2000).
Thailand, as a key global vehicle production base, is well placed to take advantage of this
growing automobile market but Thai professionals in both the public and private sectors are
aware that to do so the Thai automotive industry must continue to meet the technological
challenges facing the manufacturing sector. It is not only firms in general industries, but
large industries such as the Thai automotive industry, that government policy should focus
on. In order to investigate how this can be done, the role the Thai government in the
development of the automotive industry as well as that of the private sector need to be
examined.
One of the factors militating against development in the private sector has been the
comparative lack of cohesion there. Policy lobbying has formed too great a part of
22
associational activity at the expense of the promotion of collective goods aimed at improving
efficiency. The latter activities are more likely to occur where local firms face high
competitive pressure and where politicians see the fate of the industry as being strategically
important. In other words, public sector support is generally necessary for such collective
action on the part of the private sector (Doner & Schneider, 2000). As both government
policy and the private sector have affected Thailand’s development and particularly that of its
automotive industry. Such influences are further examined in this chapter.
In order to facilitate such an examination, and to help answer the first research question:
“What government policies were used to develop the technological capability of the Thai
automotive industry from 1960-2009?” the historical development of the Thai automotive
industry is explained chronologically below.
The information in this chapter aims primarily at providing a comprehensive overview of the
research context. Some of this information is repeated in Chapter 6 to triangulate the results
and support the findings of the in-depth interviews. During the Phase I fieldwork, official
documents and leaflets/unpublished papers were gathered from the interviewees and
synthesised (see Chapter 6). Full details of the Phase I findings and discussions are presented
in Chapter 6.
To begin with, Section 2.2 provides an overview of the Thai automotive industry which aims
at fostering an understanding of its current state. This section also reviews important issues
such as production capacity, domestic sales, exports, and production networks in the Thai
automotive industry. Then, Section 2.3 focuses on the role of government policies in the
development of the industry. The six phases are described in Sections 2.3.1 to 2.3.6 and
evidence from the Phase I field work is used to substantiate the research context. In Section
2.4, the perception of government policies by the private sector is reviewed and the part the
private sector has played in Thai automotive industry development is divided into six parallel
phases, presented in Sections 2.4.1 to 2.4.6. Next, Section 2.5 gives a summary of the Tariffs
and Taxes on Vehicles in Thailand up until 2008. Lastly, Section 2.6 summarises the research
context of the chapter.
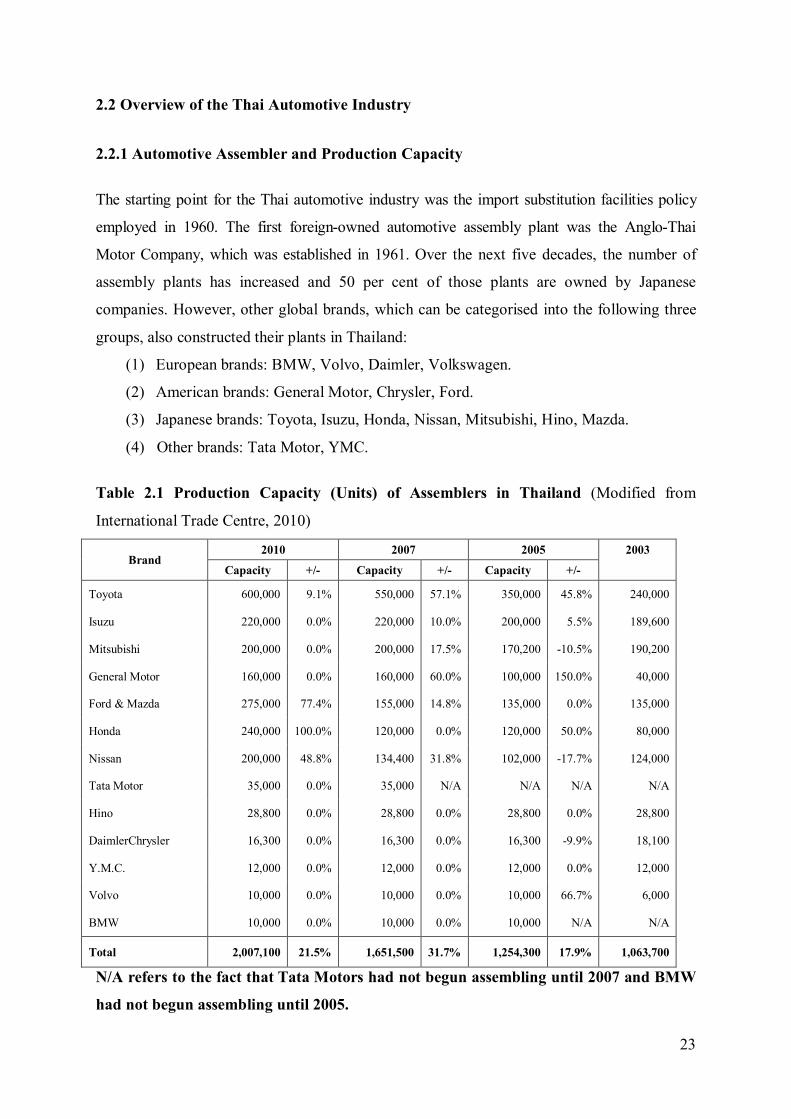
23
2.2 Overview of the Thai Automotive Industry
2.2.1 Automotive Assembler and Production Capacity
The starting point for the Thai automotive industry was the import substitution facilities policy
employed in 1960. The first foreign-owned automotive assembly plant was the Anglo-Thai
Motor Company, which was established in 1961. Over the next five decades, the number of
assembly plants has increased and 50 per cent of those plants are owned by Japanese
companies. However, other global brands, which can be categorised into the following three
groups, also constructed their plants in Thailand:
(1) European brands: BMW, Volvo, Daimler, Volkswagen.
(2) American brands: General Motor, Chrysler, Ford.
(3) Japanese brands: Toyota, Isuzu, Honda, Nissan, Mitsubishi, Hino, Mazda.
(4) Other brands: Tata Motor, YMC.
Table 2.1 Production Capacity (Units) of Assemblers in Thailand (Modified from
International Trade Centre, 2010)
Brand 2010 2007 2005 2003
Capacity +/- Capacity +/- Capacity +/-
Toyota 600,000 9.1% 550,000 57.1% 350,000 45.8% 240,000
Isuzu 220,000 0.0% 220,000 10.0% 200,000 5.5% 189,600
Mitsubishi 200,000 0.0% 200,000 17.5% 170,200 -10.5% 190,200
General Motor 160,000 0.0% 160,000 60.0% 100,000 150.0% 40,000
Ford & Mazda 275,000 77.4% 155,000 14.8% 135,000 0.0% 135,000
Honda 240,000 100.0% 120,000 0.0% 120,000 50.0% 80,000
Nissan 200,000 48.8% 134,400 31.8% 102,000 -17.7% 124,000
Tata Motor 35,000 0.0% 35,000 N/A N/A N/A N/A
Hino 28,800 0.0% 28,800 0.0% 28,800 0.0% 28,800
DaimlerChrysler 16,300 0.0% 16,300 0.0% 16,300 -9.9% 18,100
Y.M.C. 12,000 0.0% 12,000 0.0% 12,000 0.0% 12,000
Volvo 10,000 0.0% 10,000 0.0% 10,000 66.7% 6,000
BMW 10,000 0.0% 10,000 0.0% 10,000 N/A N/A
Total 2,007,100 21.5% 1,651,500 31.7% 1,254,300 17.9% 1,063,700
N/A refers to the fact that Tata Motors had not begun assembling until 2007 and BMW
had not begun assembling until 2005.
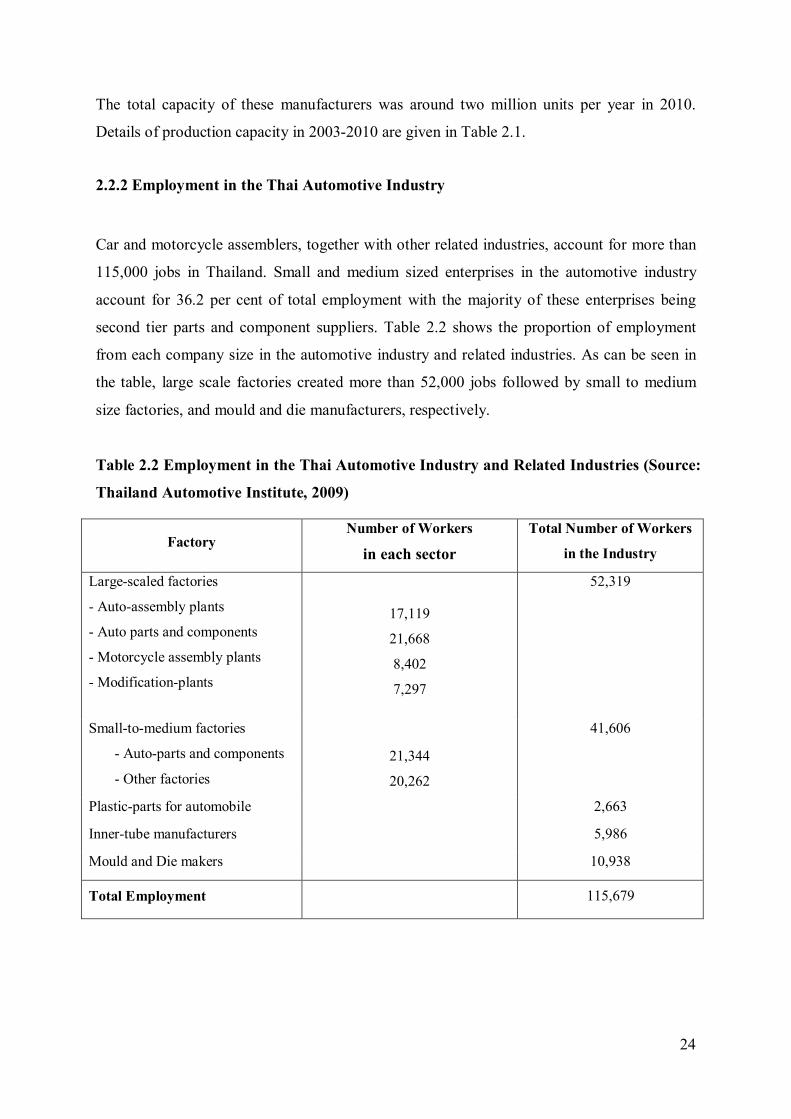
24
The total capacity of these manufacturers was around two million units per year in 2010.
Details of production capacity in 2003-2010 are given in Table 2.1.
2.2.2 Employment in the Thai Automotive Industry
Car and motorcycle assemblers, together with other related industries, account for more than
115,000 jobs in Thailand. Small and medium sized enterprises in the automotive industry
account for 36.2 per cent of total employment with the majority of these enterprises being
second tier parts and component suppliers. Table 2.2 shows the proportion of employment
from each company size in the automotive industry and related industries. As can be seen in
the table, large scale factories created more than 52,000 jobs followed by small to medium
size factories, and mould and die manufacturers, respectively.
Table 2.2 Employment in the Thai Automotive Industry and Related Industries (Source:
Thailand Automotive Institute, 2009)
Factory Number of Workers
in each sector Total Number of Workers
in the Industry
Large-scaled factories - Auto-assembly plants - Auto parts and components
- Motorcycle assembly plants - Modification-plants
17,119 21,668 8,402 7,297
52,319
Small-to-medium factories - Auto-parts and components - Other factories
21,344 20,262
41,606
Plastic-parts for automobile 2,663
Inner-tube manufacturers 5,986
Mould and Die makers 10,938
Total Employment 115,679
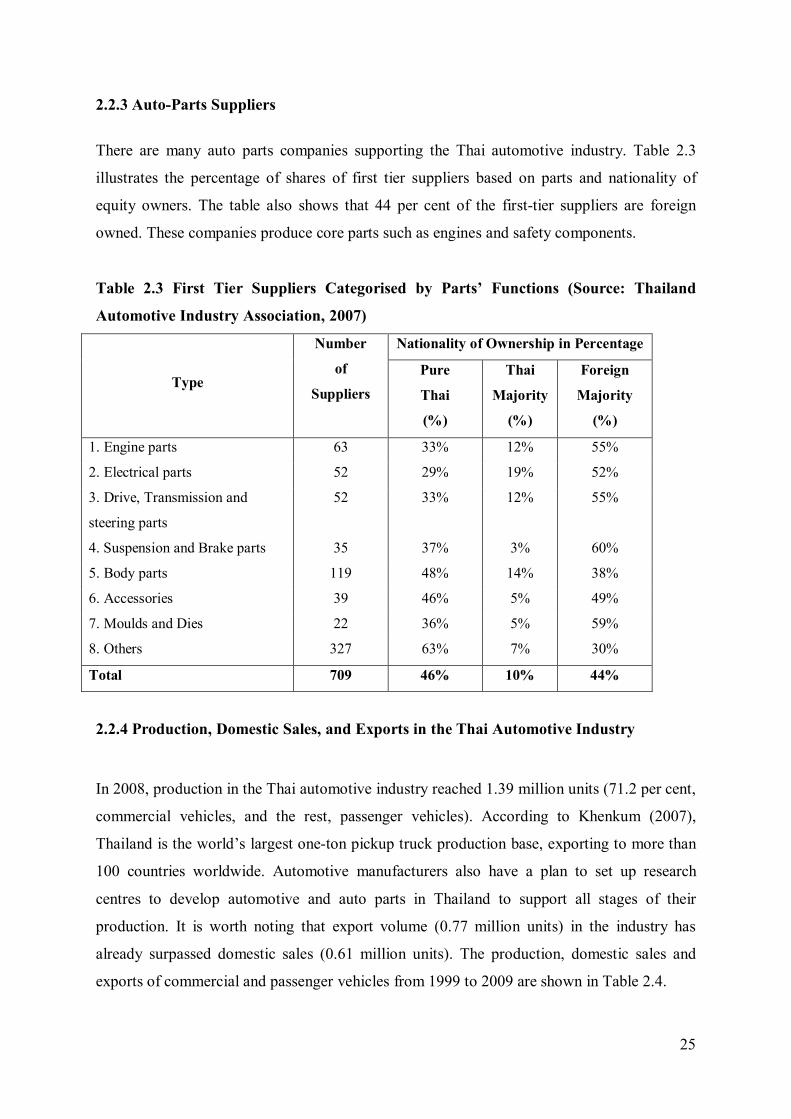
25
2.2.3 Auto-Parts Suppliers
There are many auto parts companies supporting the Thai automotive industry. Table 2.3
illustrates the percentage of shares of first tier suppliers based on parts and nationality of
equity owners. The table also shows that 44 per cent of the first-tier suppliers are foreign
owned. These companies produce core parts such as engines and safety components.
Table 2.3 First Tier Suppliers Categorised by Parts’ Functions (Source: Thailand
Automotive Industry Association, 2007)
Type
Number of
Suppliers
Nationality of Ownership in Percentage
Pure Thai (%)
Thai
Majority
(%)
Foreign
Majority
(%)
1. Engine parts 63 33% 12% 55% 2. Electrical parts 52 29% 19% 52% 3. Drive, Transmission and
steering parts 52 33% 12% 55%
4. Suspension and Brake parts 35 37% 3% 60% 5. Body parts 119 48% 14% 38% 6. Accessories 39 46% 5% 49% 7. Moulds and Dies 22 36% 5% 59% 8. Others 327 63% 7% 30%
Total 709 46% 10% 44%
2.2.4 Production, Domestic Sales, and Exports in the Thai Automotive Industry
In 2008, production in the Thai automotive industry reached 1.39 million units (71.2 per cent,
commercial vehicles, and the rest, passenger vehicles). According to Khenkum (2007),
Thailand is the world’s largest one-ton pickup truck production base, exporting to more than
100 countries worldwide. Automotive manufacturers also have a plan to set up research
centres to develop automotive and auto parts in Thailand to support all stages of their
production. It is worth noting that export volume (0.77 million units) in the industry has
already surpassed domestic sales (0.61 million units). The production, domestic sales and
exports of commercial and passenger vehicles from 1999 to 2009 are shown in Table 2.4.
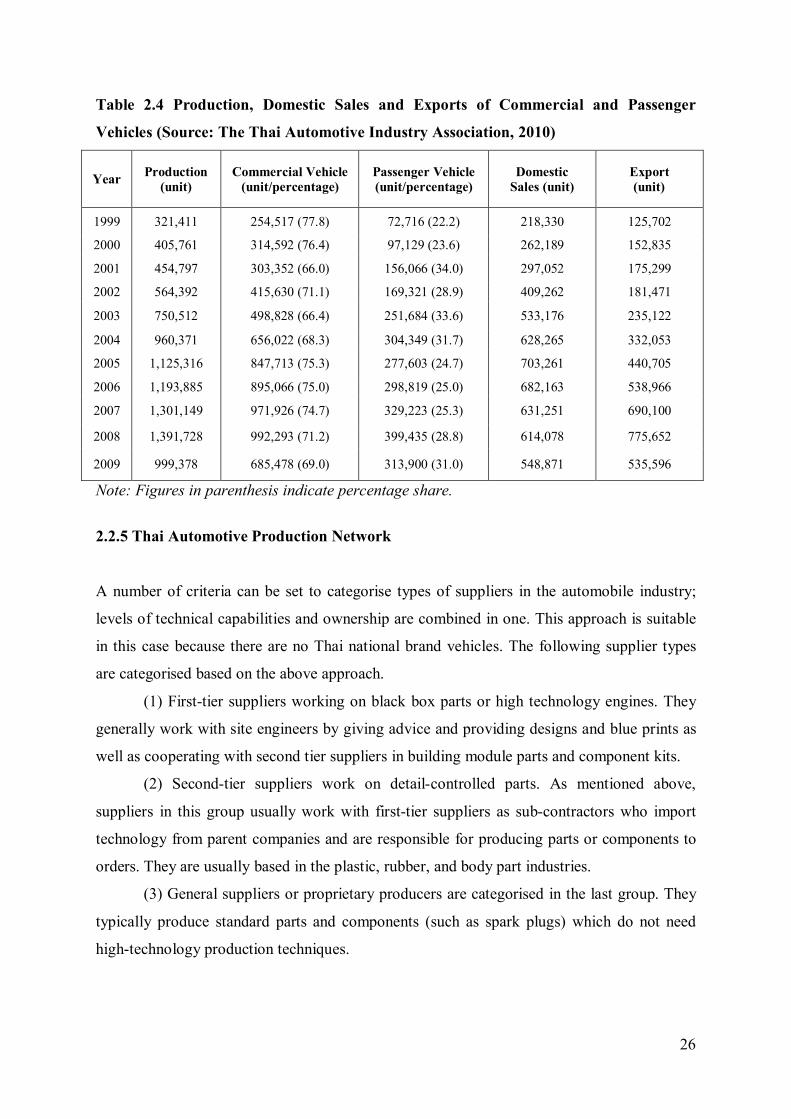
26
Table 2.4 Production, Domestic Sales and Exports of Commercial and Passenger
Vehicles (Source: The Thai Automotive Industry Association, 2010)
Year Production (unit)
Commercial Vehicle (unit/percentage)
Passenger Vehicle (unit/percentage)
Domestic Sales (unit)
Export (unit)
1999 321,411 254,517 (77.8) 72,716 (22.2) 218,330 125,702
2000 405,761 314,592 (76.4) 97,129 (23.6) 262,189 152,835
2001 454,797 303,352 (66.0) 156,066 (34.0) 297,052 175,299
2002 564,392 415,630 (71.1) 169,321 (28.9) 409,262 181,471
2003 750,512 498,828 (66.4) 251,684 (33.6) 533,176 235,122
2004 960,371 656,022 (68.3) 304,349 (31.7) 628,265 332,053
2005 1,125,316 847,713 (75.3) 277,603 (24.7) 703,261 440,705
2006 1,193,885 895,066 (75.0) 298,819 (25.0) 682,163 538,966
2007 1,301,149 971,926 (74.7) 329,223 (25.3) 631,251 690,100
2008 1,391,728 992,293 (71.2) 399,435 (28.8) 614,078 775,652
2009 999,378 685,478 (69.0) 313,900 (31.0) 548,871 535,596
Note: Figures in parenthesis indicate percentage share.
2.2.5 Thai Automotive Production Network
A number of criteria can be set to categorise types of suppliers in the automobile industry;
levels of technical capabilities and ownership are combined in one. This approach is suitable
in this case because there are no Thai national brand vehicles. The following supplier types
are categorised based on the above approach.
(1) First-tier suppliers working on black box parts or high technology engines. They
generally work with site engineers by giving advice and providing designs and blue prints as
well as cooperating with second tier suppliers in building module parts and component kits.
(2) Second-tier suppliers work on detail-controlled parts. As mentioned above,
suppliers in this group usually work with first-tier suppliers as sub-contractors who import
technology from parent companies and are responsible for producing parts or components to
orders. They are usually based in the plastic, rubber, and body part industries.
(3) General suppliers or proprietary producers are categorised in the last group. They
typically produce standard parts and components (such as spark plugs) which do not need
high-technology production techniques.
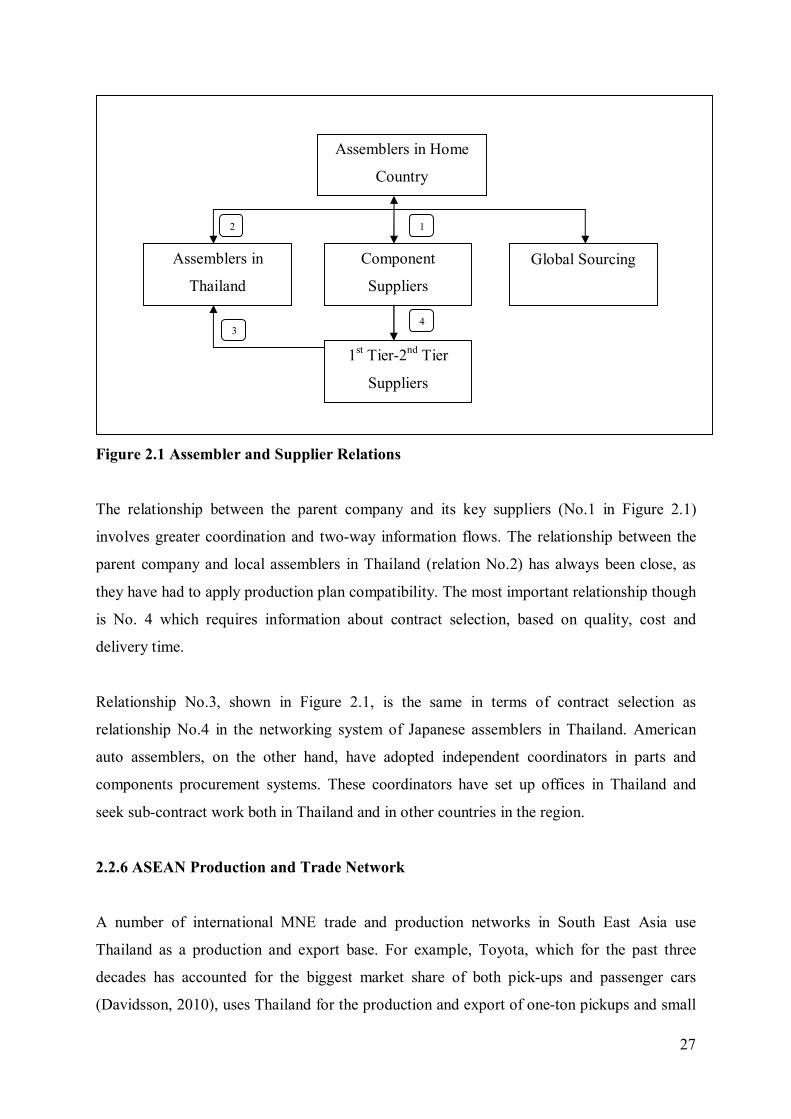
27
Figure 2.1 Assembler and Supplier Relations
The relationship between the parent company and its key suppliers (No.1 in Figure 2.1)
involves greater coordination and two-way information flows. The relationship between the
parent company and local assemblers in Thailand (relation No.2) has always been close, as
they have had to apply production plan compatibility. The most important relationship though
is No. 4 which requires information about contract selection, based on quality, cost and
delivery time.
Relationship No.3, shown in Figure 2.1, is the same in terms of contract selection as
relationship No.4 in the networking system of Japanese assemblers in Thailand. American
auto assemblers, on the other hand, have adopted independent coordinators in parts and
components procurement systems. These coordinators have set up offices in Thailand and
seek sub-contract work both in Thailand and in other countries in the region.
2.2.6 ASEAN Production and Trade Network
A number of international MNE trade and production networks in South East Asia use
Thailand as a production and export base. For example, Toyota, which for the past three
decades has accounted for the biggest market share of both pick-ups and passenger cars
(Davidsson, 2010), uses Thailand for the production and export of one-ton pickups and small
Assemblers in Home
Country
Assemblers in
Thailand
Component
Suppliers
Global Sourcing
1st Tier-2nd Tier
Suppliers
1
4 3
2
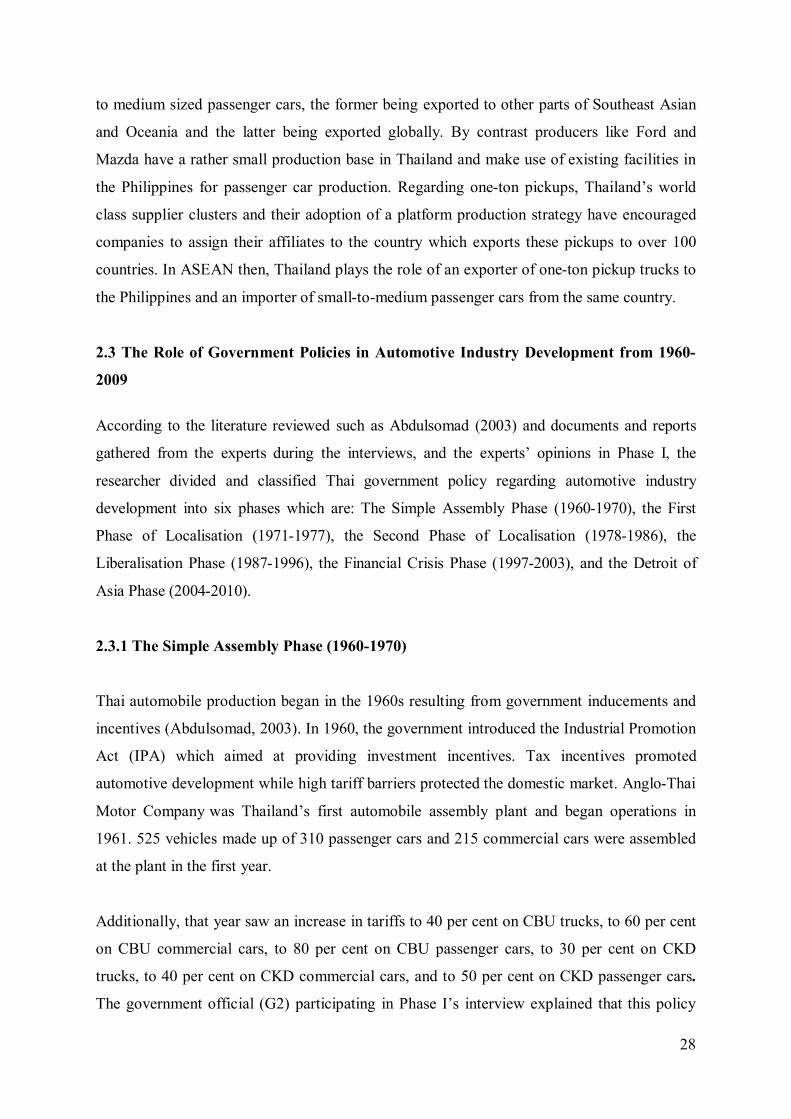
28
to medium sized passenger cars, the former being exported to other parts of Southeast Asian
and Oceania and the latter being exported globally. By contrast producers like Ford and
Mazda have a rather small production base in Thailand and make use of existing facilities in
the Philippines for passenger car production. Regarding one-ton pickups, Thailand’s world
class supplier clusters and their adoption of a platform production strategy have encouraged
companies to assign their affiliates to the country which exports these pickups to over 100
countries. In ASEAN then, Thailand plays the role of an exporter of one-ton pickup trucks to
the Philippines and an importer of small-to-medium passenger cars from the same country.
2.3 The Role of Government Policies in Automotive Industry Development from 1960-
2009
According to the literature reviewed such as Abdulsomad (2003) and documents and reports
gathered from the experts during the interviews, and the experts’ opinions in Phase I, the
researcher divided and classified Thai government policy regarding automotive industry
development into six phases which are: The Simple Assembly Phase (1960-1970), the First
Phase of Localisation (1971-1977), the Second Phase of Localisation (1978-1986), the
Liberalisation Phase (1987-1996), the Financial Crisis Phase (1997-2003), and the Detroit of
Asia Phase (2004-2010).
2.3.1 The Simple Assembly Phase (1960-1970)
Thai automobile production began in the 1960s resulting from government inducements and
incentives (Abdulsomad, 2003). In 1960, the government introduced the Industrial Promotion
Act (IPA) which aimed at providing investment incentives. Tax incentives promoted
automotive development while high tariff barriers protected the domestic market. Anglo-Thai
Motor Company was Thailand’s first automobile assembly plant and began operations in
1961. 525 vehicles made up of 310 passenger cars and 215 commercial cars were assembled
at the plant in the first year.
Additionally, that year saw an increase in tariffs to 40 per cent on CBU trucks, to 60 per cent
on CBU commercial cars, to 80 per cent on CBU passenger cars, to 30 per cent on CKD
trucks, to 40 per cent on CKD commercial cars, and to 50 per cent on CKD passenger cars.
The government official (G2) participating in Phase I’s interview explained that this policy
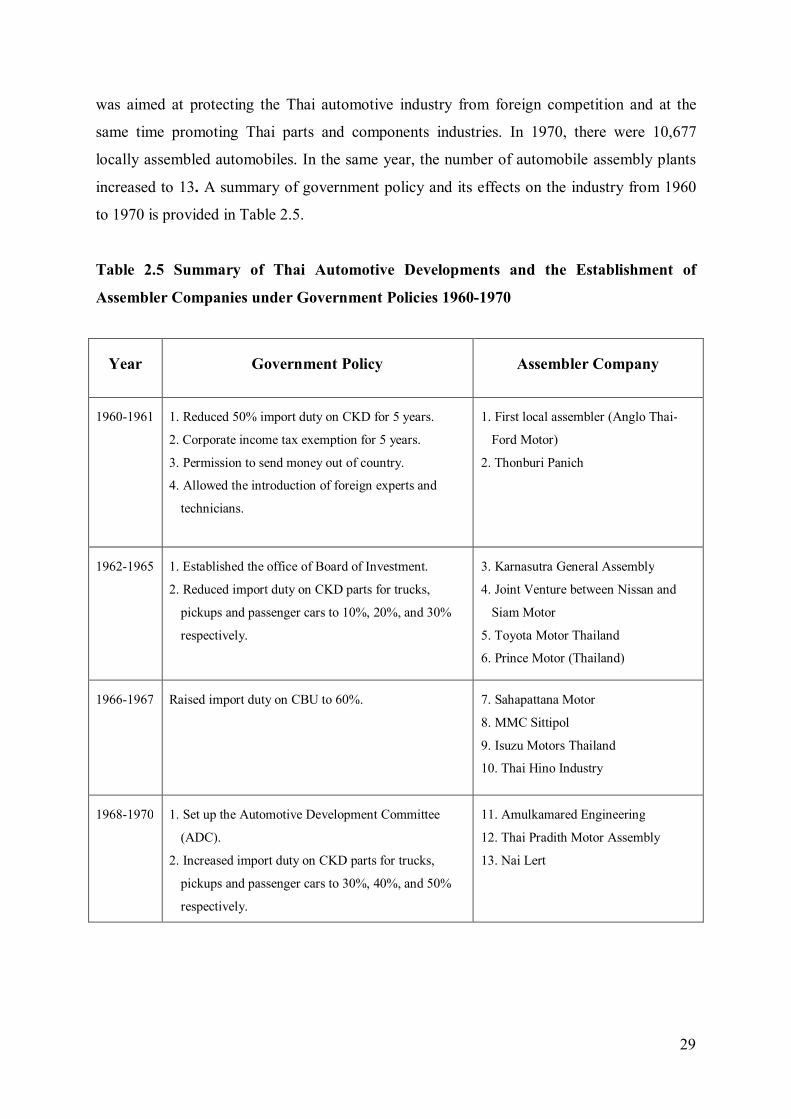
29
was aimed at protecting the Thai automotive industry from foreign competition and at the
same time promoting Thai parts and components industries. In 1970, there were 10,677
locally assembled automobiles. In the same year, the number of automobile assembly plants
increased to 13. A summary of government policy and its effects on the industry from 1960
to 1970 is provided in Table 2.5.
Table 2.5 Summary of Thai Automotive Developments and the Establishment of
Assembler Companies under Government Policies 1960-1970
Year Government Policy Assembler Company
1960-1961 1. Reduced 50% import duty on CKD for 5 years.
2. Corporate income tax exemption for 5 years.
3. Permission to send money out of country.
4. Allowed the introduction of foreign experts and
technicians.
1. First local assembler (Anglo Thai-
Ford Motor)
2. Thonburi Panich
1962-1965 1. Established the office of Board of Investment.
2. Reduced import duty on CKD parts for trucks,
pickups and passenger cars to 10%, 20%, and 30%
respectively.
3. Karnasutra General Assembly
4. Joint Venture between Nissan and
Siam Motor
5. Toyota Motor Thailand
6. Prince Motor (Thailand)
1966-1967 Raised import duty on CBU to 60%. 7. Sahapattana Motor
8. MMC Sittipol
9. Isuzu Motors Thailand
10. Thai Hino Industry
1968-1970 1. Set up the Automotive Development Committee
(ADC).
2. Increased import duty on CKD parts for trucks,
pickups and passenger cars to 30%, 40%, and 50%
respectively.
11. Amulkamared Engineering
12. Thai Pradith Motor Assembly
13. Nai Lert
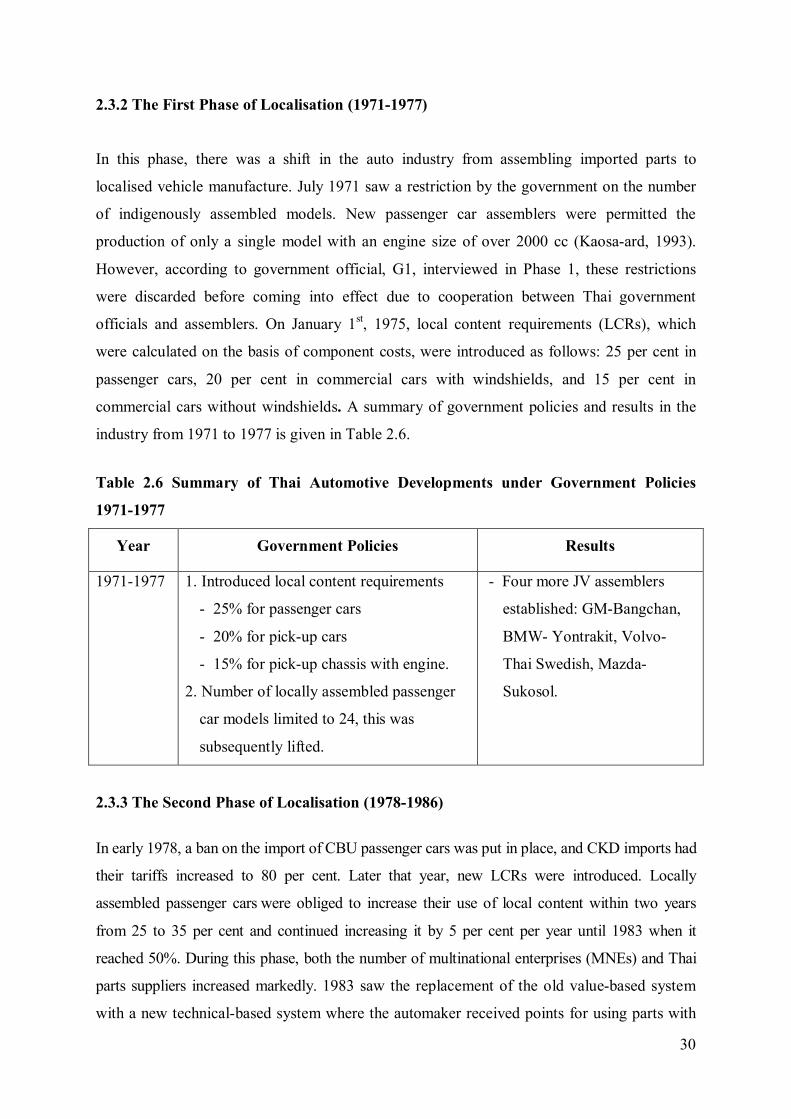
30
2.3.2 The First Phase of Localisation (1971-1977)
In this phase, there was a shift in the auto industry from assembling imported parts to
localised vehicle manufacture. July 1971 saw a restriction by the government on the number
of indigenously assembled models. New passenger car assemblers were permitted the
production of only a single model with an engine size of over 2000 cc (Kaosa-ard, 1993).
However, according to government official, G1, interviewed in Phase 1, these restrictions
were discarded before coming into effect due to cooperation between Thai government
officials and assemblers. On January 1st, 1975, local content requirements (LCRs), which
were calculated on the basis of component costs, were introduced as follows: 25 per cent in
passenger cars, 20 per cent in commercial cars with windshields, and 15 per cent in
commercial cars without windshields. A summary of government policies and results in the
industry from 1971 to 1977 is given in Table 2.6.
Table 2.6 Summary of Thai Automotive Developments under Government Policies
1971-1977
Year Government Policies Results
1971-1977 1. Introduced local content requirements
- 25% for passenger cars
- 20% for pick-up cars
- 15% for pick-up chassis with engine.
2. Number of locally assembled passenger
car models limited to 24, this was
subsequently lifted.
- Four more JV assemblers
established: GM-Bangchan,
BMW- Yontrakit, Volvo-
Thai Swedish, Mazda-
Sukosol.
2.3.3 The Second Phase of Localisation (1978-1986)
In early 1978, a ban on the import of CBU passenger cars was put in place, and CKD imports had
their tariffs increased to 80 per cent. Later that year, new LCRs were introduced. Locally
assembled passenger cars were obliged to increase their use of local content within two years
from 25 to 35 per cent and continued increasing it by 5 per cent per year until 1983 when it
reached 50%. During this phase, both the number of multinational enterprises (MNEs) and Thai
parts suppliers increased markedly. 1983 saw the replacement of the old value-based system
with a new technical-based system where the automaker received points for using parts with
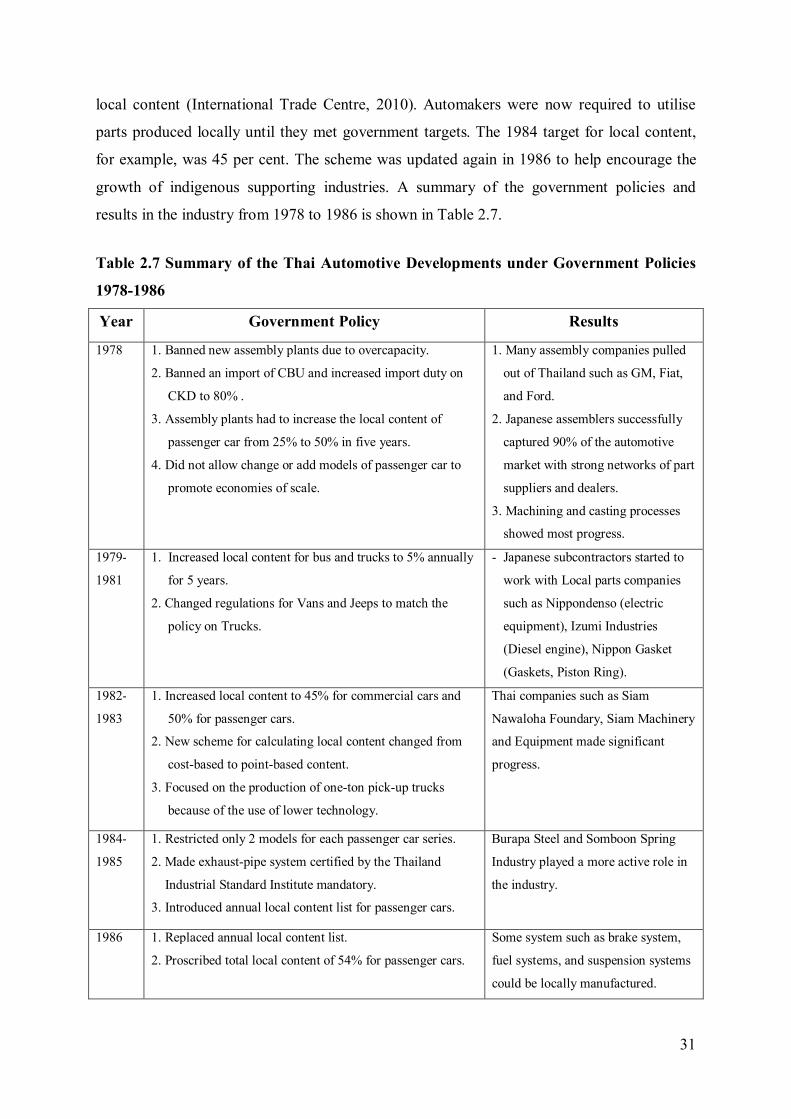
31
local content (International Trade Centre, 2010). Automakers were now required to utilise
parts produced locally until they met government targets. The 1984 target for local content,
for example, was 45 per cent. The scheme was updated again in 1986 to help encourage the
growth of indigenous supporting industries. A summary of the government policies and
results in the industry from 1978 to 1986 is shown in Table 2.7.
Table 2.7 Summary of the Thai Automotive Developments under Government Policies
1978-1986
Year Government Policy Results
1978 1. Banned new assembly plants due to overcapacity.
2. Banned an import of CBU and increased import duty on
CKD to 80% .
3. Assembly plants had to increase the local content of
passenger car from 25% to 50% in five years.
4. Did not allow change or add models of passenger car to
promote economies of scale.
1. Many assembly companies pulled
out of Thailand such as GM, Fiat,
and Ford.
2. Japanese assemblers successfully
captured 90% of the automotive
market with strong networks of part
suppliers and dealers.
3. Machining and casting processes
showed most progress.
1979-
1981
1. Increased local content for bus and trucks to 5% annually
for 5 years.
2. Changed regulations for Vans and Jeeps to match the
policy on Trucks.
- Japanese subcontractors started to
work with Local parts companies
such as Nippondenso (electric
equipment), Izumi Industries
(Diesel engine), Nippon Gasket
(Gaskets, Piston Ring).
1982-
1983
1. Increased local content to 45% for commercial cars and
50% for passenger cars.
2. New scheme for calculating local content changed from
cost-based to point-based content.
3. Focused on the production of one-ton pick-up trucks
because of the use of lower technology.
Thai companies such as Siam
Nawaloha Foundary, Siam Machinery
and Equipment made significant
progress.
1984-
1985
1. Restricted only 2 models for each passenger car series.
2. Made exhaust-pipe system certified by the Thailand
Industrial Standard Institute mandatory.
3. Introduced annual local content list for passenger cars.
Burapa Steel and Somboon Spring
Industry played a more active role in
the industry.
1986 1. Replaced annual local content list.
2. Proscribed total local content of 54% for passenger cars.
Some system such as brake system,
fuel systems, and suspension systems
could be locally manufactured.
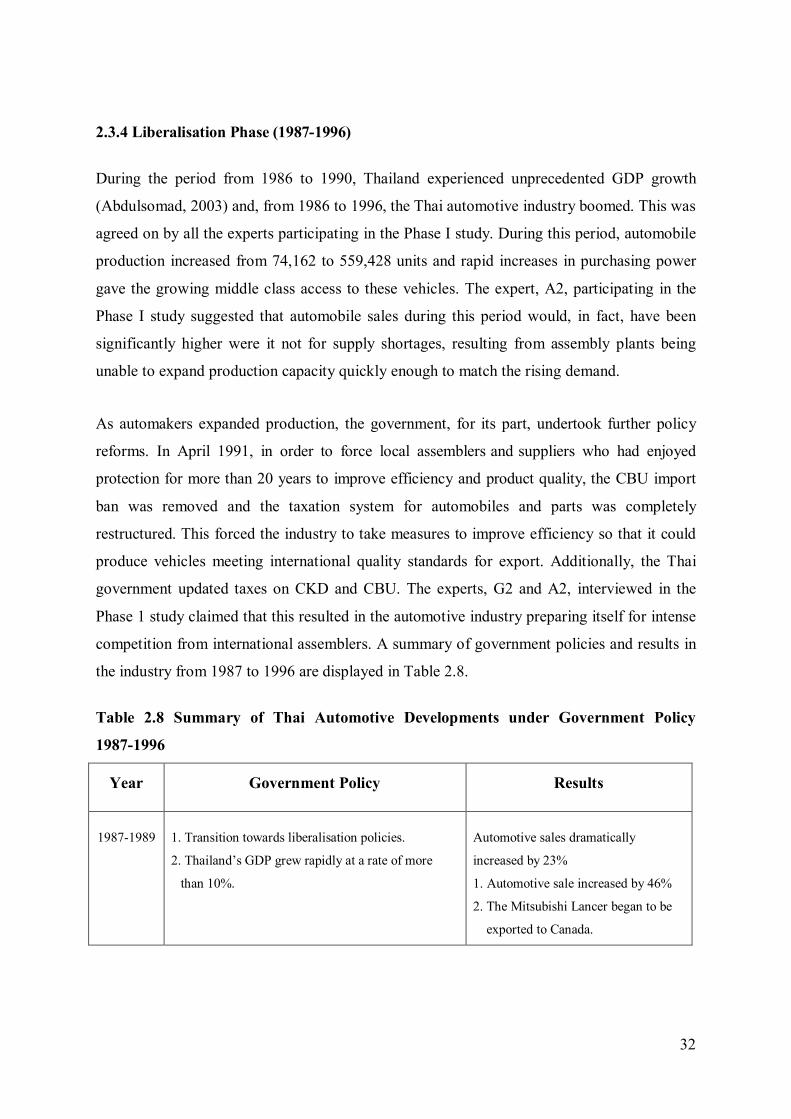
32
2.3.4 Liberalisation Phase (1987-1996)
During the period from 1986 to 1990, Thailand experienced unprecedented GDP growth
(Abdulsomad, 2003) and, from 1986 to 1996, the Thai automotive industry boomed. This was
agreed on by all the experts participating in the Phase I study. During this period, automobile
production increased from 74,162 to 559,428 units and rapid increases in purchasing power
gave the growing middle class access to these vehicles. The expert, A2, participating in the
Phase I study suggested that automobile sales during this period would, in fact, have been
significantly higher were it not for supply shortages, resulting from assembly plants being
unable to expand production capacity quickly enough to match the rising demand.
As automakers expanded production, the government, for its part, undertook further policy
reforms. In April 1991, in order to force local assemblers and suppliers who had enjoyed
protection for more than 20 years to improve efficiency and product quality, the CBU import
ban was removed and the taxation system for automobiles and parts was completely
restructured. This forced the industry to take measures to improve efficiency so that it could
produce vehicles meeting international quality standards for export. Additionally, the Thai
government updated taxes on CKD and CBU. The experts, G2 and A2, interviewed in the
Phase 1 study claimed that this resulted in the automotive industry preparing itself for intense
competition from international assemblers. A summary of government policies and results in
the industry from 1987 to 1996 are displayed in Table 2.8.
Table 2.8 Summary of Thai Automotive Developments under Government Policy
1987-1996
Year Government Policy Results
1987-1989 1. Transition towards liberalisation policies.
2. Thailand’s GDP grew rapidly at a rate of more
than 10%.
Automotive sales dramatically
increased by 23%
1. Automotive sale increased by 46%
2. The Mitsubishi Lancer began to be
exported to Canada.
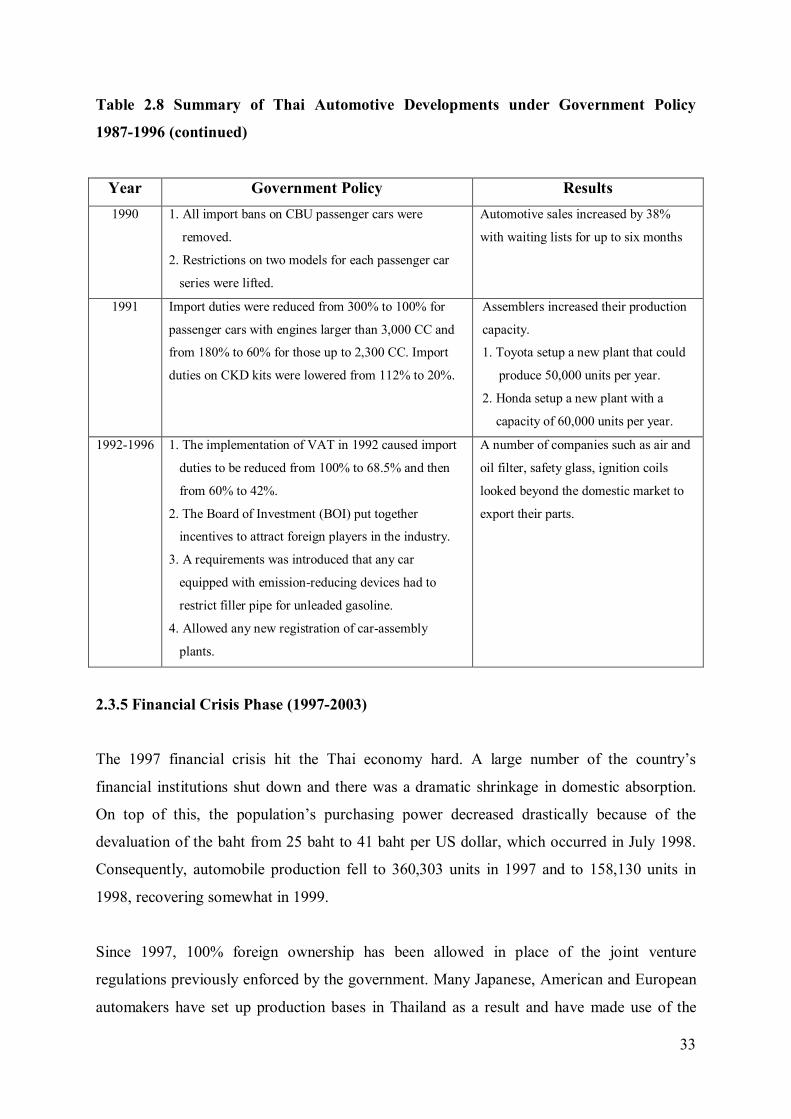
33
Table 2.8 Summary of Thai Automotive Developments under Government Policy
1987-1996 (continued)
Year Government Policy Results 1990 1. All import bans on CBU passenger cars were
removed.
2. Restrictions on two models for each passenger car
series were lifted.
Automotive sales increased by 38%
with waiting lists for up to six months
1991 Import duties were reduced from 300% to 100% for
passenger cars with engines larger than 3,000 CC and
from 180% to 60% for those up to 2,300 CC. Import
duties on CKD kits were lowered from 112% to 20%.
Assemblers increased their production
capacity.
1. Toyota setup a new plant that could
produce 50,000 units per year.
2. Honda setup a new plant with a
capacity of 60,000 units per year.
1992-1996 1. The implementation of VAT in 1992 caused import
duties to be reduced from 100% to 68.5% and then
from 60% to 42%.
2. The Board of Investment (BOI) put together
incentives to attract foreign players in the industry.
3. A requirements was introduced that any car
equipped with emission-reducing devices had to
restrict filler pipe for unleaded gasoline.
4. Allowed any new registration of car-assembly
plants.
A number of companies such as air and
oil filter, safety glass, ignition coils
looked beyond the domestic market to
export their parts.
2.3.5 Financial Crisis Phase (1997-2003)
The 1997 financial crisis hit the Thai economy hard. A large number of the country’s
financial institutions shut down and there was a dramatic shrinkage in domestic absorption.
On top of this, the population’s purchasing power decreased drastically because of the
devaluation of the baht from 25 baht to 41 baht per US dollar, which occurred in July 1998.
Consequently, automobile production fell to 360,303 units in 1997 and to 158,130 units in
1998, recovering somewhat in 1999.
Since 1997, 100% foreign ownership has been allowed in place of the joint venture
regulations previously enforced by the government. Many Japanese, American and European
automakers have set up production bases in Thailand as a result and have made use of the
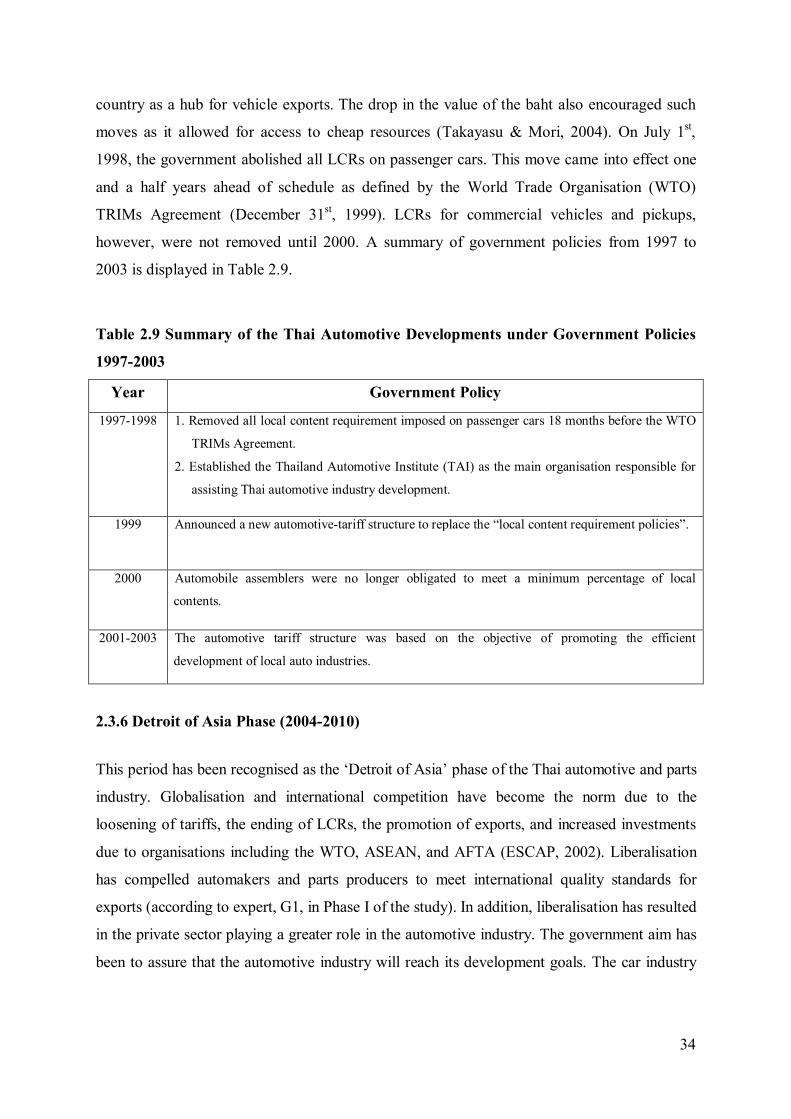
34
country as a hub for vehicle exports. The drop in the value of the baht also encouraged such
moves as it allowed for access to cheap resources (Takayasu & Mori, 2004). On July 1st,
1998, the government abolished all LCRs on passenger cars. This move came into effect one
and a half years ahead of schedule as defined by the World Trade Organisation (WTO)
TRIMs Agreement (December 31st, 1999). LCRs for commercial vehicles and pickups,
however, were not removed until 2000. A summary of government policies from 1997 to
2003 is displayed in Table 2.9.
Table 2.9 Summary of the Thai Automotive Developments under Government Policies
1997-2003
Year Government Policy
1997-1998 1. Removed all local content requirement imposed on passenger cars 18 months before the WTO
TRIMs Agreement.
2. Established the Thailand Automotive Institute (TAI) as the main organisation responsible for
assisting Thai automotive industry development.
1999 Announced a new automotive-tariff structure to replace the “local content requirement policies”.
2000 Automobile assemblers were no longer obligated to meet a minimum percentage of local
contents.
2001-2003 The automotive tariff structure was based on the objective of promoting the efficient
development of local auto industries.
2.3.6 Detroit of Asia Phase (2004-2010)
This period has been recognised as the ‘Detroit of Asia’ phase of the Thai automotive and parts
industry. Globalisation and international competition have become the norm due to the
loosening of tariffs, the ending of LCRs, the promotion of exports, and increased investments
due to organisations including the WTO, ASEAN, and AFTA (ESCAP, 2002). Liberalisation
has compelled automakers and parts producers to meet international quality standards for
exports (according to expert, G1, in Phase I of the study). In addition, liberalisation has resulted
in the private sector playing a greater role in the automotive industry. The government aim has
been to assure that the automotive industry will reach its development goals. The car industry
35
was pushed to be recognised as the automobile manufacturing centre of Asia, the region’s
strongest OEM, and REM parts industry.
2.4 The Role of the Private Sector in Automotive Industry Development from 1960-2009
As mentioned earlier in Section 2.3, Thai automotive and parts industry development can be
classified into six phases as can the role of the private sector in each phase (the Simple
Assembly Phase (1960-1970); the First Localisation Phase (1971- 1977); the Second
Localisation Phase (1978-1986); the Liberalisation Phase (1987-1996); the Financial Crisis
Phase (1997-2003); and the Detroit of Asia Phase (2004-2010).
2.4.1 The Role of the Private Sector during the Simple Assembly Phase (1960-1970)
During the 1960s, the government’s policies were perceived by the private sector as
conducive to their investing in the automobile sector. Initially, it was local dealers and CBU
vehicle distributors from the private sector that invested. These dealers and distributors set up
assembly operations or joint ventures with foreign auto companies in Thailand.
The establishment of the Association of Thai Industries (ATI) in 1967 marked a coming into
prominence of the private sector. The ATI played a critical role from the end of the 1960s to
the early 1970s in dealing with the government on policy issues. At a seminar in March 1970,
for instance, the organisation publicly criticised incentives and tax policies and the
government’s failure to put in place a long-term strategy for industry.
2.4.2 The Role of the Private Sector during the First Localisation Phase (1971- 1977)
During the first stages of the protection period, the ATI anticipated that a new industrial
approach to the automotive sector which would protect the industry from external
competition and restrict the entry of new assemblers would be put in place (Abdulsomad,
2003; Doner, 1991). The ATI aimed to negotiate its way into the position of an oligopoly in
the automobile industry. It emphasised that industrial development through localisation would
not be effective if new entries by assemblers were allowed (Charoenporn, 2001). The
organisation supported measures introduced in July 1971 because they offered the protection
they wanted (ibid.). The new measures included expansion in local content and limits on
36
models, engine sizes, vehicle types, and minimum capacity. The introduction of these policies
was seen as a triumph for the private sector. Talks with the government regarding automotive
industry policy continued and in 1976, the Auto Parts Industry Club (APIC/FTI) and the
Automotive Industry Club (AIC/FTI) were set up (Abdulsomad, 2003). The process was,
however, unsuccessful due to conflicts between automakers and auto parts suppliers.
2.4.3 The Role of the Private Sector during the Second Localisation Phase (1978-1986)
In 1978 many local suppliers withdrew from the APIC establishing a new association, the
Thai Auto Parts Manufacturers Association (TAPMA). This was made up of parts suppliers
and aimed at protecting their interests from automakers (according to expert, G2, in Phase I
of the study) and it charged APIC/FTI with being controlled by Japanese automakers. The
automakers, for their part, set up the Thai Automotive Industry Association (TAIA) in 1981
to protect their interests from TAPMA’s. The government saw these associations as positive
developments as it expected inter-industry collaboration to fortify the industry against
overseas competition.
2.4.4 The Role of Private Sector during the Liberalisation Phase (1987-1996)
The period from 1987 to 1996 was a boom time in the industry due to the expansion of the Thai
and World economies (according to government official, G1, in Phase I of the study; Kaosa-ard
(1993)). Automobile production and domestic sales stayed at consistently high levels and
production capacities were increased to meet domestic demand. The government, for its part,
further liberalised the automotive sector. Consequently, the auto associations pushed members
to increase competitiveness through improvements in production technology and in product
quality.
2.4.5 The Role of Private Sector during the Financial Crisis Phase (1997-2003)
The 1997 financial crisis had a major effect on Thailand’s automotive and parts industries
(UNIDO, 2010; Kaosa-ard, 1993). The resulting shrinkage in domestic absorption, the
shutting down of Thai financial institutions, and the downgrading of the currency all led to
decreasing purchasing power and demand domestically. Hundreds of small local parts
manufacturer had to shut down and the remainder suffered significant financial difficulties.
37
Fresh finance had to be released to local parts manufacturers and many of them came to be
dominated by MNEs as a result, and these enterprises played a critical role in the sector from
then on.
2.4.6 The Role of the Private Sector during the Detroit of Asia Phase (2004-2010)
In early 2000, the abolishment of LCRs heralded a new environment in the Thai automotive
industry. At this time all protective measures for local firms were ended. Liberalisation and
foreign competition then became inevitable. As mentioned in section 2.1, new assemblers
entered Thailand and used the country as a base for automobile exports. High quality and low
prices therefore became required of local operators. Their abilities however, were limited by
previous local protection measures. Local first-tier suppliers have consequently been replaced
in the OEM market by MNE first-tier suppliers. Many local suppliers had to shut down and
many others have been relegated to simple parts production in the lower tiers. Consequently,
MNE parts suppliers have been crucially important in producing parts and have provided
important technological help to local operators (according to the experts, G3, A1, and A2, in
Phase I of the study).
2.5 Summary of Tariff and Taxes of Completely Built-Up (CBU) and Completely
Knocked-Down (CKD) Vehicles
Thailand was the first ASEAN country to unilaterally liberalise its automotive industry.
Protection on vehicles, though remaining relatively high compared to other industries, was
dramatically decreased in the early 1990s resulting in increases in import competition. 1990
saw the government end its restriction on the number of series and replace passenger-car
import limitations with changes in taxation. In 1992, the tariff on Completely Built-up (CBU)
passenger vehicles over 2,400 cc. was lowered from 300 per cent to 68.5 per cent and the
tariff on Completely Knocked-down (CKD) kits of passenger cars with 2,400 cc. engines and
below was lowered to 42 per cent (Table 2.10).
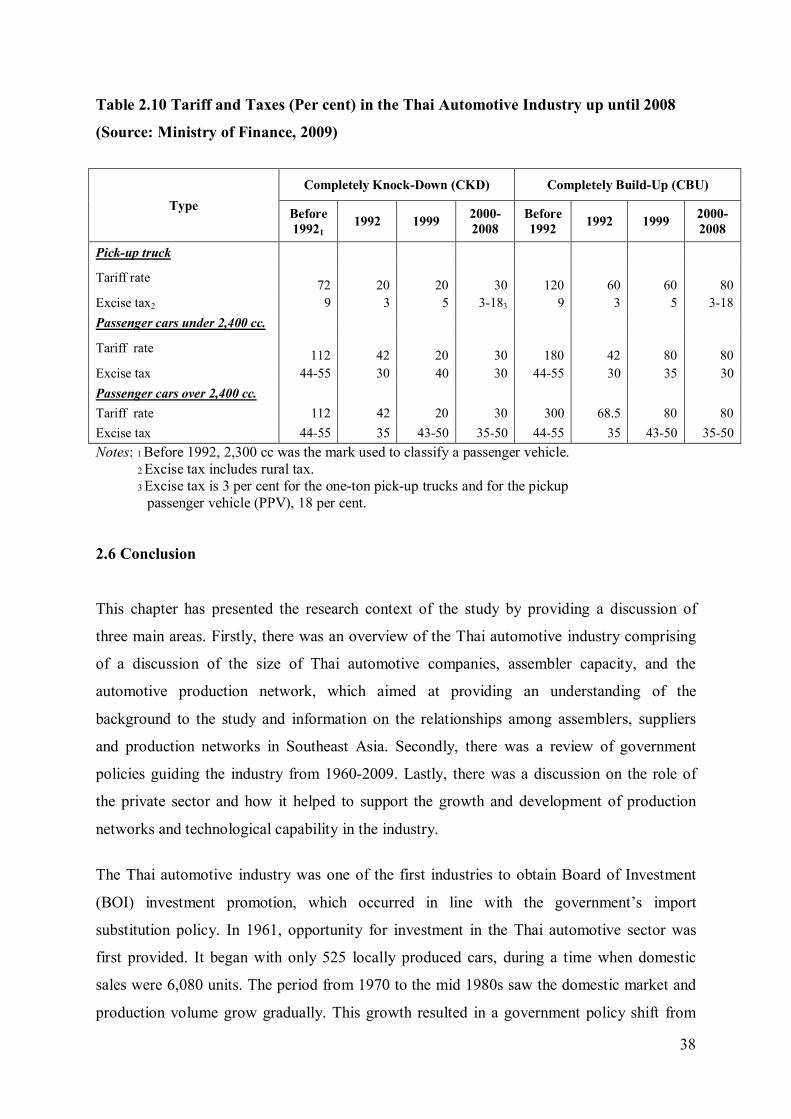
38
Table 2.10 Tariff and Taxes (Per cent) in the Thai Automotive Industry up until 2008
(Source: Ministry of Finance, 2009)
Type Completely Knock-Down (CKD) Completely Build-Up (CBU)
Before 19921
1992 1999 2000-2008
Before 1992 1992 1999 2000-
2008
Pick-up truck
Tariff rate 72
20
20
30
120
60
60
80
Excise tax2 9 3 5 3-183 9 3 5 3-18 Passenger cars under 2,400 cc.
Tariff rate 112
42
20
30
180
42
80
80
Excise tax 44-55 30 40 30 44-55 30 35 30 Passenger cars over 2,400 cc. Tariff rate 112 42 20 30 300 68.5 80 80 Excise tax 44-55 35 43-50 35-50 44-55 35 43-50 35-50 Notes: 1 Before 1992, 2,300 cc was the mark used to classify a passenger vehicle. 2 Excise tax includes rural tax. 3 Excise tax is 3 per cent for the one-ton pick-up trucks and for the pickup passenger vehicle (PPV), 18 per cent.
2.6 Conclusion
This chapter has presented the research context of the study by providing a discussion of
three main areas. Firstly, there was an overview of the Thai automotive industry comprising
of a discussion of the size of Thai automotive companies, assembler capacity, and the
automotive production network, which aimed at providing an understanding of the
background to the study and information on the relationships among assemblers, suppliers
and production networks in Southeast Asia. Secondly, there was a review of government
policies guiding the industry from 1960-2009. Lastly, there was a discussion on the role of
the private sector and how it helped to support the growth and development of production
networks and technological capability in the industry.
The Thai automotive industry was one of the first industries to obtain Board of Investment
(BOI) investment promotion, which occurred in line with the government’s import
substitution policy. In 1961, opportunity for investment in the Thai automotive sector was
first provided. It began with only 525 locally produced cars, during a time when domestic
sales were 6,080 units. The period from 1970 to the mid 1980s saw the domestic market and
production volume grow gradually. This growth resulted in a government policy shift from
39
import substitution to a more rationalised policy aimed at increasing the localisation of parts
and components (according to the expert, G2, in Phase I of the study).
In the 1990s, the Thai automotive production and sales sectors grew considerably for two
main reasons. The first was the 1985 jump in value of the Japanese yen which aided Japanese
part makers in increasing production capacities in Thailand. The second was the Thai
government’s commitment to liberalising the automotive industry, including through
deregulation in the early 2000s and the abolishing of the Local Content Requirement
regulations in 2000 (ibid.). These actions had significant transformational effects, moving the
industry from a high level of protection to a situation where it was much more liberalised.
This has resulted in Thailand gaining traction as an export base thus giving confidence to
Japanese and U.S. assemblers to make use of the country for this purpose. Production
capacity has expanded significantly since 2000 and reached two million units per year in
2010 (see Table 2.1).
The next chapter will review the literatures on the developing technological capability which
will provide understanding of how the developing technological capability takes place at the
firm level.
40
Chapter 3
Literature Review: Technological Capability Development, Technology
Transfer, Innovation Strategies, Organisation & Organisational Learning,
and International Strategic Alliance
3.1 Introduction
Technology and knowledge are the dominant features of the world today especially in the
fields of business and industry (Mowery & Rosenberg, 1998). Along with the issue of
organisational learning, technology capability development is also concerned with the
transferability of technology. A review of the literature concerning technology capability
development is provided in this chapter.
Many developing countries focus on developing their industry’s technology capabilities
through the process of technology transfer, particularly ASEAN countries with automotive
industries. In some countries, FDI is motivated by incentives from the government, and as a
result, technologies are transferred to local companies (Glass & Saggi, 2002). However, some
of these organisations have difficulties on the path to technology development. Cragg and
King (1993) contend that the primary reason preventing organisations from taking on new
technology is a knowledge deficit on the part of the owner and a lack of technological
development in the organisation. This shows that organisations need to take action to support
technological capability development.
The review is organised as follows: Section 3.2 classifies types of capability development and
related terms. Section 3.3 reviews technological capability development. Section 3.4
describes factors affecting the success of technology capability development. In order for
companies to achieve the goal of successful technology capacity development, it is necessary
to find out what the key concepts and possible factors affecting that goal are. Section 3.5
reviews research and development (R&D) and outlines the role R&D plays in technological
capability development. It also covers the reasons for using R&D as the sole indicator for
technological capability development in the study. Section 3.6 mainly concerns technology
transfer. It includes a discussion of the definitions of technology transfer, technology transfer
41
processes, and how technology transfer affects technological capability development in the
Thai automotive industry. Next, Section 3.7 explains innovation strategies and how they affect
technological capability development. Section 3.8 describes important concepts of
organisation. Section 3.9 outlines organisational learning theory and its associated concepts.
Section 3.10 demonstrates factors relating to organisations and to organisational learning
affecting technology capability development. Section 3.11 is about the concept and forms of
international strategic alliance and relates choices MNEs and local companies make for their
operations, as well as equity sharing and ultimate goals which can help them to be successful
in a competitive environment. Section 3.12 demonstrates factors in international strategic
alliance affecting technological capability development. Section 3.13 concludes the chapter.
3.2 Classifications of Capability Development and Related Terms
Company self-knowledge is a key to successful development. As Trott (2005) mentions, it is
necessary for companies to understand their strengths and weaknesses in order to wisely plan
their development paths. Also, as Dosi et al. (2000) point out, a company can only
successfully develop if it comprehensively estimates its present abilities. Great development
cannot be achieved without companies knowing what they can potentially do. Therefore,
capability is very critical and cannot be overlooked. As Kale (2005) states “capabilities fill
the gap between intention and outcome”.
There is a wide range of criteria used in classifying the term “capability”. Capability is
explained as manifesting itself in two forms, production capability and technological
capability. The difference between these two forms in Kale’s (2005) study involves “the
increasing specialisation and professionalisation of the activities involved in generating and
managing change”. However, with regard to technology transfer in technological capability
development, absorptive capability seems to be crucial. Thus, the concepts of “production
capability”, “technological capability”, and “absorptive capability” are explored further
below using several studies relevant to developing countries, especially Thailand.
3.2.1 Production Capability
From a business standpoint, capability is seen as “the ability to undergo or be affected by a
given treatment or action” (Longman Business English Dictionary, 2008). The definition of
42
“production capacities” mentioned in Bell and Pavitt (1993) involves the replication of tasks
that comprise the firm’s resources used to maximise efficiency in manufacturing products
using combinations of inputs including equipment, labour skills, product and input
specification, organisational structures and management.
Retaining production capability might offer business benefits. For example, production
capability can be a source of product innovation. Moreover, production capability can
provide a protectable competitive advantage as well as a route to the market for science and
technology. Though it seems clear that production capability is able to do these things, related
factors such as skilled/unskilled labour content and embodiment of unique technology may
affect the process.
3.2.2 Technological Capability
More complicated than the definition of production capability, technological capability is
known by several other terms. The same concept, for example, is called ‘technological effort’
in Dahlman and Westphal (1982), and Lall (1987). And it is described as ‘technological
capacity’ in Bell (1984), Katz (1987), and Scott-Kemis and Bell (1985) and refers to the ability
of a firm to maximise technological information to maintain their market competitiveness and
to be innovators.
The combination of factors leading to technological capabilities in Bell and Pavitt (1993)
includes organisational structures, knowledge, experience, and skills. Kim (1999) states that
production, investment, and innovation are critical. Under the following framework,
technological capability could be classified into investment, production, and linkage, with three
levels in each, these being basic or simple, intermediate or adaptive, and advanced or
innovative. Table 3.1 Technological Capability Matrix briefly shows details of each level of
technological capability based on the studies of Lall (1992) and Bell and Pavitt (1995).
The significant differences among these three levels arise from the type of knowledge, skills
and technologies needed in understanding and applying for adaptive and innovating
technology (Bell & Pavitt, 1993; also cited in Kale, 2005). The first or basic level of
technology capability is found in groups of firms that are able to apply only basic technology
to their production. In other words, in producing products, firms neither need high technology
in the process of production nor complex plans to organise investment and create linkages.
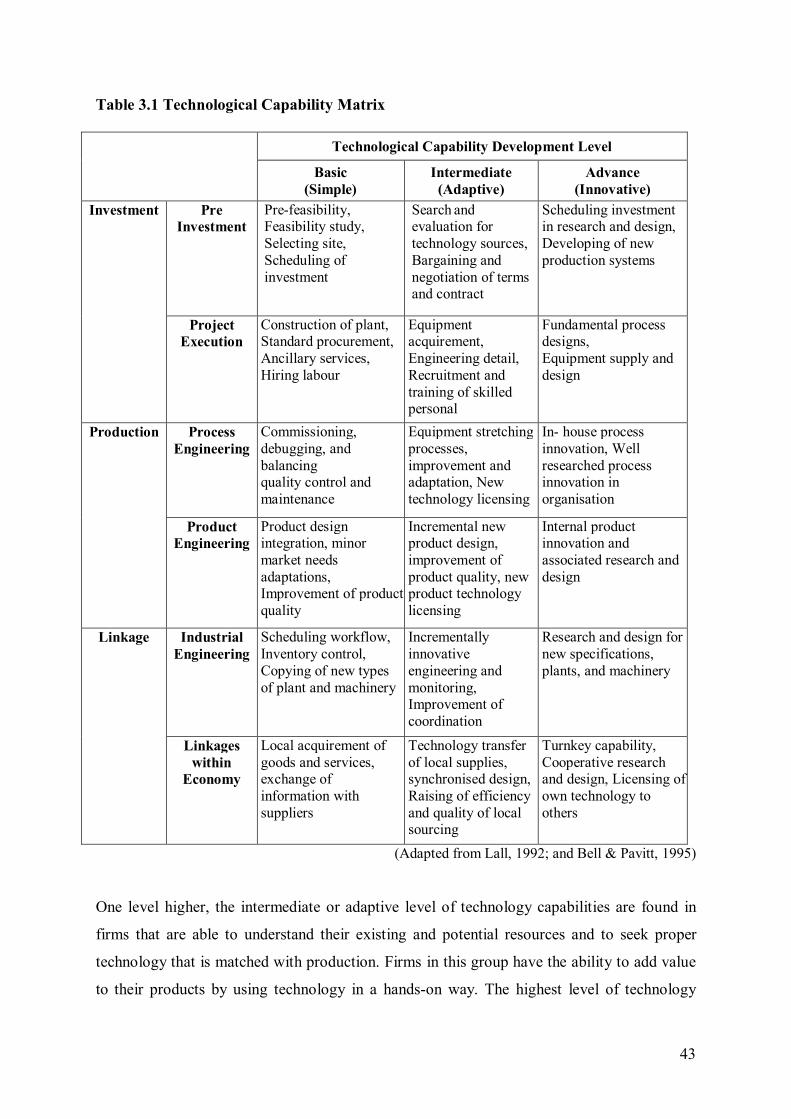
43
Table 3.1 Technological Capability Matrix
Technological Capability Development Level
Basic (Simple)
Intermediate (Adaptive)
Advance (Innovative)
Investment Pre Investment
Pre-feasibility, Feasibility study, Selecting site, Scheduling of investment
Search and evaluation for technology sources, Bargaining and negotiation of terms and contract
Scheduling investment in research and design, Developing of new production systems
Project Execution
Construction of plant, Standard procurement, Ancillary services, Hiring labour
Equipment acquirement, Engineering detail, Recruitment and training of skilled personal
Fundamental process designs, Equipment supply and design
Production Process Engineering
Commissioning, debugging, and balancing quality control and maintenance
Equipment stretching processes, improvement and adaptation, New technology licensing
In- house process innovation, Well researched process innovation in organisation
Product Engineering
Product design integration, minor market needs adaptations, Improvement of product quality
Incremental new product design, improvement of product quality, new product technology licensing
Internal product innovation and associated research and design
Linkage Industrial Engineering
Scheduling workflow, Inventory control, Copying of new types of plant and machinery
Incrementally innovative engineering and monitoring, Improvement of coordination
Research and design for new specifications, plants, and machinery
Linkages within
Economy
Local acquirement of goods and services, exchange of information with suppliers
Technology transfer of local supplies, synchronised design, Raising of efficiency and quality of local sourcing
Turnkey capability, Cooperative research and design, Licensing of own technology to others
(Adapted from Lall, 1992; and Bell & Pavitt, 1995)
One level higher, the intermediate or adaptive level of technology capabilities are found in
firms that are able to understand their existing and potential resources and to seek proper
technology that is matched with production. Firms in this group have the ability to add value
to their products by using technology in a hands-on way. The highest level of technology
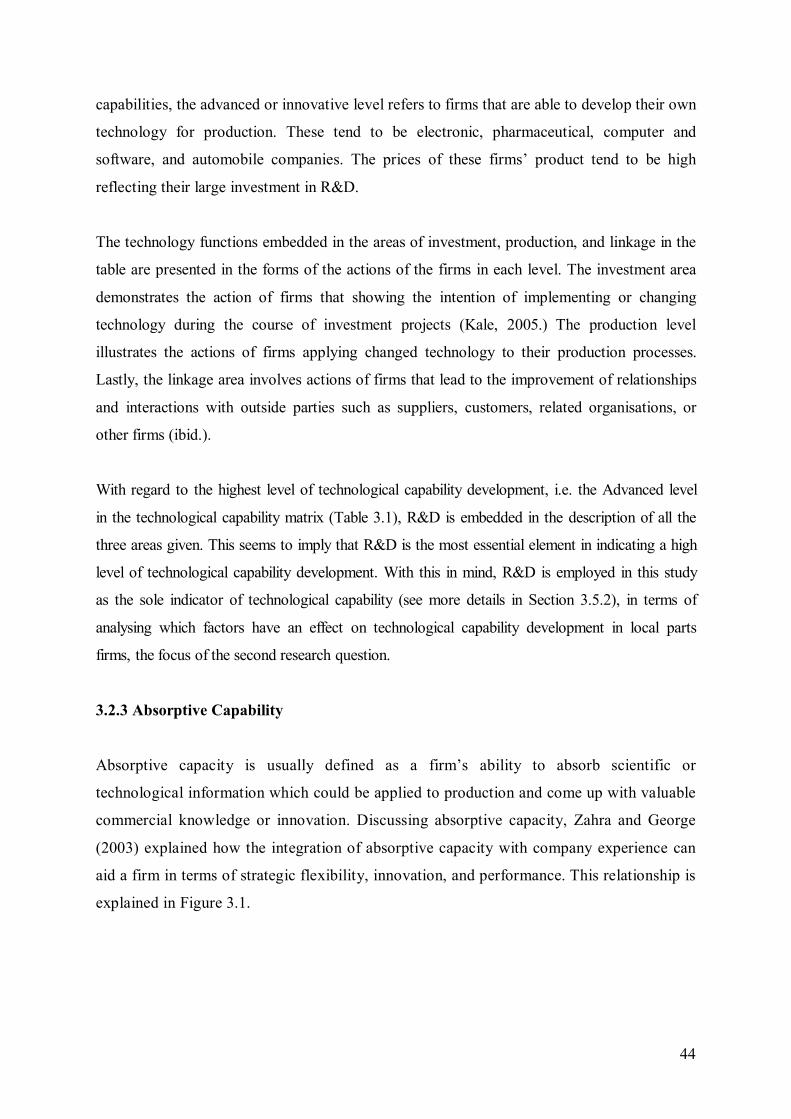
44
capabilities, the advanced or innovative level refers to firms that are able to develop their own
technology for production. These tend to be electronic, pharmaceutical, computer and
software, and automobile companies. The prices of these firms’ product tend to be high
reflecting their large investment in R&D.
The technology functions embedded in the areas of investment, production, and linkage in the
table are presented in the forms of the actions of the firms in each level. The investment area
demonstrates the action of firms that showing the intention of implementing or changing
technology during the course of investment projects (Kale, 2005.) The production level
illustrates the actions of firms applying changed technology to their production processes.
Lastly, the linkage area involves actions of firms that lead to the improvement of relationships
and interactions with outside parties such as suppliers, customers, related organisations, or
other firms (ibid.).
With regard to the highest level of technological capability development, i.e. the Advanced level
in the technological capability matrix (Table 3.1), R&D is embedded in the description of all the
three areas given. This seems to imply that R&D is the most essential element in indicating a high
level of technological capability development. With this in mind, R&D is employed in this study
as the sole indicator of technological capability (see more details in Section 3.5.2), in terms of
analysing which factors have an effect on technological capability development in local parts
firms, the focus of the second research question.
3.2.3 Absorptive Capability
Absorptive capacity is usually defined as a firm’s ability to absorb scientific or
technological information which could be applied to production and come up with valuable
commercial knowledge or innovation. Discussing absorptive capacity, Zahra and George
(2003) explained how the integration of absorptive capacity with company experience can
aid a firm in terms of strategic flexibility, innovation, and performance. This relationship is
explained in Figure 3.1.
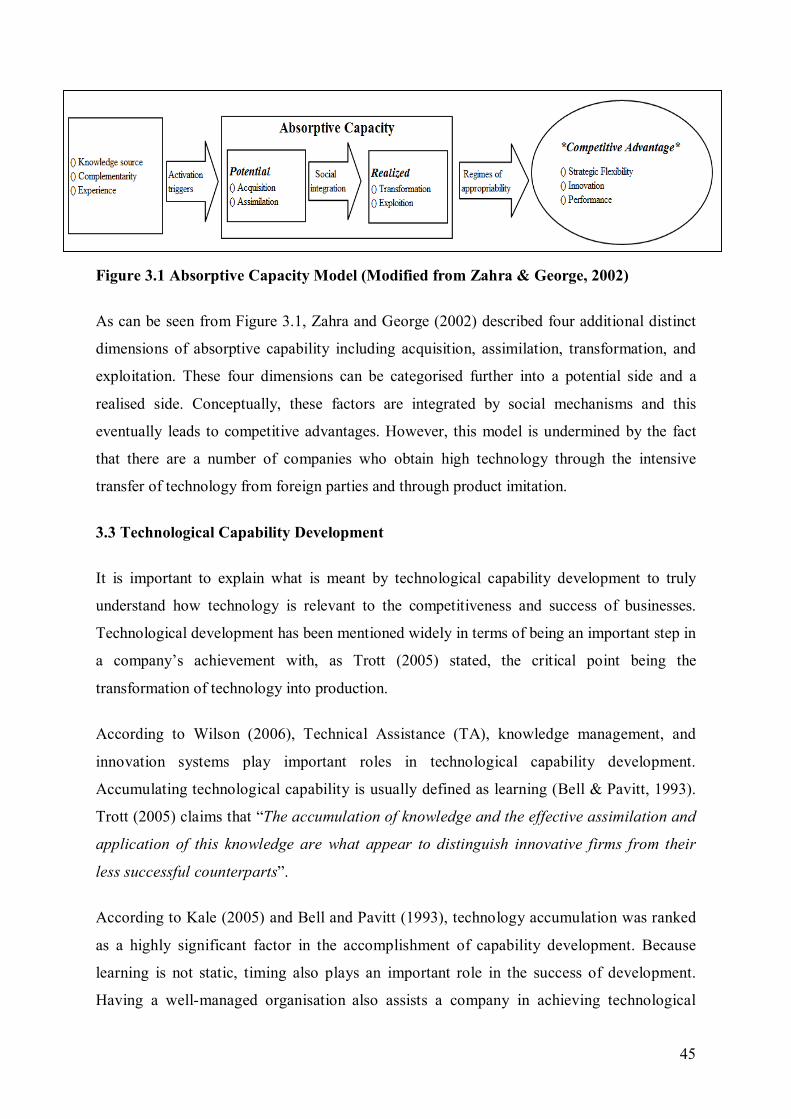
45
Figure 3.1 Absorptive Capacity Model (Modified from Zahra & George, 2002)
As can be seen from Figure 3.1, Zahra and George (2002) described four additional distinct
dimensions of absorptive capability including acquisition, assimilation, transformation, and
exploitation. These four dimensions can be categorised further into a potential side and a
realised side. Conceptually, these factors are integrated by social mechanisms and this
eventually leads to competitive advantages. However, this model is undermined by the fact
that there are a number of companies who obtain high technology through the intensive
transfer of technology from foreign parties and through product imitation.
3.3 Technological Capability Development
It is important to explain what is meant by technological capability development to truly
understand how technology is relevant to the competitiveness and success of businesses.
Technological development has been mentioned widely in terms of being an important step in
a company’s achievement with, as Trott (2005) stated, the critical point being the
transformation of technology into production.
According to Wilson (2006), Technical Assistance (TA), knowledge management, and
innovation systems play important roles in technological capability development.
Accumulating technological capability is usually defined as learning (Bell & Pavitt, 1993).
Trott (2005) claims that “The accumulation of knowledge and the effective assimilation and
application of this knowledge are what appear to distinguish innovative firms from their
less successful counterparts”.
According to Kale (2005) and Bell and Pavitt (1993), technology accumulation was ranked
as a highly significant factor in the accomplishment of capability development. Because
learning is not static, timing also plays an important role in the success of development.
Having a well-managed organisation also assists a company in achieving technological
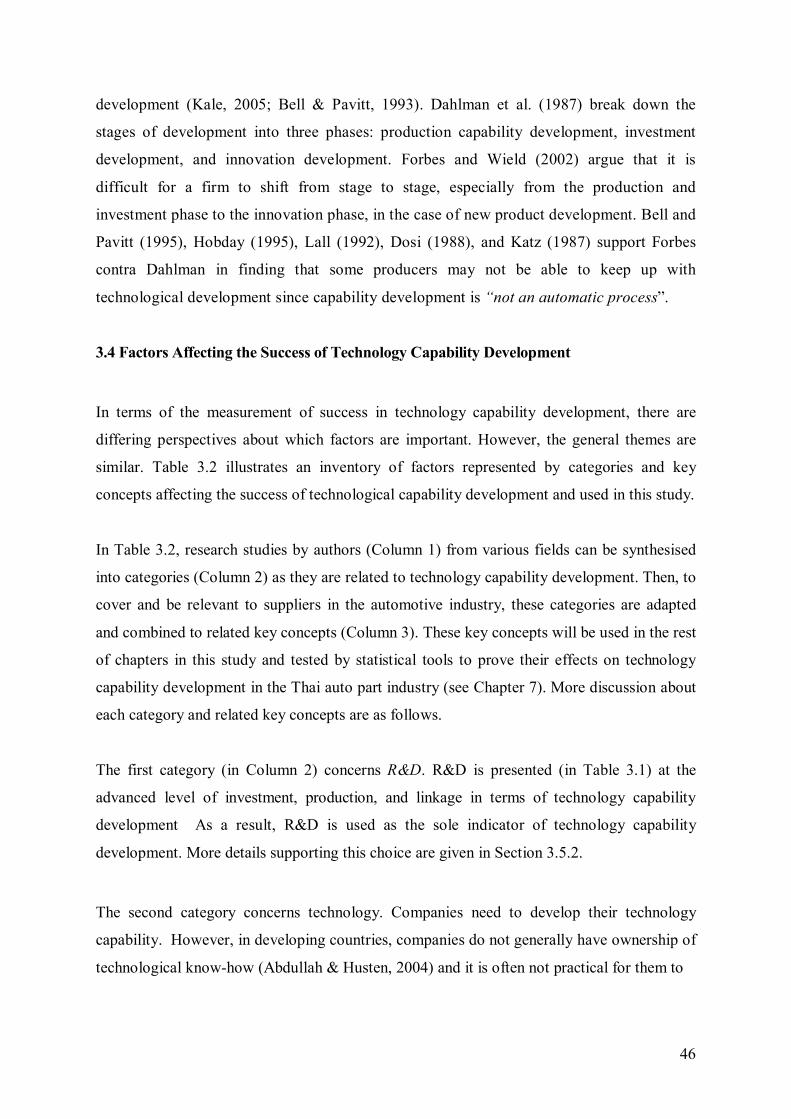
46
development (Kale, 2005; Bell & Pavitt, 1993). Dahlman et al. (1987) break down the
stages of development into three phases: production capability development, investment
development, and innovation development. Forbes and Wield (2002) argue that it is
difficult for a firm to shift from stage to stage, especially from the production and
investment phase to the innovation phase, in the case of new product development. Bell and
Pavitt (1995), Hobday (1995), Lall (1992), Dosi (1988), and Katz (1987) support Forbes
contra Dahlman in finding that some producers may not be able to keep up with
technological development since capability development is “not an automatic process”.
3.4 Factors Affecting the Success of Technology Capability Development
In terms of the measurement of success in technology capability development, there are
differing perspectives about which factors are important. However, the general themes are
similar. Table 3.2 illustrates an inventory of factors represented by categories and key
concepts affecting the success of technological capability development and used in this study.
In Table 3.2, research studies by authors (Column 1) from various fields can be synthesised
into categories (Column 2) as they are related to technology capability development. Then, to
cover and be relevant to suppliers in the automotive industry, these categories are adapted
and combined to related key concepts (Column 3). These key concepts will be used in the rest
of chapters in this study and tested by statistical tools to prove their effects on technology
capability development in the Thai auto part industry (see Chapter 7). More discussion about
each category and related key concepts are as follows.
The first category (in Column 2) concerns R&D. R&D is presented (in Table 3.1) at the
advanced level of investment, production, and linkage in terms of technology capability
development As a result, R&D is used as the sole indicator of technology capability
development. More details supporting this choice are given in Section 3.5.2.
The second category concerns technology. Companies need to develop their technology
capability. However, in developing countries, companies do not generally have ownership of
technological know-how (Abdullah & Husten, 2004) and it is often not practical for them to
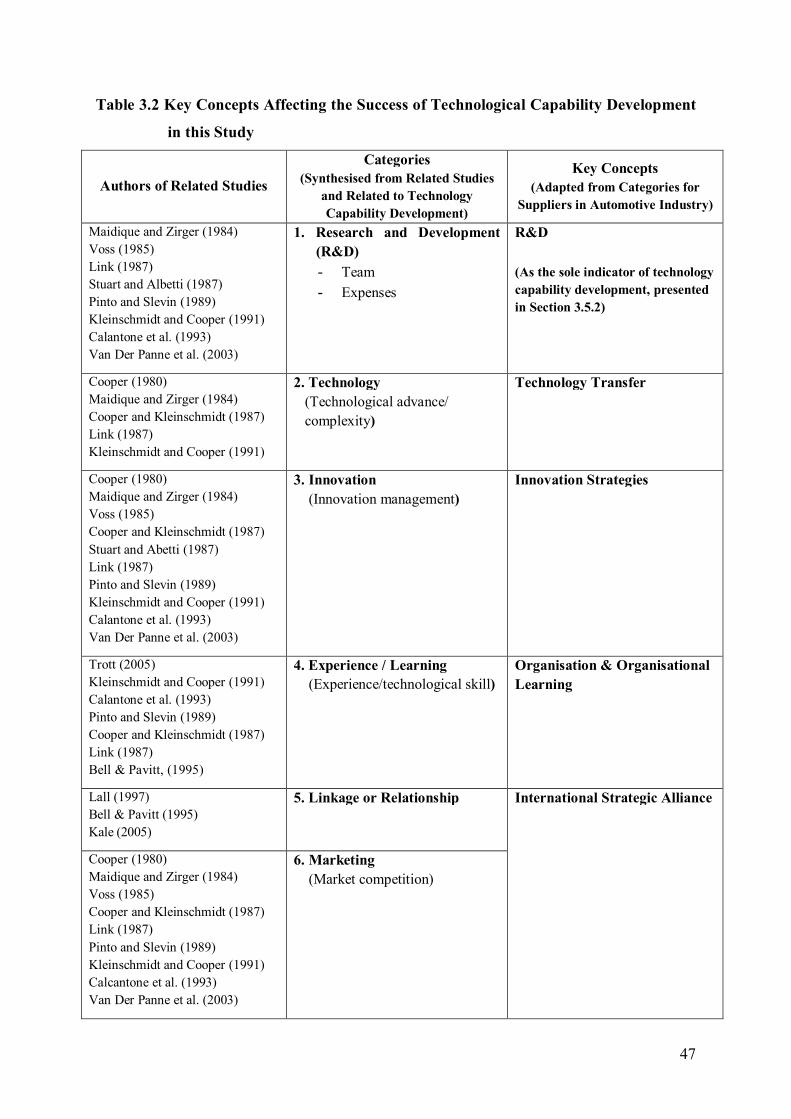
47
Table 3.2 Key Concepts Affecting the Success of Technological Capability Development
in this Study
Authors of Related Studies Categories
(Synthesised from Related Studies and Related to Technology Capability Development)
Key Concepts (Adapted from Categories for
Suppliers in Automotive Industry)
Maidique and Zirger (1984) Voss (1985) Link (1987) Stuart and Albetti (1987) Pinto and Slevin (1989) Kleinschmidt and Cooper (1991) Calantone et al. (1993) Van Der Panne et al. (2003)
1. Research and Development (R&D)
- Team - Expenses
R&D (As the sole indicator of technology capability development, presented in Section 3.5.2)
Cooper (1980)
Maidique and Zirger (1984) Cooper and Kleinschmidt (1987) Link (1987) Kleinschmidt and Cooper (1991)
2. Technology (Technological advance/ complexity)
Technology Transfer
Cooper (1980) Maidique and Zirger (1984) Voss (1985) Cooper and Kleinschmidt (1987) Stuart and Abetti (1987)
Link (1987) Pinto and Slevin (1989) Kleinschmidt and Cooper (1991) Calantone et al. (1993) Van Der Panne et al. (2003)
3. Innovation (Innovation management)
Innovation Strategies
Trott (2005)
Kleinschmidt and Cooper (1991) Calantone et al. (1993) Pinto and Slevin (1989) Cooper and Kleinschmidt (1987) Link (1987) Bell & Pavitt, (1995)
4. Experience / Learning (Experience/technological skill)
Organisation & Organisational Learning
Lall (1997)
Bell & Pavitt (1995) Kale (2005)
5. Linkage or Relationship International Strategic Alliance
Cooper (1980)
Maidique and Zirger (1984) Voss (1985)
Cooper and Kleinschmidt (1987) Link (1987) Pinto and Slevin (1989) Kleinschmidt and Cooper (1991) Calcantone et al. (1993) Van Der Panne et al. (2003)
6. Marketing (Market competition)
48
develop technology by themselves. As a result, these companies depend on “technology
transfer” from technology inventors. More details about “technology transfer” are presented
in Section 3.6.
The third category concerns innovation. Innovation can take the company to a higher level of
technology capability. The company can employ innovation strategies not only to build
innovative products to make profits but also to accumulate know-how and technology skills
to enhance its operations. Employees can also learn new ways of thinking from these
innovations, and then produce more and more innovative products to serve the needs of their
customers. Section 3.7 gives more discussion about “innovation strategies.”
The fourth category is about experience /learning. Top management strongly influences the
organisational culture and learning process which can lead to higher production and
technological skills (Peter et al., 1999; Yavas & Rezayat, 2003). Large organisations with
higher assets have more opportunity to access these knowledge and skills. The key concepts
of “organisation” and “organisational learning” are included in this study and mentioned in
Section 3.8 to 3.10.
The fifth and sixth categories are about linkage and marketing. Because marketing is not a
major activity for industrial products, particularly automotive parts, the marketing and
linkage categories are combined in the category “international strategic alliance” (see
Section 3.11 and 3.12). In the automotive industry, automotive suppliers need to have good
relationships or to be in alliances with carmakers to win large orders. In addition, carmakers
are a source of high technology and production skills. Consequently, suppliers can gain
higher technology capabilities when working closer to the carmakers or getting assistance
from them.
All of these key concepts: R&D, technology transfer, innovation strategies, organisation &
organisational learning, and international strategic alliance will be investigated in this
chapter, and they also support the creation of the conceptual frameworks in Chapter 4. The
rationale behind each of these key concepts causing the development of technological
capabilities is presented in Section 4.3 Chapter 4.
49
3.5 Research and Development (R&D)
R&D activities are carried out by specialised units of a state agency, company or industry.
R&D can be defined as a future-oriented set of longer-term scientific or technological
activities, using techniques similar to those of scientific research, which are employed with the
expectation of commercial benefits (Johansson & Lööf, 2008).
3.5.1 Role of R&D in Technological Capability Development
Regarding the business context, the increasingly international profile of business R&D
investment is a reflection of intensifying global competition for leadership and talent in the
most important and fastest growing markets. Companies that site their R&D activities close
to new and emerging markets can gain valuable insights into how best to meet the needs of
those markets.
Technological capability development and its relationship to R&D can be described as a path
dependent process. It begins with the know-how capabilities of simple production engineering
and proceeds through the obtainment of the know-why capabilities of reverse engineering that
allow for the paradigm shift of conducting research (i.e. R&D). The path from know-how to
know-why here involves a trade off between short term productivity gains (through know-how)
versus longer term gains in the creation of a foundation for basic and frontier innovation (through
know-why). As it has a close relationship between both items, in this study of Thai automotive
context, R&D is a sole indicator of technology capability development as a following.
3.5.2 R&D: Sole Indicator for Technological Capability Development
Research hypotheses (see Section 7.3.2 in Chapter 7) are introduced in this study of Thai
context that posits causal relationships between 18 potential variables from the conceptual
framework in Chapter 4 and R&D activities in the automobile industry. R&D activity is
utilised as the sole indicator for technological capability in this study. The following research
studies give evidence to support the use of R&D as a sole indicator in this respect.
50
1) Anand and Kogut (1997), for example, pointed out that the researcher can rely on R&D
expenditure data in order to measure technological capability. In support, Ray (2008) claimed
that it is now recognised that today’s productivity growth is mostly due to technological
advancement as a result of R&D.
2) Abeysinghe and Paul (2006) developed indicators to identify what kind of technology
capability was involved in specific industries. They concluded that R&D activities could act
as indicators in this regard.
3) Argyres and Silverman (2004) found that different R&D department structures could give
different results in technological development. They found that firms with centralised R&D
activities tended to be more effective in their technological development than those in which
R&D activities were decentralised.
4) Timmer (2003) also used R&D expenditures as a technology investment indicator.
The research studies presented above support the use of R&D activity as the sole indicator for
the development of technological capabilities. Another source of evidence supporting the idea
of using R&D as a sole indicator comes from data collected from a set of interview questions
for the company managers in the Phase I study. One of the questions in the interview was
“Do you have your own research and design department?” There was a consensus that all
managers had their own R&D department in their firms and they tended to hire experts in the
field to work on R&D. The promotion of R&D in these high-end and high-tech automotive
companies, which their managers selected as samples in the study, suggests that their
technological capability relates to R&D activities as R&D activities can be sole indicators for
this capability.
3.5.3 R&D and the Thai Automotive Industry
The local auto-parts industry in Thailand had enjoyed an expanding domestic market for
nearly three decades before the financial crisis in 1997. During that period of time, the
immediate challenge under protection without competition was to expand production
capability and rely on mass production to reduce costs to meet the rapidly increasing
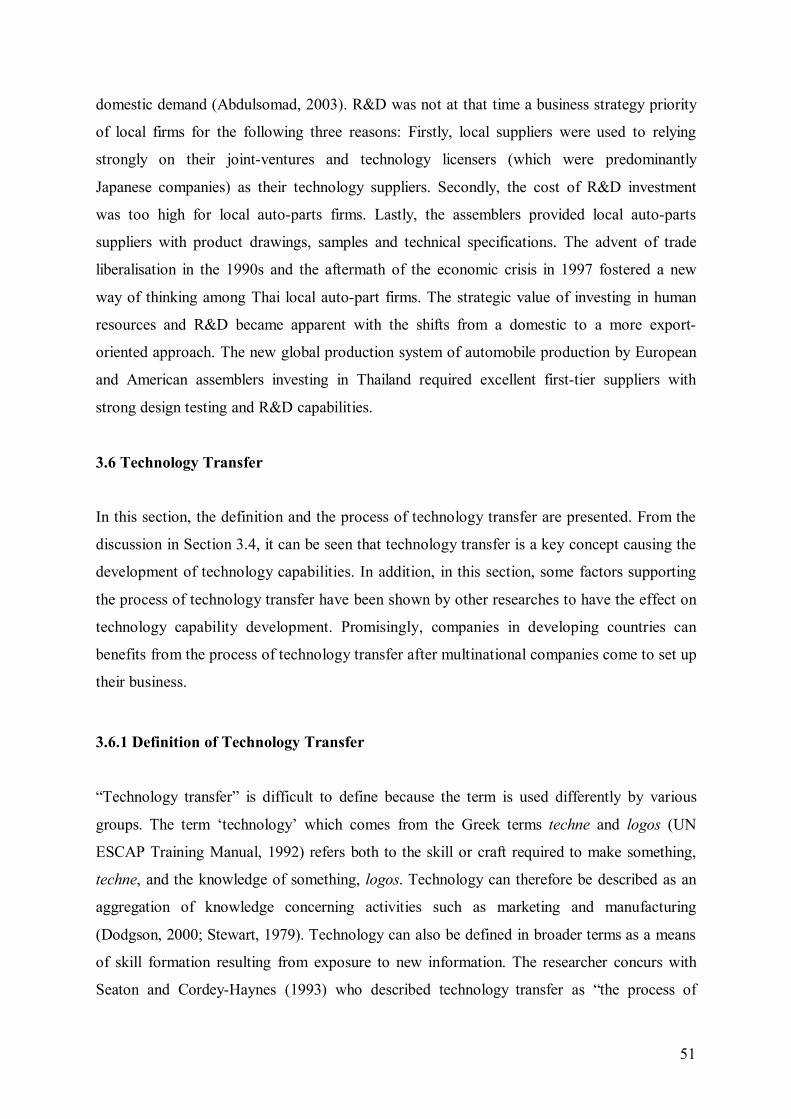
51
domestic demand (Abdulsomad, 2003). R&D was not at that time a business strategy priority
of local firms for the following three reasons: Firstly, local suppliers were used to relying
strongly on their joint-ventures and technology licensers (which were predominantly
Japanese companies) as their technology suppliers. Secondly, the cost of R&D investment
was too high for local auto-parts firms. Lastly, the assemblers provided local auto-parts
suppliers with product drawings, samples and technical specifications. The advent of trade
liberalisation in the 1990s and the aftermath of the economic crisis in 1997 fostered a new
way of thinking among Thai local auto-part firms. The strategic value of investing in human
resources and R&D became apparent with the shifts from a domestic to a more export-
oriented approach. The new global production system of automobile production by European
and American assemblers investing in Thailand required excellent first-tier suppliers with
strong design testing and R&D capabilities.
3.6 Technology Transfer
In this section, the definition and the process of technology transfer are presented. From the
discussion in Section 3.4, it can be seen that technology transfer is a key concept causing the
development of technology capabilities. In addition, in this section, some factors supporting
the process of technology transfer have been shown by other researches to have the effect on
technology capability development. Promisingly, companies in developing countries can
benefits from the process of technology transfer after multinational companies come to set up
their business.
3.6.1 Definition of Technology Transfer
“Technology transfer” is difficult to define because the term is used differently by various
groups. The term ‘technology’ which comes from the Greek terms techne and logos (UN
ESCAP Training Manual, 1992) refers both to the skill or craft required to make something,
techne, and the knowledge of something, logos. Technology can therefore be described as an
aggregation of knowledge concerning activities such as marketing and manufacturing
(Dodgson, 2000; Stewart, 1979). Technology can also be defined in broader terms as a means
of skill formation resulting from exposure to new information. The researcher concurs with
Seaton and Cordey-Haynes (1993) who described technology transfer as “the process of
52
promoting technical innovation through the transfer of ideas, knowledge, devices and artefacts
from leading edge companies, R&D organisations and academic research to more general and
effective application in industry and commerce”.
3.6.2 Technology Transfer Process
The process of technology transfer is only considered to have been completed if the recipient
is able to understand and make effective and sustained use of what has been transferred
(Cohen & Levinthal, 1989; Jensen & Meckling, 1992). An increase in employee knowledge
as well as enhancements in the efficiency of production processes, for example, could
constitute successful transfer.
Figure 3.2 Technology Transfer as a Knowledge-Internalisation Process (Adapted from
Nonaka & Takeuchi, 1995 and McKelvey, 1998)
For the recipient, technology transfer can be looked at as a process of knowledge
internalisation proceeding as illustrated in Figure 3.2.
Regarding the effects on the recipient, several factors must be demonstrable for technology to
be considered to have been transferred successfully. For instance, regarding the case of the
establishment of a new overseas project, the effect of technology transfer might be identified
as a specific objective such as the enhancement of productivity which could take a range of
forms including a reduction in defect rates, production time, and cost.
53
Although technology transfer is easily demonstrated to have taken place, it is not so easy to
determine the exact nature of the processes governing it. To ease this difficulty, it is
important to establish a clear scope of investigation and to collect data according to
appropriate methods. It is for this reason in particular that the field survey and case-study
approach are considered suitable for this study, especially concerning its “inter-firm
technology transfer” aspect.
3.6.3 Factors Regarding Technology Transfer Affecting Technological Capability
Development in the Thai Automotive Industry
Research studies show that to achieve the objective of technology transfer, the company
needs to consider three factors as follows: The first factor is “the type of industry.” When
considering the ratio of technology transfer level between overseas affiliates and Japanese
parent companies around the world, the electric machinery industry is found to have the
highest level of progress in technology transfer. General machinery, textile, and chemical
industries follow (Urata & Kawai, 2000). The second factor is “the need for foreign
technicians or expert assistance” which can support the technology transfer process. The
evidence suggests that technology transfer can take place through the visiting of foreign
experts (Padilla-Perez, 2008). The third factor is “sources of component parts.”
Technologies can be transferred from technological leaders to companies in developing
countries through intermediate products. Then, these companies can modify their production
or product design using foreign technologies embedded in these imported parts (Hakura &
Jaumotte, 1999). Also, Tatikonda and Stock (2003) note that in the product development
process, technology transfer from new products outside the company can support new
projects. The company can access modern technologies and improve their ability to introduce
a variety of products. In this study of the Thai automotive industry, all three factors are
expected to have an effect on technology capability development and are discussed as
follows:
3.6.3.1 Type of Industry
At present, many multinational companies use internationalized strategies, and as a result, their
knowledge and technologies are unequally transferred to different industries (Alvarez &
54
Molero, 2005). Consequently, different industries are expected to have differences in
technology capability development.
In order to produce a car, a variety of components made from plastic, metal, or rubber are
needed. Technologies in different industries producing these parts for car assembling plants
therefore tend to require specific production expertise. Industries classified as participants in
technology transfer tend to be those which intentionally seek new innovation through
organisations, collaborators, or innovators. The type of industry involved and its associated
technologies then are relevant factors in technology transfer affecting technological capability
development. In this study, the relationship between the type of industry and technology
capability development needs to be demonstrated for the Thai automotive industry.
3.6.3.2 Sources of Components
While there might be benefits for technology importers from transferred technology, the
process of localisation of foreign technology might actually obstruct their progress (Wei, 1995).
A low level of local content in production processes based on imported technology means the
technology importer needs to rely on foreign suppliers for inputs that local suppliers and
technology importers cannot produce themselves to required standards of reliability, quality
and cost (ibid.). Local suppliers import some intermediate parts for sub-assembled
components. The suppliers can learn from the design of these parts, and then imitate or
modify them (Hakura & Jaumotte, 1999). In this study, sources of components are
conceptualised as an index defining domestic technology development since the purchasing
of raw materials and components indicates the obtainment of newly transferred technology
and know-how by Thai suppliers. It is hard for the suppliers to make improvements from
purchasing general local auto-parts.
3.6.3.3 Need of Foreign Technicians or Expert Assistance
The assistance of foreign experts can help to develop technology capabilities as the firm adopts
these technological skills and then moves to a higher level (Dahlman et al., 1987). Without
expert assistance, the technology recipient would be limited to using and maintaining capital-
55
embodied technology. Their ability to plan and design products, and evaluate the design of
potential products would be very limited as a result.
In order to reach the goal of dynamically strengthening a firm’s technological capacity for long
term development, five stages of assistance are needed as follows:
(1) Installation and start up: The first stage of required assistance for technology
importers
(2) Maintenance: The second stage of required assistance for technology importers which
have already transferred technology. A lack of knowledge on how to maintain the
technology still exists at this stage.
(3) Quality control: The third stage of requirement for technology importers. The ability
to maintain the technology exists, but production is not yet stabilised.
(4) Training programs: The fourth level of requirement for technology importers. The
ability to control all areas of production exists, but more skilled workers are required.
For example, it might be the case that a company needs to improve their technicians
to be ready for the new technology.
(5) R&D support: The last and essential stage of for companies able to take control of all
production areas. In this stage, there are a sufficient number of skilled workers who
are ready to be assisted in developing their own technology.
3.7 Innovation Strategies
Innovation strategies are very important in the current competitive business environment. Top
executives should allocate adequate budgets for projects creating new products even though
some innovative projects may take a while to generate profits. The working dynamic in an
innovative environment may encourage employee self-improvement.
3.7.1 Innovation
Innovation is used by company executives in different industries to change their daily
business practices (Drucker, 1985). Employees can practice and learn how to innovate.
However, it is the responsibility of executives to locate the sources of innovation of
competitive products and services. Also, innovation, at the individual firm level, could be
described as the application of novel ideas to the firm, whether or not these ideas are
56
embodied in processes, products and services, or in marketing or management systems
(Gibbons et al., 1994). Interestingly, Freeman (1982b) pointed out that innovation is a key
strategy for corporate survival. The importance of the role of innovation to the success of an
enterprise, indeed, cannot be overlooked and it is widely accepted that “it verges on
becoming a cliché” (Trott, 2005). It is therefore necessary to review innovation strategies in
view of technological capability development.
3.7.2 Innovation Strategy with Application
Successful innovation usually results from effective strategies. A number of previous studies
did not only raise this critical point but they also valued “strategies” as very important for
innovation. Cottam et al. (2001) mentioned in their study that innovative activities should be
guided by a well-planned strategic objective.
Summarising existing research, Van Der Panne et al. (2003) and Johne and Snelson (1988)
agreed that pro-activeness and re-activeness are common concepts contained in most of the
studies of innovation strategies. From their point of view, pro-activeness is an internal
innovation factor which basically involves production oriented strategies in any given market,
while re-activeness is an external factor that companies use when the competition in the
market is tense.
Other interesting studies about innovation strategies include those of Trott (2005), Maidique
and Patch (1988) and Freeman (1982a). They came up with four approaches which are
1) The leader or offensive innovation strategy;
2) The fast follower or defensive innovation strategy;
3) The cost minimisation or imitative strategy; and
4) The market segmentation specialist or traditional innovation strategy.
First, looking at the leader or offensive innovation approach, the first mover advantage is
existence and technical vitality. Being the first to enter or to make positive changes in the
market could reward the inventor(s) with a fortune and lead to a monopoly of that new
technology. However, in order to own a new technology, a company must spend a great deal
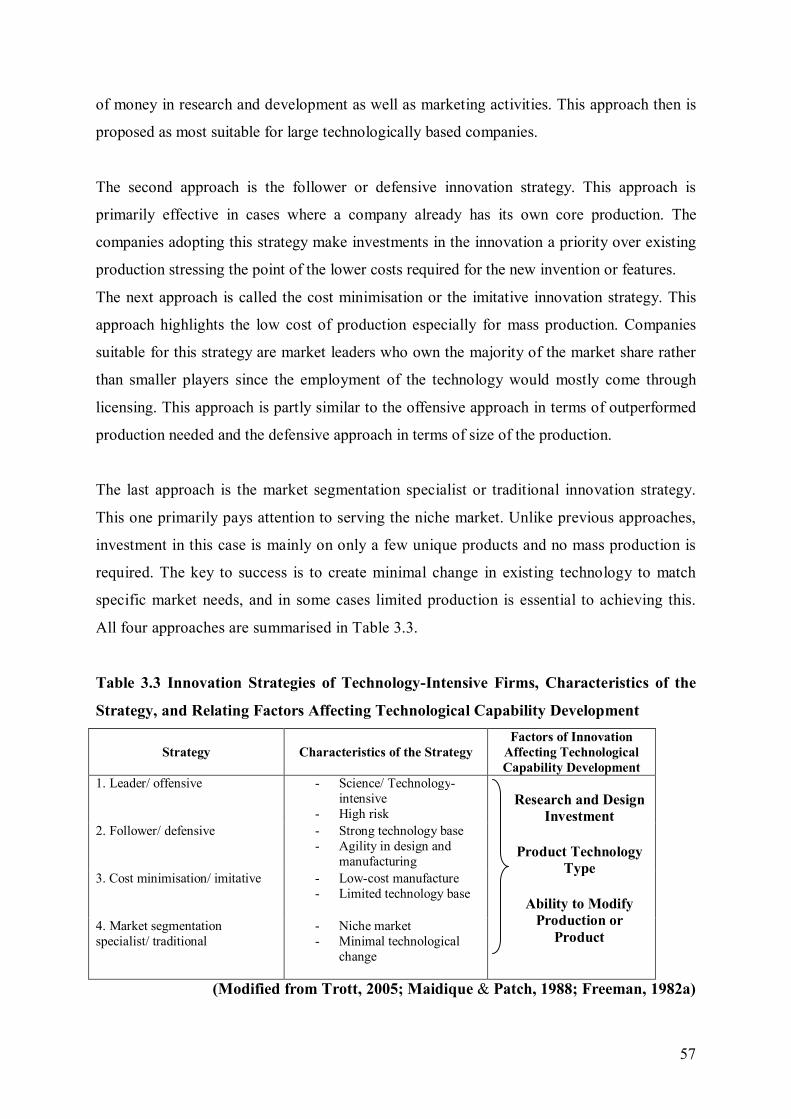
57
of money in research and development as well as marketing activities. This approach then is
proposed as most suitable for large technologically based companies.
The second approach is the follower or defensive innovation strategy. This approach is
primarily effective in cases where a company already has its own core production. The
companies adopting this strategy make investments in the innovation a priority over existing
production stressing the point of the lower costs required for the new invention or features.
The next approach is called the cost minimisation or the imitative innovation strategy. This
approach highlights the low cost of production especially for mass production. Companies
suitable for this strategy are market leaders who own the majority of the market share rather
than smaller players since the employment of the technology would mostly come through
licensing. This approach is partly similar to the offensive approach in terms of outperformed
production needed and the defensive approach in terms of size of the production.
The last approach is the market segmentation specialist or traditional innovation strategy.
This one primarily pays attention to serving the niche market. Unlike previous approaches,
investment in this case is mainly on only a few unique products and no mass production is
required. The key to success is to create minimal change in existing technology to match
specific market needs, and in some cases limited production is essential to achieving this.
All four approaches are summarised in Table 3.3.
Table 3.3 Innovation Strategies of Technology-Intensive Firms, Characteristics of the
Strategy, and Relating Factors Affecting Technological Capability Development
Strategy Characteristics of the Strategy Factors of Innovation
Affecting Technological Capability Development
1. Leader/ offensive - Science/ Technology-intensive
- High risk
Research and Design
Investment
Product Technology Type
Ability to Modify
Production or Product
2. Follower/ defensive - Strong technology base - Agility in design and
manufacturing 3. Cost minimisation/ imitative - Low-cost manufacture
- Limited technology base
4. Market segmentation specialist/ traditional
- Niche market - Minimal technological
change
(Modified from Trott, 2005; Maidique & Patch, 1988; Freeman, 1982a)
58
3.7.3 Factors in Innovation Strategies Affecting Technological Capability Development
For each of the strategies discussed in Section 3.7.2, there are implications in terms of the
capabilities required. When it comes to operationalising the process of innovation, this
invariably involves considering the technology position of the firm. Hence, the innovation
strategy is usually implemented through technology management.
In Table 3.3, all factors regarding innovation strategies and having an effect on technology
capability development are presented. The leader or offensive innovation approach involves
an emphasis being placed on a company’s spending money on research and development in
order to own a new technology. Thus, “investment in research and design” tends to be a
significant factor in technological capability development. In addition, Prajogo and Sohal
(2006) found that both R&D management and technological level showed a significant
relationship with innovation performance.
Secondly, as the follower or defensive innovation strategy is primarily effective in cases
where a company already has its own core production, types of product are a possible
influencing factor. Hobday et al. (2004) claims that it is the “type of product” that is the
major factor in the dissimilarity of innovation strategies between firms. In automotive
production, for example, most of the production line relies on several kinds of high
technology applications. The product technology types in this study are categorised into five
groups as follows:
1) Simple fabrication primarily using borrowed technology: This product technology type
is simple. Low technologies are applied in the production lines.
2) Replacement Equipment Manufacturer (REM): REMs include the producers of spare-
parts used in auto service centres. REM tires, for example, can be used to replace the
original tires for a given vehicle.
3) Original Equipment Manufacturer (OEM): OEMs are the industry's brand name auto
manufacturers, and include companies such as Toyota, Volkswagen, Ford, General
motors, Hyundai, Honda and Mitsubishi, etc. OEMs constitute federally licensed
entities whose products must be under warranty and/or guaranteed. The term OEM
also refers to component brands used in automaker’s particular vehicles.
59
4) Original Designed Manufacture (ODM): Suppliers provide design as well as
manufacturing services and this design element offers creative minds as well as skilful
workers. ODM producers can put original projects in place and present design
proposals to potential buyers. These producers retain the intellectual property rights
of their designs until they are purchased by buyers.
5) Own Brand Manufacture (OBM): OBM necessitates the promotion by manufacturers
of their registered trademarks and the development of brand recognition using
marketing know-how.
Thirdly, a cost-minimisation or imitative strategy exercises strict control over costs, avoids
unnecessary marketing and innovation costs, and reduces prices for basic products (Robins &
Judge, 2008). Lastly, with regard to the market segmentation specialist strategy, the key to
success is to create at least a minimal change in existing technology in order to match specific
market needs. The company focuses not only on making technology work, but also on
maintaining its advantage through Kaizen, which is a continuous improvement process
(Kruger, 1996). For this reason, “the ability to modify production and product” is
categorised as a factor influencing technological capability.
In summary, the factors of innovation strategies which affect technological capability
development are: 1) investment in research and design, 2) product technology type, and 3)
ability to modify production and product.
3.8 Important Concepts of Organisation
Organisation is one of the key concepts suggested by various researchers to have effects on
technological development (see Table 3.2). An organisation is defined as a social group
operating to reach one or more common goals (Robbins, 2005). In this study, the organisation
is regarded as a dynamic unit and by virtue of its nature it is subject to a process of
transformation and change. The process of growth and technological capability development
in a firm is highly conditioned by the efforts of owners as well as the systematic
accumulation of manpower skills, knowledge, and reliable access. In this section, the
following topics which are expected to have an effect on technological capability
development are reviewed.
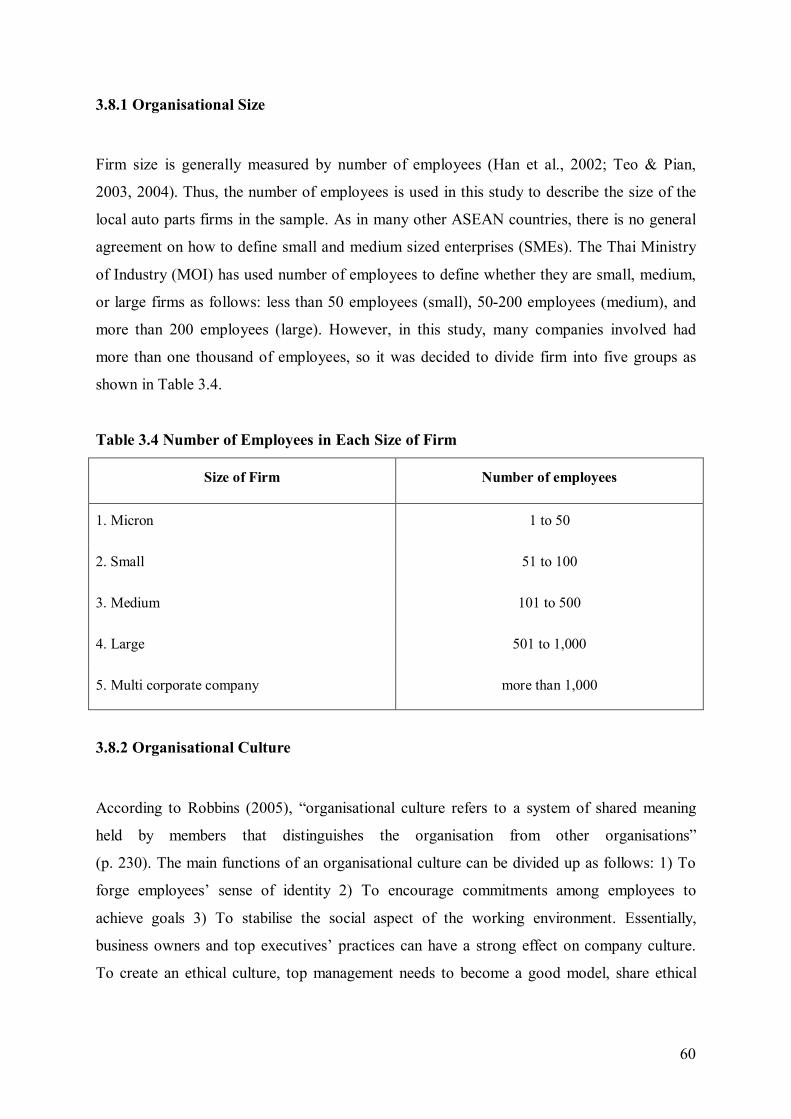
60
3.8.1 Organisational Size
Firm size is generally measured by number of employees (Han et al., 2002; Teo & Pian,
2003, 2004). Thus, the number of employees is used in this study to describe the size of the
local auto parts firms in the sample. As in many other ASEAN countries, there is no general
agreement on how to define small and medium sized enterprises (SMEs). The Thai Ministry
of Industry (MOI) has used number of employees to define whether they are small, medium,
or large firms as follows: less than 50 employees (small), 50-200 employees (medium), and
more than 200 employees (large). However, in this study, many companies involved had
more than one thousand of employees, so it was decided to divide firm into five groups as
shown in Table 3.4.
Table 3.4 Number of Employees in Each Size of Firm
Size of Firm Number of employees
1. Micron 1 to 50
2. Small 51 to 100
3. Medium 101 to 500
4. Large 501 to 1,000
5. Multi corporate company more than 1,000
3.8.2 Organisational Culture
According to Robbins (2005), “organisational culture refers to a system of shared meaning
held by members that distinguishes the organisation from other organisations”
(p. 230). The main functions of an organisational culture can be divided up as follows: 1) To
forge employees’ sense of identity 2) To encourage commitments among employees to
achieve goals 3) To stabilise the social aspect of the working environment. Essentially,
business owners and top executives’ practices can have a strong effect on company culture.
To create an ethical culture, top management needs to become a good model, share ethical
61
goals, give training programs, set rewards and punishment, and get feedback (Robbins,
2005).
It takes long period of time to develop a culture. As a result, culture is quite hard to change.
Robbins (2005) though notes four situations that can create cultural changes as follows.
1) A crisis: The crisis can be either external or internal, such as a financial crisis or a
reduction in sales of a major product. Top management can also create crises in
organisations to eliminate unwanted cultures.
2) Change of leader: A new CEO from outside can be a big opportunity for change in
organisational cultures. Many companies can use this practice effectively.
3) New and small companies: Top executives in a smaller company can change company
cultures easier than those in a large one.
4) Weak culture: A company with a weak culture has a better chance of changing it.
In the Thai automotive industry, the organisational culture can be shifted after the creation of
a joint venture or the changes of top management. “The nationality of the company
ownership” represents the organisational culture in this study. The reason is presented in
Section 3.10.2.
3.8.3 Organisational Life Cycle
Along with the stages of organisational development, the issue of the organisational life cycle
is of concern. Firms, like human beings, begin, grow, mature, and pass away eventually.
Boulding (1956) pointed out that organisations exhibit more complexity than living
organisms and several scholars have proposed models to explain this (e.g. Greiner, 1972;
Quinn & Rohrbaugh, 1983; Daft, 2010). Quinn and Rohrbaugh (1983) introduced a model for
the organisational life cycle which can be classified into four stages:
1) Creativity and entrepreneurship: Important at this first stage are reasons for investing,
marshalling of resources for survival, innovation, concentration on input activities, and
a need for leadership (Daft, 2010).
2) Collectivity: Due to a need for delegation (Daft, 2010), the emphasis here is on
cohesion and communication. High member commitment, personalised leadership,
62
morale and cohesion gain increasing relevance in the organisation, and the human
relations model therefore becomes increasingly important.
3) Formalisation and control: Here, the emphasis is on control, stability and production
efficiency.
4) Structural elaboration and adaption stage: As the organisation becomes too rigid, the
emphasis is placed upon flexibility in dealing with the changing environment. Thus,
this and domain expansion become a growing concern.
In this study, to increase the growth of the organisation throughout its life cycle, the initial
stage tends to be critical. One criterion for investment that needs to be studied at this stage is
the “reasons for investing in the industry type.” Founders might need research conducted
as needs analyses in order to help them increase their confidence in building and developing
their organisations.
3.9 Organisational Learning Theory and Concepts
This section on organisational learning demonstrates organisational learning theory, the
characteristics of organisational learning and organisational intelligence.
3.9.1 Organisational Learning Theory
Organisational learning can be defined as an organisation’s capability to create, acquire, and
transfer knowledge, and to modify its behaviour accordingly (Hall, 1995). Kessler et al.
(2000) make a distinction between two kinds of organisational learning processes in the
technology management context i.e., internal and external learning. According to Simon
(1991) the internal learning process begins with individuals creating and utilising technology
whereas the external learning process begins with the identification of knowledge created
externally to the organisation. Although internal and external learning involve trade-offs
(Bierly & Chakrabarti, 1996), both types of learning form an integrated whole in the process
of organisational learning.
Organisational learning theory refers to three stages in the learning process (Huber, 1991;
Balasubramanian, 1994). Data acquisition forms the initial stage. Companies obtain a
63
“memory” of legitimate action-outcome linkages, the environmental conditions in which they
occur, the outcome probabilities, and any uncertainty around those probabilities. These linkages
then change over time as new evidence allows for additions or rejections, or a strengthening of
the links. Interpretation is the next stage. According to Maira and Scott-Morgan (1997),
organisations continually make comparisons between actual and expected results to
supplement their “memory”. Unforeseen results can be examined allowing for adaptations to
be undertaken, or for new action-outcome links to be determined as necessary. The third
stage then is adaptation/action. The firm uses the new knowledge to decide on which action-
outcome links are right for the new conditions and acts accordingly (Merriam & Caffarella,
1999).
In this study, reviews of the relevant literature were analysed and synthesised and suggest
that The ability of Thai suppliers to leverage knowledge obtained through organisational
learning results from technology transfer which specifically measures how they acquire,
assimilate, transform, and utilise new information, resulting in both knowledge and
competitive advantages.
3.9.2 Characteristics of Organisational Learning
Organisational learning treats learning as a continuous process of development which is
fundamental to business success (Armstrong & Baron, 1998). It aims to bring about a
systematic learning environment in a company where knowledge is captured and transferred
for the benefit of an organisation, its employees, its customers, and its stakeholders.
Organisations successful in creating such an environment seem to be better at developing
novel ideas, problem solving, learning from their experiences and transferring new initiatives
and innovations to their organisations. Dufficy (2001) emphasised the importance of the
development of employees and technological capability in enabling organisations to survive
in the present industrial era. The three main perspectives of organisational learning are as
follows:
1) Learning Involves Changes: Organisational learning can be conceptualised as involving
changes in an organisation either in action or in knowledge. Dodgson (1993a) who integrated
and synthesised a number of studies on organisational learning maintains that learning is seen
64
as a deliberate undertaking to improve productivity, competitiveness (see also Arrow, 1962),
innovation, (see also Dodgson, 1991; Loveridge & Pitt, 1990), and new product introduction
(see also Maidique & Zirger, 1985).
2) Learning as an Information-Oriented Process: Organisational learning can be explained as
a process of knowledge or message acquisition, dissemination, interpretation, storage, and
utilisation. Organisational learning is an evolving process that over time leads to the
improvement and expansion of knowledge (Sinkula, 1994; Huber, 1991; Daft & Huber,
1987).
3) Learning as an Experience Oriented Process: Researchers have suggested that learning is
embedded in cultural norms, work routines, and shared practices rather than in an
individual’s mind. Beliefs and skill sets are explained as residing in the interactive practices
and understandings of organisational subgroups (Rosenberg, 1982). Arrow (1962)
characterised learning as coming from the development of increased skills from using new
process technologies in manufacturing as learning by doing results in lower labour costs.
This study focuses on the first and third characteristics of organisational learning, which are
learning involving changes and learning as an experience oriented process respectively.
Assemblers and suppliers attempt to improve their productivity and create innovation, and at
the same time, these approaches can drive organisational learning. Executives in these
companies can enhance the learning process by creating an innovative environment among
their employees. In addition, organisational learning can take place during interactions among
employees performing daily tasks and after the installation of new technologies. Acquiring
knowledge and technologies by various methods, such as in-house training and overseas
training, can create short-cuts in the organisational learning process. Therefore, in this study,
the factor “acquiring knowledge and technologies” is directly linked to organisational
learning.
3.9.3 Organisational Intelligence
As we know, tacit knowledge is difficult for an organisation to integrate in a short period of
time. Related to organisational learning, organisational intelligence represents an
organisation’s ability to interpret, invest and manipulate in a purposive, goal-oriented way
65
with a view to increasing its adaptive potential in its environment (Glynn, 1996). Simply
speaking, an organisation in which organisational intelligence is embedded involves not only
the process of learning but also emphasises how to learn correctly from experience.
Organisational intelligence might connect to an organisation’s distinctive competence, which
according to Lin (2003) is its set of “differentiated technological skills, complementary
assets, and organisational routines and capacities used to create sustainable competitive
advantage” (Burgelman et al., 1996: 34). Furthermore, Grant (1991) claims it can refer to
intelligence and specialised capabilities which are integrated with functional capabilities
including R&D, marketing and manufacturing. Organisational intelligence can thus be seen
as a basis for competitive advantage.
To achieve their goals, top management needs to develop all of a company’s capabilities and
invest in accumulating new knowledge and installing modern technologies appropriate to
changes in its business environment. According to the organisational intelligence concepts
above, a company exhibiting organisational intelligence can “acquire the right knowledge
and technologies” to improve company competency.
3.10 Factors in Organisations and Organisational Learning Affecting Technology
Capability Development
The key concepts of organisation and organisational learning relate to the factors of size of
the company, nationality of ownership, the reasons for investing in the industry type, and
methods of acquiring technology, which affect technology capability development as has
been shown by other researchers as outlined below.
3.10.1 Size of Company
Many research papers have demonstrated the relationship between company size and
technological capability development. Supporting this idea is the fact that small firms have
more environmental barriers against technology transfer than larger firms including lack of
financial support and technological expertise (Dewar & Dutton, 1986). Larger firms, on the
other hand, appear to employ more employees with such expertise (Alpar & Reeves, 1990).
66
Han et al. (2002) indicated that firms with more employees may give more priority to
investment in technology. The size of a company is therefore expected to be a cause of the
development of technological capabilities.
3.10.2 Nationality of Ownership
Studies in both Thai and foreign contexts have shown that the nationality of owners has an
impact on technology capabilities. Also, nationality of ownership of firms appears to have an
influence on “organisational culture”, which is reflected in the difference in organisational
management practices in new technology implementation (Peter et al., 1999; Yavas &
Rezayat, 2003). Burn et al. (1993) and Straub (1994) discovered that the adoption and use of
technology transfer depend strongly on the organisational culture on which nationality of
ownership has an influence. Similarly, Vimoktanon and Piyawan (1994) who conducted
research on the issue in Thailand found that both the organisational and the owners’ culture
were significant factors affecting the adoption of technology in an organisation. Thus, it
could be concluded that the nationality of company ownership is a factor in technological
capability development.
3.10.3 Methods of Acquiring Technology
Developing technological capabilities in organisations can be seen as a goal of organisational
learning. It is confirmed in Section 3.9 that the process of acquiring new knowledge and
technologies is a key initial element in organisational learning and organisational intelligence.
The researchers discussed below have tended to see methods of acquiring technology as
affecting technological capability development.
Technology acquisition, according to several researchers in the field, (e.g. Kim & Ro, 1995;
Narayanan, 1998; Cho & Yu, 2000; Okazaki, 2005) can be described as a process of
premeditated technology importation not yet mastered by the firm, the application of which
offers users economic benefits. It is of course important that the firm choose the appropriate
method or channel for acquiring this technology (Chesbrough, 2006). In this study, channels
for technology acquisition are classified into the above six groups (see Table 3.5) based on
the difficulty of technology transfer (Contractor & Lorange, 1988).
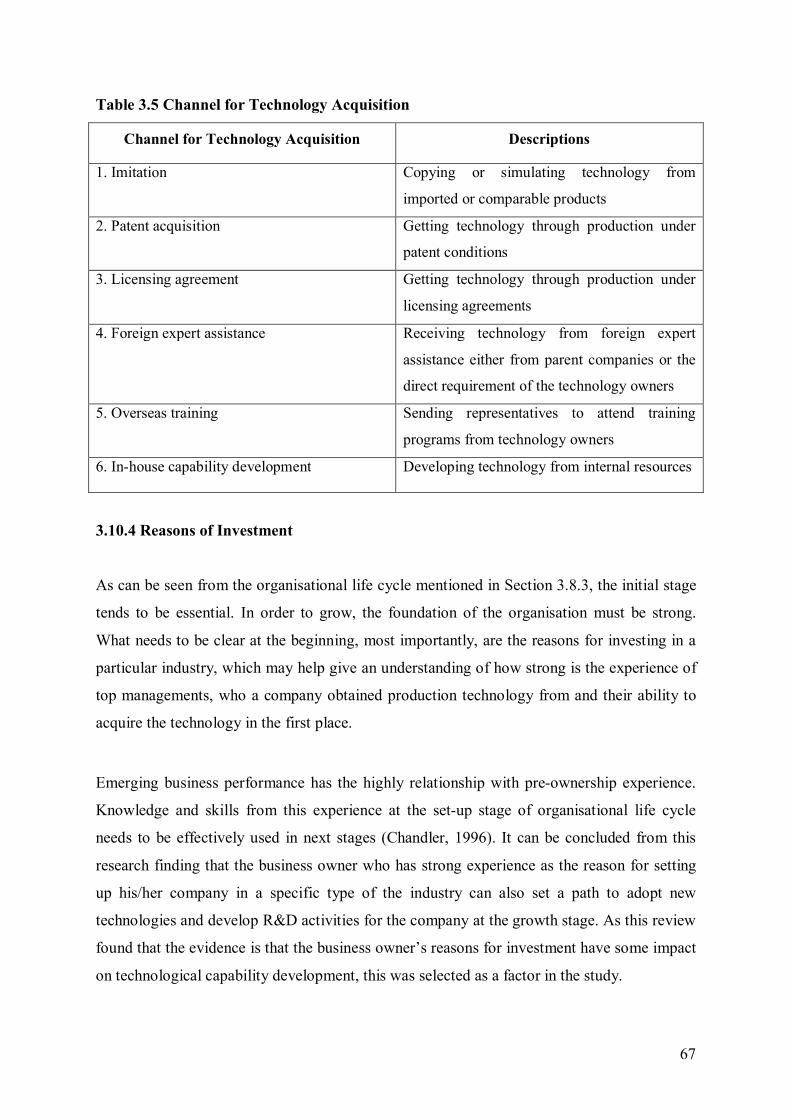
67
Table 3.5 Channel for Technology Acquisition
Channel for Technology Acquisition Descriptions
1. Imitation Copying or simulating technology from
imported or comparable products
2. Patent acquisition Getting technology through production under
patent conditions
3. Licensing agreement Getting technology through production under
licensing agreements
4. Foreign expert assistance Receiving technology from foreign expert
assistance either from parent companies or the
direct requirement of the technology owners
5. Overseas training Sending representatives to attend training
programs from technology owners
6. In-house capability development Developing technology from internal resources
3.10.4 Reasons of Investment
As can be seen from the organisational life cycle mentioned in Section 3.8.3, the initial stage
tends to be essential. In order to grow, the foundation of the organisation must be strong.
What needs to be clear at the beginning, most importantly, are the reasons for investing in a
particular industry, which may help give an understanding of how strong is the experience of
top managements, who a company obtained production technology from and their ability to
acquire the technology in the first place.
Emerging business performance has the highly relationship with pre-ownership experience.
Knowledge and skills from this experience at the set-up stage of organisational life cycle
needs to be effectively used in next stages (Chandler, 1996). It can be concluded from this
research finding that the business owner who has strong experience as the reason for setting
up his/her company in a specific type of the industry can also set a path to adopt new
technologies and develop R&D activities for the company at the growth stage. As this review
found that the evidence is that the business owner’s reasons for investment have some impact
on technological capability development, this was selected as a factor in the study.
68
3.11 International Strategic Alliance
The types of strategic alliance can be classified from a lower to a higher level of dependence.
Two parties who want to create a strategic alliance need to share the benefits. While the MNE
party has strong technological techniques and production skills, the local party can access
many channels of the target market. Relying on both parties’ strengths means sustainable
growth of the alliance.
3.11.1 Creation of International Strategic Alliances
International Business discipline is driven by the theory of Foreign Direct Investment (FDI)
which Hymer (1960, 1968) is the first contributor to, and the product cycle model of Vernon
(1966). This model explains a process of international trade and foreign production. In the
meantime, Hymer’s (1960, 1968) theory of FDI suggests that FDI involves not only the
finance capital but also the packaged transfer of technology, entrepreneurship and
management skills. The gaining control of an enterprise will ensure the safety of international
investment and will enable the investor to exploit the foreign market in which he/she is
investing. Firms pursue FDI because they possess some advantages over local firms. For
instance, they show product differentiation, and have special market skills as well as patented
or unavailable technology; consequently, they are hesitant to share that special knowledge
(Kindleberger, 1969).
International strategic alliance, which is an FDI approach is “an informal or formal
arrangement between two or more companies with a common business objective” and is a
way for MNEs to internalise production and keep know-how confidential (Czinkota et al,
2005). From the perspective of market imperfections, Buckley & Casson (1976) the FDI
theory can be extended to include ‘internalisation’ emphasising four groups of factors i.e.,
firm-specific, industry-specific, region-specific, and nation-specific. Firm-specific factors
include management and technical knowledge. Industry-specific factors include product and
structural factors. Nation-specific factors include political aspects. Region-specific factors
include cultural aspects. Rugman (1986) concluded that the internalisation theory is at the
core of MNE theory.
69
Additionally, Dunning (1998) argues that the motive for international alliances is to assist
firms in globalising their value chain. Porter’s (1998) value chain framework and his concept
of five competitive forces (1980) help to isolate alliances by type. In the value chain, made up
of support activities which include firm infrastructure, HRM, technological development, and
primary activities which include marketing, sales and logistics, the great majority of alliances
are confined to technology, operations (production agreements) and marketing activities
(Burton & Saelens, 1989).
3.11.2 Terms and Types of International Strategic Alliances
Scholars in the field of International Business view strategic alliances as a temporary
mechanism for the expansion of multinational enterprises (Osborn & Hagedoorn, 1997;
Beamish, 1988; Contractor & Lorange, 1988). However, studies on the topic of strategic
alliances still lack consensus in the usage of the term “strategic alliance” (Simonin, 1991).
Alliances vary by defined purpose (Hergert & Morris, 1988), time frame, and type. Various
terms are used to describe strategic alliances, for instance, cooperative ventures (Buckley &
Casson, 1988), cooperative arrangements (Contractor & Lorange, 1988), international
cooperative arrangements (Root, 1988), cooperative agreements (Barney, 1997), cooperative
inter-organisational relationships (Hall, 1996; Ring & Van de Ven, 1994), strategic alliances
(Lei, 1997; Czinkota, Ronkainen, & Moffett, 1994; Hill, 1994; Killing, 1983; Berg, Duncan,
& Friedman, 1982; Pate, 1969), global strategic alliances (Oh, 1996; Burgers, Hill, & Kim,
1993), international strategic alliance (Burton & Saelens, 1989), cross-border strategic
alliances (Dunning 1997), competitive alliances (Revesz & Cauley, 1986), coalitions (Porter
& Fuller, 1986), international corporate linkages (Auster, 1987), international collaborative
ventures (Sarkar, Cavusgil, & Evirgen, 1997), and partnerships (Root, 1988). To eliminate
confusion, in this study the concept of “international strategic alliance” replaces all of
these terms.
International strategic alliances can also be classified as equity or non-equity alliances.
Equity alliances entail transferring or creating equity ownership through direct investment or
equity joint ventures. Non-equity alliances do not usually exhibit these characteristics.
70
MNEs employ multiple methods of creating international strategic alliances. Contractor &
Lorange (1988) hypothesise a classification of international strategic alliances based on inter-
organisational dependence. Ranking from a lower to a higher level of dependence,
international strategic alliances include agreements concerning technical training and start-up,
production, assembly and buyback, patent and know-how licensing, management and
marketing, joint ventures, mutual non-equity agreements, and development partnerships
(Pucik, 1992).
3.11.3 Types of Ownership in Thai Business
Research has indicated that the form of chosen alliances is an important element in
determining their success and their ability to meet the objectives of participating firms
(Harrigan, 1988; Rugman, 1981).
Strong foreign involvement has significantly aided performance in the Thai automotive
industry. Three “types of ownership” of companies can be theoretically distinguished: Thai
owned, foreign owned, and joint ventures. Japanese and American automobile assemblers
have dominated the industry as Thailand has developed as a key base for international
automakers. Management practices including teamwork, leadership and HR management
which lead to technology investment can differ depending on ownership type as mentioned in
Section 3.10. Moreover, the difference in the alliance ownership structure affects at least
some aspects of knowledge acquisition (Lyles & Salk, 1997).
3.11.4 Strategic Alliance with Management Issues
Good governance, transparency and accountability are crucial to international strategic
alliances, but at the same time, they must be agile and flexible enough to support new
innovation and technology (IAC, 2010). As government and the private sectors in a country
are managed separately, and even countries have different policies, there is a lack of co-
ordination in the policy sphere. In order to bridge the gap, a number of overarching themes
emerge as follows:
1) Cultural issues: Many of the problems and misunderstandings in alliances have their roots
in cultural differences that exist at both the national and the organisational levels (Datta,
71
1991). Price (1996) notes that organisations that possess dissimilar technological skills and
resources are likely to encounter information transmission difficulties. The collaborators may
have sharply different views on the widespread sharing of technology. Researchers suggest
that firms with similar capabilities are more likely to belong to a common technological
community (Powell et al., 1996). Compatible philosophies between partners facilitate
reduced conflict and the positive resolution of any remaining conflict (Sarkar et al. 1997).
2) Receptivity: Hamel (1990) defines receptivity as the capacity of organisations to learn
from their partners. Likewise, Cohen and Levinthal (1990) describe absorptive capacity as the
ability of a firm to recognise the importance of new information, integrate it, and apply it
commercially. To be a collaborator in international strategic alliances, a firm’s internal assets
must be involved (Powell, Koput, & Smith-Doerr, 1996). Lyles and Salk (1997) discovered
evidence that absorptive capacity influences the degree of knowledge acquisition. Yamaguchi
(1994) surveyed four joint ventures in Thailand and eight joint ventures in Taiwan in their
study of cross cultural technology transfer. The results suggest that a lack of capacity to
receive technology was the dominant reason for low absorption.
3) Trust: Trust provides material incentives for cooperation (Hill, 1990). Just as trust can
exist between individuals, with expectations of behaviour on both sides, it can also exist
between organisations because individuals manage inter-organisational relationships
(Hosmer, 1995). Trust between alliance partners has been recognised as an important
ingredient in establishing cooperative relationships (Gulati, 1995; Madhok, 1995; Badaracco,
1991). Trust in inter-firm relationships includes a set of expectations between partners about
the behaviour of each and about the anticipation that each will fulfil its perceived obligations
(Madhok, 1995; Inkpen, 1997; Thorelli, 1986), and also refers to the mutual confidence that
vulnerabilities will not be exploited by the other partner (Barney & Hansen, 1994).
4) Prior Ties: Evidence exists that alliances with previous ties may do better than others.
Firms, who have cooperated in the past, tend to have at least a basic understanding of each
other’s capabilities and skills (Heide & Miner, 1992) and the partners may be committed to
each other on the basis of their prior relationship (Inkpen & Beamish, 1997). Partners’ early
experiences with each other may have lasting consequences for the success of their joint
efforts (Gray & Yan, 1997). Moreover, some studies on factors related to alliance
terminations suggested that alliances between firms with such ties are less likely to
72
disintegrate (Kogut, 1989). The duration of exchange relationships may also be led by dyadic
attachments (Seabright, Levinthal & Fichman, 1992; Levinthal & Fichman, 1988). Therefore,
having prior experience is a ‘reason for investment in the industry’ at the initial stage of the
organisational life cycle.
3.12 Factors Related to International Strategic Alliance Affecting Technological
Capability Development
From the literature review of international strategic alliances above, it can be seen that type of
ownership is of major importance. Local business owners can either set up a business as a
single owner or create a joint-venture with a multinational company. The type of ownership
can determine whether the business is successful or unsuccessful in the long term because the
types of ownership mentioned in the section below impact on the development of technology
capabilities. In the Thai automotive industry, the relationships between automakers and
suppliers are crucial. However, these auto-part suppliers are classified by the automakers in
terms of their skilfulness levels and receive different kinds of hiring contracts. First-tier
suppliers who have high skills can obtain an exclusive contract while second-tier suppliers
can only obtain a general contract. As a result, automakers tend to initially transfer
technologies exclusively to these first-tier suppliers. Interestingly, the positive relationship
between levels of contracts and the development of technology capabilities is revealed in the
research studies in the section below.
3.12.1 Types of Company Ownership
Advantages of international ownership include opportunities to access markets, to experience
technology transfer and to avoid tariffs or quotas. The development of international strategic
alliances leads to various forms of ownership. In this study, types of company ownership
were categorised into five groups: single/family, joint venture, turnkey, licensing, and
franchise, according to Hill (2007). Hill (2007) states that different groups display differences
in commitment, risk, control, and profit potential. For instance, a joint-venture can act as an
entry strategy into a target country in which the partners have shared ownership of a newly-
created business. Although it requires more investment than a licensing agreement, it allows
for the joint shouldering of both financial and political risk. Therefore, the type of company
73
ownership, whether it be single ownership, or joint venture, should be taken into account as a
factor affecting technological capability development.
3.12.2 Ability to Obtain Exclusive Contracts from the Automobile Industry
Obtaining exclusive contracts refers to having a monopoly that would confine the ability to
manufacture specific products to a limited group of producers. These producers would
specialise in producing these products or even have the potential to develop their own
technology on top of existing technology. Additionally, Lin & Saggi (2007) claim that when
suppliers receive an exclusive contract from MNEs, technology transfer can take place.
Hence, the ability to obtain exclusive contracts from the automobile industry should be
considered a factor affecting the development of technological capability.
3.12.3 Ability to Obtain General Contracts to Manufacture for Other Firms
Obtaining general contracts from assemblers is another potential factor that could explain
how a company would develop technological capabilities. When a company obtains general
contracts, the demands of production increase. The company can then install sustainable lines
of production to fulfil orders from the assemblers. It could be concluded, therefore, that the
ability to obtain general contracts to manufacture for other firms is an important factor in
technological capability development (Techakanont, 2011).
To sum up, with regard to the literature review, there are three main issues representing
factors in international strategic alliances (type of ownership, obtainment of exclusive
contracts, and obtainment of general contracts to manufacture) which are assumed to have
significant affects on technological capability development in the Thai automotive industry.
These factors were used as variables in Phase II (See more details in Chapter 7).
74
3.13 Conclusion
This chapter reviewed theories, concepts, and research studies regarding technological
capability and other related topics. Essentially, Table 3.1, the technological capability matrix,
is a guideline for a company to develop technological capabilities through three main areas,
investment, production, and linkage. In this table, technology capabilities are classified into
three levels: basic (sample), intermediate (adaptive), and advance (innovation). Research and
development (R&D) activities are embedded in all of three main areas at the advanced level
of technology capability development. Johansson & Lööf (2008) also notes that R&D
activities are long term and future-oriented in terms of technological development.
Consequently, R&D activities are used as the sole indicator for technological capability
development in this study. In Section 3.5.2, it can be seen that other researchers also use
R&D as the sole indicator.
This study explored technological capability development in the Thai automotive industry.
After various research papers related to technology capabilities are reviewed in Table 3.2, the
study’s key concepts comprising of technology transfer, innovation strategies, organisation,
organisational learning and international strategic alliance are synthesised. Additionally, the
factors involved in these key concepts and having an effect on technological capability
development are examined.
Technology transfer can involve the internalisation process where ideas, knowledge, and
techniques are transferred from supervisors to employees in their teams. In addition,
innovators of modern technologies and experts in various fields outside the organisation can
be the source of transferring technologies. The transfer process is considered successful after
employees are found to have a higher level of knowledge that is potentially employable in the
production process. The factors related to technology transfer: ‘the type of industry’, ‘sources
of component parts’, and ‘needs for foreign technicians or expert assistance’ are expected to
have an effect on technology capability development.
Innovation strategies are strongly related to technology capability (Trott, 2005). In this study,
the factors synthesised that relate to innovative strategies that were ‘product technology
75
type’, ‘ability to modify production or products’, and ‘investment in research and design’.
These factors are expected to have an effect on technology capability development.
A number of topics related to organisation in this chapter: organisational size, organisational
culture, and organisational life cycle were reviewed and discussed. With regard to
organisational learning, the concept that organisations need to effectively share information
throughout business units to move from the stage of individual learning to organisational
learning is established. Organisational learning changes in an organisation either in action or
in knowledge. Essentially, organisational intelligence connecting to the company’s core
competency involves effectively acquiring relevant knowledge and technologies. The four
factors synthesised from the topics of organisation and organisational learning therefore are
size of the company, nationality of ownership, reasons for investing in the industry, and
methods of acquiring technology.
Furthermore, the literature on international strategic alliances presents an overview of this
topic. International strategic alliances come in various forms. Joint-venture agreements are
widely used by global investors, especially in the Thai automotive industry. Two of the main
reasons for creating international strategic alliances are that MNEs can internalise their
production in the target country and not have their secret know-how seized. In addition, to
enhance the success of alliances, top management in all parties needs to be concerned about
the following topics: cultural issues, receptivity, trust, and prior ties. Other research findings
show that the factors of type of company ownership, ability to obtain exclusive contracts, and
ability to obtain general contracts affect technology capability development.
In the next chapter, all key concepts (organisation & organisational learning, international
strategic alliance, technology transfer, and innovation strategies) and all 18 related factors
from this chapter are brought together in the conceptual framework. All factors are tested
statistically in Chapter 7 to determine whether they can remain in the final version of the
conceptual framework.
76
Chapter 4
Development of the Conceptual Framework
4.1 Introduction
This chapter describes the development of the conceptual framework of the research. Before
proceeding with the discussion, Section 4.2 will highlight the domains of knowledge use
comprising of the research context, the literature review, and the Phase I in-depth interviews.
This section also explains the development of the conceptual framework and its components
in order to provide a holistic understanding of the various perspectives involved in the
development of technological capability in Thailand’s automotive industry. This approach
will contribute to the discussions in this and in previous chapters of the study. Section 4.3
demonstrates the rationale for integrating the key concepts identified from the literature
reviews in Chapter 3 with the concept of technology capability development in the Thai
automotive industry. Section 4.4 presents the implementation of the conceptual framework
for automotive manufacturing companies and the government.
4.2 The Development of the Conceptual Framework
The formulation of the conceptual framework (as shown in Figure 4.2) was guided by a
recognition of the domains of knowledge as illustrated in Figure 4.1.
In Figure 4.1, the theories and concepts from Phase I in-depth interview, the literature
reviews and research contexts are presented as three domains of knowledge. To create the
conceptual framework, all essential knowledge concerning the Thai auto-part industry and all
factors causing the development of technological capability were extracted from these
domains. The nexus of these domains is described in sequence as follows: The first domain is
related to Chapter 2 which presents an overview of the present condition of the Thai
automotive industry and also outlines the role of government policies in the development of
the automotive industry from 1960-2009, and the role of the private sector in the same period.
The second domain is related to Chapter 3 which gives details concerning technological
capability development and the key concepts of organisation, organisational learning,
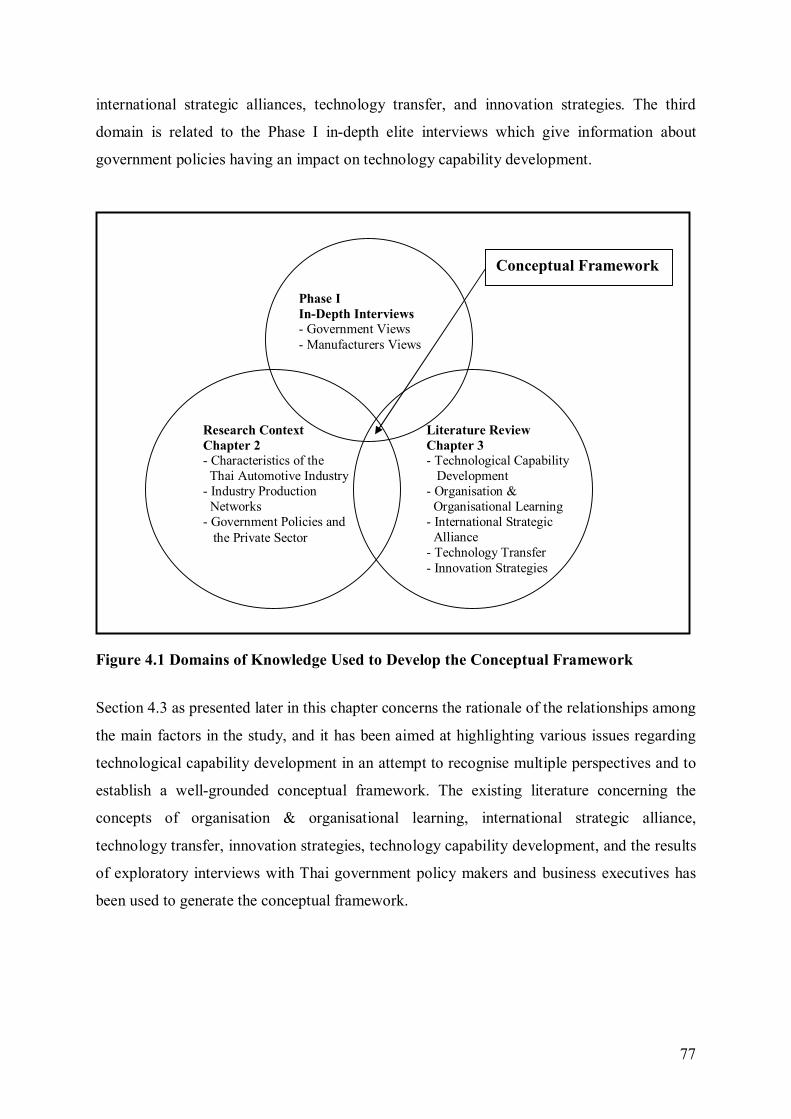
77
international strategic alliances, technology transfer, and innovation strategies. The third
domain is related to the Phase I in-depth elite interviews which give information about
government policies having an impact on technology capability development.
Figure 4.1 Domains of Knowledge Used to Develop the Conceptual Framework
Section 4.3 as presented later in this chapter concerns the rationale of the relationships among
the main factors in the study, and it has been aimed at highlighting various issues regarding
technological capability development in an attempt to recognise multiple perspectives and to
establish a well-grounded conceptual framework. The existing literature concerning the
concepts of organisation & organisational learning, international strategic alliance,
technology transfer, innovation strategies, technology capability development, and the results
of exploratory interviews with Thai government policy makers and business executives has
been used to generate the conceptual framework.
Research Context Chapter 2 - Characteristics of the Thai Automotive Industry - Industry Production Networks - Government Policies and the Private Sector
Literature Review Chapter 3 - Technological Capability Development - Organisation & Organisational Learning - International Strategic Alliance - Technology Transfer - Innovation Strategies
Phase I In-Depth Interviews - Government Views - Manufacturers Views
Conceptual Framework
78
4.2.1 The Use of Phase I as Part of the Creation of the Conceptual Framework
The four key concepts affecting technological capability development were synthesised from
the literature review. The in-depth interviews revealed that Thailand has not yet launched a
national cars project. The government is focusing instead on introducing policies to motivate
various car markers to set up their plants in Thailand. Consequently, Thai business owners
can get involved in auto-part supplying and set up joint ventures with MNE affiliates. Thai
suppliers, to serve the needs of car makers, have to launch R&D activities to improve
production processes to lower costs and produce higher performance products. Suppliers’
R&D strategies however remain relatively undeveloped.
According to expert opinion, Thai government policy is one of the keys to the success of
local auto-part suppliers. High tax rates for importing cars or auto-parts force car makers to
order local parts. When suppliers achieve higher production volumes, they can install modern
machines, modify production lines and products, and launch R&D activities in sequence. In
addition, some incentives can have a direct impact on launching R&D activities or
developing technology among suppliers. R&D tax deduction, for instance, provides tax
benefits for suppliers that take the initiative in R&D programs. To conclude, experts agree
that government policies comprising regulations, taxes, and incentives (shown as factors in
the conceptual framework in Figure 4.2) have an effect on the development of technology
capability in Thailand and on R&D activities.
4.2.2 The Conceptual Framework Concerning the Development of Technological
Capability in the Thai Automotive Industry
From the literature review in Chapter 3, four key concepts can be seen to have an effect on
developing technology capability. These are organisation & organisational learning,
international strategic alliances, innovation strategies and technology transfer. The
relationships between key concepts and the development of technology capability are
presented in Section 4.3.
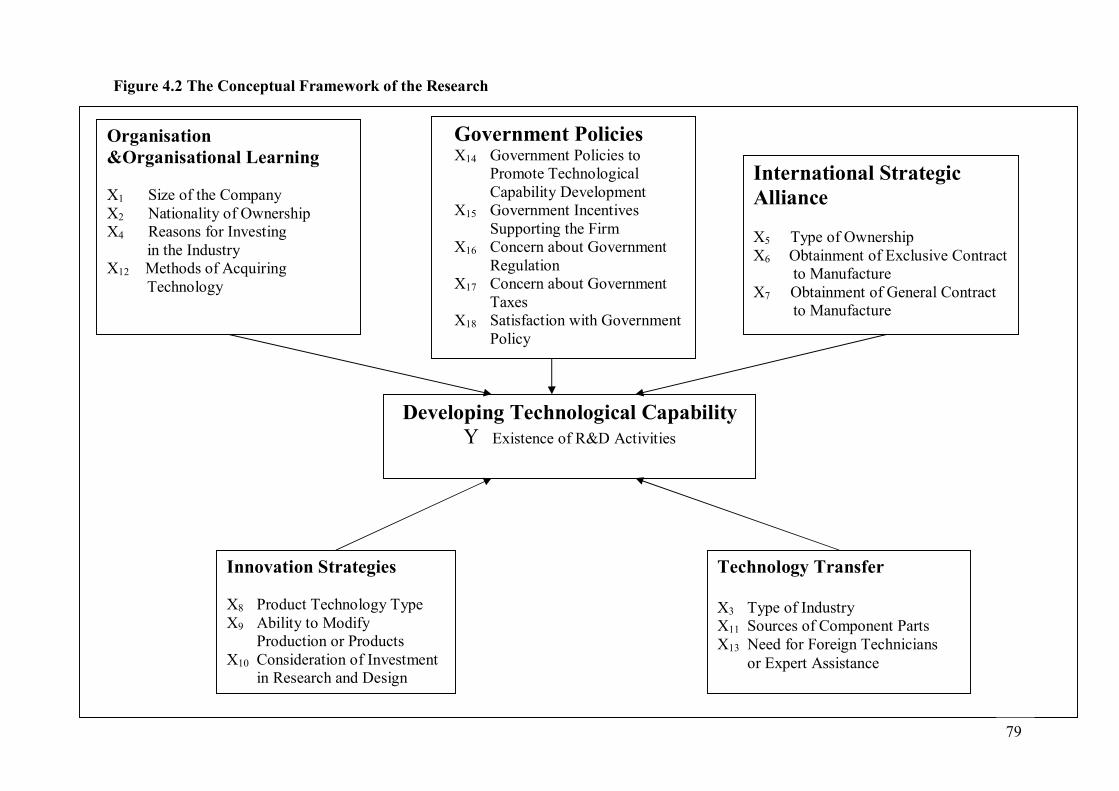
115
Government Policies X14 Government Policies to
Promote Technological Capability Development
X15 Government Incentives Supporting the Firm
X16 Concern about Government Regulation
X17 Concern about Government Taxes
X18 Satisfaction with Government Policy
Organisation &Organisational Learning X1 Size of the Company X2 Nationality of Ownership X4 Reasons for Investing in the Industry X12 Methods of Acquiring Technology
Developing Technological Capability Y Existence of R&D Activities
International Strategic Alliance X5 Type of Ownership X6 Obtainment of Exclusive Contract to Manufacture X7 Obtainment of General Contract to Manufacture
Innovation Strategies X8 Product Technology Type X9 Ability to Modify
Production or Products X10 Consideration of Investment
in Research and Design
Technology Transfer X3 Type of Industry X11 Sources of Component Parts X13 Need for Foreign Technicians or Expert Assistance
Figure 4.2 The Conceptual Framework of the Research
79
80
All four key concepts are essential in the construction of the conceptual framework in Figure
4.2. Moreover, each key concept comprises of related factors established as relevant by other
research and outlined in chapter 3. The conceptual framework comprises of a total of 18
factors presented in the form of the variables X1 to X18. Within the key concept of
organisation & organisational learning, the factors: company size, nationality of ownership,
reasons for investing in the industry, and methods of acquiring technology are included, and
are denoted X1, X2, X4, and X12 respectively. Other key concepts are similarly subdivided.
The new key concept of government policies is also included as being an important factor in
the development of technologies in the Thai automotive industry. This claim is supported by
evidence from Phase I (in-depth expert interviews). As Thailand has no national car brand
most Thai companies operating in the automotive industry are auto-part suppliers.
Consequently, Thai suppliers depend on production orders from foreign car makers. The role
the Thai government plays in terms of its policies and regulations is an important
consideration for MNEs or foreign business owners intending to set up their plants in
Thailand. The Thai government has in fact been a crucial factor in the success of the industry
over the past decade.
4.3 Rationales for Key Concepts in the Conceptual Framework
The relationships between all key concepts and technological capability development have
been presented in Chapter 3. To strengthen these findings, this section gives more evidence
about the effects of these key concepts on technological capability development. Also, the
relationships among key concepts are identified.
4.3.1 The Rationale for Utilising Organisation & Organisational Learning Theory in
Studying Technological Capability Development
Organisations are operated by social groups aiming to achieve one or more shared goals
(Robbins, 2005). Top executives and managerial systems are crucial for accumulating
knowledge and technological skills to accelerate the growth of organisations (see more details
in Section 3.8 of Chapter 3).
81
As explained by Mark Easterby-Smith and Luis Araujo (1999), the concept of organisational
learning has been recognised in the technological development literature for decades, but has
only achieved wide recognition since the start of the 1990s. It might be concluded that both
technical and social perspectives are embedded in organisational learning. Regarding the
development of technological capability, interaction among employees or groups of them
should be emphasised since it is grounded in organisational dynamics. Its effectiveness
relates to communities of practice whereby people in groups share a passion and learn how to
better complete an activity through frequent interaction (Wenger, 2007).
4.3.2 The Rationale for Integrating Technology Transfer, Organisational Learning
Theory, and the Development of Technological Capability
Gaining an understanding of the perceptions towards technology transfer theory is essential in
facilitating the development of technological capability. Some researchers (e.g., Mowery &
Rosenberg, 1998) claim that knowledge and technology are the dominant aspects of today’s
world. Burgelman et al. (1996) describe technology as being composed of skills, artifacts and
theoretical and practical knowledge utilised in the development of products and services
along with their production and delivery systems. Moreover, technology transfer can be seen
as part of the acquirer’s learning process (Fichman & Kemerer, 1997). Technology transfer
within commercial organisations serves the purpose of enabling acquirers to manufacture
particular products or provide particular services. In this way the recipients of transfer both
assimilate knowledge and innovate from it based on learning.
4.3.3 The Rationale for Integrating Organisational Learning and International
Alliances
According to Drucker (1995), the most dramatic change in business activity concerns the
increasing growth partnership-based rather than ownership-based relationships. The argument
concerning an explanatory factor for this trend is that partnerships provide a basis for
organisational learning, allowing partner firms mutual knowledge access (Inkpen & Beamish,
1997; Hamel, 1991; Kogut, 1988; Westney, 1988). Kogut (1988) was the first to specifically
argue that an organisational learning imperative could be a motivating factor behind entry
into joint ventures. There is a growing body of theoretical (Parkhe, 1991; Pucik, 1991; Kogut,
1988; Westney, 1988) and empirical studies (Inkpen, 1995; Inkpen & Crossan, 1995; Hamel,
82
1991; Dodgson, 1993b; Simonin & Helleloid, 1993) addressing alliances as devices for
achieving access to partners’ skills and knowledge (Inkpen & Beamish, 1997) or as
opportunities to learn from partners (Dodgson, 1993b; Ciborra, 1991).
4.3.4 The Rationale for Integrating Innovation and Technology Transfer
Technology transfer and organisational learning cannot fully explain developing
technological capability in the context of the Thai automotive industry. Innovation is another
essential element in technological capability development. With regard to linkages between
technology transfer and innovation, innovation involves the creation of new products;
technology transfer involves the transmission of knowledge of new products into the
production and uses of old products (Gurbiel, 2002). Both of these can be taking place
continually.
4.3.5 The Rationale for Integrating Organisational Learning, Innovation, and
Technology Capability Development
Organisational learning is understood to occur when an organisation selects decision
parameters that lead it to a preferred state after an external shock or disturbance. To date, the
literature on organisational learning is rather eclectic. Little convergence or consensus on the
meaning of the term or the basic nature of the phenomenon has been achieved (Kim, 1993;
Huber, 1991). Interestingly, factors affecting innovation and technology development have
been talked about for decades. With the belief that innovation is the key factor for successful
business, developing countries around the globe have been discussing this issue to find out
how they can successfully develop their own technology as developed countries have. “The
Economics of Innovation”, by Freeman (1982a), points out that innovation is one of the key
strategies in corporate survival and Trott’s (2005) study also highlights the significance of
innovation by saying that it has now almost become cliché.
83
4.3.6 The Rationale for the Importance of Government Policies as a Key Concept in the
Conceptual Framework
The conceptual framework shows that government policies impacting on international
alliances and technology transfer from multinational enterprise (MNE) corporations have
supported the development of technology capabilities in the Thai automotive industry.
Multinational automotive firms dominate the industry in both the government and private
sectors, and have generally been able to operate on their own terms in the open Thai market.
This behaviour of multinationals has been based on, and made possible by, several factors.
First, foreign international automobile companies possess high technology. Their skills and
the technological know-how have given MNEs strong bargaining power with the
government. And although the government has not always given in to their demands, when
the MNEs have been closely united, they have usually been able to push them through. The
limited interference of the Thai government in their activities has helped them to operate in a
relatively unrestrained environment. Essentially, the government has wanted to develop the
automotive industry and, since local firms have lacked the necessary technology, the
government has generally been supportive of, rather than hostile to, these firms entering the
Thai market to create alliances with Thai business owners. This relationship is relevant then
to opportunities for technology transfer.
In addition, the conceptual framework demonstrates that government policies impacting on
organisation & organisational learning, and innovation strategies have aided the development
of technology capabilities in the Thai automotive industry. Thai government policy regarding
the industry has changed from a high to a low level of protection and from more import-
oriented to more export-oriented strategies. Thus, there have been stronger relationships
between Thai businesses and firms from developed countries, and more opportunities to learn
how to create innovation and develop technological capability. Also, the government’s
localisation policy has led to an increase in the number of Thai auto firms, to the point where
they now jointly assert their interests through formal associations. Thai firms are therefore no
longer a passive group and their demands have been reflected in localisation policy, and later
on in liberalisation policy which have strengthened their position particularly in terms of
production capacity.
84
4.4 The Implementation of the Conceptual Framework
The conceptual framework is used to describe the relationships of the development of
technological capabilities with the key concepts of organisation, organisational learning,
technology transfer, international strategic alliance, and innovation strategies from the
literature review and with the new key concept of government policies from the Phase I in-
depth interviews.
The conceptual framework is also used as a guideline for creating the questionnaire (see
Appendix II) for Phase II quantitative data analysis in Chapter 7. The questions in the
questionnaire represent each factor in the conceptual framework. Factors in the conceptual
framework are tested by statistical tools. Only the factors found to be statistically significant
remain in the empirical conceptual framework (see Chapter 9).
The conceptual framework and its significant factors provide information which is then used
in the Phase III in-depth interviews. Phase III involves discussion of these factors and their
effects on developing R&D activities. It also includes expert recommendations about how
these factors can be implemented in practice. The results may be used not only for auto-part
companies to improve their technological capabilities, but also for the government which can
utilise them to inform the issuing and revising of the laws and regulation intended to support
the growth of Thai automotive suppliers.
4.5 Conclusion
Organisation & organisational learning is the first of the five key concepts affecting
technology capability development in the conceptual framework (shown in Figure 4.2). The
organisation’s success depends on top management and managerial practices. Organisational
learning is more effective when employees interact with their supervisor or their colleagues
on a day to day basis. The company can also accelerate the learning process by arranging
training programs or having learning materials or workshops that fit the objectives of the
program. International strategic alliance, the second key concept, can occur in the form of
joint-venture companies. In this way Thai partners can learn modern technologies from
foreign partners. Technology transfer, the third key concept, is a short-cut for local businesses
to improve their technological skills. The diffusion of technologies among Thai suppliers
85
depends on many factors, such as financial support and production advancement. Innovation
strategy, the fourth key concept, is the process of creating new products and tools. It is not
practical for companies to use the same production skills with all kinds of products as auto
parts continuously become more complex.
Thai government policies (as the fifth key concept from Phase I) depend on the stand point of
Thailand being a regional hub of the automotive business supporting the operations of MNEs
and local suppliers. From the Phase I in-depth interviews, it is clear that CKD, CBU, and
LCR regulations have had strong indirect effects on technological advancement in the early
years of the Thai automotive industry. At present, Excise taxes and R&D tax deductions are
the government policies with the most significant impact on the development of technology
capabilities. The most important benefit of these policies for Thai suppliers is that MNEs
procure local parts. To survive in this fiercely competitive industry, Thai suppliers need to
improve their process control and product design. Having many local sources of high-quality
auto-parts, MNEs need to supervise suppliers in their network on production techniques and
need to support R&D activities.
The conceptual framework is used to demonstrate all 18 factors, which are extracted from
three domains of knowledge and described in Chapter 3, and are expected to have an effect
on technological capability development. Although the use of this framework is presented in
this chapter, it is not to be considered of practical value until all factors (variables) pass the
statistical test in Chapter 7. The reason for this is that Thailand may be different in several
respects from other countries. The selected statistical tools are used to test whether or not
these factors (the independent variables) have a casual relationship with the development of
technological capability (the dependent variable). The final version of the conceptual
framework is called “the empirical conceptual framework” and is shown in Chapter 9.
86
Chapter 5
Research Methodology
5.1 Introduction
The previous chapter developed a conceptual framework to assist with the analysis of
Thailand’s automotive industry which provided a unique vantage point from which to view
the process of technological capability development. Phased research is adopted as the
research methodology with each phase highlighting issues that need to be focused on in
subsequent phases. The research questions presented in Section 1.2 in Chapter 1 and the
conceptual framework direct the form of the three phases of the research design (see Figure
5.1). As Miles and Huberman (1994) and Robson (1993) state, the conceptual framework
which presents the system of concepts, assumptions, expectations, and theories supporting the
research is a key part of the research design (c.f. Maxwell, 1996).
In this study, the research was designed as indicated in Figure 5.1. First of all, after the purposes
of the study were stated, the literature involved was reviewed, and critiqued. Then the conceptual
frameworks were generated. This led to the addressing of the research questions. Then, data were
collected and analysed based on the phase they were placed in.
This study was conducted in three different phases using the mixed research method. Phase I
which employed the qualitative method was undertaken first to reveal government policies
supporting the automotive parts industry. Then Phase II and Phase III using quantitative and
qualitative methods respectively were employed in order to validate and triangulate the
factors thought to cause technology capability development in the industry. Two forms of the
mixed research method were applied with these three phases. The first, the sequential approach,
of Phase I and II can be classified as “qual -> QUAN” exploratory design (Borrego et al.,
2009). This involved Phase I providing a guide for the Phase II research, which expanded on
Phase I. The second design, the sequential approach of Phase II and III can be classified as
“QUAN -> qual” explanatory design (ibid.). In this case, Phase II was explained by Phase III.
The details of these designs and rationales for alternative mixed method research approaches
are presented in Section 5.5.3. The mixed research method has its strengths as presented in
Table 5.9 in Section 5.5.2. The details of each phase are outlined below.
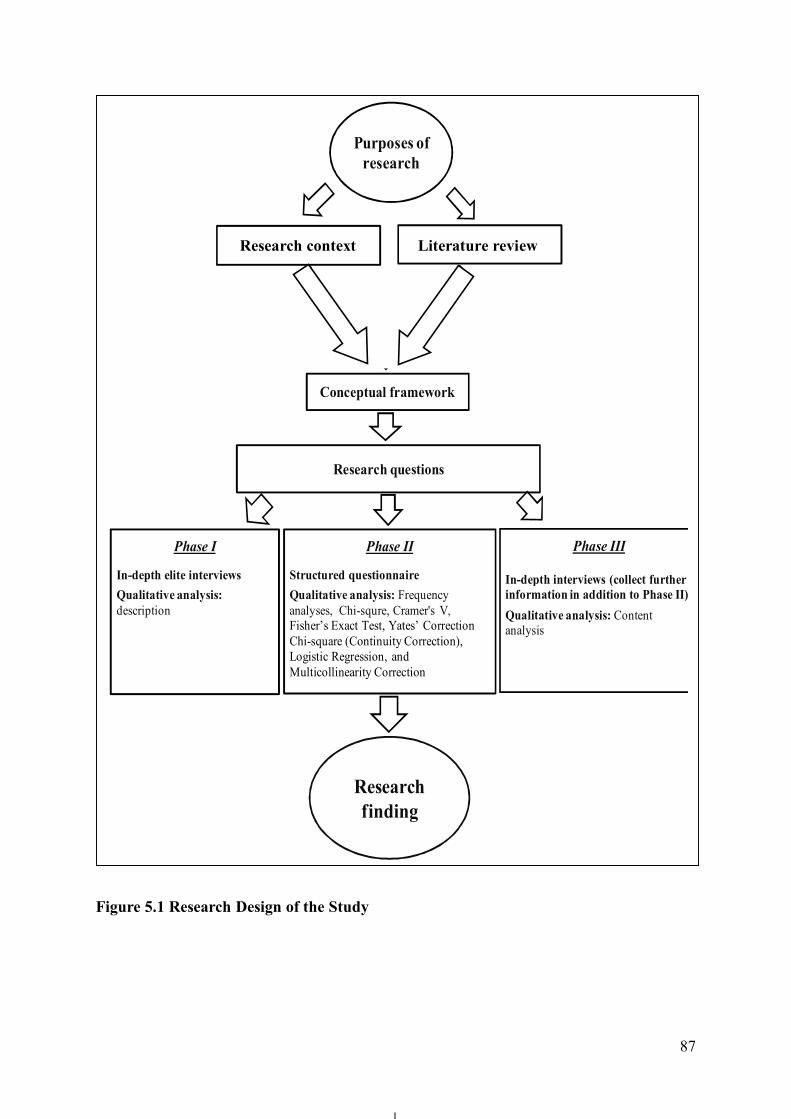
87
Figure 5.1 Research Design of the Study
Literature review I, II Research context I, II
Conceptual framework
Research questions
Phase I
In-depth elite interviewsQualitative analysis: description
Phase II
Structured questionnaireQualitative analysis: Frequency analyses, Chi-squre, Cramer's V, Fisher’s Exact Test, Yates’ Correction Chi-square (Continuity Correction), Logistic Regression, and Multicollinearity Correction
Phase III
In-depth interviews (collect further information in addition to Phase II)Qualitative analysis: Content analysis
Purposes of research
Research finding
Theoretical framework
Research context Literature review
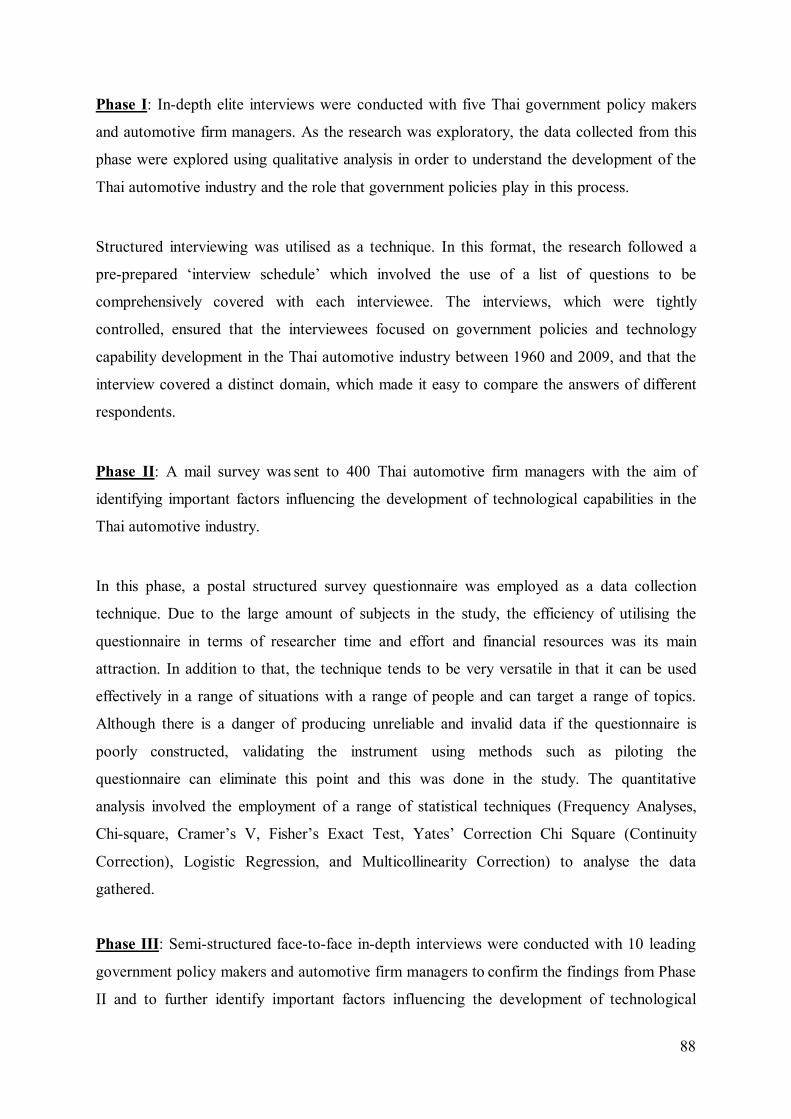
88
Phase I: In-depth elite interviews were conducted with five Thai government policy makers
and automotive firm managers. As the research was exploratory, the data collected from this
phase were explored using qualitative analysis in order to understand the development of the
Thai automotive industry and the role that government policies play in this process.
Structured interviewing was utilised as a technique. In this format, the research followed a
pre-prepared ‘interview schedule’ which involved the use of a list of questions to be
comprehensively covered with each interviewee. The interviews, which were tightly
controlled, ensured that the interviewees focused on government policies and technology
capability development in the Thai automotive industry between 1960 and 2009, and that the
interview covered a distinct domain, which made it easy to compare the answers of different
respondents. Phase II: A mail survey was sent to 400 Thai automotive firm managers with the aim of
identifying important factors influencing the development of technological capabilities in the
Thai automotive industry.
In this phase, a postal structured survey questionnaire was employed as a data collection
technique. Due to the large amount of subjects in the study, the efficiency of utilising the
questionnaire in terms of researcher time and effort and financial resources was its main
attraction. In addition to that, the technique tends to be very versatile in that it can be used
effectively in a range of situations with a range of people and can target a range of topics.
Although there is a danger of producing unreliable and invalid data if the questionnaire is
poorly constructed, validating the instrument using methods such as piloting the
questionnaire can eliminate this point and this was done in the study. The quantitative
analysis involved the employment of a range of statistical techniques (Frequency Analyses,
Chi-square, Cramer’s V, Fisher’s Exact Test, Yates’ Correction Chi Square (Continuity
Correction), Logistic Regression, and Multicollinearity Correction) to analyse the data
gathered.
Phase III: Semi-structured face-to-face in-depth interviews were conducted with 10 leading
government policy makers and automotive firm managers to confirm the findings from Phase
II and to further identify important factors influencing the development of technological
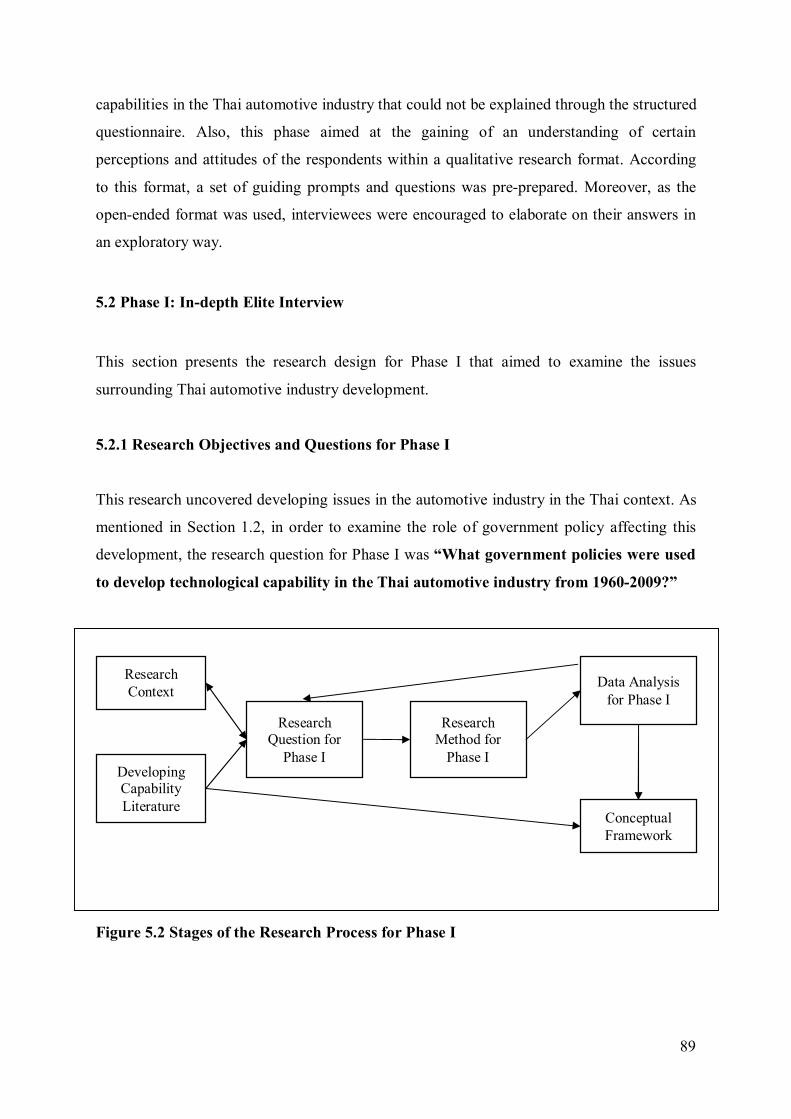
89
capabilities in the Thai automotive industry that could not be explained through the structured
questionnaire. Also, this phase aimed at the gaining of an understanding of certain
perceptions and attitudes of the respondents within a qualitative research format. According
to this format, a set of guiding prompts and questions was pre-prepared. Moreover, as the
open-ended format was used, interviewees were encouraged to elaborate on their answers in
an exploratory way.
5.2 Phase I: In-depth Elite Interview
This section presents the research design for Phase I that aimed to examine the issues
surrounding Thai automotive industry development.
5.2.1 Research Objectives and Questions for Phase I
This research uncovered developing issues in the automotive industry in the Thai context. As
mentioned in Section 1.2, in order to examine the role of government policy affecting this
development, the research question for Phase I was “What government policies were used
to develop technological capability in the Thai automotive industry from 1960-2009?”
Figure 5.2 Stages of the Research Process for Phase I
Developing Capability Literature
Research Context
Research Question for
Phase I
Research Method for
Phase I
Data Analysis for Phase I
Conceptual Framework
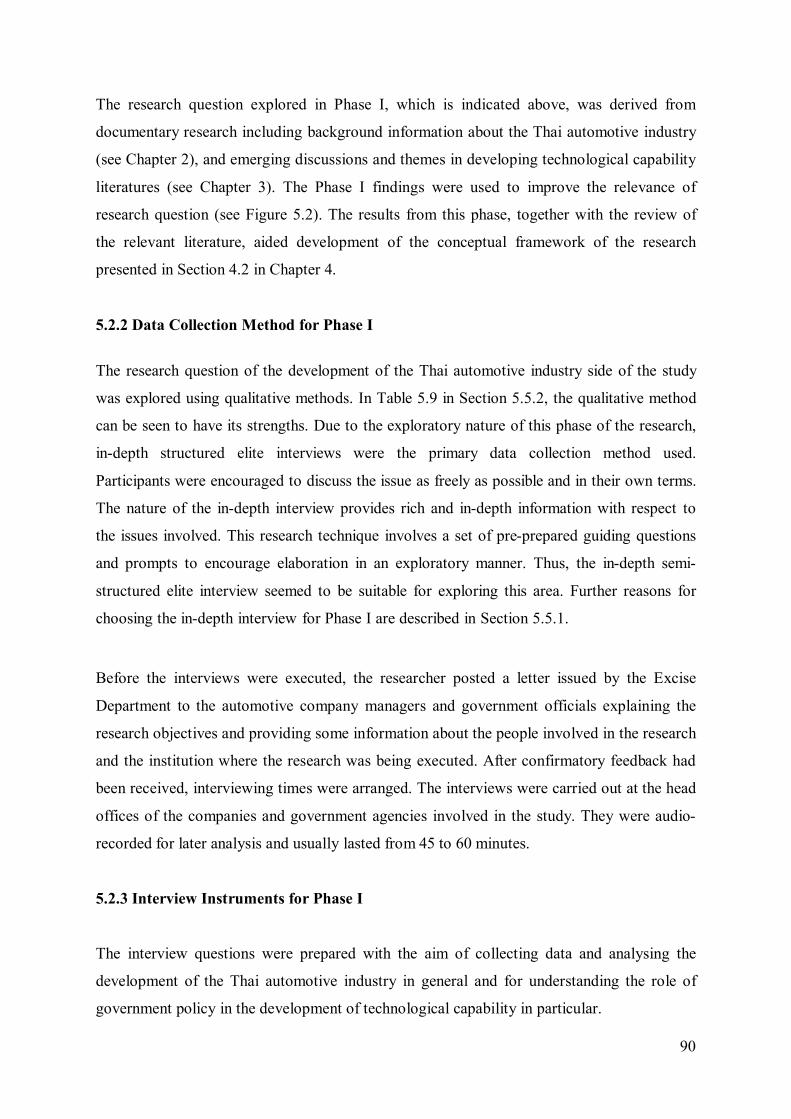
90
The research question explored in Phase I, which is indicated above, was derived from
documentary research including background information about the Thai automotive industry
(see Chapter 2), and emerging discussions and themes in developing technological capability
literatures (see Chapter 3). The Phase I findings were used to improve the relevance of
research question (see Figure 5.2). The results from this phase, together with the review of
the relevant literature, aided development of the conceptual framework of the research
presented in Section 4.2 in Chapter 4.
5.2.2 Data Collection Method for Phase I
The research question of the development of the Thai automotive industry side of the study
was explored using qualitative methods. In Table 5.9 in Section 5.5.2, the qualitative method
can be seen to have its strengths. Due to the exploratory nature of this phase of the research,
in-depth structured elite interviews were the primary data collection method used.
Participants were encouraged to discuss the issue as freely as possible and in their own terms.
The nature of the in-depth interview provides rich and in-depth information with respect to
the issues involved. This research technique involves a set of pre-prepared guiding questions
and prompts to encourage elaboration in an exploratory manner. Thus, the in-depth semi-
structured elite interview seemed to be suitable for exploring this area. Further reasons for
choosing the in-depth interview for Phase I are described in Section 5.5.1.
Before the interviews were executed, the researcher posted a letter issued by the Excise
Department to the automotive company managers and government officials explaining the
research objectives and providing some information about the people involved in the research
and the institution where the research was being executed. After confirmatory feedback had
been received, interviewing times were arranged. The interviews were carried out at the head
offices of the companies and government agencies involved in the study. They were audio-
recorded for later analysis and usually lasted from 45 to 60 minutes.
5.2.3 Interview Instruments for Phase I
The interview questions were prepared with the aim of collecting data and analysing the
development of the Thai automotive industry in general and for understanding the role of
government policy in the development of technological capability in particular.
91
The key areas delineated for discussion were:
1) The reasons for the generation of the automotive industry in Thailand.
2) The government role in the development of the industry.
3) Government policies enhancing the development of the industry.
4) Government policies hindering the development of the industry.
5) The difficulties of developing technological capability in general and in the
automotive industry in particular.
6) The current level of technological capability in Thai auto part firms.
7) Future plans for developing technological capabilities in the industry.
From these key areas, the researcher built two sets of questions, one for government officials
and another one for company managers. The first set of questions for government officials
were introductory questions regarding the responsibilities of the interviewees in the
government agencies. The next set of questions covered issues regarding government policies
in general. It was intended that these questions investigate the main motivation behind the
development of the Thai automotive industry as well as the problems the Thai automotive
industry has so far faced. The subsequent two questions, by contrast, were aimed at exploring
specific policies that have enhanced the development of the Thai automotive industry and
particularly to explore the effect of government policies in developing technological
capability therein. The subsequent two questions were about the current status of the Thai
automotive industry’s technological capability. The last question was about the direction of
government policy for the next ten years.
Regarding the company manager questions, the first question was intended to explore
management perception of key government policies that have enhanced the development of
technologies in the Thai automotive industry. The next three questions were intended to gain
an understanding of the current technological capability level in the Thai automotive
industry. The subsequent question intended to uncover the strengths and weaknesses of the
Thai automotive industry compared to that of Korea, China, and Malaysia. The last question
concerned the industry’s recommendations for government policy in the near future.
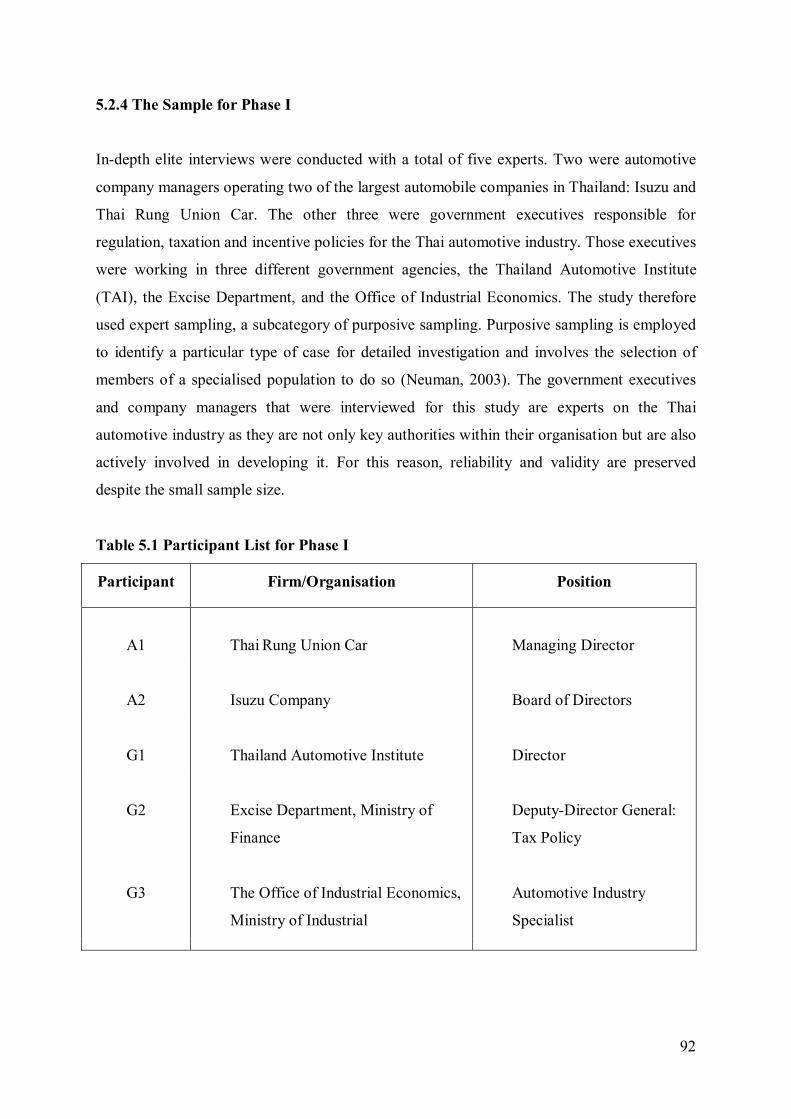
92
5.2.4 The Sample for Phase I
In-depth elite interviews were conducted with a total of five experts. Two were automotive
company managers operating two of the largest automobile companies in Thailand: Isuzu and
Thai Rung Union Car. The other three were government executives responsible for
regulation, taxation and incentive policies for the Thai automotive industry. Those executives
were working in three different government agencies, the Thailand Automotive Institute
(TAI), the Excise Department, and the Office of Industrial Economics. The study therefore
used expert sampling, a subcategory of purposive sampling. Purposive sampling is employed
to identify a particular type of case for detailed investigation and involves the selection of
members of a specialised population to do so (Neuman, 2003). The government executives
and company managers that were interviewed for this study are experts on the Thai
automotive industry as they are not only key authorities within their organisation but are also
actively involved in developing it. For this reason, reliability and validity are preserved
despite the small sample size.
Table 5.1 Participant List for Phase I
Participant Firm/Organisation Position
A1
Thai Rung Union Car
Managing Director
A2
Isuzu Company
Board of Directors
G1
Thailand Automotive Institute
Director
G2
Excise Department, Ministry of
Finance
Deputy-Director General:
Tax Policy
G3
The Office of Industrial Economics,
Ministry of Industrial
Automotive Industry
Specialist
93
5.2.5 Data Analysis for Phase I
The data collected for Phase I were subjected to qualitative analysis by the researcher.
Analysis of relevant literature and documentation, along with the findings of the interviews
conducted in Phase I, allowed for the creation of a new conceptual approach to government
policies in this study (see Section 4.2).
After the interview process was completed the recorded interviews were transcribed to
complete the analysis. This process also included the translation of the recorded material
from Thai to English. Next, the qualitative data analysis of Phase I was employed. This
comprised of three different stages: data reduction, data organisation and interpretation
(Sarantakos, 1993). In the data reduction stage, the text was reviewed to identify and
summarise the main themes of the interviews. In the data organisation stage, identified
themes were presented cohesively in the context of the interview questions. In the
interpretation stage, the results were discussed and evaluated in relation to conclusions related
to the research questions.
5.3 Phase II: Mail Survey
This section presents the research design for phase II.
5.3.1 Research Objectives and Questions for Phase II
In line with the discussion of previous chapters, the main objective of the Thai auto part
firms’ side of this research was to gather information on which factors are likely to support
the development of technologies in the Thai automotive industry. Accordingly, the research
question for Phase II and Phase III is “What factors have affected technological capability
development of local Thai auto parts firms?”
5.3.2 Data Collection Method for Phase II
In Phase II, a postal structured survey questionnaire was employed as a data collection
method. The general strengths of the quantitative research technique, under which the
questionnaire method falls, are presented in Table 5.9 in Section 5.5.2. The efficiency of
94
utilising a questionnaire in terms of researcher time and effort and financial resources was the
main attraction of this data collection method. The questionnaire was piloted with 30
respondents to help validate it. In addition, three experts were asked to judge and comment
on it using the Item-Objective Congruence (IOC) index. The result of the IOC analysis
indicated that most items were acceptable and were retained, though minor points of a few
items had to be revised. More details of the validation process are presented in Section
5.3.3.2. The questionnaire survey was carried out from July to November 2006. The response
rate of the survey questionnaire was 78% (312 from 400 questionnaires issued). A total of
300 completely filled up questionnaires (or 75 percent of mailed questionnaires) were used
for data analysis and 12 questionnaires were dropped due to incomplete respondent data.
5.3.3 The Survey Instruments for Phase II
The measurement instruments developed for the auto part firm side of this study were derived
from technological capability (Bell, 1984; Dahlman & Westphal, 1982; Katz, 1987; Lall, 1987;
Scott-Kemis & Bell, 1985), organisational learning (Slater & Narver, 1995; Sinkula, 1994;
Quinn, 1992; Glazer, 1991; Argyris & Schon, 1978), technology transfer from MNEs,
international strategic alliance, innovation strategies, and support from government policies.
The following sections explain the structured questionnaire used in Phase II.
5.3.3.1 Development of Questions for Structured Questionnaire for Phase II
The structured questionnaire mainly consisted of pre-coded quantitative questions mixed with
a few open-ended questions. As mentioned previously, the questions were developed by the
integration of various topics. However, the results attained from Phase I concerning the
management perceptions of developing technological capability in the Thai automotive
industry were also considered in order to refine the focus of the measurement instrument in
Phase II.
In this study, the firm is regarded as a dynamic unit and by virtue of its nature, and it is subject
to a process of transformation and changes. It can be born, grow or disappear in response to
internal and external changes. The process of growth and the building of the technological
capabilities of the firm are highly conditioned by the efforts of entrepreneurs as well as the
systematic accumulation of knowledge and manpower skills. Therefore, basic characteristics of
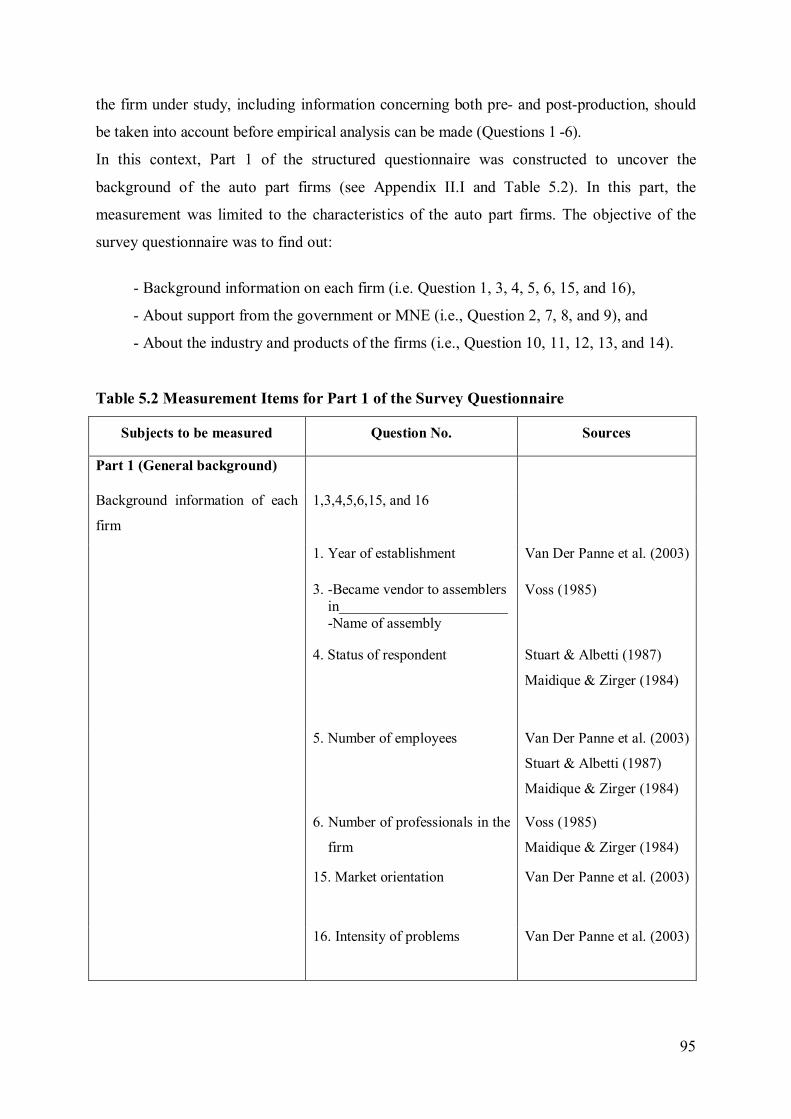
95
the firm under study, including information concerning both pre- and post-production, should
be taken into account before empirical analysis can be made (Questions 1 -6).
In this context, Part 1 of the structured questionnaire was constructed to uncover the
background of the auto part firms (see Appendix II.I and Table 5.2). In this part, the
measurement was limited to the characteristics of the auto part firms. The objective of the
survey questionnaire was to find out:
- Background information on each firm (i.e. Question 1, 3, 4, 5, 6, 15, and 16),
- About support from the government or MNE (i.e., Question 2, 7, 8, and 9), and
- About the industry and products of the firms (i.e., Question 10, 11, 12, 13, and 14).
Table 5.2 Measurement Items for Part 1 of the Survey Questionnaire
Subjects to be measured Question No. Sources
Part 1 (General background)
Background information of each
firm 1,3,4,5,6,15, and 16
1. Year of establishment Van Der Panne et al. (2003)
3. -Became vendor to assemblers in_______________________ -Name of assembly
Voss (1985)
4. Status of respondent Stuart & Albetti (1987) Maidique & Zirger (1984)
5. Number of employees Van Der Panne et al. (2003) Stuart & Albetti (1987) Maidique & Zirger (1984)
6. Number of professionals in the
firm Voss (1985) Maidique & Zirger (1984)
15. Market orientation Van Der Panne et al. (2003)
16. Intensity of problems Van Der Panne et al. (2003)
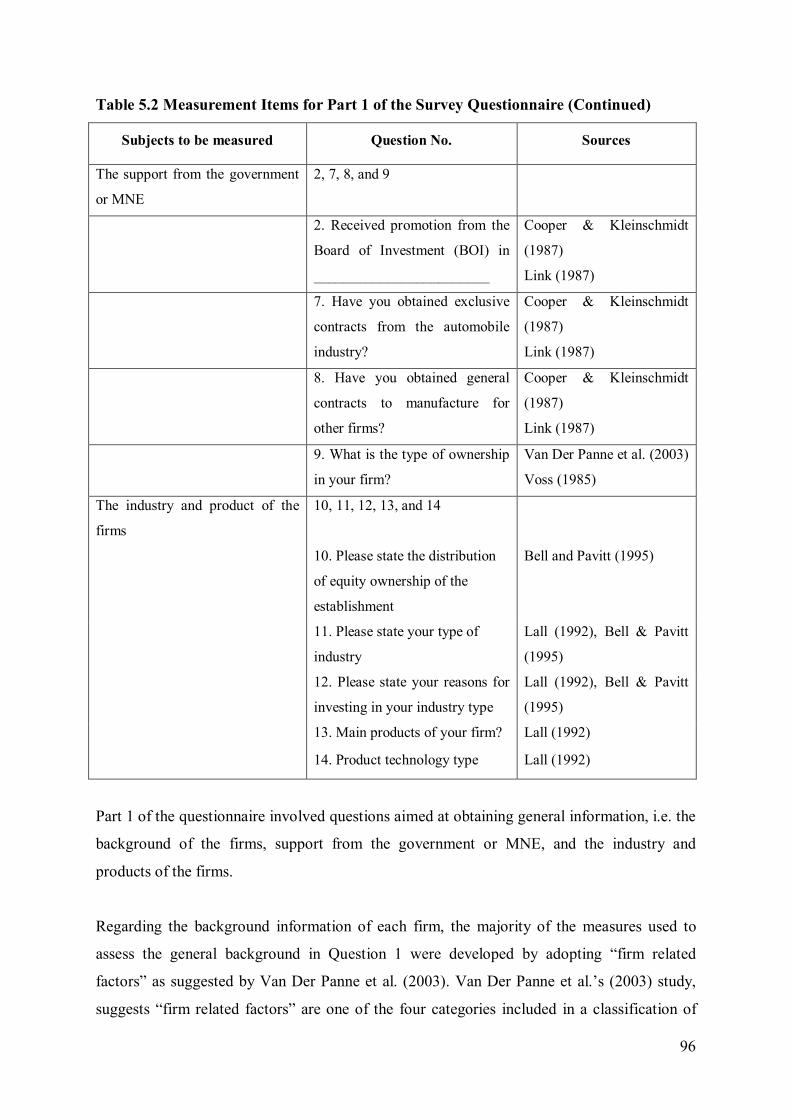
96
Table 5.2 Measurement Items for Part 1 of the Survey Questionnaire (Continued)
Subjects to be measured Question No. Sources
The support from the government
or MNE 2, 7, 8, and 9
2. Received promotion from the
Board of Investment (BOI) in
________________________
Cooper & Kleinschmidt
(1987) Link (1987)
7. Have you obtained exclusive
contracts from the automobile
industry?
Cooper & Kleinschmidt
(1987) Link (1987)
8. Have you obtained general
contracts to manufacture for
other firms?
Cooper & Kleinschmidt
(1987) Link (1987)
9. What is the type of ownership
in your firm? Van Der Panne et al. (2003) Voss (1985)
The industry and product of the
firms 10, 11, 12, 13, and 14
10. Please state the distribution
of equity ownership of the
establishment
Bell and Pavitt (1995)
11. Please state your type of
industry Lall (1992), Bell & Pavitt
(1995) 12. Please state your reasons for
investing in your industry type Lall (1992), Bell & Pavitt
(1995) 13. Main products of your firm? Lall (1992)
14. Product technology type Lall (1992)
Part 1 of the questionnaire involved questions aimed at obtaining general information, i.e. the
background of the firms, support from the government or MNE, and the industry and
products of the firms.
Regarding the background information of each firm, the majority of the measures used to
assess the general background in Question 1 were developed by adopting “firm related
factors” as suggested by Van Der Panne et al. (2003). Van Der Panne et al.’s (2003) study,
suggests “firm related factors” are one of the four categories included in a classification of
97
factors that affect the innovative project’s technological side. Subsequently, technological
capability development might depend on the satisfaction of relevant factors concerning the
firm’s background. Thus, Question 1 was constructed as an open-ended question to reveal the
year of each company’s establishment, which represents the length of experience of the firm.
Question 3 investigated the name of the assemblers which the participant supplies auto parts
to. This might connect to the supplier’s background and culture, as suggested by Voss (1985)
and Van Der Panne et al. (2003). These two scholars agree that the firm’s background might
have an effect on the development of technological capability. In this way, the previous
question might also be validated and confirmed.
Similarly, Question 4 attempted to examine “the status of the respondent” which might reflect
the organisation and the embeddedness of the R&D team in the firm, as pointed out by
Maidique & Zirger (1984), Van Der Panne et al. (2003), and Stuart & Albetti (1987). This
question was measured through the selection from four choices.
The rationale for developing Questions 5 and 6 was the same as Question 4 because they all
aimed at measuring the organisational team. Question 15, on the contrary, was developed to
measure “market orientation” in the region that the business was located. Van Der Panne et
al. (2003) proposed that “market related factors” directly affect technological capability
development. This question was developed, then, in order to see whether this factor also has
an influence on the technological capability development in the Thai context.
Question 16 tried to investigate the intensity of company problems. This question was
adopted from previous literatures, such as Van Der Panne et al. (2003), suggesting that the
intensity of problems might link to the management style, mainly. This question was
measured through five-point ordinal scales ranging from not applicable to very difficult.
To obtain background information about the support from the government or MNE,
Questions 2, 7, 8, and 9 were developed in Part 1. Question 2 uncovered the company’s
experience with technology in the investing support from government departments, adopted
from previous studies (Cooper & Kleinschmidt, 1987; Link, 1987).
98
Similarly, Question 7 and Question 8 attempted to examine the experience/skill of the company
in general and in terms of technology. These questions measured the subject’s experience in
this field based on the lists of innovation success factors of Cooper & Kleinschmidt (1987) and
Link (1987). Question 7 was constructed to see whether the subject had obtained exclusive
contracts from the automobile industry, while Question 8 was developed to find out if the
subjects had obtained general contracts to manufacture for other firms.
Question 9 measured the firm’s background by asking about types of ownership in the
subject’s firm. The question statement included in Question 9 was selected because the types
of company might be a factor affecting technological capability development. The
relationship between firm-related factors and technological viability has been confirmed in
many studies (e.g.Van Der Panne et al., 2003; Voss, 1985).
With regard to background information about the industry and products of the firms, Questions
10, 11, 12, 13, and 14 were constructed by adopting the Technology Capability Matrix
(modified from Lall, 1992; Bell & Pavitt, 1995; see Table 3.1). Question 10 aimed at
investigating the distribution of the equity ownership of the establishment. Bell and Pavitt
(1995) suggested that the basic or simple technology capability level involves the firm’s ability
to carry out minimal alterations to production and to integrate technology with its environment.
Linkage among international firms might have an influence on technology transfer. Thus, the
percentage of equity ownership of the firm’s establishment needed to be known.
Question 11 and Question 12 were developed to establish the types of firms being dealt with
and the reasons for their investment in particular areas. The Technology Capability Matrix
(modified from Lall, 1992; Bell & Pavitt, 1995) proved that investment is one of the key
factors in improving technological capability. It can be seen that the simple technological
capability levels includes construction of a plan, standard procurement, ancillary services,
and hiring labour. Both questions might be useful to elicit information on this.
Questions 13 and 14 aimed to examine production which Lall (1992) suggested was a factor
in the development of technological capability. The intermediate or adaptive technological
capability level, for example, includes the firms’ ability to produce product designs, carry out
production processes, and control product quality. This leads to the Question 13 which
investigates the main products of the firm and Question 14 which asks for information about
product technology types.
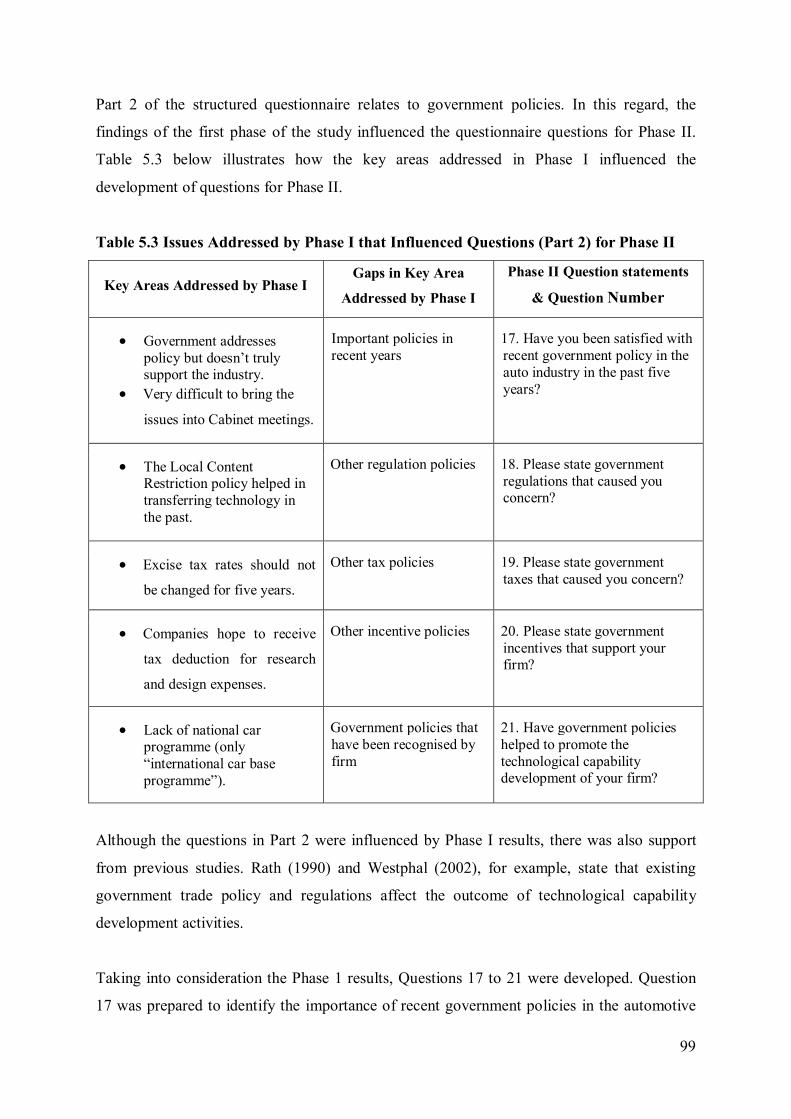
99
Part 2 of the structured questionnaire relates to government policies. In this regard, the
findings of the first phase of the study influenced the questionnaire questions for Phase II.
Table 5.3 below illustrates how the key areas addressed in Phase I influenced the
development of questions for Phase II.
Table 5.3 Issues Addressed by Phase I that Influenced Questions (Part 2) for Phase II
Key Areas Addressed by Phase I Gaps in Key Area
Addressed by Phase I
Phase II Question statements
& Question Number
Government addresses policy but doesn’t truly support the industry.
Very difficult to bring the
issues into Cabinet meetings.
Important policies in recent years
17. Have you been satisfied with recent government policy in the auto industry in the past five years?
The Local Content Restriction policy helped in transferring technology in the past.
Other regulation policies 18. Please state government regulations that caused you concern?
Excise tax rates should not
be changed for five years.
Other tax policies 19. Please state government taxes that caused you concern?
Companies hope to receive
tax deduction for research
and design expenses.
Other incentive policies 20. Please state government incentives that support your firm?
Lack of national car programme (only “international car base programme”).
Government policies that have been recognised by firm
21. Have government policies helped to promote the technological capability development of your firm?
Although the questions in Part 2 were influenced by Phase I results, there was also support
from previous studies. Rath (1990) and Westphal (2002), for example, state that existing
government trade policy and regulations affect the outcome of technological capability
development activities.
Taking into consideration the Phase 1 results, Questions 17 to 21 were developed. Question
17 was prepared to identify the importance of recent government policies in the automotive
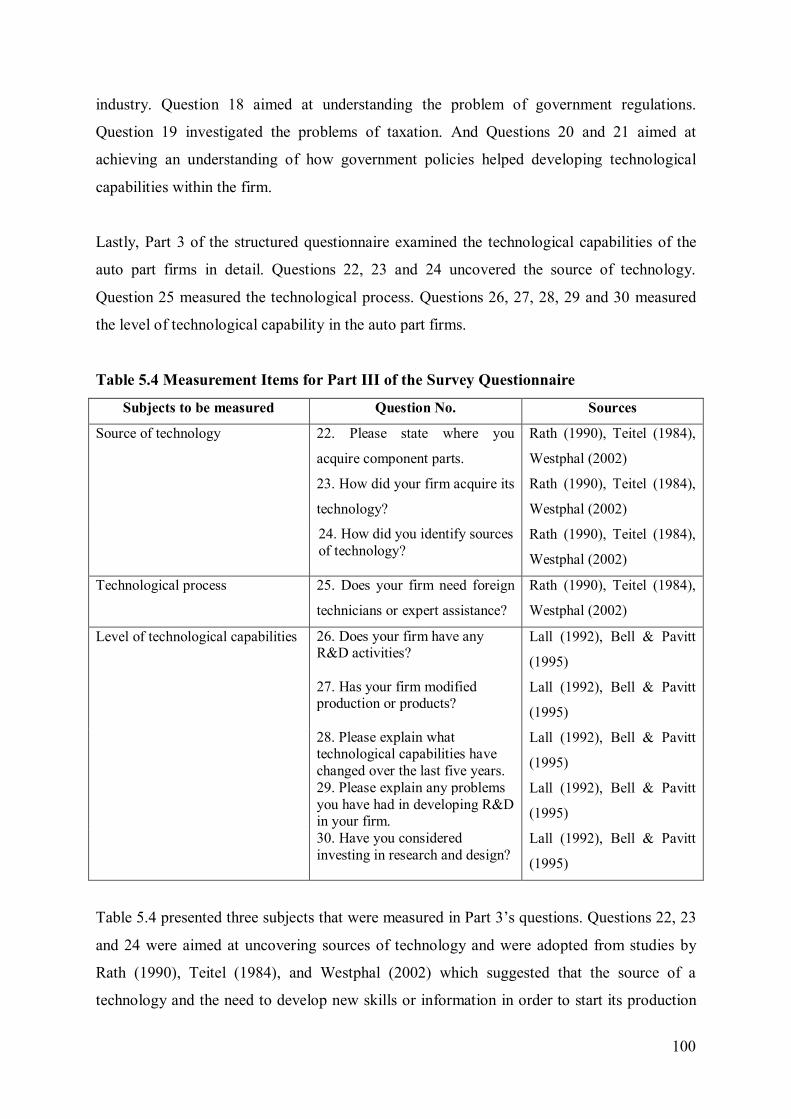
100
industry. Question 18 aimed at understanding the problem of government regulations.
Question 19 investigated the problems of taxation. And Questions 20 and 21 aimed at
achieving an understanding of how government policies helped developing technological
capabilities within the firm.
Lastly, Part 3 of the structured questionnaire examined the technological capabilities of the
auto part firms in detail. Questions 22, 23 and 24 uncovered the source of technology.
Question 25 measured the technological process. Questions 26, 27, 28, 29 and 30 measured
the level of technological capability in the auto part firms.
Table 5.4 Measurement Items for Part III of the Survey Questionnaire
Subjects to be measured Question No. Sources Source of technology 22. Please state where you
acquire component parts.
Rath (1990), Teitel (1984),
Westphal (2002) 23. How did your firm acquire its
technology? Rath (1990), Teitel (1984),
Westphal (2002) 24. How did you identify sources
of technology? Rath (1990), Teitel (1984),
Westphal (2002) Technological process 25. Does your firm need foreign
technicians or expert assistance? Rath (1990), Teitel (1984),
Westphal (2002) Level of technological capabilities 26. Does your firm have any
R&D activities? Lall (1992), Bell & Pavitt
(1995) 27. Has your firm modified
production or products? Lall (1992), Bell & Pavitt
(1995) 28. Please explain what
technological capabilities have changed over the last five years.
Lall (1992), Bell & Pavitt
(1995) 29. Please explain any problems
you have had in developing R&D in your firm.
Lall (1992), Bell & Pavitt
(1995) 30. Have you considered
investing in research and design? Lall (1992), Bell & Pavitt
(1995)
Table 5.4 presented three subjects that were measured in Part 3’s questions. Questions 22, 23
and 24 were aimed at uncovering sources of technology and were adopted from studies by
Rath (1990), Teitel (1984), and Westphal (2002) which suggested that the source of a
technology and the need to develop new skills or information in order to start its production
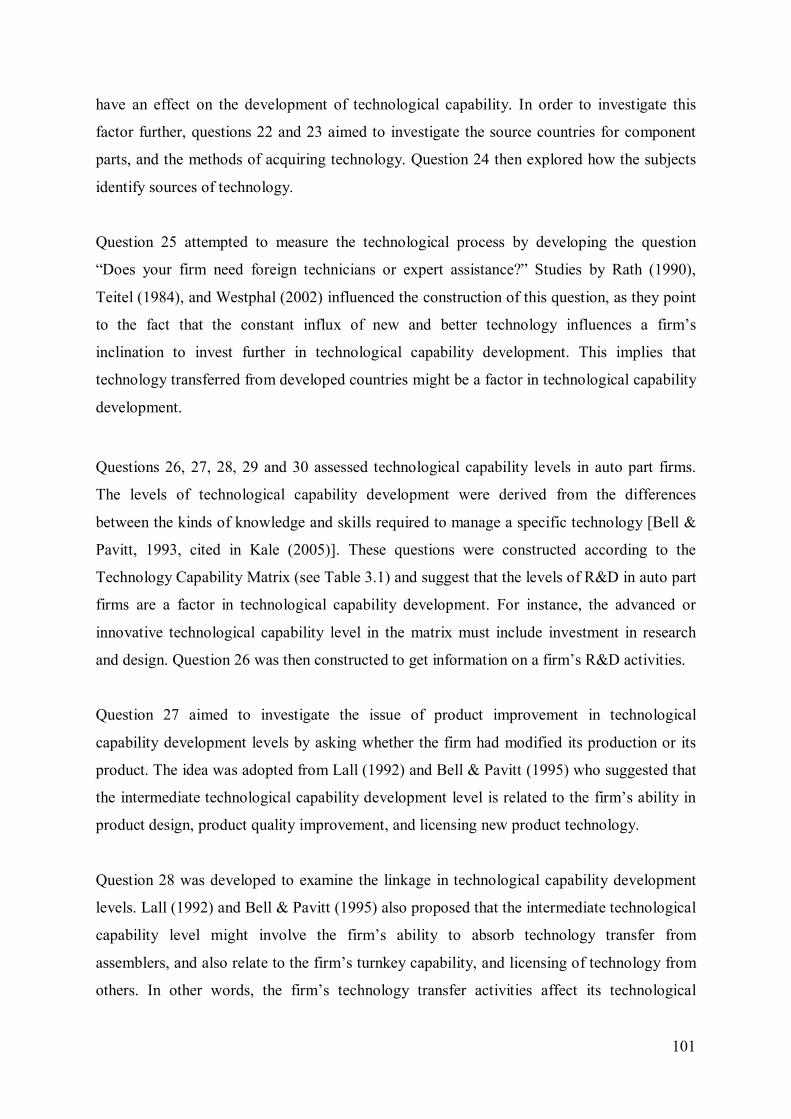
101
have an effect on the development of technological capability. In order to investigate this
factor further, questions 22 and 23 aimed to investigate the source countries for component
parts, and the methods of acquiring technology. Question 24 then explored how the subjects
identify sources of technology.
Question 25 attempted to measure the technological process by developing the question
“Does your firm need foreign technicians or expert assistance?” Studies by Rath (1990),
Teitel (1984), and Westphal (2002) influenced the construction of this question, as they point
to the fact that the constant influx of new and better technology influences a firm’s
inclination to invest further in technological capability development. This implies that
technology transferred from developed countries might be a factor in technological capability
development.
Questions 26, 27, 28, 29 and 30 assessed technological capability levels in auto part firms.
The levels of technological capability development were derived from the differences
between the kinds of knowledge and skills required to manage a specific technology [Bell &
Pavitt, 1993, cited in Kale (2005)]. These questions were constructed according to the
Technology Capability Matrix (see Table 3.1) and suggest that the levels of R&D in auto part
firms are a factor in technological capability development. For instance, the advanced or
innovative technological capability level in the matrix must include investment in research
and design. Question 26 was then constructed to get information on a firm’s R&D activities.
Question 27 aimed to investigate the issue of product improvement in technological
capability development levels by asking whether the firm had modified its production or its
product. The idea was adopted from Lall (1992) and Bell & Pavitt (1995) who suggested that
the intermediate technological capability development level is related to the firm’s ability in
product design, product quality improvement, and licensing new product technology.
Question 28 was developed to examine the linkage in technological capability development
levels. Lall (1992) and Bell & Pavitt (1995) also proposed that the intermediate technological
capability level might involve the firm’s ability to absorb technology transfer from
assemblers, and also relate to the firm’s turnkey capability, and licensing of technology from
others. In other words, the firm’s technology transfer activities affect its technological
102
capability development. Thus, Question 28 asks the subjects to explain what technological
capabilities in the firm have changed over the last five years.
Questions 29 and 30 concerned R&D investment at each level of technological capability.
The issues addressed in the Technological Capability Matrix (modified from Lall, 1992 and
Bell & Pavitt, 1995) again influenced the construct of the questions. For example, a firm’s
technological capability development can reach the advanced level if the firm has the ability
to invest in research and design. Question 29 therefore tries to bring to light problems that the
subjects may have had in developing R&D. Question 30 then asks further if the subjects have
considered investing in research and design, and if so, what happened?
5.3.3.2 Validation Process of the Phase II Instrument with the Item-Objective
Congruence (IOC) Index
The validation of the questionnaire was completed using the IOC technique and pilot tests.
Table 5.5 Stages in the Quality Control Process of the Phase II Questionnaire
Stage 1: A PRIORI VALIDATION 1. Test Specifications of the Constructs - Literature Reviews
- Needs Analysis (based on the reviews) 2. First Draft - Items Setting
- Small Piloting (1st) - IOC index (experts’ judgment for content and
construct validity) Stage 2: A POSTERIORI VALIDATION
3. Pilot Study - Piloting (2nd) the Questionnaire (n=40) - Estimating Reliability - Obtaining Experts’ Judgment - Revising the Instrument
4. Main Study - Main Study (n=400) - Process of Administration - Obtaining the Results
There were two main stages performed [adapted from Weir (2005)] to validate the
questionnaire as presented in Table 5.5 above.
103
During the validation process, the IOC index was 0.78. The first draft of the questionnaire (35
items) (See Appendix IV.II) was revised, and five items were rejected. After the completion of
the two stages in the quality control process in Table 5.5, the English version of the complete
questionnaire was completed as shown in Appendix II. I (the Thai version of the questionnaire
is presented in Appendix II. II). More details of all stages of the validation process of the Phase
II instrument are presented in Appendix IV.I.
5.3.4 The Sampling Method for Phase II
The Phase II sample consisted of 300 companies that returned completely filled-out
questionnaires out of 400 questionnaires mailed. All companies were members of the Thai
Automotive Institute (TAI), the Thai Automotive Industry Association (TAIA), and the
Automotive Industry Club (AIC). Hair et al. (2000) makes the case that judgements of what
sample size to use are often subjective and based on considerations such as industry
standards, past studies and resource availability, this being because formulas for sample size
are not appropriate for use with non-probability samples. A previous research effort
examining the technological development of the Thai automotive industry had a sample size
of only 42 (Abdulsomad, 2003). According to Neuman (2003), David and Sutton (2004), and
Brayman (2004) other determining factors for sample size include the statistical analysis
methods used and the number of simultaneously examined variables in the data analysis. For
the logistic regression technique in this study, a minimum sample size is required. Peduzzi et
al. (1996) notes, “A minimum of 10 events per independent variable has been
recommended.” In this study, the number of expected occurrences of R&D activities (events)
is 176 out of 300, so the number of independent variables should not be more than 18
(=176/10). Consequently, 300 samples are enough to analyse the logistic regression in this
study.
5.3.5 Data Analysis for Phase II
During the data analysis for Phase II, SPSS 14.0 (Statistical Package for the Social Science)
was used. Initially, each variable was coded into the SPSS data file as nominal and ordinal
interval levels based on their measurement level. When analysing the data, a range of
statistical techniques such as Frequency Analyses, Chi-square, Cramer’s V, Fisher’s Exact
Test, Yates’ Correction Chi Square (Continuity Correction), Logistic Regression, and
104
Multicollinearity Correction were employed. This section initially gives brief information
concerning each of these statistical analysis methods. Subsequently, how these methods were
applied in the context of this research is reviewed as follows:
Frequency analysis is applied to show the frequency distributions of data. Frequency
distributions demonstrate in absolute or relative (i.e. in percentages) terms how often the
different values of the variable are actually encountered among the units of analysis (Hair et
al., 2000; Diamantopoulos & Schledgelmich, 1997). Frequency distributions can be applied
for all levels of data such as nominal, ordinal, interval and ratio (Neuman, 2003).
Chi-square, an important part of univariate analysis, is one of the most widely used
techniques to explore relationships using nominal-to-nominal, ordinal, interval or ratio data
levels (Brayman, 2004; Babbie, 2001; Bernard, 2000). Its statistical symbol is χ2. It is both a
test of independence and a test of association. In other words, chi-square can show whether
two variables are independent or not (Brayman, 2004; cf. Somekh & Lewin, 2005). By using
one of the post-hoc analyses in measures of association such as phi or Cramer’s V, it can
define the direction of relationship existing between variables (cf. Somekh & Lewin, 2005).
The relationships between variables, on the other hand, are interpreted through the
employment of cross-tabs analyses which allows for the comparison of the relationship
between the independent and dependent variables (Somekh & Lewin, 2005; David & Sutton,
2004).
Hypothesis Test: Two types of hypotheses are used. H0 means the null hypothesis while H1 is
the alternate hypothesis (Lind et al., 2005). If sufficient evidence shows that the null
hypothesis is not true, the alternate hypothesis can be accepted. In the best case scenario, all
items in the population need to be counted in order to prove the null hypothesis is correct.
This is infeasible in this instance; however, collecting the sample data in the effective method
can be applied instead.
The method of testing the hypothesis is comparing the value obtained from the statistical
equation to the critical value. The critical values show in the table for each specific tool. For
example, the Chi-square value can be read in the Chi-square tables with the corresponding
degree of freedom in each case. Another method is to compare the p-value with the
significance level (most cases use 0.05). To make it clear, the definition of p-value is that the
105
null hypothesis is accepted when the probability of observing a sample value is equal to or
more than the significant level (Lind et al., 2005).
Fisher’s Exact Test and Yates’ Correction In the case of the 2 X 2 contingency table, the
Chi-square test is not an appropriate tool for the hypothesis test. The two more statistical
tools that follow can be applied for this case (Kanlaya, 2010).
Fisher’s Exact Test can calculate the value of Exact Sig. (2 tailed), which is a statistical
output from the SPSS program. If the value of Exact Sig. (2 tailed) is less than 0.05, the H0
hypothesis is not accepted. The test presents significant evidence of the relationship between
both tested variables, such as the dependent variable and the independent variable, at the 95%
confidence level.
Yate’s Correction is reported in the form of the Continuity Correction Likelihood Ratio. The
outputs of the program are both Continuity Correction value and Asymp. Significant value (2
sided). If the Asymp. Significant value (2 sided) is less than 0.05, the H0 hypothesis is not
accepted. This result reveals that there is a relationship between both variables at the 95%
confidence level.
To confirm the relationship between two variables, all of three statistical tools (Pearson Chi-
Square, Fisher’s Exact Test, and Yate’s Correction) should give the same pattern of statistical
values. For instance, the significant values from these three tests are less than 0.05.
Logistic Regression Model: The logistic regression model is presented as the following:
E(Y ) = exp (β0 + β1X1 + …+ βnXn) / (1 + exp (β0 + β1X1 + …+ βnXn)) at 0 ≤ E(Y) ≤ 1
Y = β0 + β1X1 + β2X2 + …… + βnXn + e
Where:
E(Y) is the logistic response function
Y is the dependent variable
Xi is the independent variable that can be a categorical variable
βi is the regression coefficient of Xi
β0 is the value Y in cases where all variables are zero
e is the error term
106
When the dependent variable is qualitative, logistic regression should be used. The dependent
variable is a binary response variable represented by the value 0 and 1. The independent
variables classified as the categorical variables are in the form of dummy variables, the
number of which is the number of categories of that independent variable minus 1. For
example, the variable of educational levels comprises high school, bachelor’s degree,
Master’s degree and Doctoral degree. The dummy variables for this variable can be
Degree(0), Degree(1), Degree(2) and Degree(3). The Degree(0) is the reference, and the
output of SPSS will display “this variable is redundant” and will not show its coefficient and
significant value.
Logistic regression is a useful statistical tool that can explicate causal relationships between
the dependent variable and independent variables. For the hypothesis test for logistic
regression, Wald statistics is used. When the Wald value is high, the significant value will be
low. If the significant value of that dummy variable is less than 0.05, this dummy variable
can be included in the logistic response function. This evidence confirms that the tested
variable causes the occurrence of the dependent variable. However, in some cases, the Wald
value is high, but the standard error is too high. As a result, that dummy variable was rejected
even though it should be accepted.
Another advantage of the logistic regression is that it can be used to predict the possibility of
the occurrence of the response variable (a dependent variable). In cases where the calculating
result of E(Y) in the logistic regression model is close to 1, it can explain that the possibility
of the occurrence is high. If this value is close to 0, the expected event may not occur.
The assumptions of logistic regression
The data need to be checked for the multicollinearity problem. This problem means that
independent variables in the model have correlation among them (Lind et al, 2005). The three
statistical values that can be used are TI, VIF and CI.
Tolerance (TI) = 1 – Ri2 where Ri is the multiple correlation coefficient
If tolerance is less than 0.20, the set of independent variables has a multicollinearity
problem.
VIF (Variance Inflation Factor) = 1 / (1-Ri2)
If VIF is more than 10, the multicollinearity problem occurs.
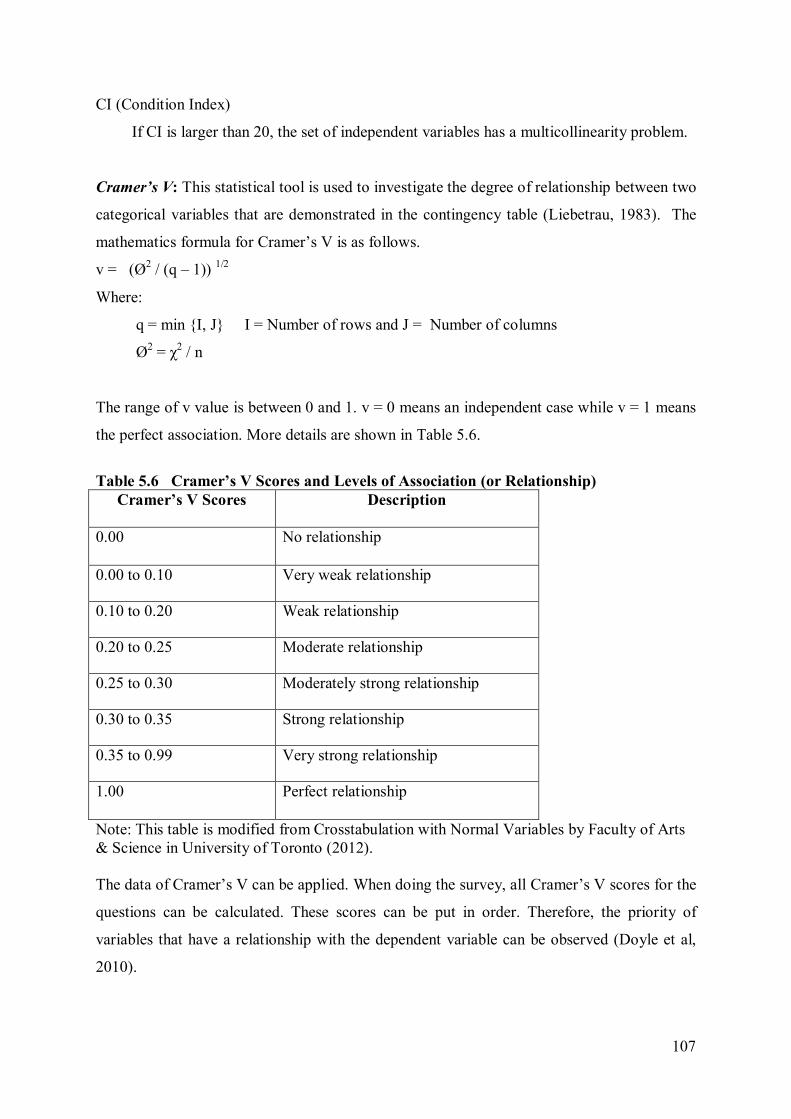
107
CI (Condition Index)
If CI is larger than 20, the set of independent variables has a multicollinearity problem.
Cramer’s V: This statistical tool is used to investigate the degree of relationship between two
categorical variables that are demonstrated in the contingency table (Liebetrau, 1983). The
mathematics formula for Cramer’s V is as follows.
v = (Ø2 / (q – 1)) 1/2
Where:
q = min {I, J} I = Number of rows and J = Number of columns
Ø2 = χ2 / n
The range of v value is between 0 and 1. v = 0 means an independent case while v = 1 means
the perfect association. More details are shown in Table 5.6.
Table 5.6 Cramer’s V Scores and Levels of Association (or Relationship)
Cramer’s V Scores
Description
0.00 No relationship
0.00 to 0.10 Very weak relationship
0.10 to 0.20 Weak relationship
0.20 to 0.25 Moderate relationship
0.25 to 0.30 Moderately strong relationship
0.30 to 0.35 Strong relationship
0.35 to 0.99 Very strong relationship
1.00 Perfect relationship
Note: This table is modified from Crosstabulation with Normal Variables by Faculty of Arts & Science in University of Toronto (2012). The data of Cramer’s V can be applied. When doing the survey, all Cramer’s V scores for the
questions can be calculated. These scores can be put in order. Therefore, the priority of
variables that have a relationship with the dependent variable can be observed (Doyle et al,
2010).
108
The previously mentioned statistical analysis techniques were applied during the data
analysis for Phase II based on the functions and requirements for the use of different data
types.
5.4 Phase III: In-depth Interview
This section presents the research design for Phase III which involved extensive empirical
research and focuses on answering the second research question.
5.4.1 Research Objectives for Phase III
During Phase III, an exploratory type of research was used. This phase raised the opportunity
for experts to express their perceptions and attitudes toward the development of technological
capabilities in their own words. The purpose was also to validate and triangulate the research
findings from Phase II and encourage the experts to elaborate on the issues involved or to
raise new related issues.
5.4.2 Data Collection Method for Phase III
Phase III consisted of 10 face-to-face semi-structured interviews with executives from the
Government, automotive companies, and automotive associations in Table 5.7 from March to
May 2007. Each interview lasted between 90 to 120 minutes. The rationale for using this
research technique is described in Section 5.5.1. In addition, this research technique is
classified as qualitative, the strengths and weaknesses of which are presented in Table 5.9 in
Section 5.5.2.
Similarly to Phase I, before the interviews were executed, the researcher posted an invitation
letter issued by the Excise Department to automotive companies, automotive associations and
government offices. Objectives and brief interview topics of the research were enclosed.
Permission to use a tape-recorder was also requested. After the experts accepted the
invitation, the time and place for interviewing was arranged.
109
5.4.3 The Interview Instruments for Phase III
The semi-structured interview questions in Phase III explored key issues that were also the
focus of the measurement instrument in Phase II. The respondents, for example, were asked
about the technological capability of the firm. However, the semi-structured interview went
beyond the structured questionnaire conducted in Phase II by asking for a comparison of past
and present technological capabilities. This question raised opportunities to recognise factors
affecting the development of technological capability.
The interview guide for Phase III involved five stages as follows.
Part 1: The introduction stage (Greetings, background of respondents, objectives of the
interview, confidential issues, and tape recording)
Part 2: Experts’ opinions concerning factors affecting technology capability
development (from Phase II)
1) Nationality of ownership of establishment
2) Methods of acquiring technology
3) Size of company
4) Type of company ownership
5) Ability to obtain exclusive contracts from the automobile industry
6) Ability to modify production or products 7) Consideration of investment in research and design
8) Need for foreign technicians or expert assistance
9) Type of industry
10) Government regulations of concern
11) Government taxes of concern
12) Government incentives supporting the firm
Part 3: Topics of concern for the Thai automotive industry relating to technology
capability development (Aimed at uncovering new issues for Phase III)
Government policies and automotive associations
1) Regulations: CBU, CKD
2) Incentives: BOI
3) Taxes: Excise taxes, Custom taxes
110
4) Activities of automotive associations: TAPMA, TAI
Thai automotive industry and automakers
5) Technology capability development of automakers and the Thai automotive industry
6) The success and failure of automakers and the Thai automotive industry over time.
7) Technologies for production
8) The goal of becoming the ‘Detroit of Asia’ and a national car brand
9) Automotive industries in other countries: South Korea, China, Malaysia, Vietnam
The automotive network
10) Suppliers: capabilities in production, design, and technologies
11) Customers
12) Imported and local parts
13) Processes: production, quality control, materials procurement
14) R&D progression in technologies and production
15) Expert assistance in technologies and production
Part 4: Other comments and new issues
Part 5: The closing stage
5.4.4 The Sampling Method for Phase III
Phase III employed a purposive sampling method which involved expert sampling from
different large organisations in the Thai automotive industry (see Table 5.7). It was expected
that these experts’ strong experiences in the Thai automotive industry would secure the
validity and reliability of the collected information for this phase.
5.4.5 Data Analysis for Phase III
Similarly to Phase I, Phase III involved the researcher tape recording ten interviewees’
responses to questions from the interview guide (see Section 5.4.3) in the interview session.
Then, the researcher carried out a qualitative data analysis similar to the process in Section
5.2.5. The analysis in this phase aimed to identify issues emphasised by the respondents that
differed from those in earlier phases. In the second part of the interview guide, the
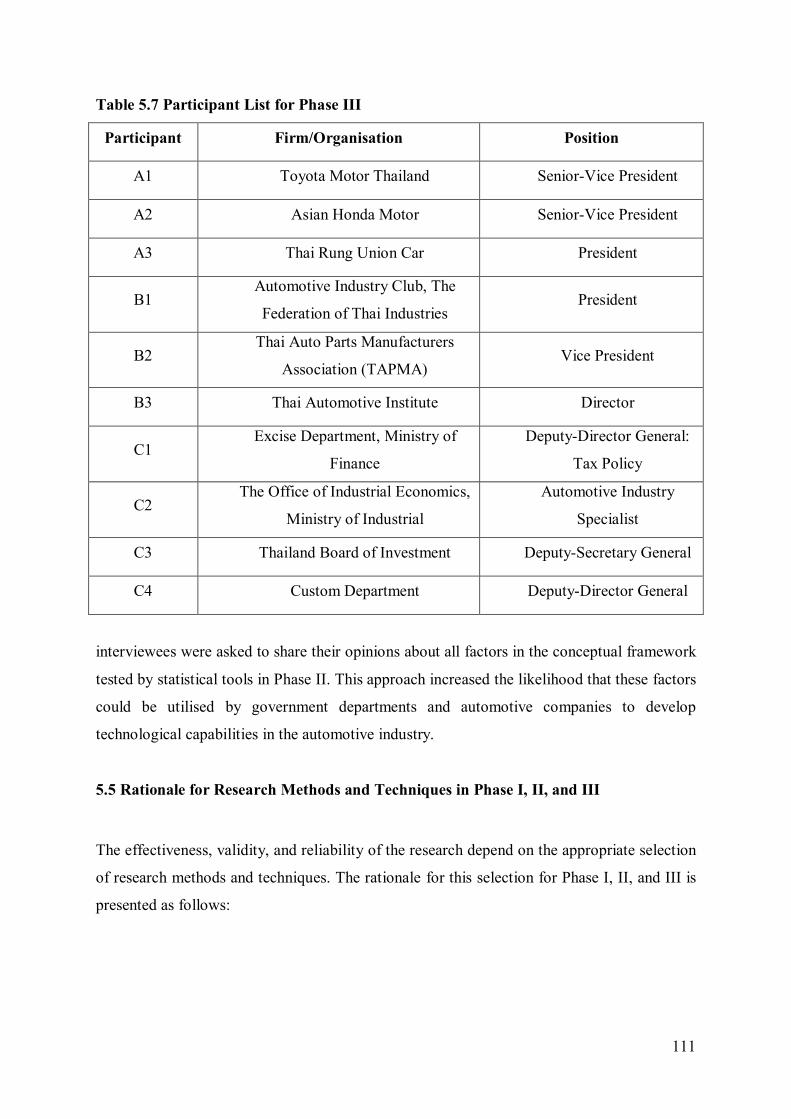
111
Table 5.7 Participant List for Phase III
Participant Firm/Organisation Position
A1 Toyota Motor Thailand Senior-Vice President
A2 Asian Honda Motor Senior-Vice President
A3 Thai Rung Union Car President
B1 Automotive Industry Club, The
Federation of Thai Industries President
B2 Thai Auto Parts Manufacturers
Association (TAPMA) Vice President
B3 Thai Automotive Institute Director
C1 Excise Department, Ministry of
Finance
Deputy-Director General:
Tax Policy
C2 The Office of Industrial Economics,
Ministry of Industrial
Automotive Industry
Specialist
C3 Thailand Board of Investment Deputy-Secretary General
C4 Custom Department Deputy-Director General
interviewees were asked to share their opinions about all factors in the conceptual framework
tested by statistical tools in Phase II. This approach increased the likelihood that these factors
could be utilised by government departments and automotive companies to develop
technological capabilities in the automotive industry.
5.5 Rationale for Research Methods and Techniques in Phase I, II, and III
The effectiveness, validity, and reliability of the research depend on the appropriate selection
of research methods and techniques. The rationale for this selection for Phase I, II, and III is
presented as follows:
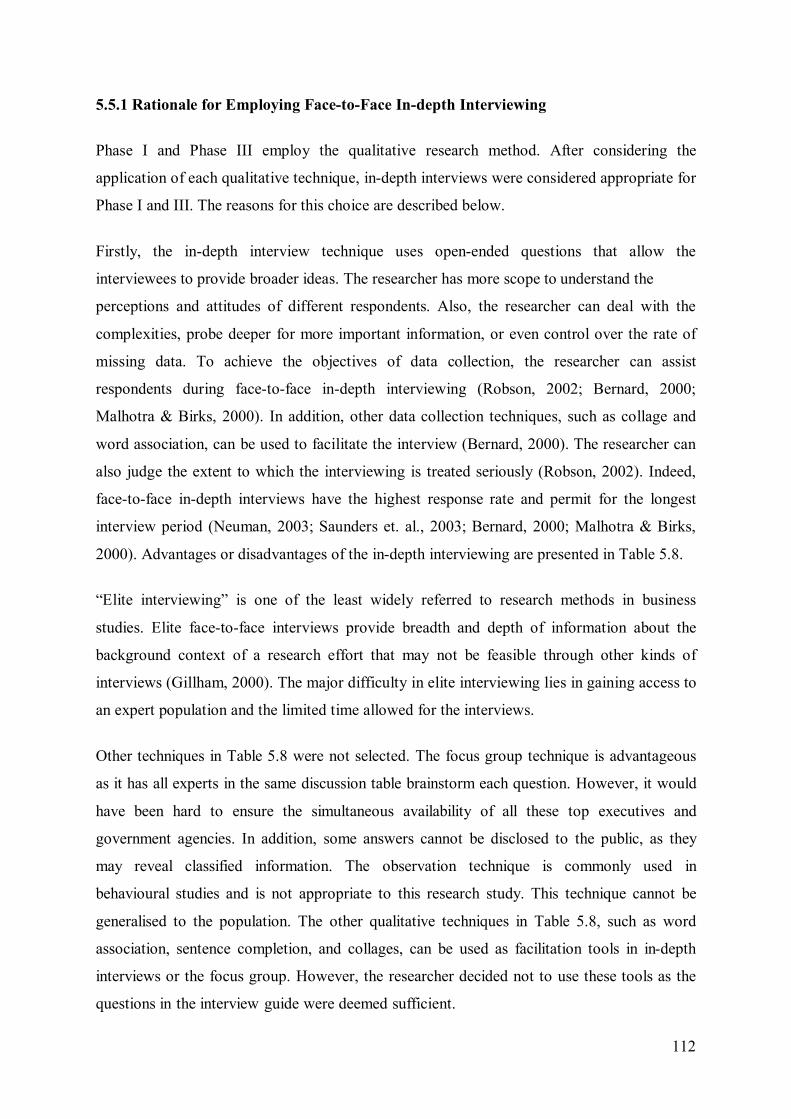
112
5.5.1 Rationale for Employing Face-to-Face In-depth Interviewing
Phase I and Phase III employ the qualitative research method. After considering the
application of each qualitative technique, in-depth interviews were considered appropriate for
Phase I and III. The reasons for this choice are described below.
Firstly, the in-depth interview technique uses open-ended questions that allow the
interviewees to provide broader ideas. The researcher has more scope to understand the
perceptions and attitudes of different respondents. Also, the researcher can deal with the
complexities, probe deeper for more important information, or even control over the rate of
missing data. To achieve the objectives of data collection, the researcher can assist
respondents during face-to-face in-depth interviewing (Robson, 2002; Bernard, 2000;
Malhotra & Birks, 2000). In addition, other data collection techniques, such as collage and
word association, can be used to facilitate the interview (Bernard, 2000). The researcher can
also judge the extent to which the interviewing is treated seriously (Robson, 2002). Indeed,
face-to-face in-depth interviews have the highest response rate and permit for the longest
interview period (Neuman, 2003; Saunders et. al., 2003; Bernard, 2000; Malhotra & Birks,
2000). Advantages or disadvantages of the in-depth interviewing are presented in Table 5.8.
“Elite interviewing” is one of the least widely referred to research methods in business
studies. Elite face-to-face interviews provide breadth and depth of information about the
background context of a research effort that may not be feasible through other kinds of
interviews (Gillham, 2000). The major difficulty in elite interviewing lies in gaining access to
an expert population and the limited time allowed for the interviews.
Other techniques in Table 5.8 were not selected. The focus group technique is advantageous
as it has all experts in the same discussion table brainstorm each question. However, it would
have been hard to ensure the simultaneous availability of all these top executives and
government agencies. In addition, some answers cannot be disclosed to the public, as they
may reveal classified information. The observation technique is commonly used in
behavioural studies and is not appropriate to this research study. This technique cannot be
generalised to the population. The other qualitative techniques in Table 5.8, such as word
association, sentence completion, and collages, can be used as facilitation tools in in-depth
interviews or the focus group. However, the researcher decided not to use these tools as the
questions in the interview guide were deemed sufficient.
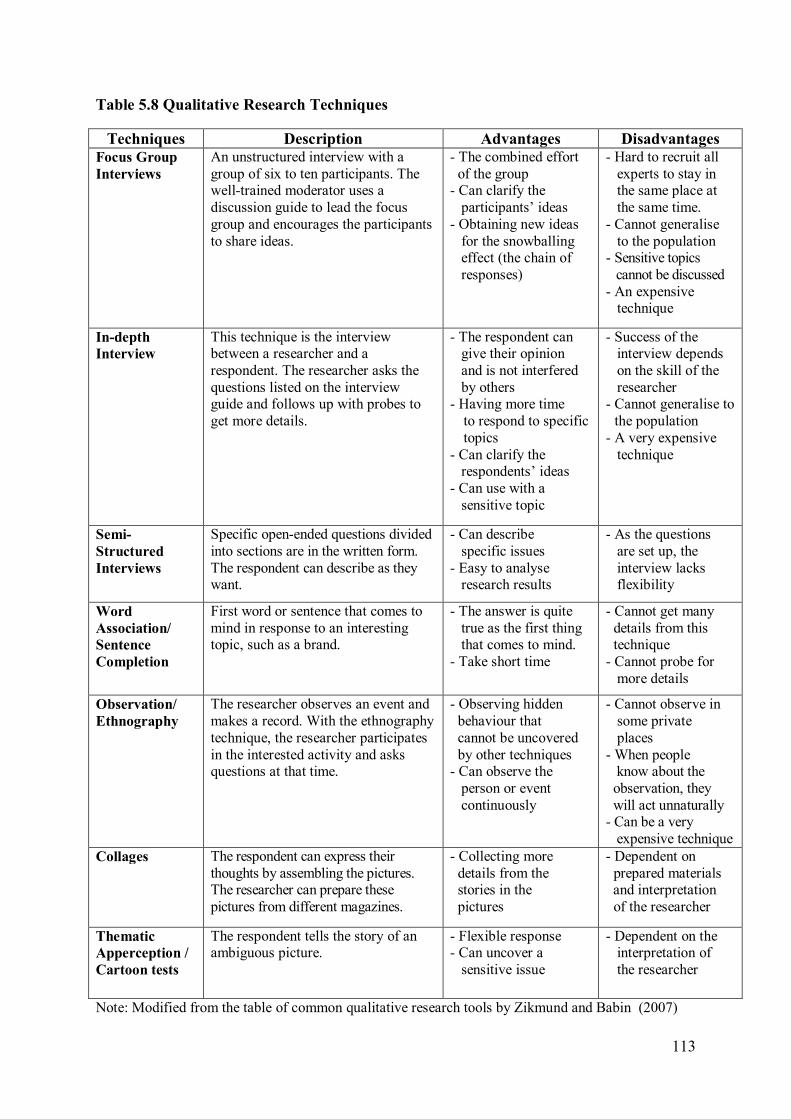
113
Table 5.8 Qualitative Research Techniques
Techniques Description Advantages Disadvantages Focus Group Interviews
An unstructured interview with a group of six to ten participants. The well-trained moderator uses a discussion guide to lead the focus group and encourages the participants to share ideas.
- The combined effort of the group - Can clarify the participants’ ideas - Obtaining new ideas for the snowballing effect (the chain of responses)
- Hard to recruit all experts to stay in the same place at the same time. - Cannot generalise to the population - Sensitive topics cannot be discussed - An expensive technique
In-depth Interview
This technique is the interview between a researcher and a respondent. The researcher asks the questions listed on the interview guide and follows up with probes to get more details.
- The respondent can give their opinion and is not interfered by others - Having more time
to respond to specific topics
- Can clarify the respondents’ ideas - Can use with a sensitive topic
- Success of the interview depends on the skill of the researcher - Cannot generalise to
the population - A very expensive technique
Semi-Structured Interviews
Specific open-ended questions divided into sections are in the written form. The respondent can describe as they want.
- Can describe specific issues - Easy to analyse research results
- As the questions are set up, the interview lacks flexibility
Word Association/ Sentence Completion
First word or sentence that comes to mind in response to an interesting topic, such as a brand.
- The answer is quite true as the first thing that comes to mind. - Take short time
- Cannot get many details from this technique - Cannot probe for more details
Observation/ Ethnography
The researcher observes an event and makes a record. With the ethnography technique, the researcher participates in the interested activity and asks questions at that time.
- Observing hidden behaviour that cannot be uncovered by other techniques - Can observe the person or event continuously
- Cannot observe in some private places - When people know about the observation, they will act unnaturally - Can be a very expensive technique
Collages The respondent can express their thoughts by assembling the pictures. The researcher can prepare these pictures from different magazines.
- Collecting more details from the stories in the pictures
- Dependent on prepared materials and interpretation of the researcher
Thematic Apperception / Cartoon tests
The respondent tells the story of an ambiguous picture.
- Flexible response - Can uncover a sensitive issue
- Dependent on the interpretation of the researcher
Note: Modified from the table of common qualitative research tools by Zikmund and Babin (2007)
114
It was concluded then that the in-depth interviews and the questions in the interview guide
were appropriate for Phase I and III of the study.
5.5.2 Rationale for Employing Multi-Method Research
This study used mixed-methods research as it involved the collection and analysis, in a single
study, of both qualitative and quantitative data (Phase I and III involved the qualitative
method while Phase II involved the quantitative method) and some attempts to integrate the
two techniques. According to Sandelowski (2003), the first goal of mixed methods research is
the achievement of a comprehensive understanding of a complex subject through its
examination from different angles. The other goal is the traditional one of triangulation which
aims for the validation of conclusions through the presentation of the converging results of
different methods. For example, in a qualitative research effort, the researcher might want to
supplement qualitative observations and interviews with a closed-ended instrument aimed at
systematically measuring factors identified as important in the relevant research literature.
The goal of mixed research in many cases is not corroboration but an expanding of
understanding (Onwuegbuzie & Leech, 2004). The strengths and weaknesses of research
methods are outlined in Table 5.9.
Table 5.9 Comparison among Mixed Methods, Qualitative and Quantitative Research
Modified from Dörnyei, (2007) and Modell, (2009)
Strengths Weaknesses Mixed-
methods
research
• Allows for the answering of a wider and more comprehensive range of research questions than the confines of a single method would allow
• Allows for the provision of stronger evidence for conclusions through the corroboration and convergence of findings.
• Allows for increased generalisability of results. • Allows for the use of words, pictures, and
narrative to add meaning to numerical data.
• Requires learning on the part of the researcher concerning a variety of methods and approaches and how to appropriately combine them.
• Increased expense. • More time consuming.
Qualitative
research • Allows for increased understanding of personal
experience (i.e., gives the insider’s viewpoint). • Allows for flexibility in response to changed
conditions. • Facilitates an exploration of how and why
phenomena occur.
• Lack of generalisability • Increase in risk of researcher bias.
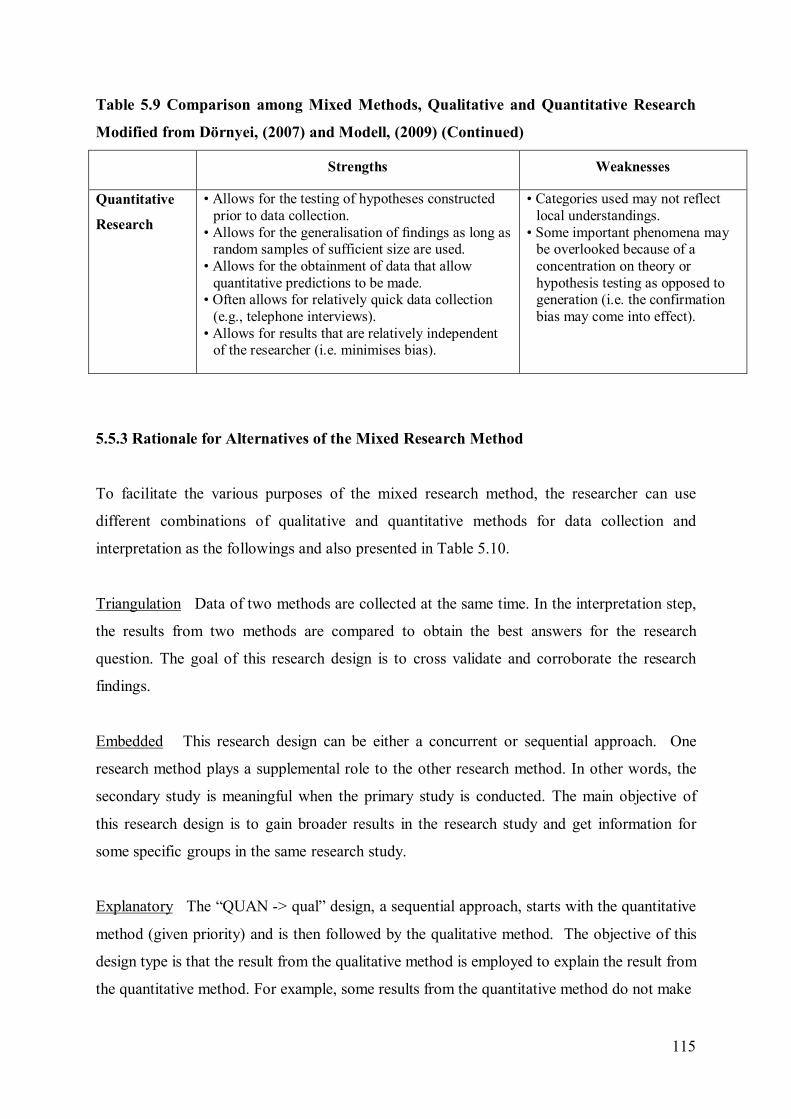
115
Table 5.9 Comparison among Mixed Methods, Qualitative and Quantitative Research
Modified from Dörnyei, (2007) and Modell, (2009) (Continued)
Strengths Weaknesses
Quantitative
Research • Allows for the testing of hypotheses constructed
prior to data collection. • Allows for the generalisation of findings as long as
random samples of sufficient size are used. • Allows for the obtainment of data that allow
quantitative predictions to be made. • Often allows for relatively quick data collection
(e.g., telephone interviews). • Allows for results that are relatively independent
of the researcher (i.e. minimises bias).
• Categories used may not reflect local understandings.
• Some important phenomena may be overlooked because of a concentration on theory or hypothesis testing as opposed to generation (i.e. the confirmation bias may come into effect).
5.5.3 Rationale for Alternatives of the Mixed Research Method
To facilitate the various purposes of the mixed research method, the researcher can use
different combinations of qualitative and quantitative methods for data collection and
interpretation as the followings and also presented in Table 5.10.
Triangulation Data of two methods are collected at the same time. In the interpretation step,
the results from two methods are compared to obtain the best answers for the research
question. The goal of this research design is to cross validate and corroborate the research
findings.
Embedded This research design can be either a concurrent or sequential approach. One
research method plays a supplemental role to the other research method. In other words, the
secondary study is meaningful when the primary study is conducted. The main objective of
this research design is to gain broader results in the research study and get information for
some specific groups in the same research study.
Explanatory The “QUAN -> qual” design, a sequential approach, starts with the quantitative
method (given priority) and is then followed by the qualitative method. The objective of this
design type is that the result from the qualitative method is employed to explain the result from
the quantitative method. For example, some results from the quantitative method do not make
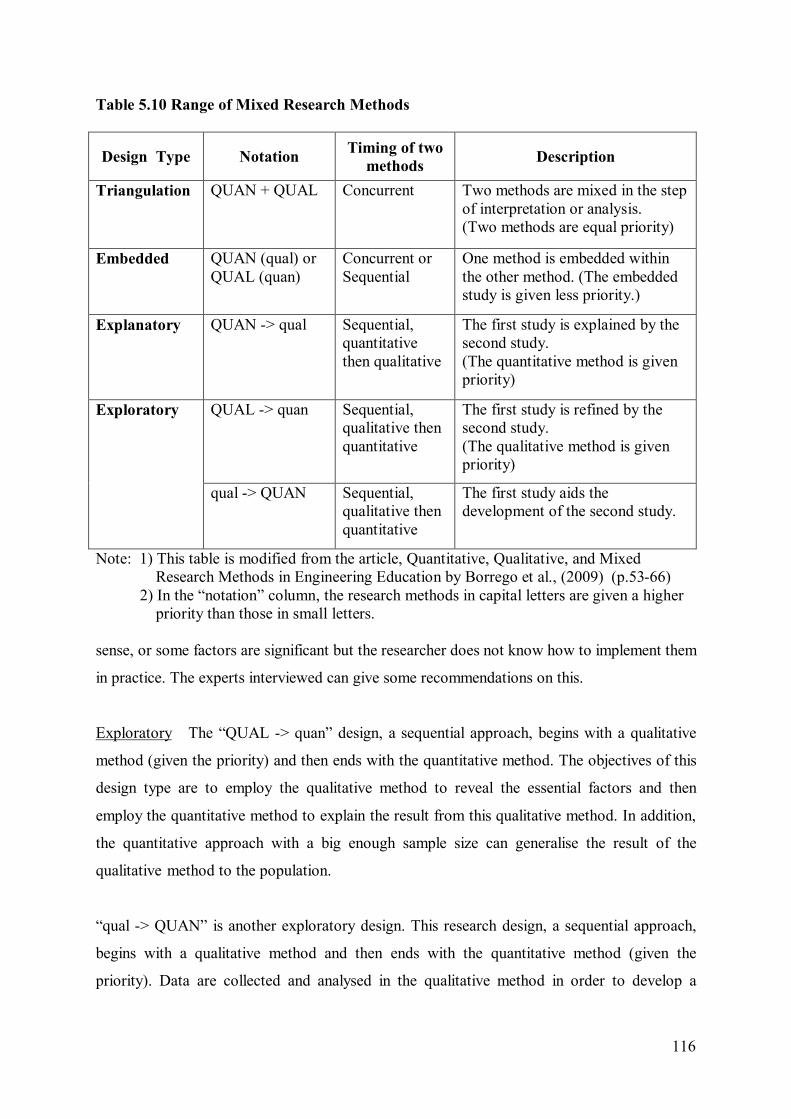
116
Table 5.10 Range of Mixed Research Methods
Design Type Notation Timing of two methods Description
Triangulation QUAN + QUAL Concurrent Two methods are mixed in the step of interpretation or analysis. (Two methods are equal priority)
Embedded QUAN (qual) or QUAL (quan)
Concurrent or Sequential
One method is embedded within the other method. (The embedded study is given less priority.)
Explanatory QUAN -> qual Sequential, quantitative then qualitative
The first study is explained by the second study. (The quantitative method is given priority)
Exploratory QUAL -> quan Sequential, qualitative then quantitative
The first study is refined by the second study. (The qualitative method is given priority)
qual -> QUAN Sequential, qualitative then quantitative
The first study aids the development of the second study.
Note: 1) This table is modified from the article, Quantitative, Qualitative, and Mixed Research Methods in Engineering Education by Borrego et al., (2009) (p.53-66) 2) In the “notation” column, the research methods in capital letters are given a higher priority than those in small letters. sense, or some factors are significant but the researcher does not know how to implement them
in practice. The experts interviewed can give some recommendations on this.
Exploratory The “QUAL -> quan” design, a sequential approach, begins with a qualitative
method (given the priority) and then ends with the quantitative method. The objectives of this
design type are to employ the qualitative method to reveal the essential factors and then
employ the quantitative method to explain the result from this qualitative method. In addition,
the quantitative approach with a big enough sample size can generalise the result of the
qualitative method to the population.
“qual -> QUAN” is another exploratory design. This research design, a sequential approach,
begins with a qualitative method and then ends with the quantitative method (given the
priority). Data are collected and analysed in the qualitative method in order to develop a
117
quantitative method. One of the primary objectives of the qualitative method is to construct a
questionnaire for the quantitative method.
For this study, Phase I and Phase II have used the “qual -> QUAN” exploratory design. Phase
I employs the qualitative method with in-depth interviews to refine the factors and to be the
guidelines for creating a section in the questionnaire (the section of the government policies)
for Phase II. Then, Phase II uses the quantitative method in form of the survey technique with
the larger size of samples to test the significance of factors that are the causes of
technological capability development. The results of Phase II can also be generalised to the
auto part manufacturing industry.
Considering Phase II and Phase III, the “QUAN -> qual” explanatory design is used. Phase II
(quantitative method as mentioned above) obtains the significant factors. Then, Phase III (the
qualitative method with expert interviews) is used to explain the results and all of the
significant factors from Phase II. In addition, Phase III can uncover new factors that are not
found in Phase I and II. Also, the experts can make recommendations how to implement
these factors by different parties, such as the government and the auto part suppliers.
5.6 Conclusion
This chapter demonstrates the research methodology. All steps of the study align with the
research questions and conceptual framework mentioned in the previous chapters. The
research design in this study is mixed method research of two forms. The “qual -> QUAN”
exploratory design is the sequential approach used for Phases I and II (Borrego et al., 2009).
Phase I guides Phase II, and Phase II then expands on Phase I. The “QUAN -> qual”
explanatory design is the sequential approach used for Phases II and III. Phase II is explained
by Phase III. Phases I, II & III cover the topics of organisation & organisational learning,
international strategic alliance, innovation strategies, technology transfer, government
policies, and the development of technological capability. The study involved data collection
through each phase that helped with a triangulation approach.
In Phase I, in-depth elite interviews with five experts from government offices and
automotive companies were employed to answer the first research question: “What
government policies were used to develop technological capabilities in the Thai automotive
118
industry from 1960-2009?” Well-designed tools for collecting data result in reliable research
outputs. In this study, the researcher used the interview guide to collect the data. Then, the
collected data were analysed following three different stages: data reduction, data
organisation and interpretation (Sarantakos, 1993). The research findings in Phase I aimed at
answering RQ1 and provided guidelines for creating the questionnaire in Phase II.
In Phase II, the mail survey sent to 400 executives in auto part manufacturing companies
revealed the answer to the second research question, “What factors have affected the
technological capability development of local Thai auto part firms?” The questionnaire was
validated by the consulting professor and by experts using the IOC index. For the data
analysis in this phase, a variety of statistical tools (Frequency Analyses, Chi-square, Cramer’s
V, Fisher’s Exact Test, Yates’ Correction Chi-square (Continuity Correction), Logistic
Regression, and Multicollinearity Correction) were employed. New relations among the
variables not discovered by previous researchers may be uncovered here due to the difference
in the business environment in Thailand and other developing countries as compared to the
developed countries in which other studies were carried out.
In Phase III, the in-depth interview technique with ten of the top executives from government
offices, automotive companies, and automotive associations is used to confirm the results
from Phase II and to uncover factors that could not be found in Phases I and II. Similarly to
Phase I, the interview guide for collecting data is used, and then, these data are analysed.
This study aims to answer both of the main research questions mentioned above and also
contribute information about the implementation of government policy. In the next chapter,
the Phase I in-depth elite interview is discussed in detail.
119
Chapter 6
Phase I Qualitative Data Analysis of Automotive Industry Executives
6.1 Introduction
This chapter covers the qualitative data analysis of the exploratory data gathered from the in-
depth semi-structured elite interviews for Phase I. In addition, it also addresses the research
propositions, questions and objectives specified in Chapter 5.
A range of key issues relating to development in the Thai automotive industry are examined
in this chapter. The role of the government in the development of the industry, and
government policies enhancing and hindering this development are among the important
concerns addressed during the analysis. Executives’ viewpoints regarding the difficulties of
developing technological capability, the current level of technological capabilities in Thai
auto-part firms, and future plans for developing technological capabilities in the Thai
automotive industry are also analysed.
To answer the first research question – “What government policies were used to develop
technological capability in the Thai automotive industry from 1960-2009?” – the structured
interview was utilised as a technique. The results of the subsequent in-depth interviews,
conducted with five of the top-level executives of both the government’s policy makers and
automobile firms, were then examined to deal with the question.
After the process of data collection and data analysis was completed, it was found that there
were two ways to describe the findings. On the one hand, results from the documentation
research, including government policies used to develop technological capability in the Thai
automotive industry, were analysed and synthesised into phases by the researcher. The six
phases are described in Chapter 2, Research Context, rather than in this chapter. The reasons
are that, rather than presenting them as a chunk of data, the synthesised six phases provide a
comprehensive overview of the research context including background information about the
Thai automotive industry. Therefore, part of the results of research question I are located in
Chapter 2. On the other hand, results from the interview data were analysed and categorised
into three categories – regulation, taxation, and incentives – according to the conceptual
framework. These findings are presented in Section 6.3.
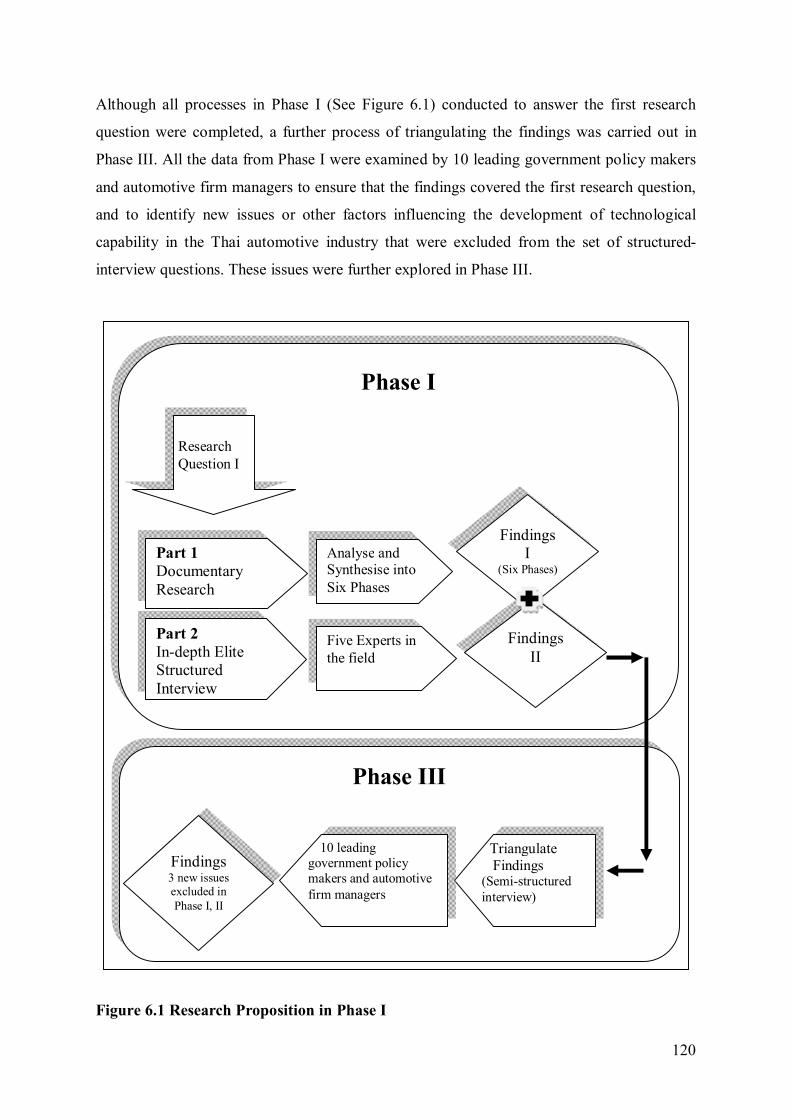
120
Although all processes in Phase I (See Figure 6.1) conducted to answer the first research
question were completed, a further process of triangulating the findings was carried out in
Phase III. All the data from Phase I were examined by 10 leading government policy makers
and automotive firm managers to ensure that the findings covered the first research question,
and to identify new issues or other factors influencing the development of technological
capability in the Thai automotive industry that were excluded from the set of structured-
interview questions. These issues were further explored in Phase III.
Figure 6.1 Research Proposition in Phase I
Phase I
Part 2 In-depth Elite Structured Interview
Five Experts in the field
Findings I
(Six Phases)
Part 1 Documentary Research
Analyse and Synthesise into Six Phases
Findings II
Research Question I
Phase III
Triangulate Findings (Semi-structured interview)
10 leading government policy makers and automotive firm managers
Findings 3 new issues excluded in Phase I, II
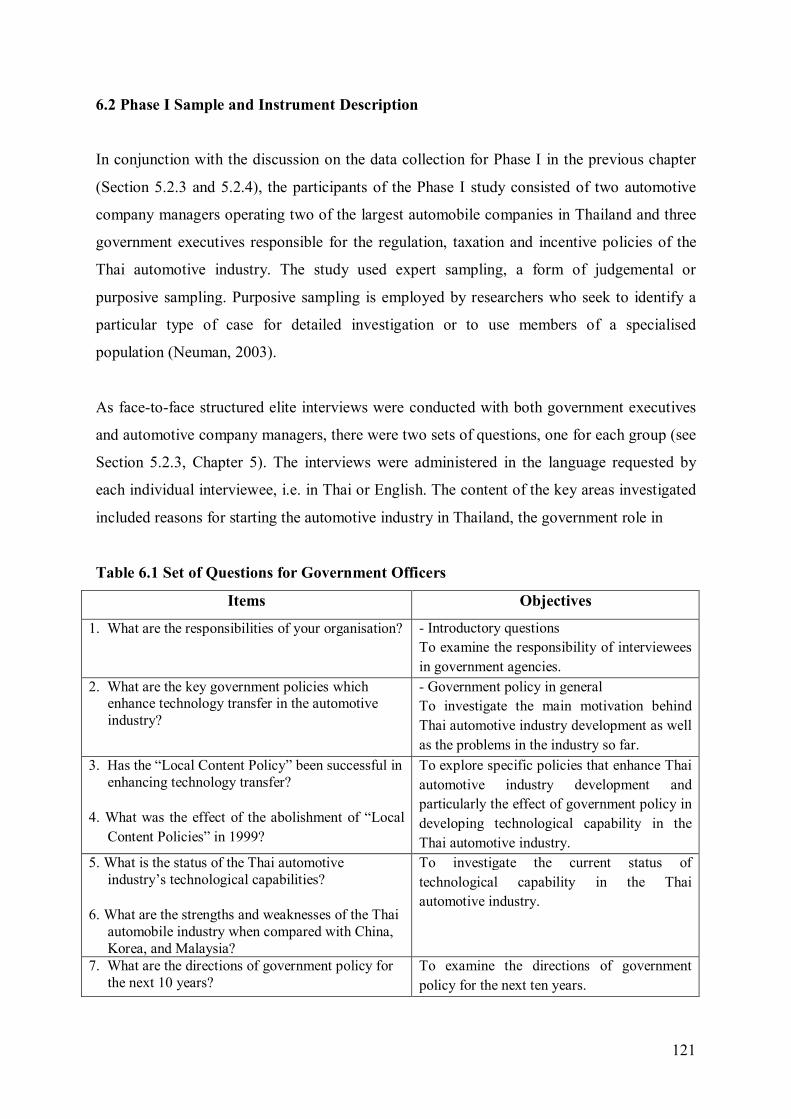
121
6.2 Phase I Sample and Instrument Description
In conjunction with the discussion on the data collection for Phase I in the previous chapter
(Section 5.2.3 and 5.2.4), the participants of the Phase I study consisted of two automotive
company managers operating two of the largest automobile companies in Thailand and three
government executives responsible for the regulation, taxation and incentive policies of the
Thai automotive industry. The study used expert sampling, a form of judgemental or
purposive sampling. Purposive sampling is employed by researchers who seek to identify a
particular type of case for detailed investigation or to use members of a specialised
population (Neuman, 2003).
As face-to-face structured elite interviews were conducted with both government executives
and automotive company managers, there were two sets of questions, one for each group (see
Section 5.2.3, Chapter 5). The interviews were administered in the language requested by
each individual interviewee, i.e. in Thai or English. The content of the key areas investigated
included reasons for starting the automotive industry in Thailand, the government role in
Table 6.1 Set of Questions for Government Officers
Items Objectives
1. What are the responsibilities of your organisation? - Introductory questions To examine the responsibility of interviewees in government agencies.
2. What are the key government policies which enhance technology transfer in the automotive industry?
- Government policy in general To investigate the main motivation behind Thai automotive industry development as well as the problems in the industry so far.
3. Has the “Local Content Policy” been successful in enhancing technology transfer?
4. What was the effect of the abolishment of “Local
Content Policies” in 1999?
To explore specific policies that enhance Thai automotive industry development and particularly the effect of government policy in developing technological capability in the Thai automotive industry.
5. What is the status of the Thai automotive industry’s technological capabilities?
6. What are the strengths and weaknesses of the Thai
automobile industry when compared with China, Korea, and Malaysia?
To investigate the current status of technological capability in the Thai automotive industry.
7. What are the directions of government policy for the next 10 years?
To examine the directions of government policy for the next ten years.
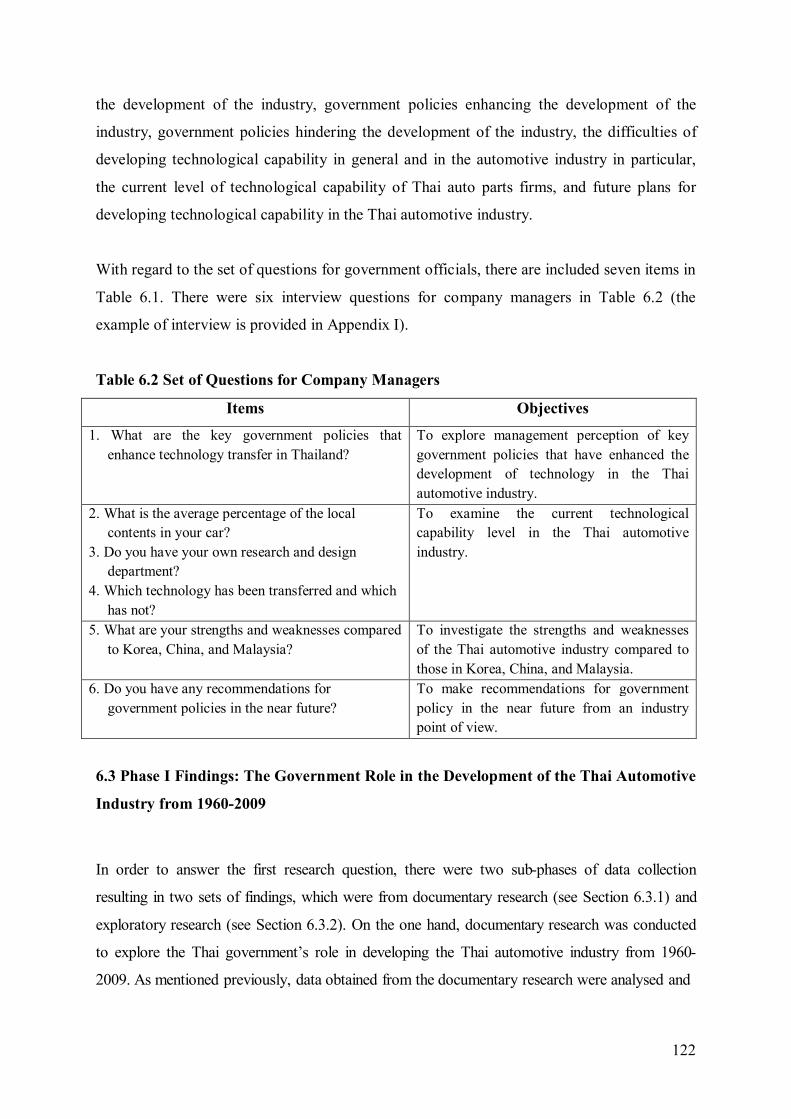
122
the development of the industry, government policies enhancing the development of the
industry, government policies hindering the development of the industry, the difficulties of
developing technological capability in general and in the automotive industry in particular,
the current level of technological capability of Thai auto parts firms, and future plans for
developing technological capability in the Thai automotive industry.
With regard to the set of questions for government officials, there are included seven items in
Table 6.1. There were six interview questions for company managers in Table 6.2 (the
example of interview is provided in Appendix I).
Table 6.2 Set of Questions for Company Managers
Items Objectives
1. What are the key government policies that enhance technology transfer in Thailand?
To explore management perception of key government policies that have enhanced the development of technology in the Thai automotive industry.
2. What is the average percentage of the local contents in your car?
3. Do you have your own research and design department?
4. Which technology has been transferred and which has not?
To examine the current technological capability level in the Thai automotive industry.
5. What are your strengths and weaknesses compared to Korea, China, and Malaysia?
To investigate the strengths and weaknesses of the Thai automotive industry compared to those in Korea, China, and Malaysia.
6. Do you have any recommendations for government policies in the near future?
To make recommendations for government policy in the near future from an industry point of view.
6.3 Phase I Findings: The Government Role in the Development of the Thai Automotive
Industry from 1960-2009
In order to answer the first research question, there were two sub-phases of data collection
resulting in two sets of findings, which were from documentary research (see Section 6.3.1) and
exploratory research (see Section 6.3.2). On the one hand, documentary research was conducted
to explore the Thai government’s role in developing the Thai automotive industry from 1960-
2009. As mentioned previously, data obtained from the documentary research were analysed and
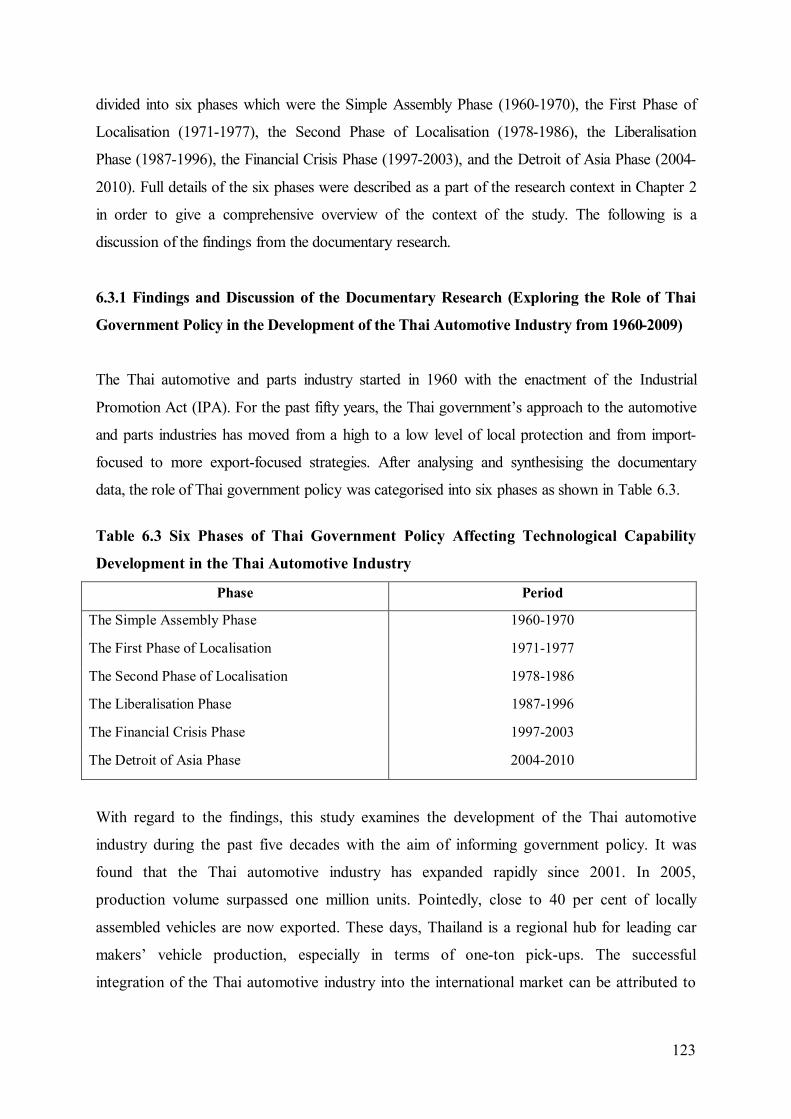
123
divided into six phases which were the Simple Assembly Phase (1960-1970), the First Phase of
Localisation (1971-1977), the Second Phase of Localisation (1978-1986), the Liberalisation
Phase (1987-1996), the Financial Crisis Phase (1997-2003), and the Detroit of Asia Phase (2004-
2010). Full details of the six phases were described as a part of the research context in Chapter 2
in order to give a comprehensive overview of the context of the study. The following is a
discussion of the findings from the documentary research.
6.3.1 Findings and Discussion of the Documentary Research (Exploring the Role of Thai
Government Policy in the Development of the Thai Automotive Industry from 1960-2009)
The Thai automotive and parts industry started in 1960 with the enactment of the Industrial
Promotion Act (IPA). For the past fifty years, the Thai government’s approach to the automotive
and parts industries has moved from a high to a low level of local protection and from import-
focused to more export-focused strategies. After analysing and synthesising the documentary
data, the role of Thai government policy was categorised into six phases as shown in Table 6.3.
Table 6.3 Six Phases of Thai Government Policy Affecting Technological Capability
Development in the Thai Automotive Industry
Phase Period
The Simple Assembly Phase 1960-1970
The First Phase of Localisation 1971-1977
The Second Phase of Localisation 1978-1986
The Liberalisation Phase 1987-1996
The Financial Crisis Phase 1997-2003
The Detroit of Asia Phase 2004-2010
With regard to the findings, this study examines the development of the Thai automotive
industry during the past five decades with the aim of informing government policy. It was
found that the Thai automotive industry has expanded rapidly since 2001. In 2005,
production volume surpassed one million units. Pointedly, close to 40 per cent of locally
assembled vehicles are now exported. These days, Thailand is a regional hub for leading car
makers’ vehicle production, especially in terms of one-ton pick-ups. The successful
integration of the Thai automotive industry into the international market can be attributed to
124
the increased contribution of MNEs. Since the financial crisis of the late nineties, FDI inflows
into the sector have increased significantly.
Increases in global competition, a positive economic situation, and the political environment
in the country in the early 1990s allowed Thailand to become a regional hub for the industry.
As car assembling MNEs were forced to seek emerging markets in which to base regional
production, Thailand offered a large domestic vehicle market and a relatively liberal political
environment in comparison to many of its Southeast Asian neighbours. The process of
developing as a regional hub was aided by the removal of restrictions on foreign ownership
during the beginning of the financial crisis. As a result, MNE affiliates in the industry have
increased production capacity and several world part manufacturers have entered the fray.
Most vehicle assemblers in Thailand acquire locally manufactured parts in order to save
money on transaction costs and improve their competitiveness. In other words, the production
network between parts manufacturers and car assemblers is located within Thailand. Despite
this, few local suppliers are involved in this network due to their low level of technological
capability. This suggests failings in the local content requirement measures enacted from
1970-2000.
Due to considerably lowered automotive industry costs, affiliates of MNEs tend to be less
sensitive to minor labour cost changes and other temporary shocks. In a situation in which
government introduces prohibitive policies, it takes a considerably long period of time to fix
any subsequent policy-induced damage. This is particularly true in the Thai automotive
industry where production technology tends to be in a process of ongoing development and
so not available for arm’s length type purchase.
Indigenous parts suppliers find themselves in a market consisting of lower-tier and bulky
body-related stamping parts suppliers. Design capability and product engineering is relatively
less frequently needed in the latter; and as for the former, there seems to be good growth
prospects as OEM suppliers still acquire their raw materials and intermediates locally. As the
majority of raw materials and intermediates involved in parts manufacturing require precise
engineering, it is necessary for indigenous manufacturers and OEM parts suppliers to work
together to make sure their components meet the requisite specifications. By means of such
cooperation, the former can benefit technologically from the latter.
125
The most important implication for policy is that it is very unlikely that the Thai government
can push MNE production towards meeting national objectives. Instead, they should limit
themselves to maintaining a conducive political and economic environment and to helping to
strengthen indigenous manufacturers’ absorptive capability. The former should be done to
maintain Thailand’s regional hub position. Regarding the latter, vocational training,
especially in engineering and science remains undeveloped. This should be a prioritised area
in which investment relocation for advanced activities (e.g. product design) is promoted and
benefits from increased MNE involvement are maximised.
6.3.2 Findings and Discussion of Exploratory Research in Further Exploring the Roles
of Thai Government Policy in the Development of the Thai Automotive Industry from
1960-2009
The in-depth elite structured interview was conducted with five Thai government policy
makers and automotive firm managers in order to further understand Thai automotive
industry development and the role government policy has played in it. The data collection
employed content analysis in order to allow categorisation into three groups, as explained in
the following section (see Table 5.1 Participant List for Phase I).
6.3.2.1 Regulation
The director of the Thailand Automotive Institute (TAI) (G1) identified government
regulation as the most important factor affecting Thai automotive industry development. The
managing director of Thai Rung Union Car Company (A1) agreed. G1 and A1 believed that
the most important policy was the introduction of the Local Content Requirement (LCR) in
1972, which required automotive companies to acquire parts locally. G1 stressed how hard it
was to adhere to this policy by stating:
“To acquire parts locally was very hard at that time because the Thai auto parts industry was
very small and the quality of local parts was very poor.”
G1 implied that the real success of the LCR depended on the increase of localisation
requirements enforced by the government. The LCR has been updated since 1978 and has
become more demanding in terms of the localisation level required. Negotiations among
126
government officials, assembly companies and local parts firms have occurred during this
process of change. G1 revealed that because local parts quality was low, assemblers were
forced to ask their suppliers to set up plants in Thailand to comply with the policy. A member
of the board of directors of Isuzu Thailand also mentioned that the government helped
support the private sector by preparing and developing the manufacturing infrastructure of the
country.
A1 pointed out the limitations of the domestic market and that a number of international
suppliers refused to set up plants in Thailand. As the LCR policy became more aggressive,
the assembly companies had no choice but to cooperate with local firms.
G1 revealed that the LCR during the 1980s revision was not restricted to automobile
assembly. It included also the local sourcing of mandatory parts such as safety glass, drum
brakes, batteries, exhaust pipes, and tires. G1 confirmed that:
“Because of this policy...Thai auto-part firms emerged and started to develop their business”
6.3.2.2 Taxation
Both G1 and G2 (Executive of the Excise Department) agreed that taxation was the most
important policy in the development of the Thai automotive industry. G1 identified the
original most significant taxation policy as the 1962 measure which prevented the import of
completely built-up (CBU) vehicles to Thailand. This set taxes as follows: 60 per cent on
completely built-up (CBU) passenger cars, 40 per cent on CBU commercial cars, and 20 per
cent on CBU trucks; the taxes on completely knocked-down kits (CKD) ranged from 10 per
cent on trucks, to 20 per cent on commercial cars and 30 per cent on passenger cars. These
rates were increased in 1969. CBU passenger vehicles were taxed at the new rate of 80 per
cent, and the rates for CBU commercial cars and CBU trucks rose to 60 and 40 per cent
respectively; CKD commercial cars were taxed at 40 per cent, and CKD passenger cars at 50
per cent.
“Tariffs for CKD and CBU in 1962 were the first effective showcases of the importance of
taxation policy.”
127
However, one of the board of directors of the Isuzu Company (A2) did not totally agree that
taxation was the most important policy in Thai automotive industry development and gave
the following advice:
“While taxation policy seems to be important, it is not effective without proper regulation
and incentives”
G3 (the automobile industrial specialist from the Office of Industrial Economics) disagreed
with A2 and pointed out that sometimes taxation policy was the only effective policy,
especially when the government was unable to facilitate other policies. For example, in 1997,
the year of the economic crisis, the Thai government still kept to the WTO agreement which
aimed to abolish LCR policies by January 2000. In order to lessen the negative impact of the
abolition, CKD vehicle tariffs were increased to 33 per cent in 2000 from their level of 20 per
cent in 1999.
6.3.2.3 Incentives
According to executives involved in this study, Thailand’s experience of automobile assembly
was very limited when it began developing its automobile industry in the early 1960s. Although
Thailand’s lack of manufacturing expertise put it at a disadvantage, G3 emphasised the
significance of government incentives in the development of the Thai automotive industry.
Indeed G3 pointed to the fact that:
“...through the granting of investment incentives to firms from abroad and the setting of
import duties at a high level to protect domestic industries, several multinational automobile
manufacturers felt encouraged enough to start joint ventures with local firms...”
G3 continuously emphasised that, initially, most assemblers used imported parts. Because
import duties were set at a high level to protect domestic industries, most Japanese
assemblers asked their suppliers to set up plants in Thailand. As G3 summarised:
“Japanese assemblers developed their own supplied networks and gave technical assistance
to local auto-part firms. This represented the first and most important stage in the
development of supporting industries.”
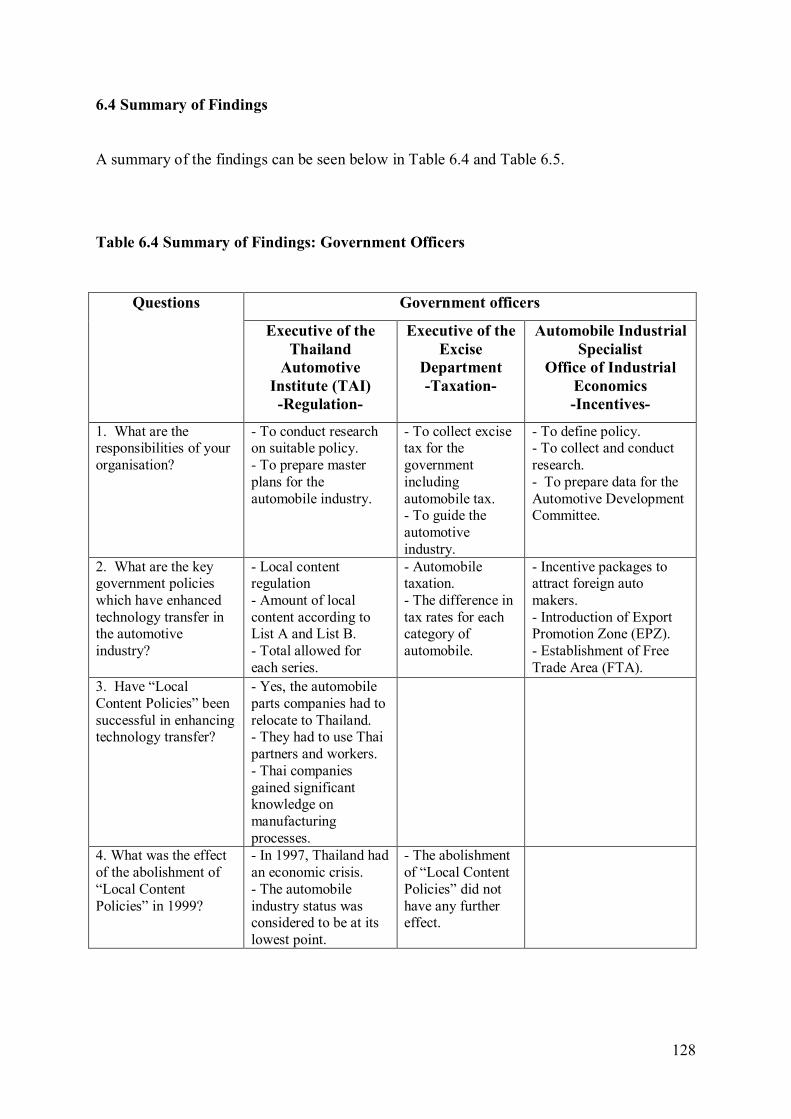
128
6.4 Summary of Findings
A summary of the findings can be seen below in Table 6.4 and Table 6.5.
Table 6.4 Summary of Findings: Government Officers
Questions Government officers
Executive of the Thailand
Automotive Institute (TAI) -Regulation-
Executive of the Excise
Department -Taxation-
Automobile Industrial Specialist
Office of Industrial Economics -Incentives-
1. What are the responsibilities of your organisation?
- To conduct research on suitable policy. - To prepare master plans for the automobile industry.
- To collect excise tax for the government including automobile tax. - To guide the automotive industry.
- To define policy. - To collect and conduct research. - To prepare data for the Automotive Development Committee.
2. What are the key government policies which have enhanced technology transfer in the automotive industry?
- Local content regulation - Amount of local content according to List A and List B. - Total allowed for each series.
- Automobile taxation. - The difference in tax rates for each category of automobile.
- Incentive packages to attract foreign auto makers. - Introduction of Export Promotion Zone (EPZ). - Establishment of Free Trade Area (FTA).
3. Have “Local Content Policies” been successful in enhancing technology transfer?
- Yes, the automobile parts companies had to relocate to Thailand. - They had to use Thai partners and workers. - Thai companies gained significant knowledge on manufacturing processes.
4. What was the effect of the abolishment of “Local Content Policies” in 1999?
- In 1997, Thailand had an economic crisis. - The automobile industry status was considered to be at its lowest point.
- The abolishment of “Local Content Policies” did not have any further effect.
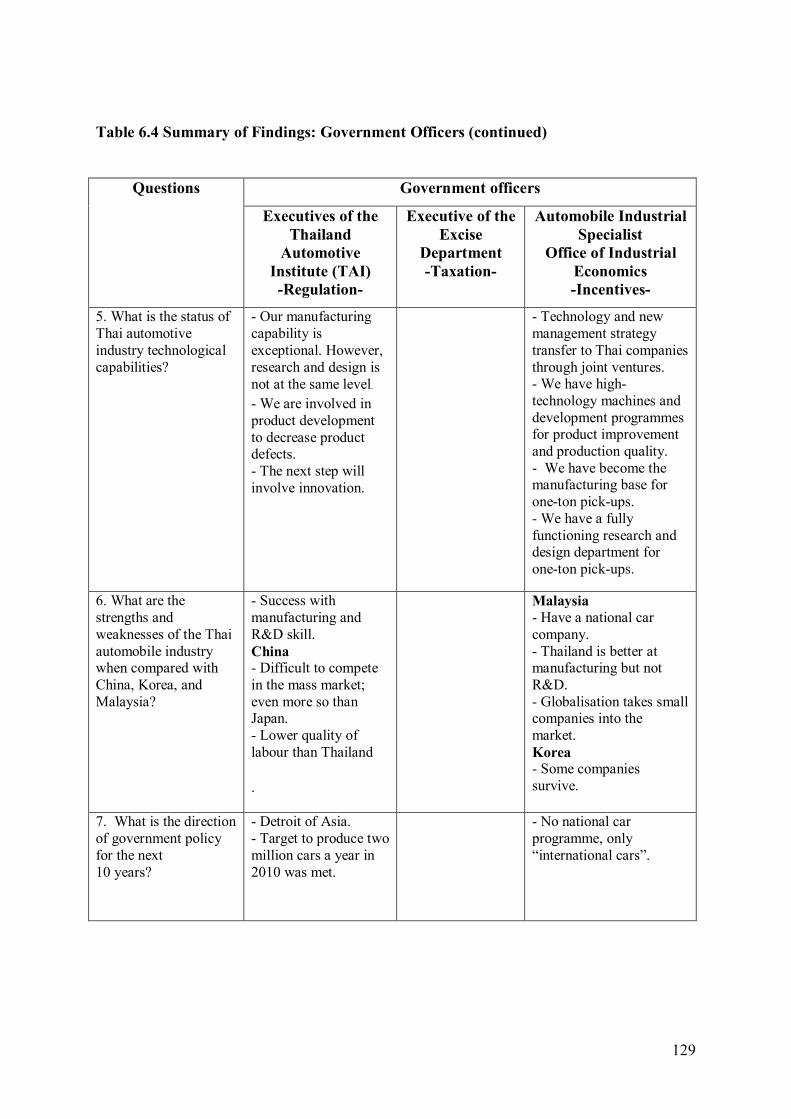
129
Table 6.4 Summary of Findings: Government Officers (continued)
Questions Government officers
Executives of the Thailand
Automotive Institute (TAI) -Regulation-
Executive of the Excise
Department -Taxation-
Automobile Industrial Specialist
Office of Industrial Economics -Incentives-
5. What is the status of Thai automotive industry technological capabilities?
- Our manufacturing capability is exceptional. However, research and design is not at the same level. - We are involved in product development to decrease product defects. - The next step will involve innovation.
- Technology and new management strategy transfer to Thai companies through joint ventures. - We have high-technology machines and development programmes for product improvement and production quality. - We have become the manufacturing base for one-ton pick-ups. - We have a fully functioning research and design department for one-ton pick-ups.
6. What are the strengths and weaknesses of the Thai automobile industry when compared with China, Korea, and Malaysia?
- Success with manufacturing and R&D skill. China - Difficult to compete in the mass market; even more so than Japan. - Lower quality of labour than Thailand .
Malaysia - Have a national car company. - Thailand is better at manufacturing but not R&D. - Globalisation takes small companies into the market. Korea - Some companies survive.
7. What is the direction of government policy for the next 10 years?
- Detroit of Asia. - Target to produce two million cars a year in 2010 was met.
- No national car programme, only “international cars”.
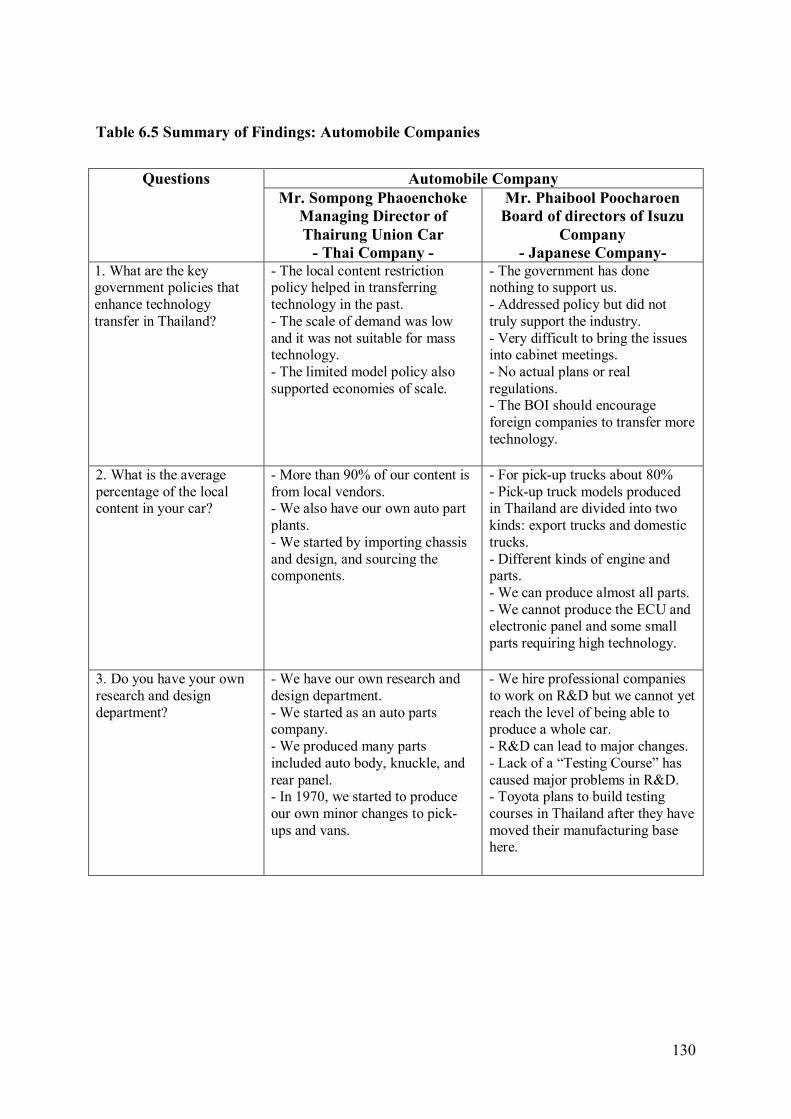
130
Table 6.5 Summary of Findings: Automobile Companies
Questions Automobile Company Mr. Sompong Phaoenchoke
Managing Director of Thairung Union Car
- Thai Company -
Mr. Phaibool Poocharoen Board of directors of Isuzu
Company - Japanese Company-
1. What are the key government policies that enhance technology transfer in Thailand?
- The local content restriction policy helped in transferring technology in the past. - The scale of demand was low and it was not suitable for mass technology. - The limited model policy also supported economies of scale.
- The government has done nothing to support us. - Addressed policy but did not truly support the industry. - Very difficult to bring the issues into cabinet meetings. - No actual plans or real regulations. - The BOI should encourage foreign companies to transfer more technology.
2. What is the average percentage of the local content in your car?
- More than 90% of our content is from local vendors. - We also have our own auto part plants. - We started by importing chassis and design, and sourcing the components.
- For pick-up trucks about 80% - Pick-up truck models produced in Thailand are divided into two kinds: export trucks and domestic trucks. - Different kinds of engine and parts. - We can produce almost all parts. - We cannot produce the ECU and electronic panel and some small parts requiring high technology.
3. Do you have your own research and design department?
- We have our own research and design department. - We started as an auto parts company. - We produced many parts included auto body, knuckle, and rear panel. - In 1970, we started to produce our own minor changes to pick-ups and vans.
- We hire professional companies to work on R&D but we cannot yet reach the level of being able to produce a whole car. - R&D can lead to major changes. - Lack of a “Testing Course” has caused major problems in R&D. - Toyota plans to build testing courses in Thailand after they have moved their manufacturing base here.
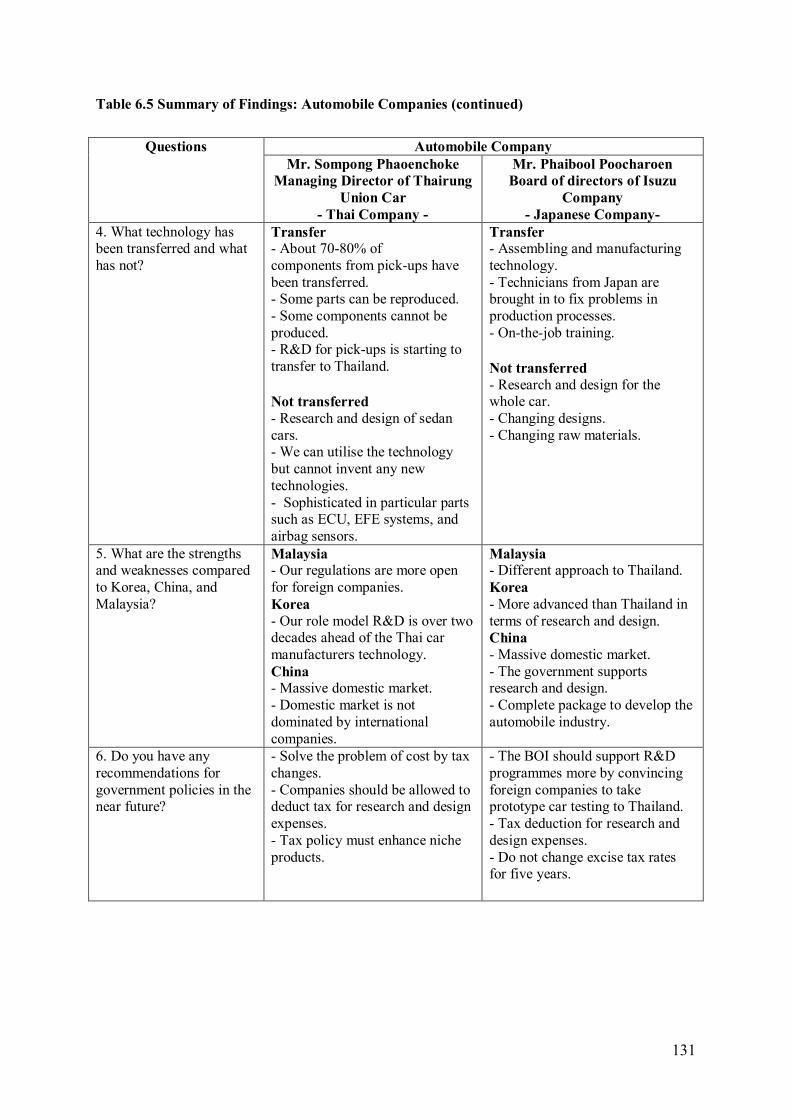
131
Table 6.5 Summary of Findings: Automobile Companies (continued)
Questions Automobile Company
Mr. Sompong Phaoenchoke Managing Director of Thairung
Union Car - Thai Company -
Mr. Phaibool Poocharoen Board of directors of Isuzu
Company - Japanese Company-
4. What technology has been transferred and what has not?
Transfer - About 70-80% of components from pick-ups have been transferred. - Some parts can be reproduced. - Some components cannot be produced. - R&D for pick-ups is starting to transfer to Thailand. Not transferred - Research and design of sedan cars. - We can utilise the technology but cannot invent any new technologies. - Sophisticated in particular parts such as ECU, EFE systems, and airbag sensors.
Transfer - Assembling and manufacturing technology. - Technicians from Japan are brought in to fix problems in production processes. - On-the-job training. Not transferred - Research and design for the whole car. - Changing designs. - Changing raw materials.
5. What are the strengths and weaknesses compared to Korea, China, and Malaysia?
Malaysia - Our regulations are more open for foreign companies. Korea - Our role model R&D is over two decades ahead of the Thai car manufacturers technology. China - Massive domestic market. - Domestic market is not dominated by international companies.
Malaysia - Different approach to Thailand. Korea - More advanced than Thailand in terms of research and design. China - Massive domestic market. - The government supports research and design. - Complete package to develop the automobile industry.
6. Do you have any recommendations for government policies in the near future?
- Solve the problem of cost by tax changes. - Companies should be allowed to deduct tax for research and design expenses. - Tax policy must enhance niche products.
- The BOI should support R&D programmes more by convincing foreign companies to take prototype car testing to Thailand. - Tax deduction for research and design expenses. - Do not change excise tax rates for five years.
132
6.5 Conclusion
The Phase I study aims to answer the first research question: “What government policies
were used to develop technological capability in the Thai automotive industry from 1960-
2009?” The two research approaches that are employed are documentary research and in-
depth elite interview as follows.
The documentary research (the full version of which is presented in Chapter 2) explains the
six phases of government policy from 1960 to 2009 that affected technological capability
development in the Thai automotive industry. Government policies for the auto-part industry
have moved from high to low local protection with a greater focus on export-orientated
strategies.
In the in-depth elite interviews, five interviewees from the government and private sectors
were recruited. In the Thai automotive industry, government policies used to develop
technological capabilities can be divided into three types; regulations, taxes, and incentives.
Most of the interviewees agreed that all three policy types have important roles in supporting
the activities and developing the technological capabilities of the organisation. FDI
investment has motivated MNEs to set up assembling plants in Thailand. However, to
comply with LCR regulations, MNEs are forced to procure local car components. CBU and
CKD regulations involve different tax rates for importing different types of vehicles and auto
parts. MNEs can pay lower taxes when they mostly use local parts and import few parts, such
as control units. According to the experts’ opinions, LCR, CBU, and CKD once had a big
impact on technology development but this is no longer the case. Other policies have now
become more impactful on R&D activities.
Excise tax has an impact on technological capability development, and its rate is satisfactory
for manufacturing companies. Essentially, R&D tax deduction is a recent regulation. These
experts agree that the government should support all kinds of R&D activities for local
suppliers. Launching R&D requires the hiring of foreign experts to assist and invest in
modern technologies. R&D tax deduction will support them in inventing new products.
Interestingly, setting up joint-venture companies with foreign business partners can provide a
short-cut for technology development. Thailand’s auto-part industry is at the midpoint of

133
R&D development, and more effort needs to be put in if it’s to reach its goal of becoming the
“Detroit of Asia.”
The Phase I findings are implemented in other chapters. In Chapter 4, the Phase I findings
(the effect of government policies) fill the gap in the literature review and form part of the
conceptual framework. In addition, in Chapter 5, the Phase I findings are used for creating a
questionnaire for the government policies section in Phase II.
134
Chapter 7
Phase II Quantitative Data Analysis: The Development of Technological
Capability of the Thai Automotive Industry
7.1 Introduction
This chapter covers the quantitative data analysis of the survey data gathered for Phase II of
the study. The main research objective of Thai auto-part firms is to gain an understanding of
related factors that are likely to support the development of technologies in the Thai
automotive industry. Thus, the research question for Phase II as shown in Figure 7.1 which is
addressed is “What factors have affected the technological capability development of local
Thai auto parts firms?”
7.2 Phase II Sample and Instrument Description
The revised version of the questionnaire (see Structured Survey Questionnaire in Appendix
II) was developed, and the questionnaire survey was carried out from July-November 2006.
In conjunction with the discussion on the data collection and sample for Phase II in Chapter 5
(Section 5.3), structured questionnaires were mailed to 400 Thai auto-part manufacturing
firm managers aimed at identifying the factors influencing the development of technological
capabilities in the Thai automotive industry. Each questionnaire package included a cover
letter specifying its purpose, instructions for return, a questionnaire form, and a ‘prepaid’
return envelope addressed to the researcher. The researcher also followed up participants by
phone to make sure that the questionnaire package had already reached them. Out of 400
mailed questionnaires, a total of 312 questionnaires were returned (a 78% response rate). The
researcher decided to drop 12 questionnaires (or 3.84 percent of returned questionnaires) that
were incompletely responded to. As a result, a total of 300 completely filled up
questionnaires (or 75 percent of mailed questionnaires) were used for data analysis.
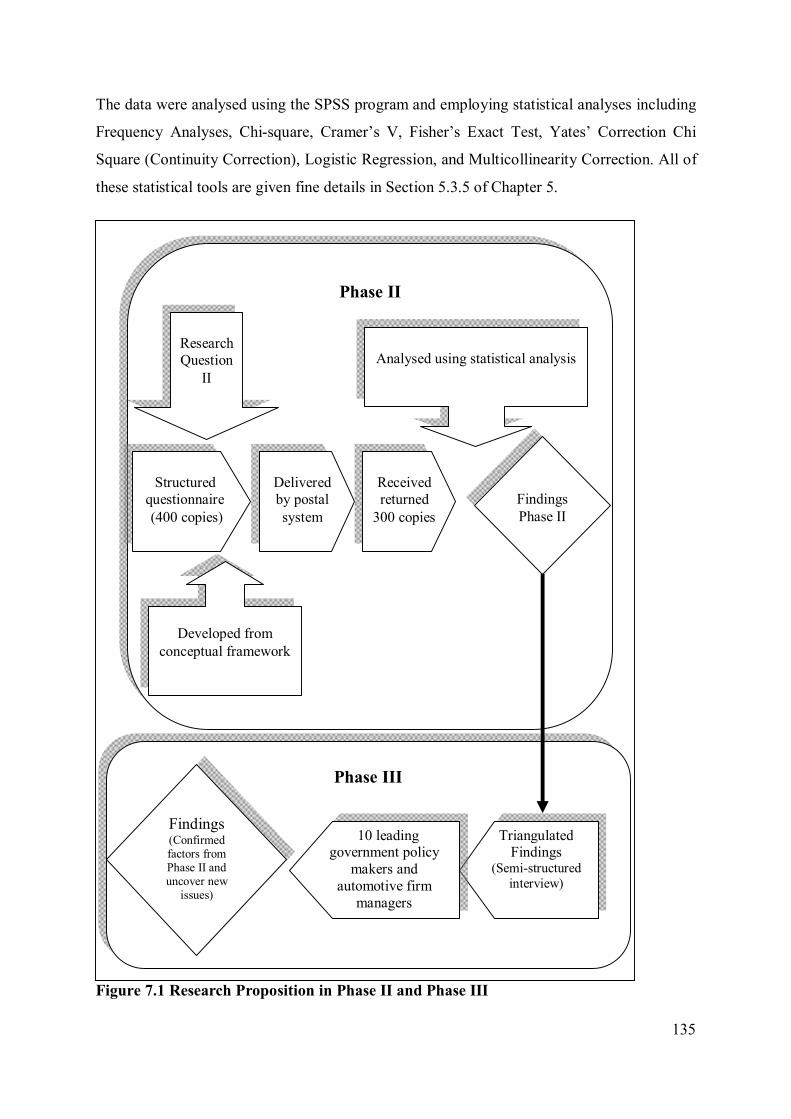
135
The data were analysed using the SPSS program and employing statistical analyses including
Frequency Analyses, Chi-square, Cramer’s V, Fisher’s Exact Test, Yates’ Correction Chi
Square (Continuity Correction), Logistic Regression, and Multicollinearity Correction. All of
these statistical tools are given fine details in Section 5.3.5 of Chapter 5.
Figure 7.1 Research Proposition in Phase II and Phase III
Phase II
Research Question
II
Structured
questionnaire (400 copies)
Developed from
conceptual framework
Delivered by postal system
Received returned
300 copies
Analysed using statistical analysis
Findings Phase II
Phase III
Triangulated Findings
(Semi-structured interview)
10 leading government policy
makers and automotive firm
managers
Findings (Confirmed factors from Phase II and uncover new
issues)
136
7.3 Phase II Findings: Factors Affecting Technological Capability Development in the
Thai Automotive Industry
Calculations on the data collected are aimed at finding the causal relationship between all 18
factors from the conceptual framework (see Figure 4.2 in Chapter 4) as independent variables
and technology capability development as a dependent variable. As pointed out in Section
3.5.2. R&D is used as the sole indicator of technology capability development. Therefore,
rather than technology capability development, it is the existence of R&D activities that is
used as the dependent variable in this study. The calculations in this chapter can be divided
into 2 sections as follows.
1) Chi-Square Tests and Cramer’s V: These tools were used to find the relationship
between all 18 factors and the existence of R&D activities. Particularly, Cramer’s V scores
demonstrate the level of association between tested variables. The statistically significant
factors from Chi-Square Tests were then used to construct the Logistic Regression Model.
2) Logistic Regression: This study can build logistic regression models.
7.3.1 Collected Data from Auto-Part Manufacturing Companies
To describe how a company could conduct its own research and development (R&D)
activities, data from 18 potential variables in the conceptual framework were collected and
analysed as follows.
7.3.1.1 Size of the Company (X1)
The size of a company could be defined by the number of employees (see Section 3.8.1 of
Chapter 3). In this study, size of the company is classified into 5 groups:
1. Micron : company having 1 to 50 workers.
2. Small: company having 51 to 100 workers.
3. Medium: company having 101 to 500 workers.
4. Large: company having 501 to 1,000 workers.
5. Multi corporate company: having more than 1,001 workers.
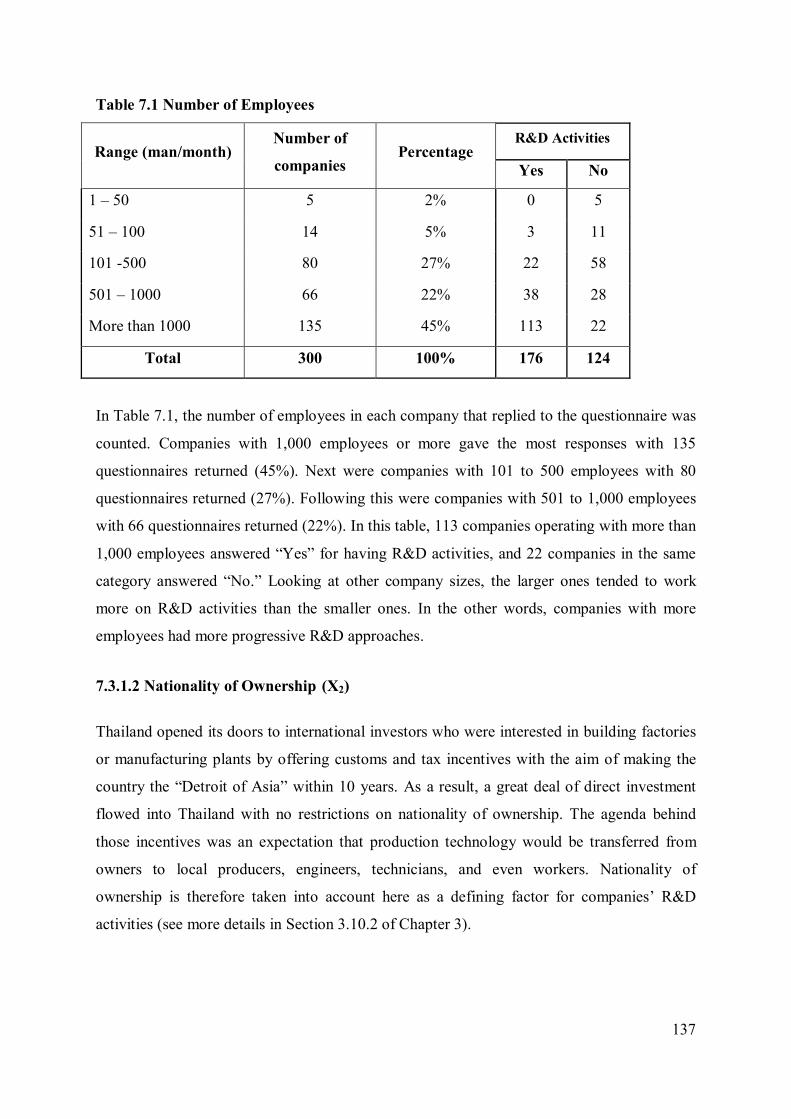
137
Table 7.1 Number of Employees
Range (man/month) Number of
companies Percentage
R&D Activities
Yes No
1 – 50 5 2% 0 5
51 – 100 14 5% 3 11
101 -500 80 27% 22 58
501 – 1000 66 22% 38 28
More than 1000 135 45% 113 22
Total 300 100% 176 124
In Table 7.1, the number of employees in each company that replied to the questionnaire was
counted. Companies with 1,000 employees or more gave the most responses with 135
questionnaires returned (45%). Next were companies with 101 to 500 employees with 80
questionnaires returned (27%). Following this were companies with 501 to 1,000 employees
with 66 questionnaires returned (22%). In this table, 113 companies operating with more than
1,000 employees answered “Yes” for having R&D activities, and 22 companies in the same
category answered “No.” Looking at other company sizes, the larger ones tended to work
more on R&D activities than the smaller ones. In the other words, companies with more
employees had more progressive R&D approaches.
7.3.1.2 Nationality of Ownership (X2)
Thailand opened its doors to international investors who were interested in building factories
or manufacturing plants by offering customs and tax incentives with the aim of making the
country the “Detroit of Asia” within 10 years. As a result, a great deal of direct investment
flowed into Thailand with no restrictions on nationality of ownership. The agenda behind
those incentives was an expectation that production technology would be transferred from
owners to local producers, engineers, technicians, and even workers. Nationality of
ownership is therefore taken into account here as a defining factor for companies’ R&D
activities (see more details in Section 3.10.2 of Chapter 3).
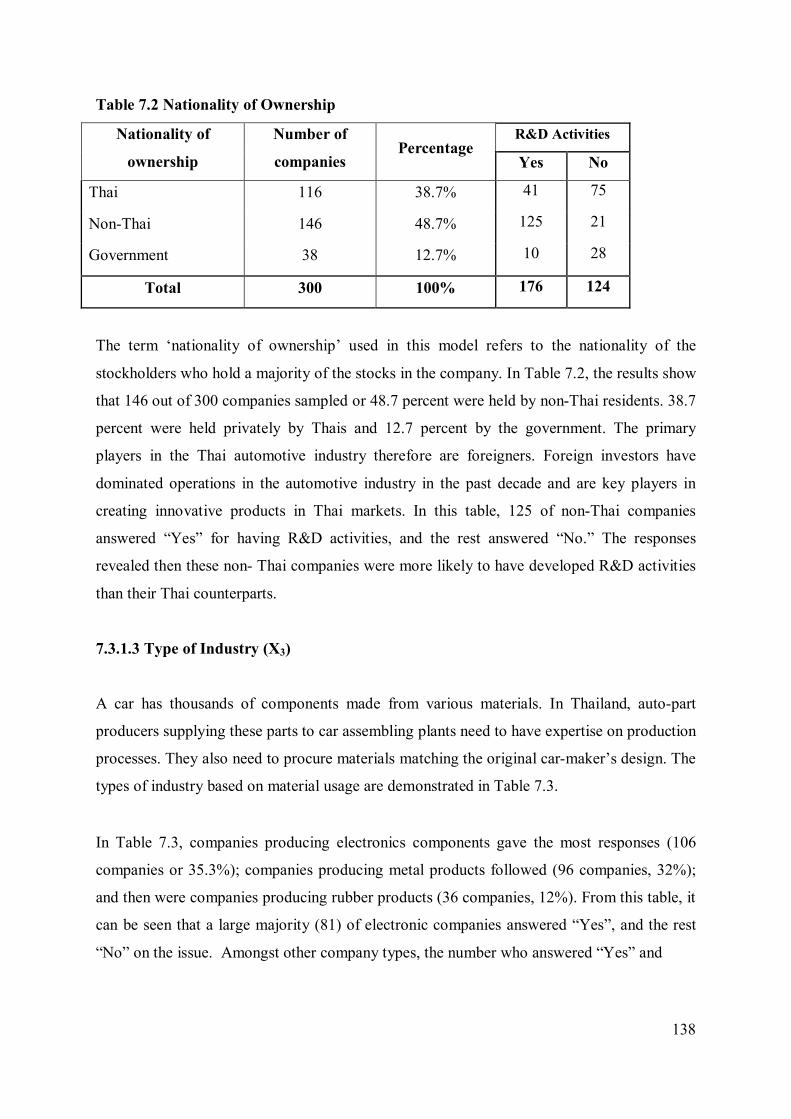
138
Table 7.2 Nationality of Ownership
Nationality of
ownership
Number of
companies Percentage
R&D Activities
Yes No
Thai 116 38.7% 41 75
Non-Thai 146 48.7% 125 21
Government 38 12.7% 10 28
Total 300 100% 176 124
The term ‘nationality of ownership’ used in this model refers to the nationality of the
stockholders who hold a majority of the stocks in the company. In Table 7.2, the results show
that 146 out of 300 companies sampled or 48.7 percent were held by non-Thai residents. 38.7
percent were held privately by Thais and 12.7 percent by the government. The primary
players in the Thai automotive industry therefore are foreigners. Foreign investors have
dominated operations in the automotive industry in the past decade and are key players in
creating innovative products in Thai markets. In this table, 125 of non-Thai companies
answered “Yes” for having R&D activities, and the rest answered “No.” The responses
revealed then these non- Thai companies were more likely to have developed R&D activities
than their Thai counterparts.
7.3.1.3 Type of Industry (X3)
A car has thousands of components made from various materials. In Thailand, auto-part
producers supplying these parts to car assembling plants need to have expertise on production
processes. They also need to procure materials matching the original car-maker’s design. The
types of industry based on material usage are demonstrated in Table 7.3.
In Table 7.3, companies producing electronics components gave the most responses (106
companies or 35.3%); companies producing metal products followed (96 companies, 32%);
and then were companies producing rubber products (36 companies, 12%). From this table, it
can be seen that a large majority (81) of electronic companies answered “Yes”, and the rest
“No” on the issue. Amongst other company types, the number who answered “Yes” and
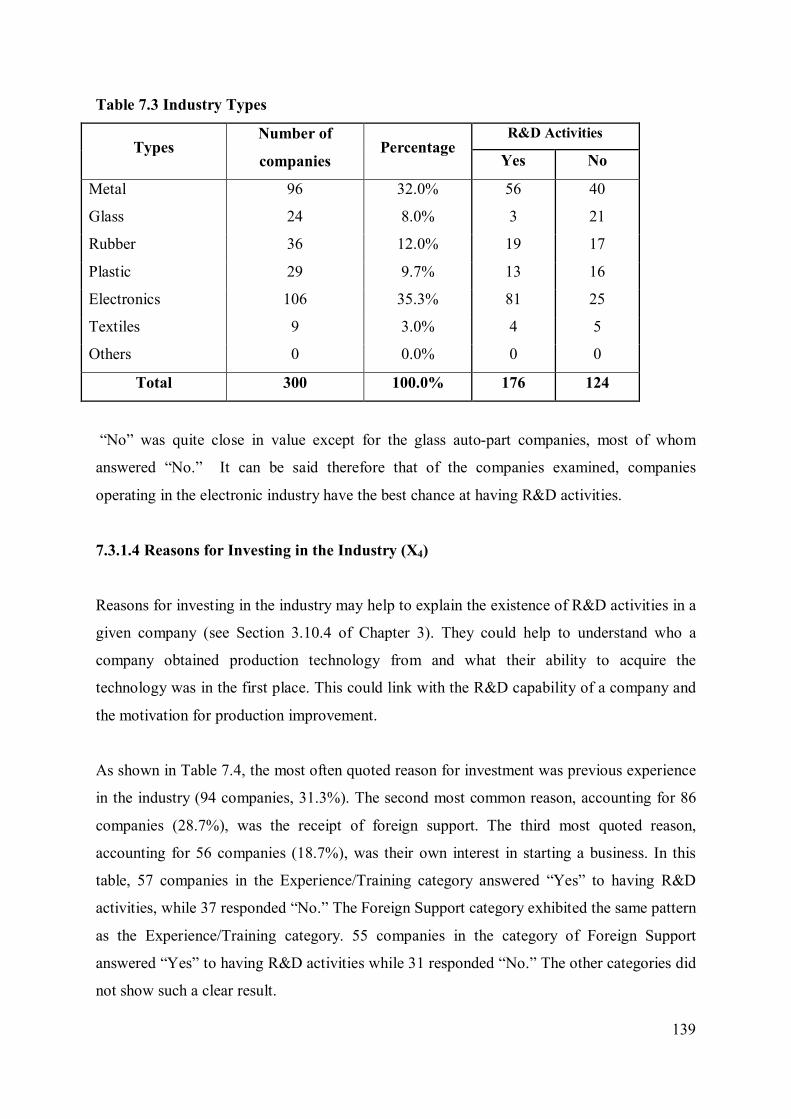
139
Table 7.3 Industry Types
Types Number of
companies Percentage
R&D Activities
Yes No
Metal 96 32.0% 56 40
Glass 24 8.0% 3 21
Rubber 36 12.0% 19 17
Plastic 29 9.7% 13 16
Electronics 106 35.3% 81 25
Textiles 9 3.0% 4 5
Others 0 0.0% 0 0
Total 300 100.0% 176 124
“No” was quite close in value except for the glass auto-part companies, most of whom
answered “No.” It can be said therefore that of the companies examined, companies
operating in the electronic industry have the best chance at having R&D activities.
7.3.1.4 Reasons for Investing in the Industry (X4)
Reasons for investing in the industry may help to explain the existence of R&D activities in a
given company (see Section 3.10.4 of Chapter 3). They could help to understand who a
company obtained production technology from and what their ability to acquire the
technology was in the first place. This could link with the R&D capability of a company and
the motivation for production improvement.
As shown in Table 7.4, the most often quoted reason for investment was previous experience
in the industry (94 companies, 31.3%). The second most common reason, accounting for 86
companies (28.7%), was the receipt of foreign support. The third most quoted reason,
accounting for 56 companies (18.7%), was their own interest in starting a business. In this
table, 57 companies in the Experience/Training category answered “Yes” to having R&D
activities, while 37 responded “No.” The Foreign Support category exhibited the same pattern
as the Experience/Training category. 55 companies in the category of Foreign Support
answered “Yes” to having R&D activities while 31 responded “No.” The other categories did
not show such a clear result.
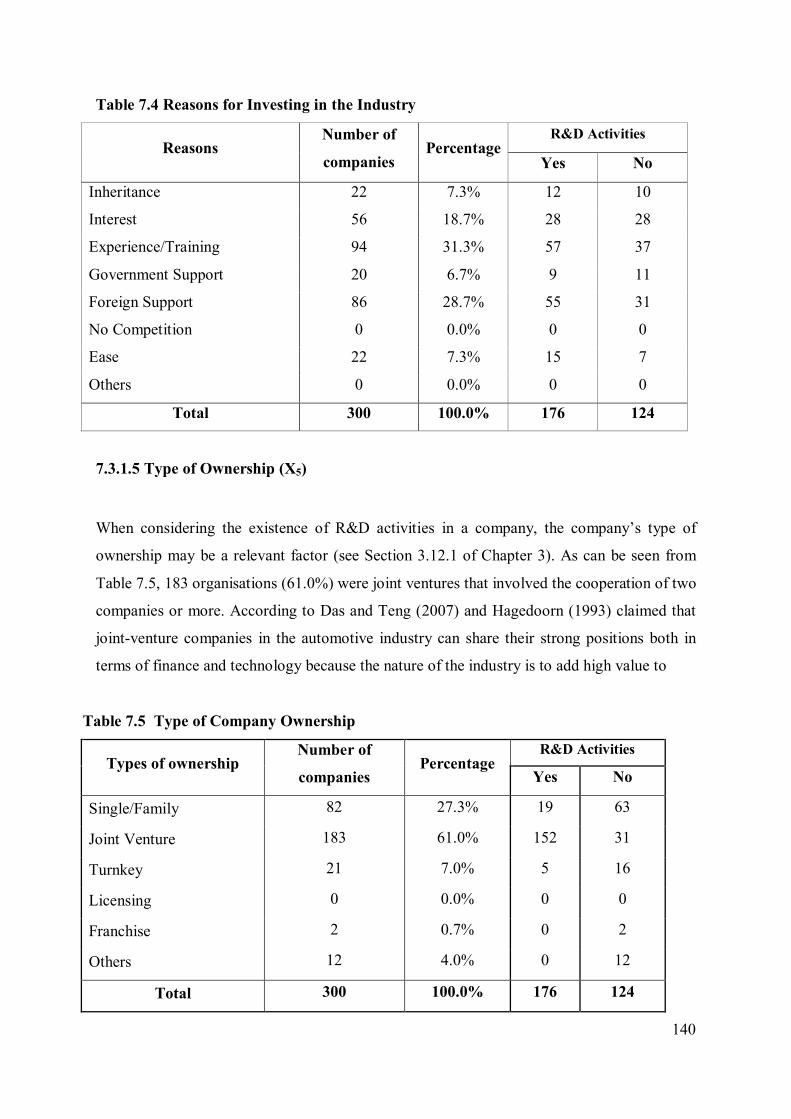
140
Table 7.4 Reasons for Investing in the Industry
Reasons Number of
companies Percentage
R&D Activities
Yes No
Inheritance 22 7.3% 12 10
Interest 56 18.7% 28 28
Experience/Training 94 31.3% 57 37
Government Support 20 6.7% 9 11
Foreign Support 86 28.7% 55 31
No Competition 0 0.0% 0 0
Ease 22 7.3% 15 7
Others 0 0.0% 0 0
Total 300 100.0% 176 124
7.3.1.5 Type of Ownership (X5)
When considering the existence of R&D activities in a company, the company’s type of
ownership may be a relevant factor (see Section 3.12.1 of Chapter 3). As can be seen from
Table 7.5, 183 organisations (61.0%) were joint ventures that involved the cooperation of two
companies or more. According to Das and Teng (2007) and Hagedoorn (1993) claimed that
joint-venture companies in the automotive industry can share their strong positions both in
terms of finance and technology because the nature of the industry is to add high value to
Table 7.5 Type of Company Ownership
Types of ownership Number of
companies Percentage
R&D Activities
Yes No
Single/Family 82 27.3% 19 63
Joint Venture 183 61.0% 152 31
Turnkey 21 7.0% 5 16
Licensing 0 0.0% 0 0
Franchise 2 0.7% 0 2
Others 12 4.0% 0 12
Total 300 100.0% 176 124
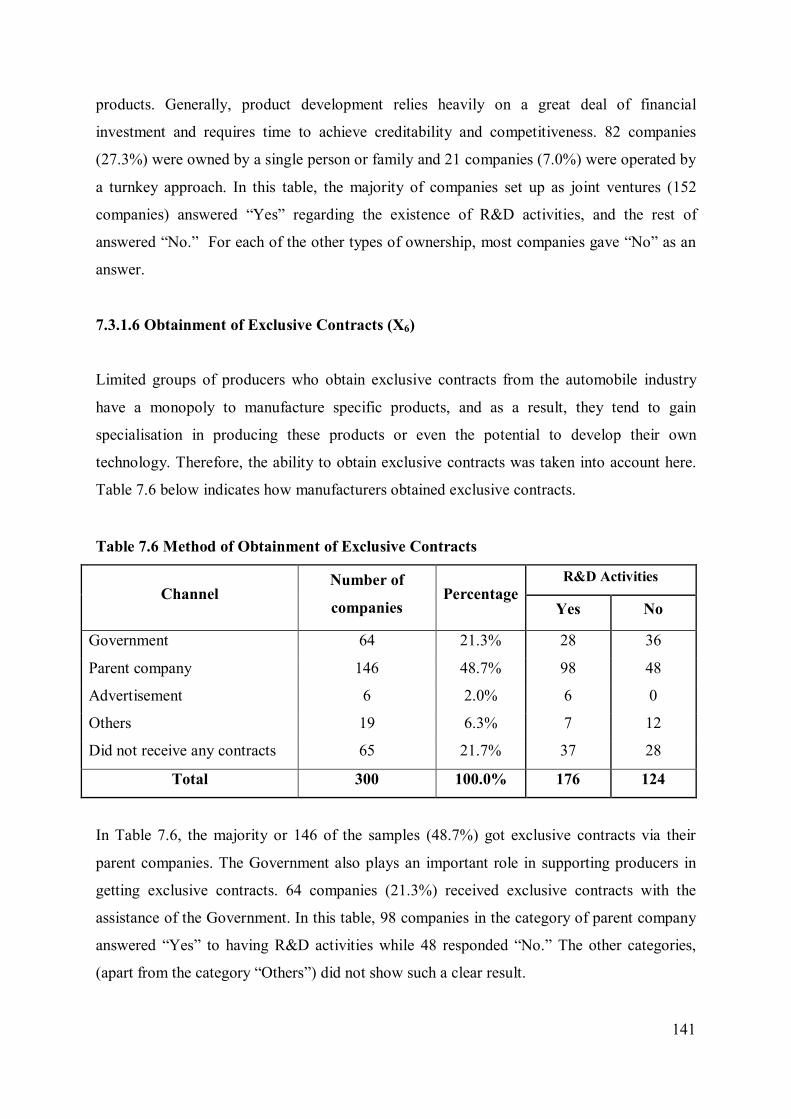
141
products. Generally, product development relies heavily on a great deal of financial
investment and requires time to achieve creditability and competitiveness. 82 companies
(27.3%) were owned by a single person or family and 21 companies (7.0%) were operated by
a turnkey approach. In this table, the majority of companies set up as joint ventures (152
companies) answered “Yes” regarding the existence of R&D activities, and the rest of
answered “No.” For each of the other types of ownership, most companies gave “No” as an
answer.
7.3.1.6 Obtainment of Exclusive Contracts (X6)
Limited groups of producers who obtain exclusive contracts from the automobile industry
have a monopoly to manufacture specific products, and as a result, they tend to gain
specialisation in producing these products or even the potential to develop their own
technology. Therefore, the ability to obtain exclusive contracts was taken into account here.
Table 7.6 below indicates how manufacturers obtained exclusive contracts.
Table 7.6 Method of Obtainment of Exclusive Contracts
Channel Number of
companies Percentage
R&D Activities
Yes No
Government 64 21.3% 28 36
Parent company 146 48.7% 98 48
Advertisement 6 2.0% 6 0
Others 19 6.3% 7 12
Did not receive any contracts 65 21.7% 37 28
Total 300 100.0% 176 124
In Table 7.6, the majority or 146 of the samples (48.7%) got exclusive contracts via their
parent companies. The Government also plays an important role in supporting producers in
getting exclusive contracts. 64 companies (21.3%) received exclusive contracts with the
assistance of the Government. In this table, 98 companies in the category of parent company
answered “Yes” to having R&D activities while 48 responded “No.” The other categories,
(apart from the category “Others”) did not show such a clear result.
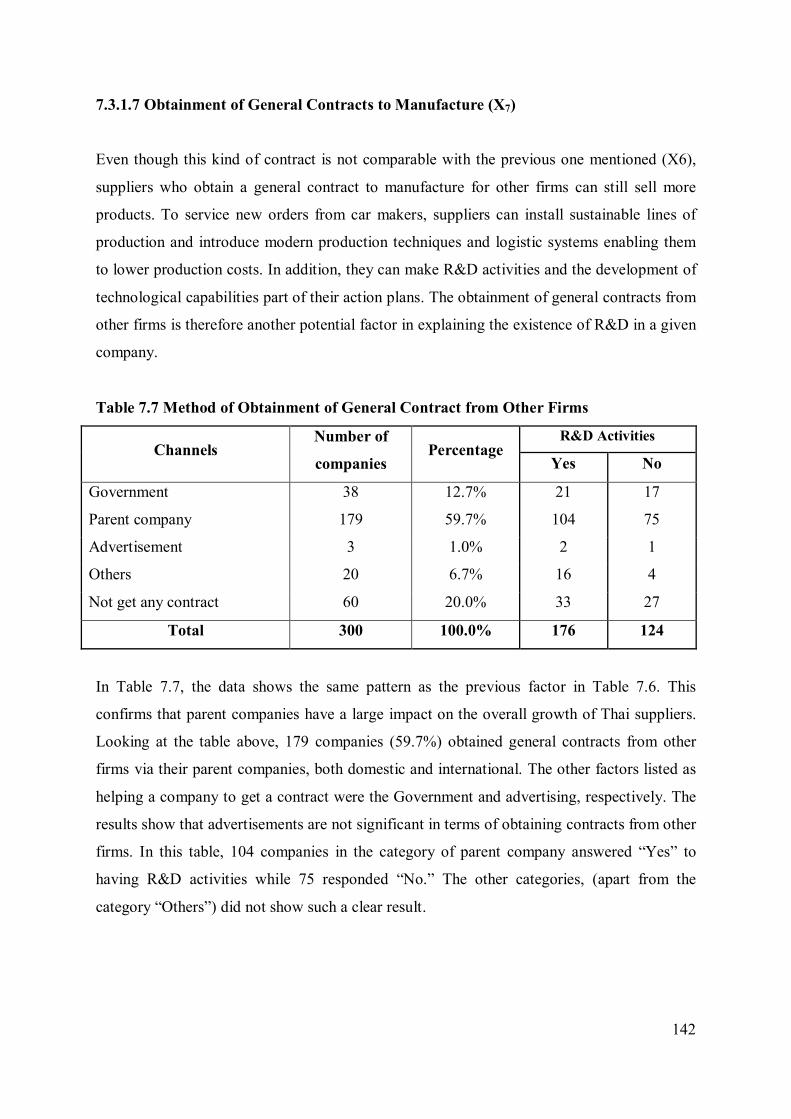
142
7.3.1.7 Obtainment of General Contracts to Manufacture (X7)
Even though this kind of contract is not comparable with the previous one mentioned (X6),
suppliers who obtain a general contract to manufacture for other firms can still sell more
products. To service new orders from car makers, suppliers can install sustainable lines of
production and introduce modern production techniques and logistic systems enabling them
to lower production costs. In addition, they can make R&D activities and the development of
technological capabilities part of their action plans. The obtainment of general contracts from
other firms is therefore another potential factor in explaining the existence of R&D in a given
company.
Table 7.7 Method of Obtainment of General Contract from Other Firms
Channels Number of
companies Percentage
R&D Activities
Yes No
Government 38 12.7% 21 17
Parent company 179 59.7% 104 75
Advertisement 3 1.0% 2 1
Others 20 6.7% 16 4
Not get any contract 60 20.0% 33 27
Total 300 100.0% 176 124
In Table 7.7, the data shows the same pattern as the previous factor in Table 7.6. This
confirms that parent companies have a large impact on the overall growth of Thai suppliers.
Looking at the table above, 179 companies (59.7%) obtained general contracts from other
firms via their parent companies, both domestic and international. The other factors listed as
helping a company to get a contract were the Government and advertising, respectively. The
results show that advertisements are not significant in terms of obtaining contracts from other
firms. In this table, 104 companies in the category of parent company answered “Yes” to
having R&D activities while 75 responded “No.” The other categories, (apart from the
category “Others”) did not show such a clear result.
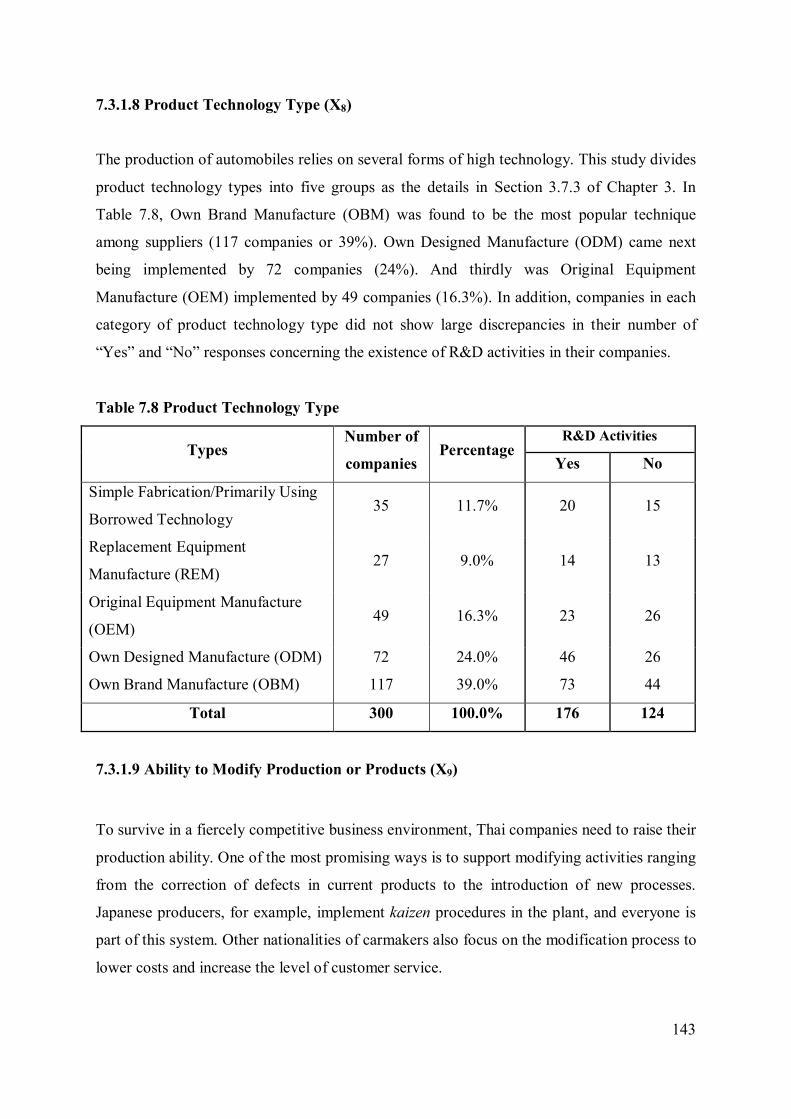
143
7.3.1.8 Product Technology Type (X8)
The production of automobiles relies on several forms of high technology. This study divides
product technology types into five groups as the details in Section 3.7.3 of Chapter 3. In
Table 7.8, Own Brand Manufacture (OBM) was found to be the most popular technique
among suppliers (117 companies or 39%). Own Designed Manufacture (ODM) came next
being implemented by 72 companies (24%). And thirdly was Original Equipment
Manufacture (OEM) implemented by 49 companies (16.3%). In addition, companies in each
category of product technology type did not show large discrepancies in their number of
“Yes” and “No” responses concerning the existence of R&D activities in their companies.
Table 7.8 Product Technology Type
Types Number of
companies Percentage
R&D Activities
Yes No
Simple Fabrication/Primarily Using
Borrowed Technology 35 11.7% 20 15
Replacement Equipment
Manufacture (REM) 27 9.0% 14 13
Original Equipment Manufacture
(OEM) 49 16.3% 23 26
Own Designed Manufacture (ODM) 72 24.0% 46 26
Own Brand Manufacture (OBM) 117 39.0% 73 44
Total 300 100.0% 176 124
7.3.1.9 Ability to Modify Production or Products (X9)
To survive in a fiercely competitive business environment, Thai companies need to raise their
production ability. One of the most promising ways is to support modifying activities ranging
from the correction of defects in current products to the introduction of new processes.
Japanese producers, for example, implement kaizen procedures in the plant, and everyone is
part of this system. Other nationalities of carmakers also focus on the modification process to
lower costs and increase the level of customer service.
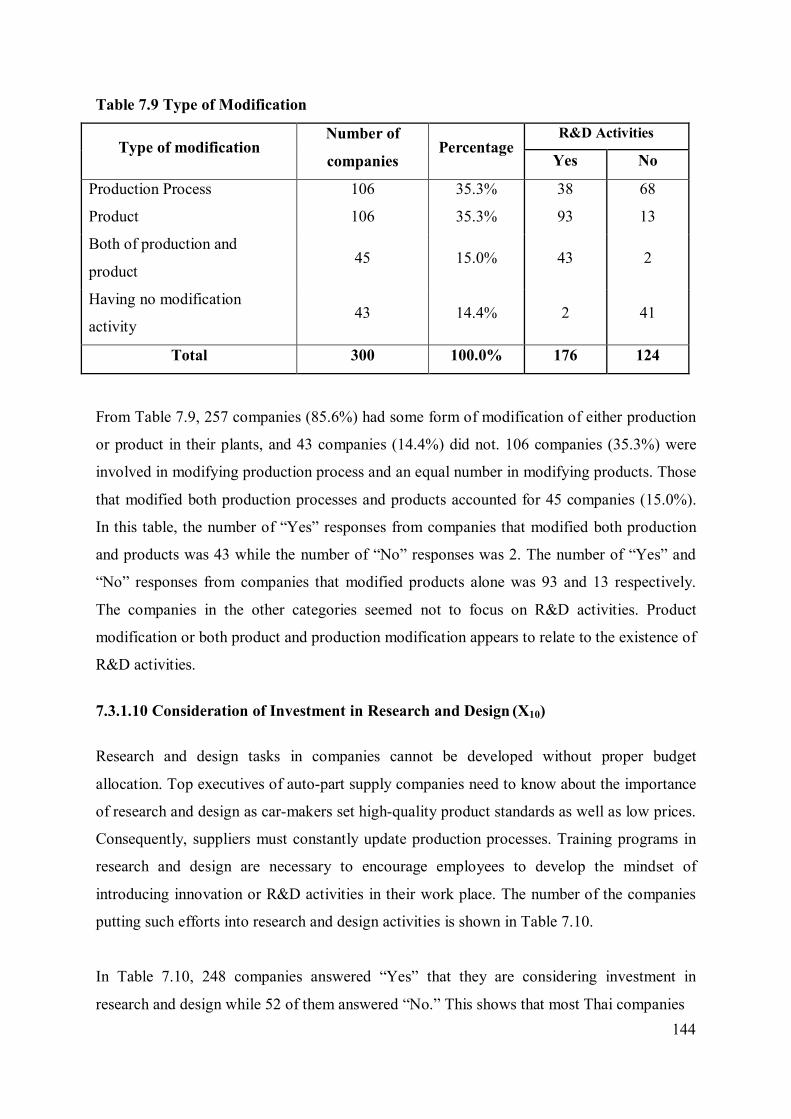
144
Table 7.9 Type of Modification
Type of modification Number of
companies Percentage
R&D Activities
Yes No
Production Process 106 35.3% 38 68
Product 106 35.3% 93 13
Both of production and
product 45 15.0% 43 2
Having no modification
activity 43 14.4% 2 41
Total 300 100.0% 176 124
From Table 7.9, 257 companies (85.6%) had some form of modification of either production
or product in their plants, and 43 companies (14.4%) did not. 106 companies (35.3%) were
involved in modifying production process and an equal number in modifying products. Those
that modified both production processes and products accounted for 45 companies (15.0%).
In this table, the number of “Yes” responses from companies that modified both production
and products was 43 while the number of “No” responses was 2. The number of “Yes” and
“No” responses from companies that modified products alone was 93 and 13 respectively.
The companies in the other categories seemed not to focus on R&D activities. Product
modification or both product and production modification appears to relate to the existence of
R&D activities.
7.3.1.10 Consideration of Investment in Research and Design (X10)
Research and design tasks in companies cannot be developed without proper budget
allocation. Top executives of auto-part supply companies need to know about the importance
of research and design as car-makers set high-quality product standards as well as low prices.
Consequently, suppliers must constantly update production processes. Training programs in
research and design are necessary to encourage employees to develop the mindset of
introducing innovation or R&D activities in their work place. The number of the companies
putting such efforts into research and design activities is shown in Table 7.10.
In Table 7.10, 248 companies answered “Yes” that they are considering investment in
research and design while 52 of them answered “No.” This shows that most Thai companies
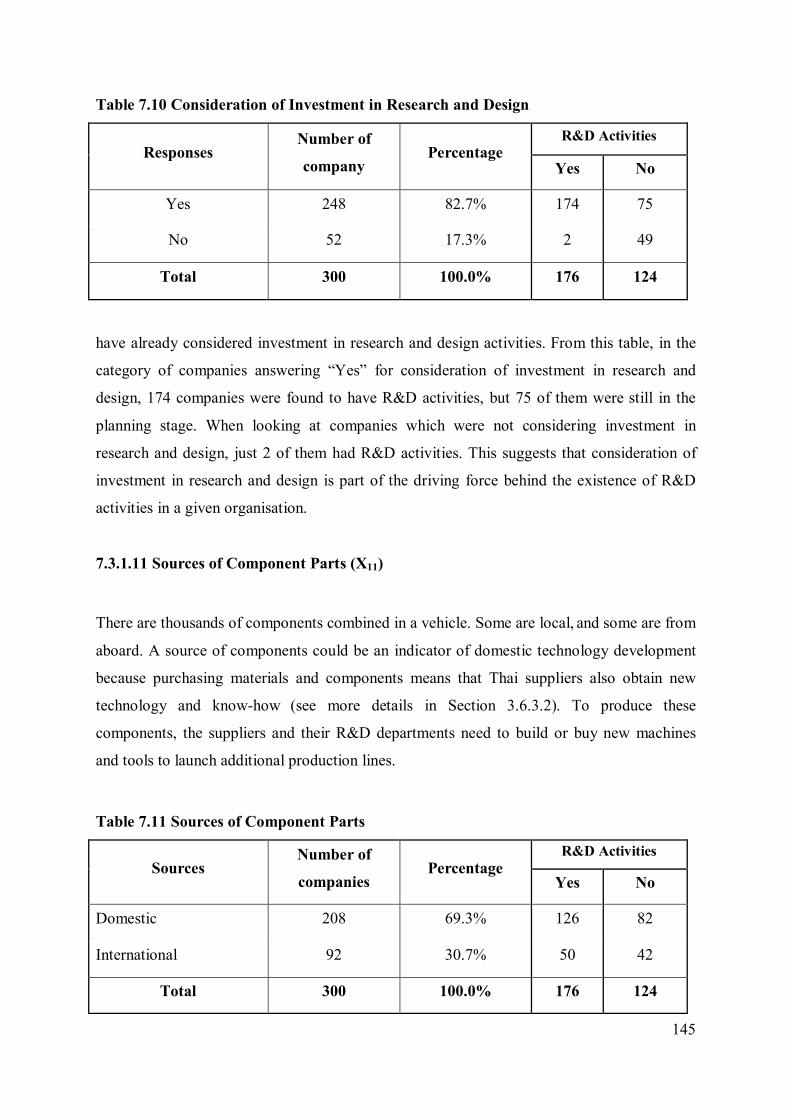
145
Table 7.10 Consideration of Investment in Research and Design
Responses Number of
company Percentage
R&D Activities
Yes No
Yes 248 82.7% 174 75
No 52 17.3% 2 49
Total 300 100.0% 176 124
have already considered investment in research and design activities. From this table, in the
category of companies answering “Yes” for consideration of investment in research and
design, 174 companies were found to have R&D activities, but 75 of them were still in the
planning stage. When looking at companies which were not considering investment in
research and design, just 2 of them had R&D activities. This suggests that consideration of
investment in research and design is part of the driving force behind the existence of R&D
activities in a given organisation.
7.3.1.11 Sources of Component Parts (X11)
There are thousands of components combined in a vehicle. Some are local, and some are from
aboard. A source of components could be an indicator of domestic technology development
because purchasing materials and components means that Thai suppliers also obtain new
technology and know-how (see more details in Section 3.6.3.2). To produce these
components, the suppliers and their R&D departments need to build or buy new machines
and tools to launch additional production lines.
Table 7.11 Sources of Component Parts
Sources Number of
companies Percentage
R&D Activities
Yes No
Domestic 208 69.3% 126 82
International 92 30.7% 50 42
Total 300 100.0% 176 124
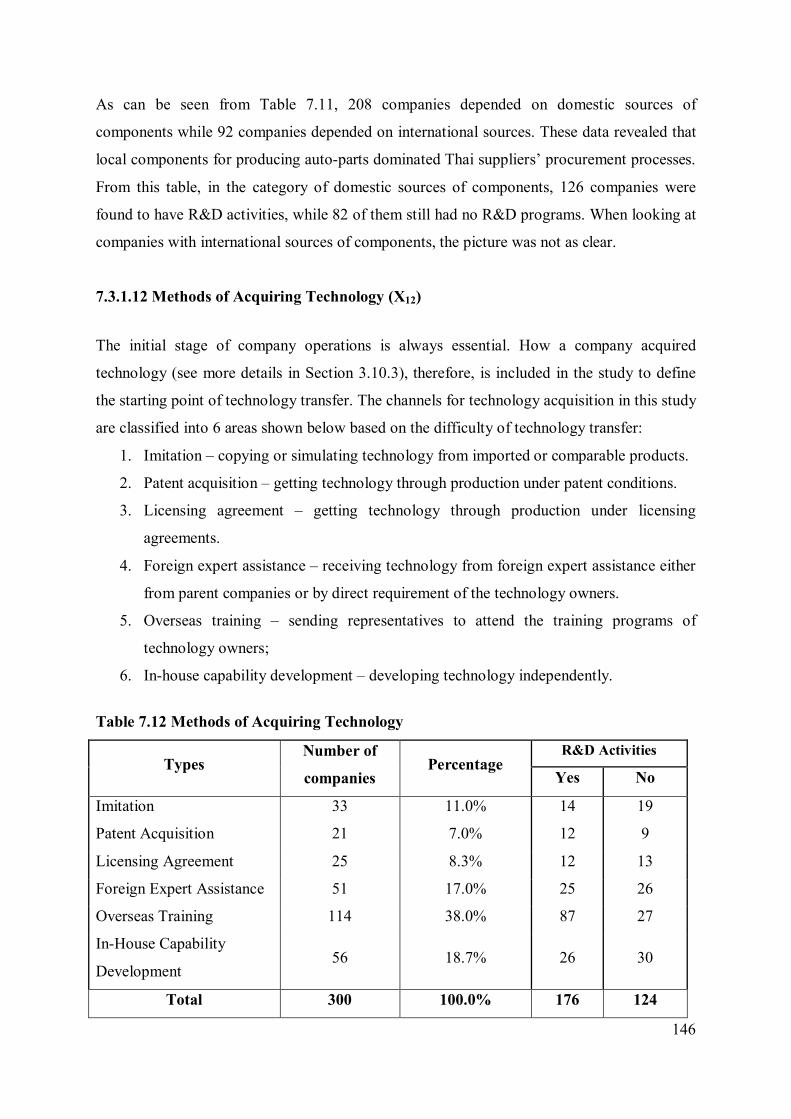
146
As can be seen from Table 7.11, 208 companies depended on domestic sources of
components while 92 companies depended on international sources. These data revealed that
local components for producing auto-parts dominated Thai suppliers’ procurement processes.
From this table, in the category of domestic sources of components, 126 companies were
found to have R&D activities, while 82 of them still had no R&D programs. When looking at
companies with international sources of components, the picture was not as clear.
7.3.1.12 Methods of Acquiring Technology (X12)
The initial stage of company operations is always essential. How a company acquired
technology (see more details in Section 3.10.3), therefore, is included in the study to define
the starting point of technology transfer. The channels for technology acquisition in this study
are classified into 6 areas shown below based on the difficulty of technology transfer:
1. Imitation – copying or simulating technology from imported or comparable products.
2. Patent acquisition – getting technology through production under patent conditions.
3. Licensing agreement – getting technology through production under licensing
agreements.
4. Foreign expert assistance – receiving technology from foreign expert assistance either
from parent companies or by direct requirement of the technology owners.
5. Overseas training – sending representatives to attend the training programs of
technology owners;
6. In-house capability development – developing technology independently.
Table 7.12 Methods of Acquiring Technology
Types Number of
companies Percentage
R&D Activities
Yes No
Imitation 33 11.0% 14 19
Patent Acquisition 21 7.0% 12 9
Licensing Agreement 25 8.3% 12 13
Foreign Expert Assistance 51 17.0% 25 26
Overseas Training 114 38.0% 87 27
In-House Capability
Development 56 18.7% 26 30
Total 300 100.0% 176 124
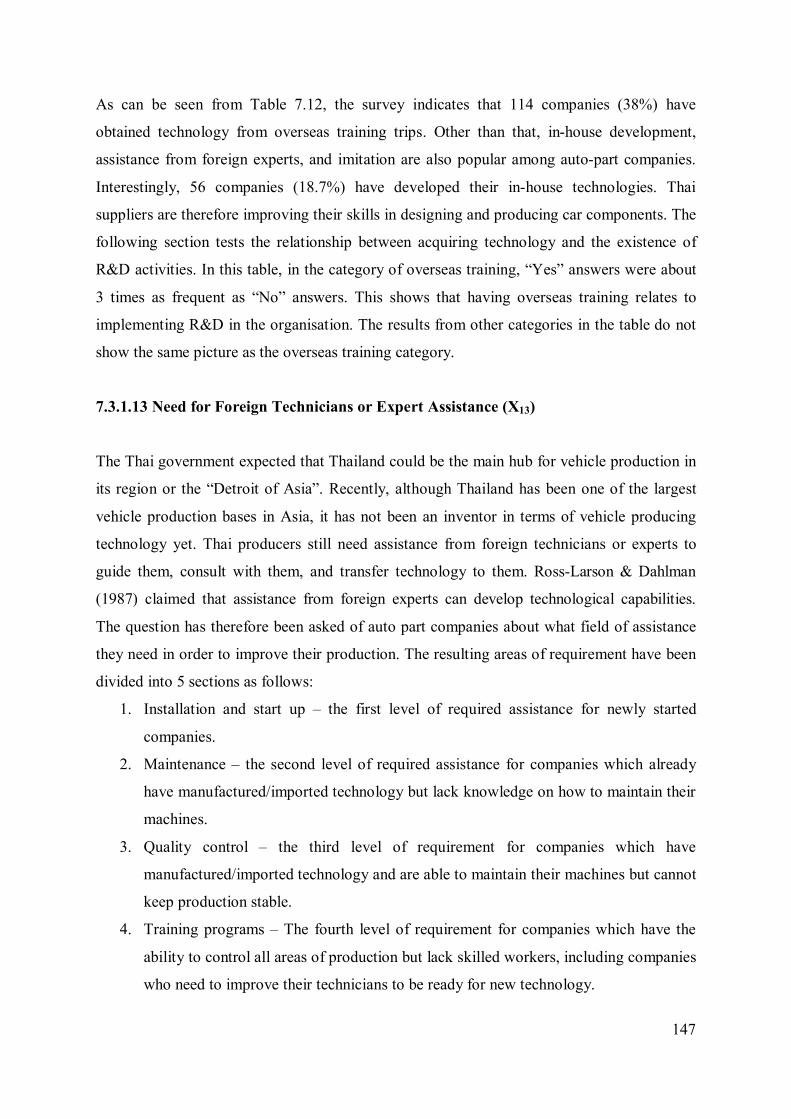
147
As can be seen from Table 7.12, the survey indicates that 114 companies (38%) have
obtained technology from overseas training trips. Other than that, in-house development,
assistance from foreign experts, and imitation are also popular among auto-part companies.
Interestingly, 56 companies (18.7%) have developed their in-house technologies. Thai
suppliers are therefore improving their skills in designing and producing car components. The
following section tests the relationship between acquiring technology and the existence of
R&D activities. In this table, in the category of overseas training, “Yes” answers were about
3 times as frequent as “No” answers. This shows that having overseas training relates to
implementing R&D in the organisation. The results from other categories in the table do not
show the same picture as the overseas training category.
7.3.1.13 Need for Foreign Technicians or Expert Assistance (X13)
The Thai government expected that Thailand could be the main hub for vehicle production in
its region or the “Detroit of Asia”. Recently, although Thailand has been one of the largest
vehicle production bases in Asia, it has not been an inventor in terms of vehicle producing
technology yet. Thai producers still need assistance from foreign technicians or experts to
guide them, consult with them, and transfer technology to them. Ross-Larson & Dahlman
(1987) claimed that assistance from foreign experts can develop technological capabilities.
The question has therefore been asked of auto part companies about what field of assistance
they need in order to improve their production. The resulting areas of requirement have been
divided into 5 sections as follows:
1. Installation and start up – the first level of required assistance for newly started
companies.
2. Maintenance – the second level of required assistance for companies which already
have manufactured/imported technology but lack knowledge on how to maintain their
machines.
3. Quality control – the third level of requirement for companies which have
manufactured/imported technology and are able to maintain their machines but cannot
keep production stable.
4. Training programs – The fourth level of requirement for companies which have the
ability to control all areas of production but lack skilled workers, including companies
who need to improve their technicians to be ready for new technology.
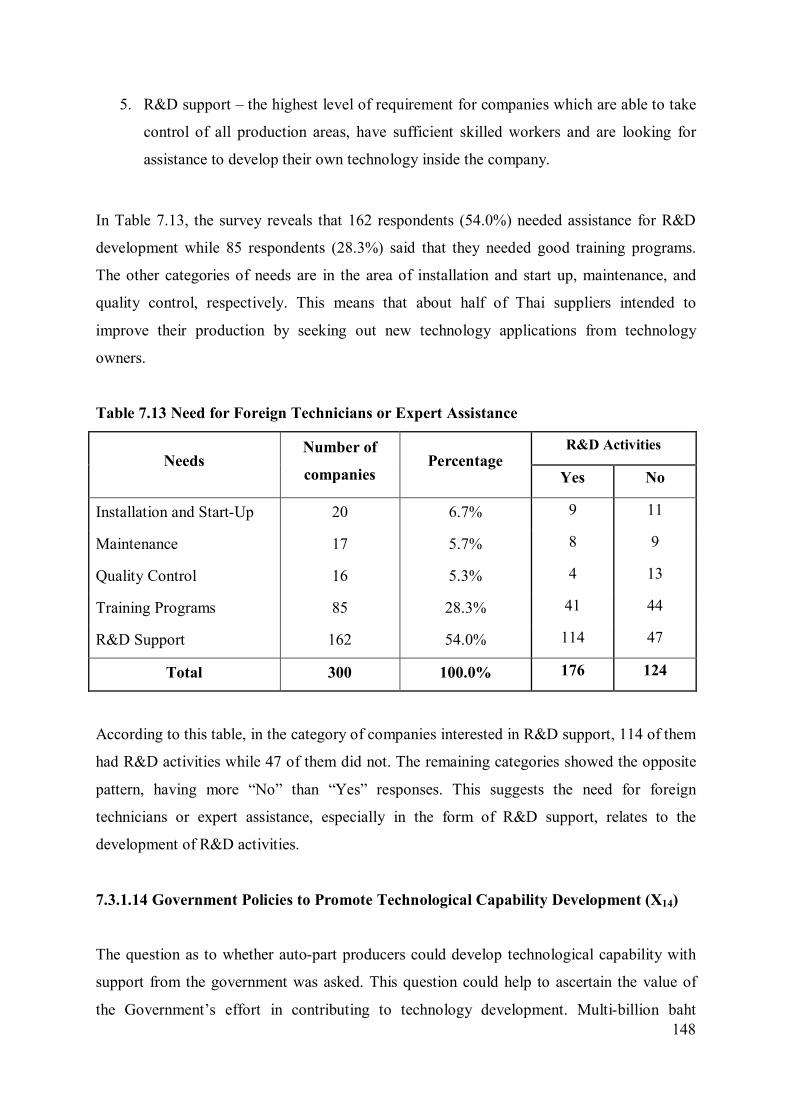
148
5. R&D support – the highest level of requirement for companies which are able to take
control of all production areas, have sufficient skilled workers and are looking for
assistance to develop their own technology inside the company.
In Table 7.13, the survey reveals that 162 respondents (54.0%) needed assistance for R&D
development while 85 respondents (28.3%) said that they needed good training programs.
The other categories of needs are in the area of installation and start up, maintenance, and
quality control, respectively. This means that about half of Thai suppliers intended to
improve their production by seeking out new technology applications from technology
owners.
Table 7.13 Need for Foreign Technicians or Expert Assistance
Needs Number of
companies Percentage
R&D Activities
Yes No
Installation and Start-Up 20 6.7% 9 11
Maintenance 17 5.7% 8 9
Quality Control 16 5.3% 4 13
Training Programs 85 28.3% 41 44
R&D Support 162 54.0% 114 47
Total 300 100.0% 176 124
According to this table, in the category of companies interested in R&D support, 114 of them
had R&D activities while 47 of them did not. The remaining categories showed the opposite
pattern, having more “No” than “Yes” responses. This suggests the need for foreign
technicians or expert assistance, especially in the form of R&D support, relates to the
development of R&D activities.
7.3.1.14 Government Policies to Promote Technological Capability Development (X14)
The question as to whether auto-part producers could develop technological capability with
support from the government was asked. This question could help to ascertain the value of
the Government’s effort in contributing to technology development. Multi-billion baht
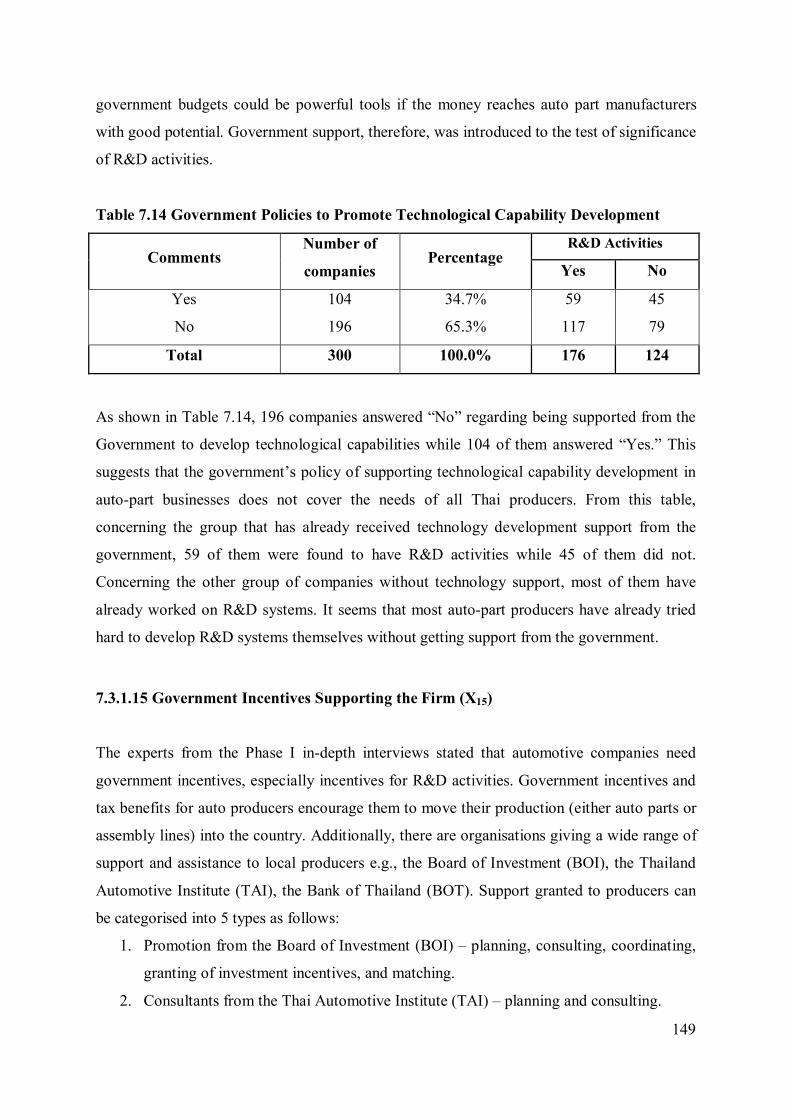
149
government budgets could be powerful tools if the money reaches auto part manufacturers
with good potential. Government support, therefore, was introduced to the test of significance
of R&D activities.
Table 7.14 Government Policies to Promote Technological Capability Development
Comments Number of
companies Percentage
R&D Activities
Yes No
Yes 104 34.7% 59 45
No 196 65.3% 117 79
Total 300 100.0% 176 124
As shown in Table 7.14, 196 companies answered “No” regarding being supported from the
Government to develop technological capabilities while 104 of them answered “Yes.” This
suggests that the government’s policy of supporting technological capability development in
auto-part businesses does not cover the needs of all Thai producers. From this table,
concerning the group that has already received technology development support from the
government, 59 of them were found to have R&D activities while 45 of them did not.
Concerning the other group of companies without technology support, most of them have
already worked on R&D systems. It seems that most auto-part producers have already tried
hard to develop R&D systems themselves without getting support from the government.
7.3.1.15 Government Incentives Supporting the Firm (X15)
The experts from the Phase I in-depth interviews stated that automotive companies need
government incentives, especially incentives for R&D activities. Government incentives and
tax benefits for auto producers encourage them to move their production (either auto parts or
assembly lines) into the country. Additionally, there are organisations giving a wide range of
support and assistance to local producers e.g., the Board of Investment (BOI), the Thailand
Automotive Institute (TAI), the Bank of Thailand (BOT). Support granted to producers can
be categorised into 5 types as follows:
1. Promotion from the Board of Investment (BOI) – planning, consulting, coordinating,
granting of investment incentives, and matching.
2. Consultants from the Thai Automotive Institute (TAI) – planning and consulting.
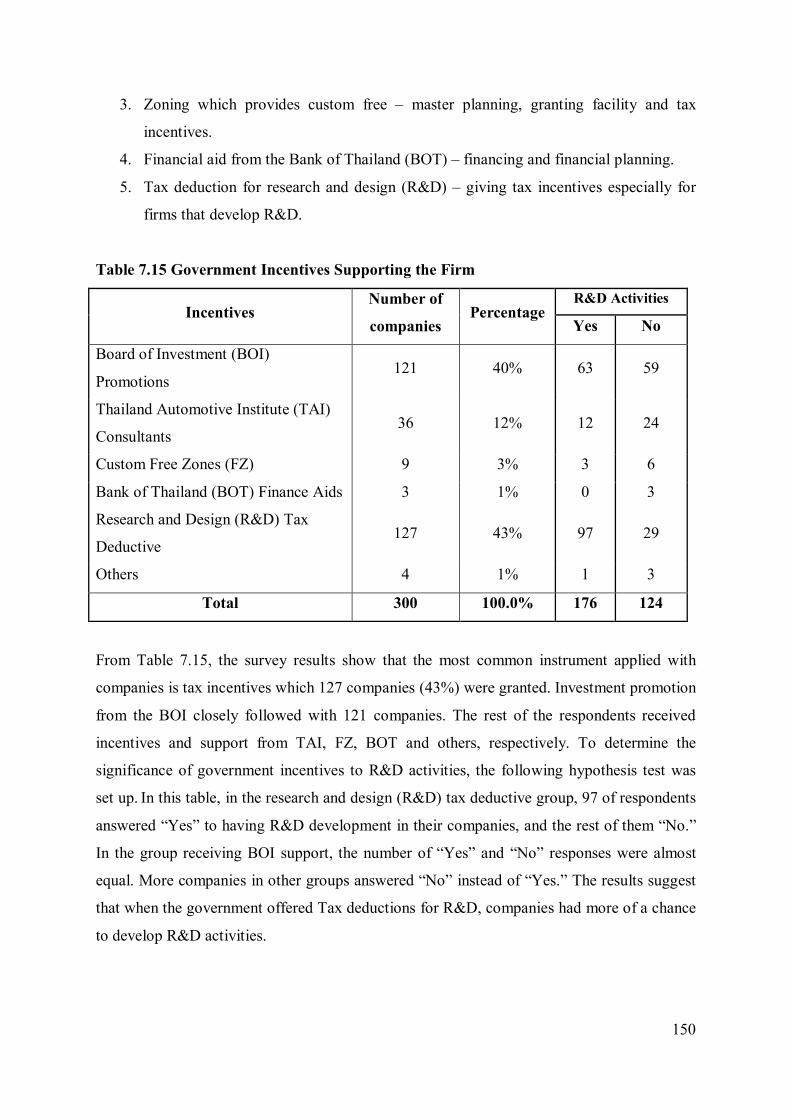
150
3. Zoning which provides custom free – master planning, granting facility and tax
incentives.
4. Financial aid from the Bank of Thailand (BOT) – financing and financial planning.
5. Tax deduction for research and design (R&D) – giving tax incentives especially for
firms that develop R&D.
Table 7.15 Government Incentives Supporting the Firm
Incentives Number of
companies Percentage
R&D Activities
Yes No
Board of Investment (BOI)
Promotions 121 40% 63 59
Thailand Automotive Institute (TAI)
Consultants 36 12% 12 24
Custom Free Zones (FZ) 9 3% 3 6
Bank of Thailand (BOT) Finance Aids 3 1% 0 3
Research and Design (R&D) Tax
Deductive 127 43% 97 29
Others 4 1% 1 3
Total 300 100.0% 176 124
From Table 7.15, the survey results show that the most common instrument applied with
companies is tax incentives which 127 companies (43%) were granted. Investment promotion
from the BOI closely followed with 121 companies. The rest of the respondents received
incentives and support from TAI, FZ, BOT and others, respectively. To determine the
significance of government incentives to R&D activities, the following hypothesis test was
set up. In this table, in the research and design (R&D) tax deductive group, 97 of respondents
answered “Yes” to having R&D development in their companies, and the rest of them “No.”
In the group receiving BOI support, the number of “Yes” and “No” responses were almost
equal. More companies in other groups answered “No” instead of “Yes.” The results suggest
that when the government offered Tax deductions for R&D, companies had more of a chance
to develop R&D activities.
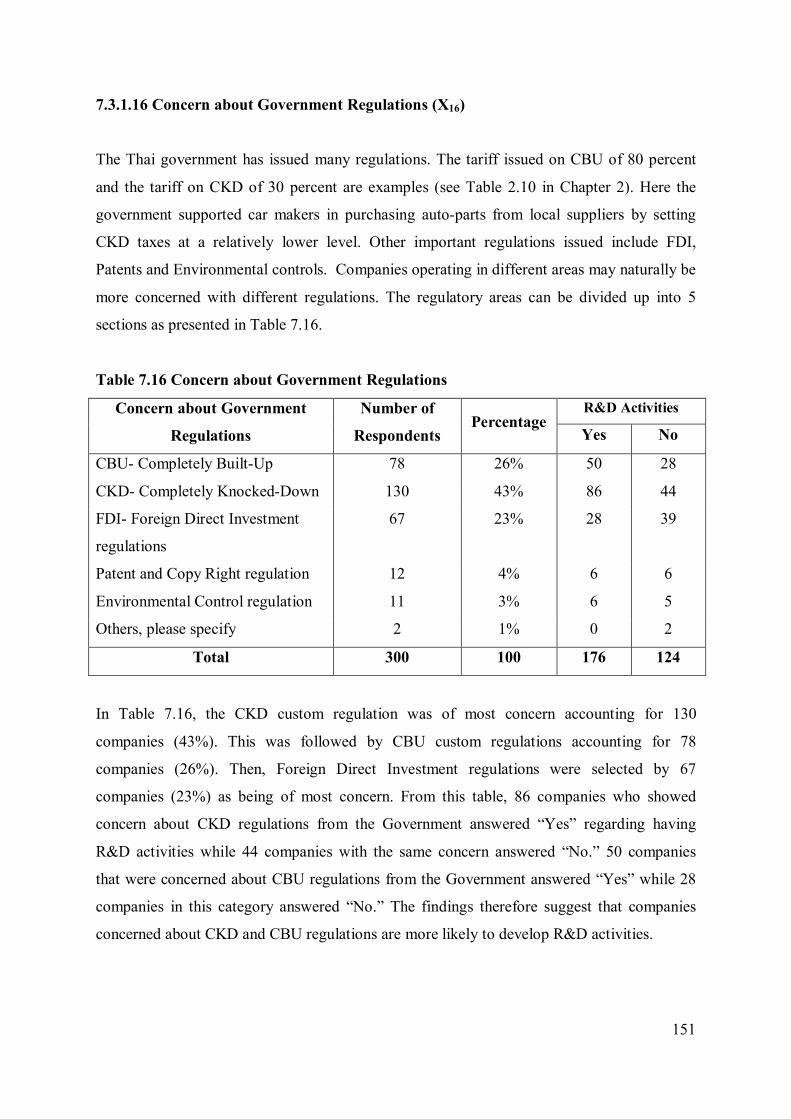
151
7.3.1.16 Concern about Government Regulations (X16)
The Thai government has issued many regulations. The tariff issued on CBU of 80 percent
and the tariff on CKD of 30 percent are examples (see Table 2.10 in Chapter 2). Here the
government supported car makers in purchasing auto-parts from local suppliers by setting
CKD taxes at a relatively lower level. Other important regulations issued include FDI,
Patents and Environmental controls. Companies operating in different areas may naturally be
more concerned with different regulations. The regulatory areas can be divided up into 5
sections as presented in Table 7.16.
Table 7.16 Concern about Government Regulations
Concern about Government
Regulations
Number of
Respondents Percentage
R&D Activities
Yes No
CBU- Completely Built-Up 78 26% 50 28
CKD- Completely Knocked-Down 130 43% 86 44
FDI- Foreign Direct Investment
regulations
67 23% 28 39
Patent and Copy Right regulation 12 4% 6 6
Environmental Control regulation 11 3% 6 5
Others, please specify 2 1% 0 2
Total 300 100 176 124
In Table 7.16, the CKD custom regulation was of most concern accounting for 130
companies (43%). This was followed by CBU custom regulations accounting for 78
companies (26%). Then, Foreign Direct Investment regulations were selected by 67
companies (23%) as being of most concern. From this table, 86 companies who showed
concern about CKD regulations from the Government answered “Yes” regarding having
R&D activities while 44 companies with the same concern answered “No.” 50 companies
that were concerned about CBU regulations from the Government answered “Yes” while 28
companies in this category answered “No.” The findings therefore suggest that companies
concerned about CKD and CBU regulations are more likely to develop R&D activities.
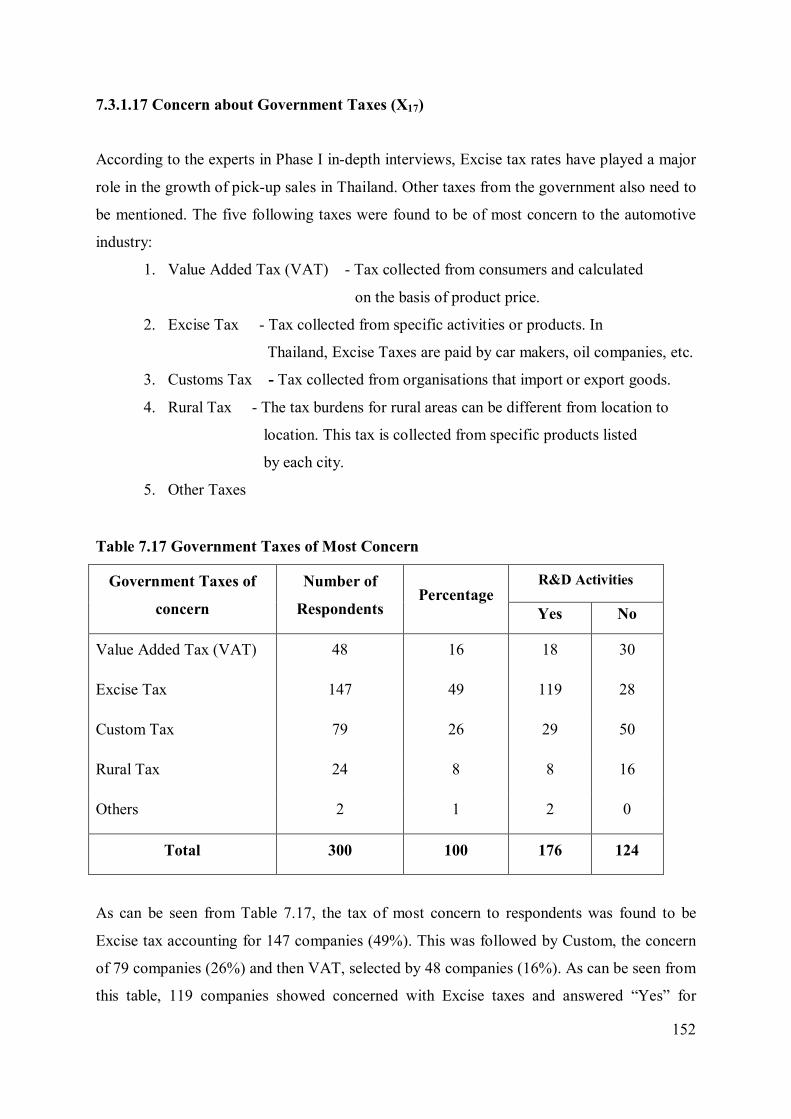
152
7.3.1.17 Concern about Government Taxes (X17)
According to the experts in Phase I in-depth interviews, Excise tax rates have played a major
role in the growth of pick-up sales in Thailand. Other taxes from the government also need to
be mentioned. The five following taxes were found to be of most concern to the automotive
industry:
1. Value Added Tax (VAT) - Tax collected from consumers and calculated
on the basis of product price.
2. Excise Tax - Tax collected from specific activities or products. In
Thailand, Excise Taxes are paid by car makers, oil companies, etc.
3. Customs Tax - Tax collected from organisations that import or export goods.
4. Rural Tax - The tax burdens for rural areas can be different from location to
location. This tax is collected from specific products listed
by each city.
5. Other Taxes
Table 7.17 Government Taxes of Most Concern
Government Taxes of
concern
Number of
Respondents Percentage
R&D Activities
Yes No
Value Added Tax (VAT) 48 16 18 30
Excise Tax 147 49 119 28
Custom Tax 79 26 29 50
Rural Tax 24 8 8 16
Others 2 1 2 0
Total 300 100 176 124
As can be seen from Table 7.17, the tax of most concern to respondents was found to be
Excise tax accounting for 147 companies (49%). This was followed by Custom, the concern
of 79 companies (26%) and then VAT, selected by 48 companies (16%). As can be seen from
this table, 119 companies showed concerned with Excise taxes and answered “Yes” for
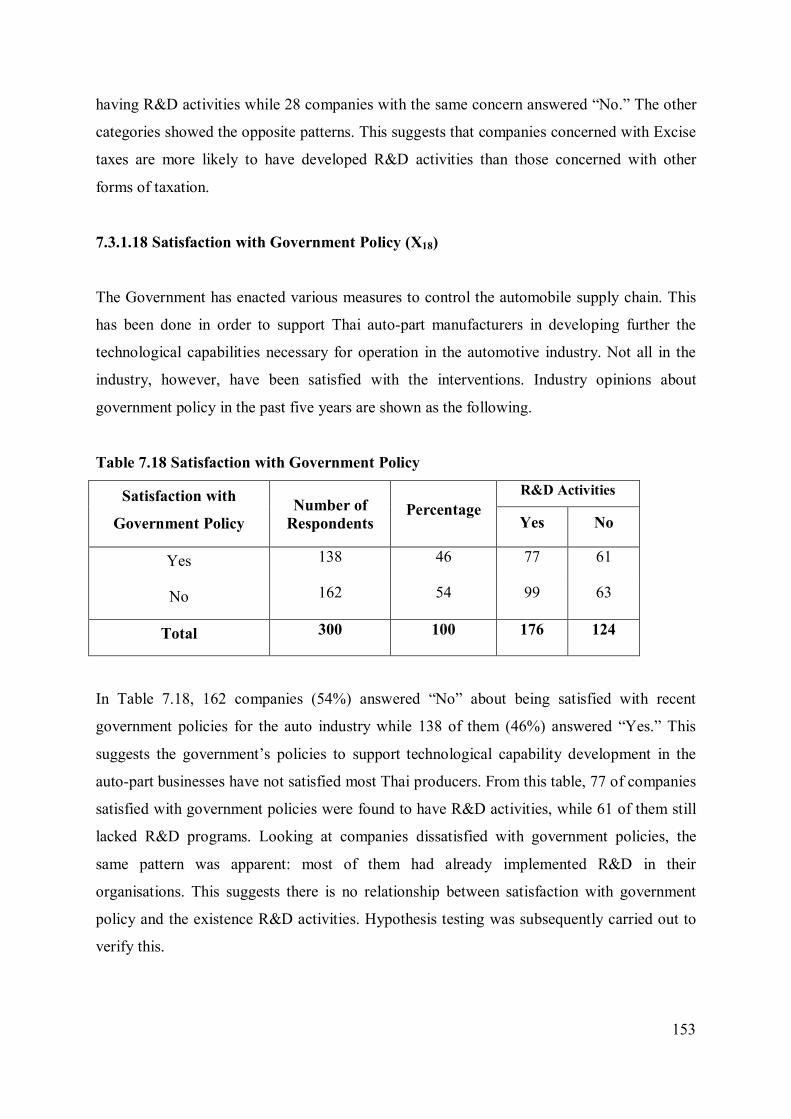
153
having R&D activities while 28 companies with the same concern answered “No.” The other
categories showed the opposite patterns. This suggests that companies concerned with Excise
taxes are more likely to have developed R&D activities than those concerned with other
forms of taxation.
7.3.1.18 Satisfaction with Government Policy (X18)
The Government has enacted various measures to control the automobile supply chain. This
has been done in order to support Thai auto-part manufacturers in developing further the
technological capabilities necessary for operation in the automotive industry. Not all in the
industry, however, have been satisfied with the interventions. Industry opinions about
government policy in the past five years are shown as the following.
Table 7.18 Satisfaction with Government Policy
Satisfaction with
Government Policy Number of
Respondents Percentage
R&D Activities
Yes No
Yes 138 46 77 61
No 162 54 99 63
Total 300 100 176 124
In Table 7.18, 162 companies (54%) answered “No” about being satisfied with recent
government policies for the auto industry while 138 of them (46%) answered “Yes.” This
suggests the government’s policies to support technological capability development in the
auto-part businesses have not satisfied most Thai producers. From this table, 77 of companies
satisfied with government policies were found to have R&D activities, while 61 of them still
lacked R&D programs. Looking at companies dissatisfied with government policies, the
same pattern was apparent: most of them had already implemented R&D in their
organisations. This suggests there is no relationship between satisfaction with government
policy and the existence R&D activities. Hypothesis testing was subsequently carried out to
verify this.
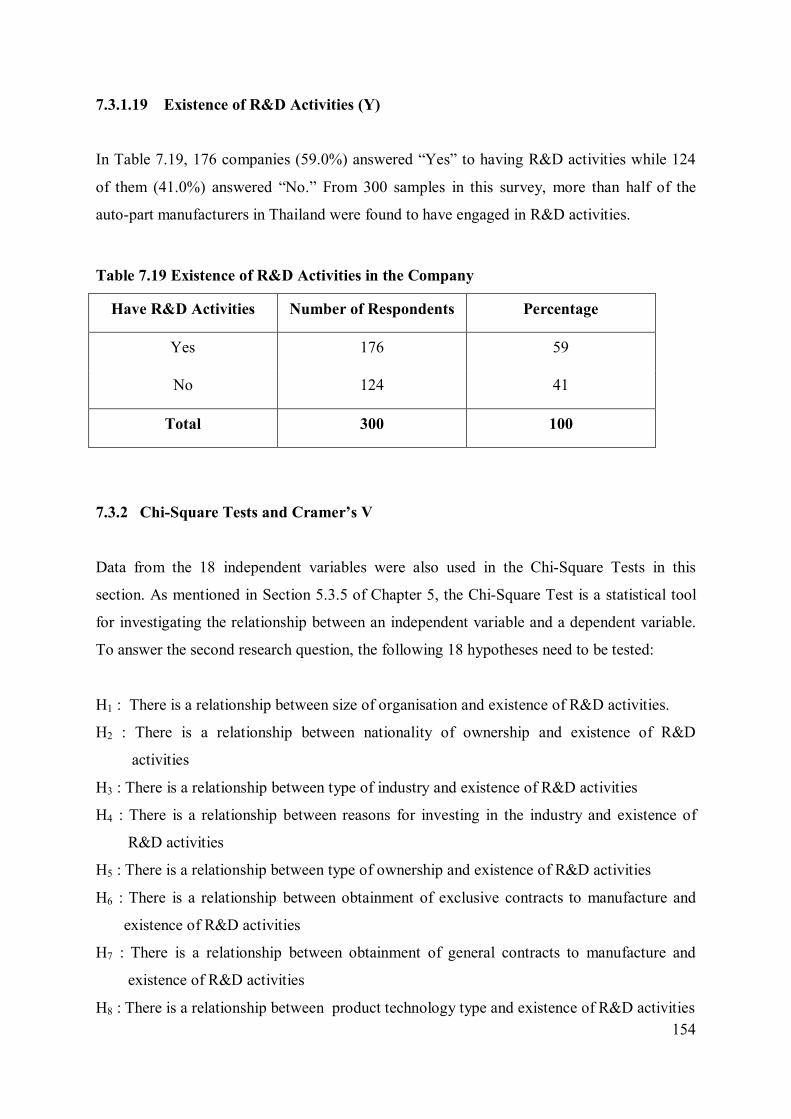
154
7.3.1.19 Existence of R&D Activities (Y)
In Table 7.19, 176 companies (59.0%) answered “Yes” to having R&D activities while 124
of them (41.0%) answered “No.” From 300 samples in this survey, more than half of the
auto-part manufacturers in Thailand were found to have engaged in R&D activities.
Table 7.19 Existence of R&D Activities in the Company
Have R&D Activities Number of Respondents Percentage
Yes 176 59
No 124 41
Total 300 100
7.3.2 Chi-Square Tests and Cramer’s V
Data from the 18 independent variables were also used in the Chi-Square Tests in this
section. As mentioned in Section 5.3.5 of Chapter 5, the Chi-Square Test is a statistical tool
for investigating the relationship between an independent variable and a dependent variable.
To answer the second research question, the following 18 hypotheses need to be tested:
H1 : There is a relationship between size of organisation and existence of R&D activities.
H2 : There is a relationship between nationality of ownership and existence of R&D
activities
H3 : There is a relationship between type of industry and existence of R&D activities
H4 : There is a relationship between reasons for investing in the industry and existence of
R&D activities
H5 : There is a relationship between type of ownership and existence of R&D activities
H6 : There is a relationship between obtainment of exclusive contracts to manufacture and
existence of R&D activities
H7 : There is a relationship between obtainment of general contracts to manufacture and
existence of R&D activities
H8 : There is a relationship between product technology type and existence of R&D activities
155
H9 :There is a relationship between the ability to modify production or products and
existence of R&D activities
H10 : There is a relationship between consideration of investment in research and design and
existence of R&D activities
H11 : There is a relationship between the sources of component parts for Thai suppliers and
existence of R&D activities
H12 : There is a relationship between methods of acquiring technology and existence of R&D
activities
H13 : There is a relationship between the need for foreign technicians or expert assistance and
existence of R&D activities
H14 :There is a relationship between government policies to promote technological
capability development and existence of R&D activities
H15 : There is a relationship between government incentives supporting the firm and existence
of R&D activities
H16 : There is a relationship between concern about government regulations and existence of
R&D activities
H17 : There is a relationship between concern about government taxes and existence of R&D
activities
H18 : There is a relationship between satisfaction with government policy in the auto industry
and existence of R&D activities
Table 7.20 shows the results of the Chi-Square tests. 12 out of the 18 variables comprising of
X1, X2, X3, X5, X6, X9, X10, X12, X13, X15, X16 and X17 were found to have p-value less than
0.05, so their corresponding hypotheses were accepted. In other words, a relationship
between these variables and the existence of R&D activities was established.
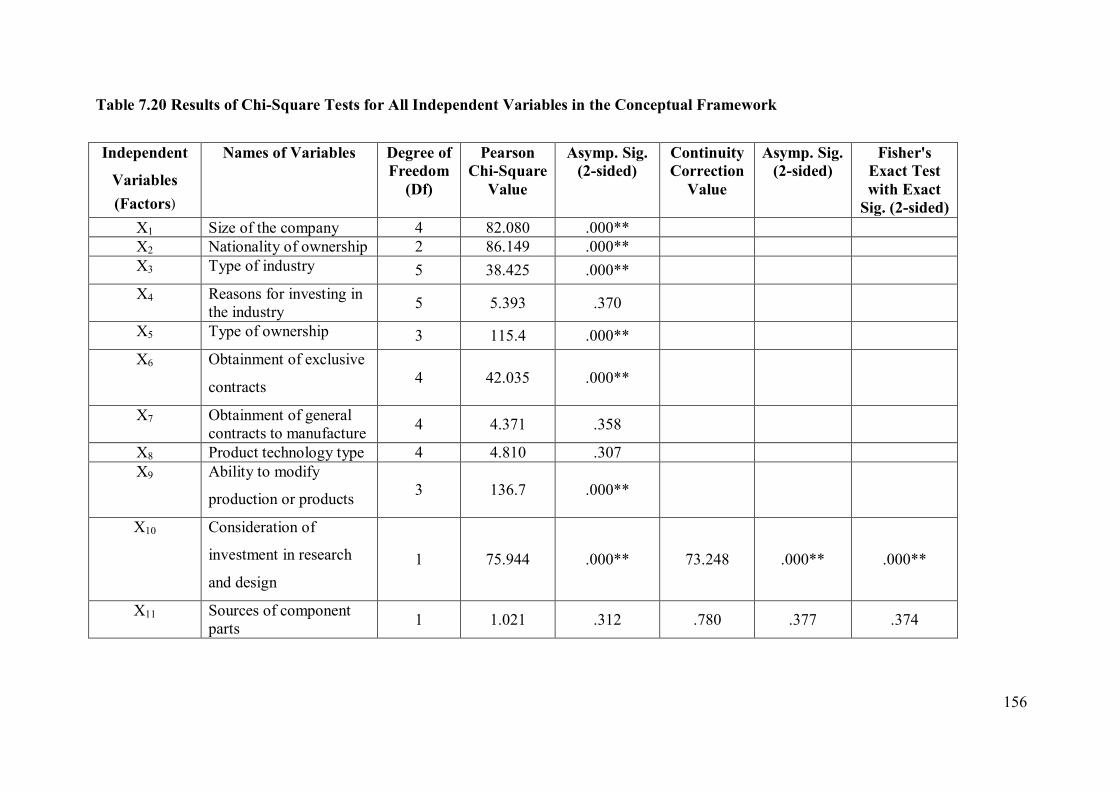
185
Table 7.20 Results of Chi-Square Tests for All Independent Variables in the Conceptual Framework
Independent
Variables (Factors)
Names of Variables Degree of Freedom
(Df)
Pearson Chi-Square
Value
Asymp. Sig. (2-sided)
Continuity Correction
Value
Asymp. Sig. (2-sided)
Fisher's Exact Test with Exact
Sig. (2-sided) X1 Size of the company 4 82.080 .000** X2 Nationality of ownership 2 86.149 .000** X3 Type of industry 5 38.425 .000** X4 Reasons for investing in
the industry 5 5.393 .370
X5 Type of ownership 3 115.4 .000** X6 Obtainment of exclusive
contracts 4 42.035 .000**
X7 Obtainment of general contracts to manufacture 4 4.371 .358
X8 Product technology type 4 4.810 .307 X9 Ability to modify
production or products 3 136.7 .000**
X10 Consideration of
investment in research
and design 1 75.944 .000** 73.248 .000** .000**
X11 Sources of component parts 1 1.021 .312 .780 .377 .374
156
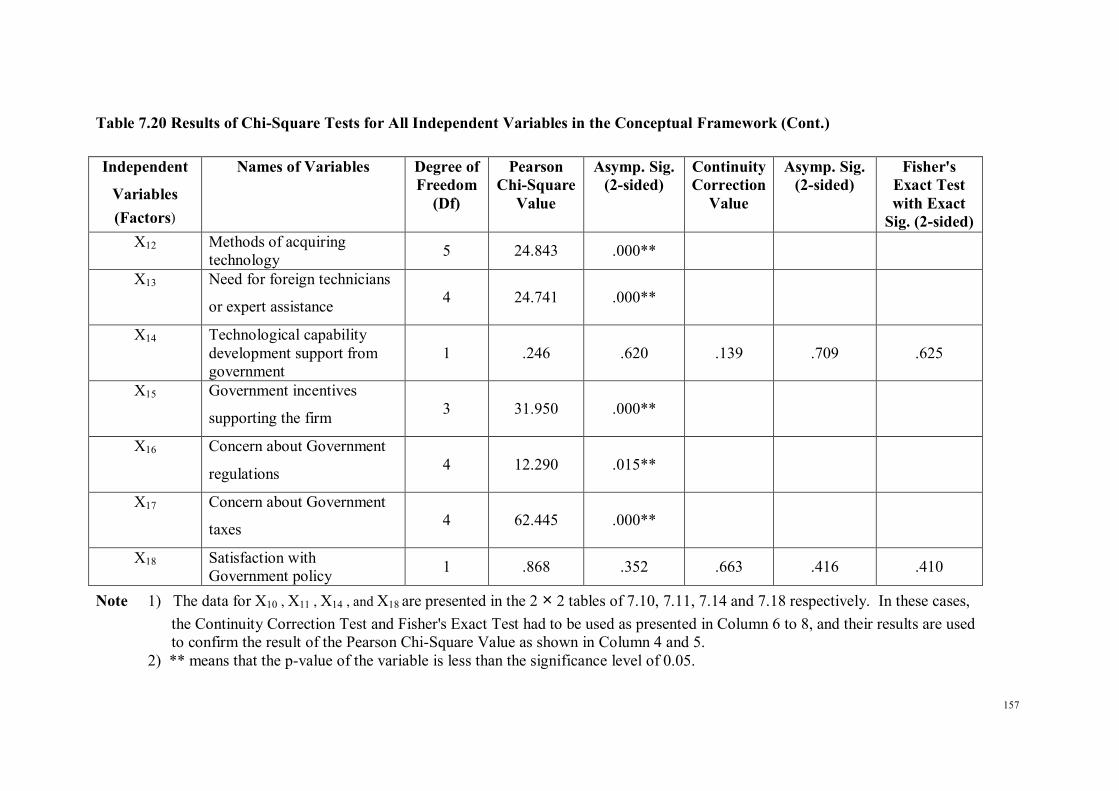
186
Table 7.20 Results of Chi-Square Tests for All Independent Variables in the Conceptual Framework (Cont.) Independent
Variables (Factors)
Names of Variables Degree of Freedom
(Df)
Pearson Chi-Square
Value
Asymp. Sig. (2-sided)
Continuity Correction
Value
Asymp. Sig. (2-sided)
Fisher's Exact Test with Exact
Sig. (2-sided) X12 Methods of acquiring
technology 5 24.843 .000**
X13 Need for foreign technicians
or expert assistance 4 24.741 .000**
X14 Technological capability development support from government
1 .246 .620 .139 .709 .625
X15 Government incentives
supporting the firm 3 31.950 .000**
X16 Concern about Government
regulations 4 12.290 .015**
X17 Concern about Government
taxes 4 62.445 .000**
X18 Satisfaction with Government policy 1 .868 .352 .663 .416 .410
Note 1) The data for X10 , X11 , X14 , and X18 are presented in the 2 × 2 tables of 7.10, 7.11, 7.14 and 7.18 respectively. In these cases, the Continuity Correction Test and Fisher's Exact Test had to be used as presented in Column 6 to 8, and their results are used to confirm the result of the Pearson Chi-Square Value as shown in Column 4 and 5. 2) ** means that the p-value of the variable is less than the significance level of 0.05.
157
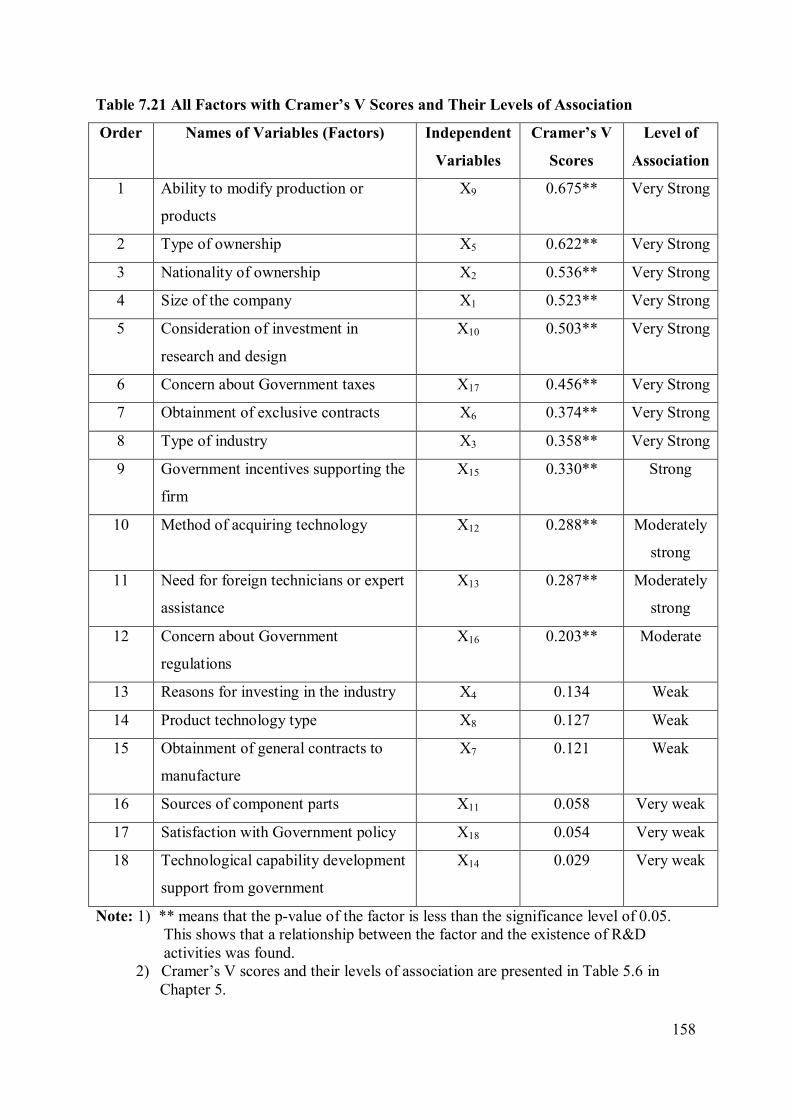
158
Table 7.21 All Factors with Cramer’s V Scores and Their Levels of Association
Order Names of Variables (Factors) Independent
Variables
Cramer’s V
Scores
Level of
Association
1 Ability to modify production or
products
X9 0.675** Very Strong
2 Type of ownership X5 0.622** Very Strong
3 Nationality of ownership X2 0.536** Very Strong
4 Size of the company X1 0.523** Very Strong
5 Consideration of investment in
research and design
X10 0.503** Very Strong
6 Concern about Government taxes X17 0.456** Very Strong
7 Obtainment of exclusive contracts X6 0.374** Very Strong
8 Type of industry X3 0.358** Very Strong
9 Government incentives supporting the
firm
X15 0.330** Strong
10 Method of acquiring technology X12 0.288** Moderately
strong
11 Need for foreign technicians or expert
assistance
X13 0.287** Moderately
strong
12 Concern about Government
regulations
X16 0.203** Moderate
13 Reasons for investing in the industry X4 0.134 Weak
14 Product technology type X8 0.127 Weak
15 Obtainment of general contracts to
manufacture
X7 0.121 Weak
16 Sources of component parts X11 0.058 Very weak
17 Satisfaction with Government policy X18 0.054 Very weak
18 Technological capability development
support from government
X14 0.029 Very weak
Note: 1) ** means that the p-value of the factor is less than the significance level of 0.05. This shows that a relationship between the factor and the existence of R&D activities was found. 2) Cramer’s V scores and their levels of association are presented in Table 5.6 in Chapter 5.
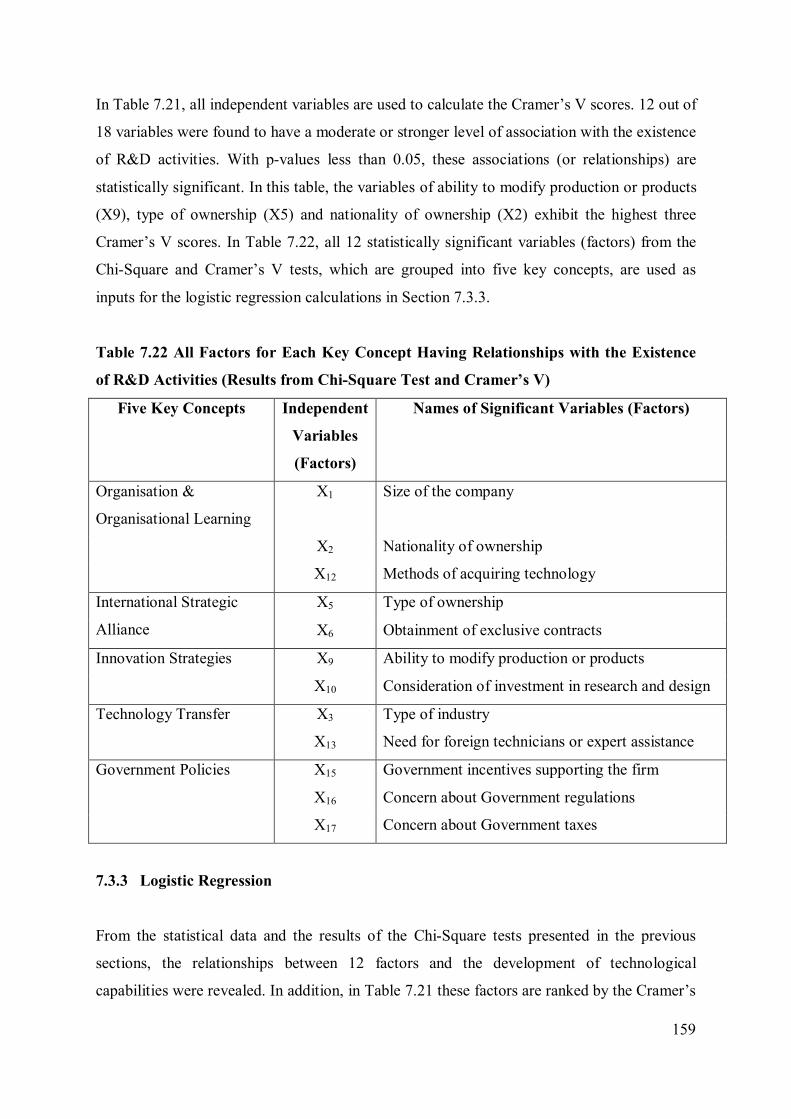
159
In Table 7.21, all independent variables are used to calculate the Cramer’s V scores. 12 out of
18 variables were found to have a moderate or stronger level of association with the existence
of R&D activities. With p-values less than 0.05, these associations (or relationships) are
statistically significant. In this table, the variables of ability to modify production or products
(X9), type of ownership (X5) and nationality of ownership (X2) exhibit the highest three
Cramer’s V scores. In Table 7.22, all 12 statistically significant variables (factors) from the
Chi-Square and Cramer’s V tests, which are grouped into five key concepts, are used as
inputs for the logistic regression calculations in Section 7.3.3.
Table 7.22 All Factors for Each Key Concept Having Relationships with the Existence
of R&D Activities (Results from Chi-Square Test and Cramer’s V)
Five Key Concepts Independent
Variables
(Factors)
Names of Significant Variables (Factors)
Organisation &
Organisational Learning
X1 Size of the company
X2 Nationality of ownership
X12 Methods of acquiring technology
International Strategic
Alliance
X5 Type of ownership
X6 Obtainment of exclusive contracts
Innovation Strategies X9 Ability to modify production or products
X10 Consideration of investment in research and design
Technology Transfer X3 Type of industry
X13 Need for foreign technicians or expert assistance
Government Policies X15 Government incentives supporting the firm
X16 Concern about Government regulations
X17 Concern about Government taxes
7.3.3 Logistic Regression
From the statistical data and the results of the Chi-Square tests presented in the previous
sections, the relationships between 12 factors and the development of technological
capabilities were revealed. In addition, in Table 7.21 these factors are ranked by the Cramer’s
160
V Scores (representing the level of association with the development of technological
capabilities) from moderate to very strong, so business owners can use these factors to
prepare important resources for launching R&D systems or for developing the technological
capability of their organisations. However, they may spend more of their budgets than they
should due to the fact that the relationships between these factors and the R&D activities
uncovered using the Chi-square and Cramer’s V tests are not necessarily causal. Logistic
regression is necessary to uncover these causal relationships (see Section 5.3.5 of Chapter 5).
However, data from the previous Chi-Square and Cramer’s V tests are very useful because all
12 significant factors discovered through the use of these statistical tools can be used as data
inputs for calculating the logistic regression. In this study, the researcher decided to calculate
the logistic regression equation for each of the five key concepts for two reasons. The first
reason is if all of the 18 independent variables were included in one equation, the standard
error (SE) in many variables would be too high resulting in incorrect Wald values. As a
result, this problem distorts our interpretation of these Wald values and the p-values to lead
us to rejecting the null hypotheses (Kanlaya, 2010). The second reason is that each of the five
key concepts having its own logistic regression equation can be utilised by relevant parties.
For example, the government can improve government policies, which is one of the key
concepts in this study.
7.3.3.1 Assumption Test by Multicollinearity Check
Before calculating the logistic regression, all 18 independent variables needed to be checked
for multicollinearity problems. Tolerance (TI) and the Variance Inflation Factor (VIF) were
used in this process (See Section 5.3.5 of Chapter 5). After running the SPSS program, the
values of TI and VIF for each independent variable were calculated. The lowest value of TI
and the highest value of VIF are shown as follows:
TI = 0.476 VIF = 2.102
As TI equals 0.476 (more than 0.20) and VIF equals 2.102 (less than 10) the multicollinearity
problem can be assumed not to occur.
161
7.3.3.2 Calculation of Logistic Regression
To find the factors in each of five key concepts (in the conceptual framework) that affect the
existence of R&D activities or technological capability development, logistic regression
models were built. The key concepts are presented as follows:
1) Organisation & Organisational learning
2) International strategic alliance
3) Innovation strategies
4) Technology transfer
5) Government policies
Five logistic regression models were built separately for the five key concepts because the set
of factors linked to each key concept relate to an improvement area under the responsibility
of a different organisation or association. For example, the ‘government policies’ key concept
and its set of factors is under the responsibility of the Ministry of Commerce or Excise
Department while the other 4 key concepts can be adopted step by step depending on the
readiness of auto-part companies to make an improvement in their work place.
This study presents the logistic regression with the Enter method (the researcher can select
any variables that have a relationship with the dependent variable). All categories of each
variable are set as dummy variables 0 or 1. However, the categories of some variables are
omitted in the calculation. The reason is that there is too little data in those categories, and as
a result, the logistic regression model is not appropriate. In addition, the logistic regression
calculations need to have one reference dummy variable for each variable, so all 12 variables
entered in this calculation can have their first or last category as a reference dummy variable
to generate a reasonable logistic regression model.
Organisation & Organisational Learning
The key concept ‘organisation & organisational learning’ is comprised of 4 variables; size of
the company (X1), nationality of ownership (X2), method of acquiring technology (X12), and
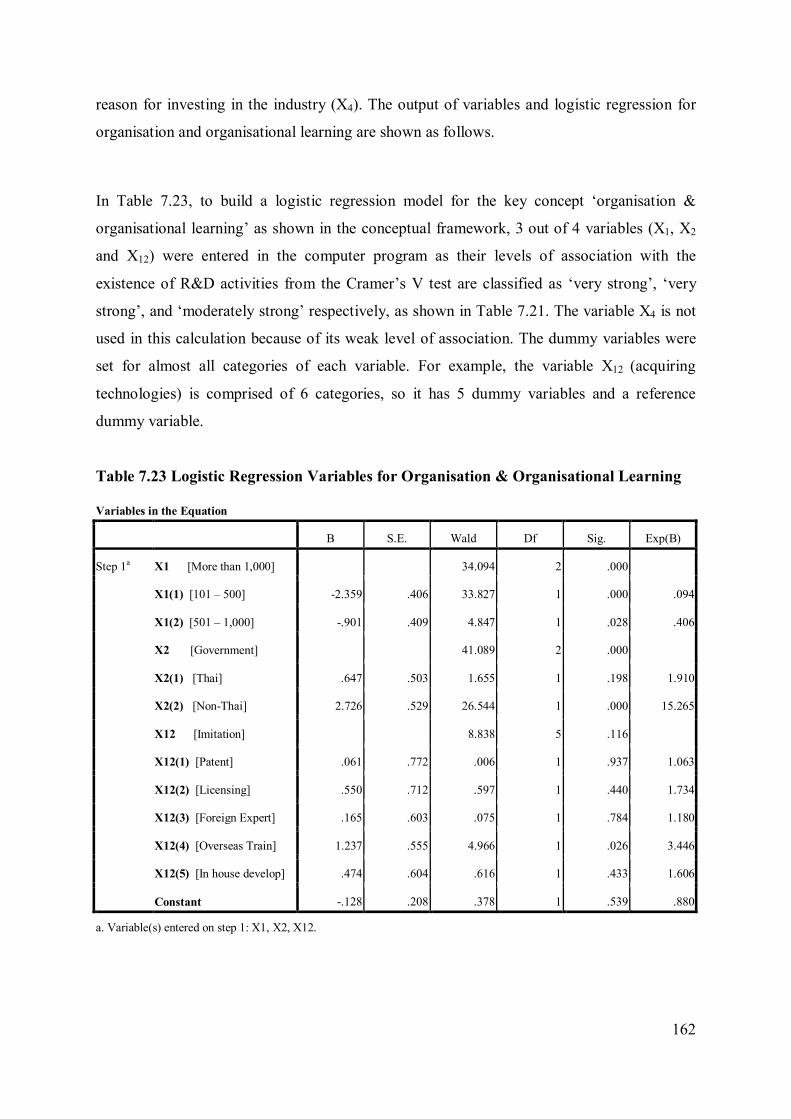
162
reason for investing in the industry (X4). The output of variables and logistic regression for
organisation and organisational learning are shown as follows.
In Table 7.23, to build a logistic regression model for the key concept ‘organisation &
organisational learning’ as shown in the conceptual framework, 3 out of 4 variables (X1, X2
and X12) were entered in the computer program as their levels of association with the
existence of R&D activities from the Cramer’s V test are classified as ‘very strong’, ‘very
strong’, and ‘moderately strong’ respectively, as shown in Table 7.21. The variable X4 is not
used in this calculation because of its weak level of association. The dummy variables were
set for almost all categories of each variable. For example, the variable X12 (acquiring
technologies) is comprised of 6 categories, so it has 5 dummy variables and a reference
dummy variable.
Table 7.23 Logistic Regression Variables for Organisation & Organisational Learning
Variables in the Equation
B S.E. Wald Df Sig. Exp(B)
Step 1a X1 [More than 1,000] 34.094 2 .000
X1(1) [101 – 500] -2.359 .406 33.827 1 .000 .094
X1(2) [501 – 1,000] -.901 .409 4.847 1 .028 .406
X2 [Government] 41.089 2 .000
X2(1) [Thai] .647 .503 1.655 1 .198 1.910
X2(2) [Non-Thai] 2.726 .529 26.544 1 .000 15.265
X12 [Imitation] 8.838 5 .116
X12(1) [Patent] .061 .772 .006 1 .937 1.063
X12(2) [Licensing] .550 .712 .597 1 .440 1.734
X12(3) [Foreign Expert] .165 .603 .075 1 .784 1.180
X12(4) [Overseas Train] 1.237 .555 4.966 1 .026 3.446
X12(5) [In house develop] .474 .604 .616 1 .433 1.606
Constant -.128 .208 .378 1 .539 .880
a. Variable(s) entered on step 1: X1, X2, X12.
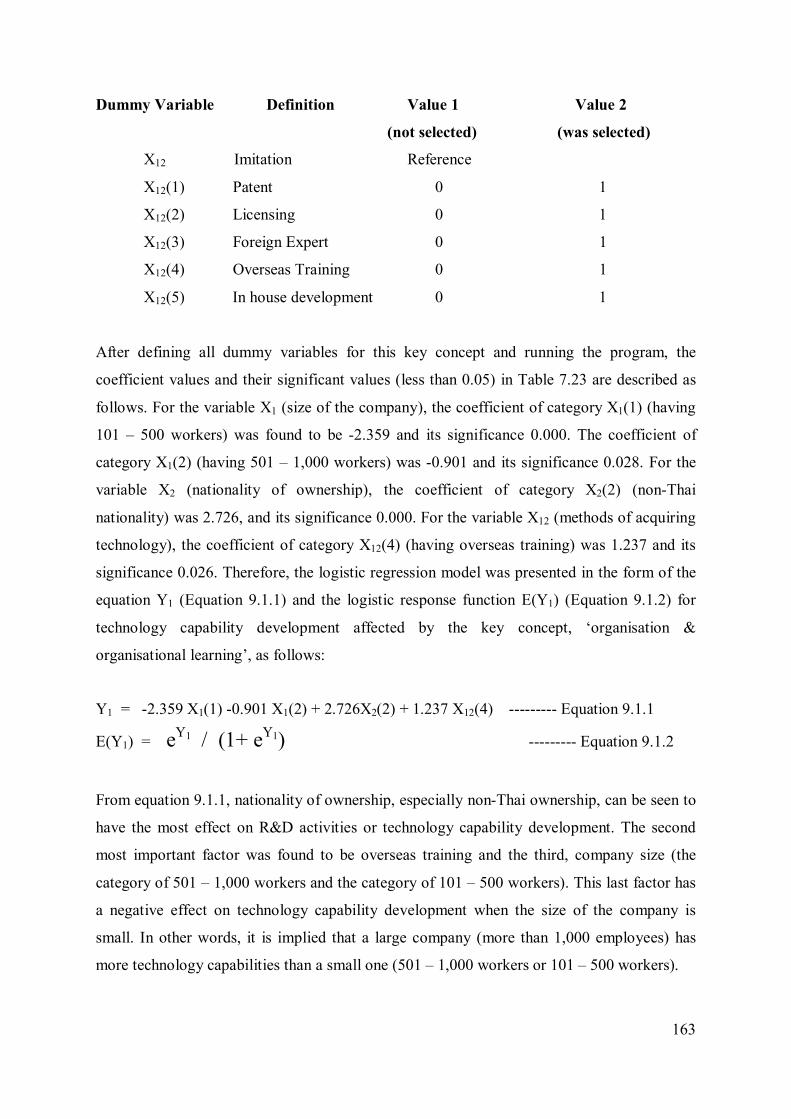
163
Dummy Variable Definition Value 1 Value 2
(not selected) (was selected)
X12 Imitation Reference
X12(1) Patent 0 1
X12(2) Licensing 0 1
X12(3) Foreign Expert 0 1
X12(4) Overseas Training 0 1
X12(5) In house development 0 1
After defining all dummy variables for this key concept and running the program, the
coefficient values and their significant values (less than 0.05) in Table 7.23 are described as
follows. For the variable X1 (size of the company), the coefficient of category X1(1) (having
101 – 500 workers) was found to be -2.359 and its significance 0.000. The coefficient of
category X1(2) (having 501 – 1,000 workers) was -0.901 and its significance 0.028. For the
variable X2 (nationality of ownership), the coefficient of category X2(2) (non-Thai
nationality) was 2.726, and its significance 0.000. For the variable X12 (methods of acquiring
technology), the coefficient of category X12(4) (having overseas training) was 1.237 and its
significance 0.026. Therefore, the logistic regression model was presented in the form of the
equation Y1 (Equation 9.1.1) and the logistic response function E(Y1) (Equation 9.1.2) for
technology capability development affected by the key concept, ‘organisation &
organisational learning’, as follows:
Y1 = -2.359 X1(1) -0.901 X1(2) + 2.726X2(2) + 1.237 X12(4) --------- Equation 9.1.1
E(Y1) = eY1 / (1+ eY1) --------- Equation 9.1.2
From equation 9.1.1, nationality of ownership, especially non-Thai ownership, can be seen to
have the most effect on R&D activities or technology capability development. The second
most important factor was found to be overseas training and the third, company size (the
category of 501 – 1,000 workers and the category of 101 – 500 workers). This last factor has
a negative effect on technology capability development when the size of the company is
small. In other words, it is implied that a large company (more than 1,000 employees) has
more technology capabilities than a small one (501 – 1,000 workers or 101 – 500 workers).
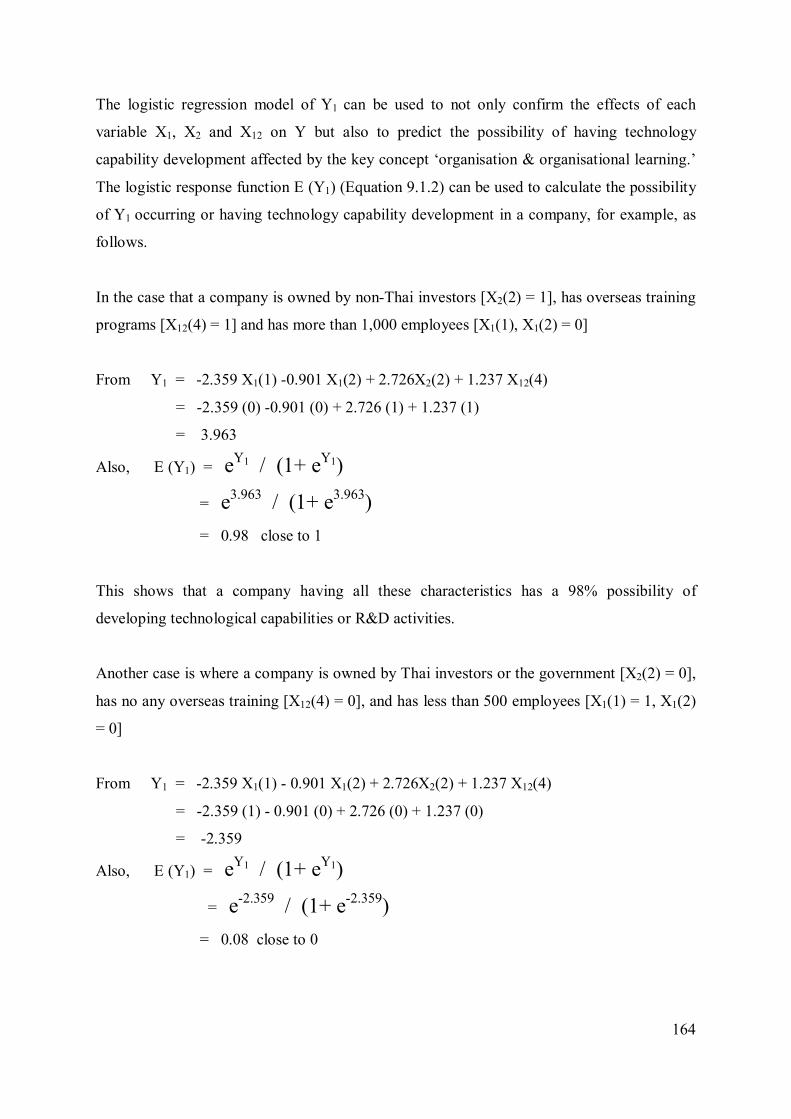
164
The logistic regression model of Y1 can be used to not only confirm the effects of each
variable X1, X2 and X12 on Y but also to predict the possibility of having technology
capability development affected by the key concept ‘organisation & organisational learning.’
The logistic response function E (Y1) (Equation 9.1.2) can be used to calculate the possibility
of Y1 occurring or having technology capability development in a company, for example, as
follows.
In the case that a company is owned by non-Thai investors [X2(2) = 1], has overseas training
programs [X12(4) = 1] and has more than 1,000 employees [X1(1), X1(2) = 0]
From Y1 = -2.359 X1(1) -0.901 X1(2) + 2.726X2(2) + 1.237 X12(4)
= -2.359 (0) -0.901 (0) + 2.726 (1) + 1.237 (1)
= 3.963
Also, E (Y1) = eY1 / (1+ eY1)
= e3.963 / (1+ e3.963)
= 0.98 close to 1
This shows that a company having all these characteristics has a 98% possibility of
developing technological capabilities or R&D activities.
Another case is where a company is owned by Thai investors or the government [X2(2) = 0],
has no any overseas training [X12(4) = 0], and has less than 500 employees [X1(1) = 1, X1(2)
= 0]
From Y1 = -2.359 X1(1) - 0.901 X1(2) + 2.726X2(2) + 1.237 X12(4)
= -2.359 (1) - 0.901 (0) + 2.726 (0) + 1.237 (0)
= -2.359
Also, E (Y1) = eY1 / (1+ eY1)
= e-2.359 / (1+ e-2.359)
= 0.08 close to 0
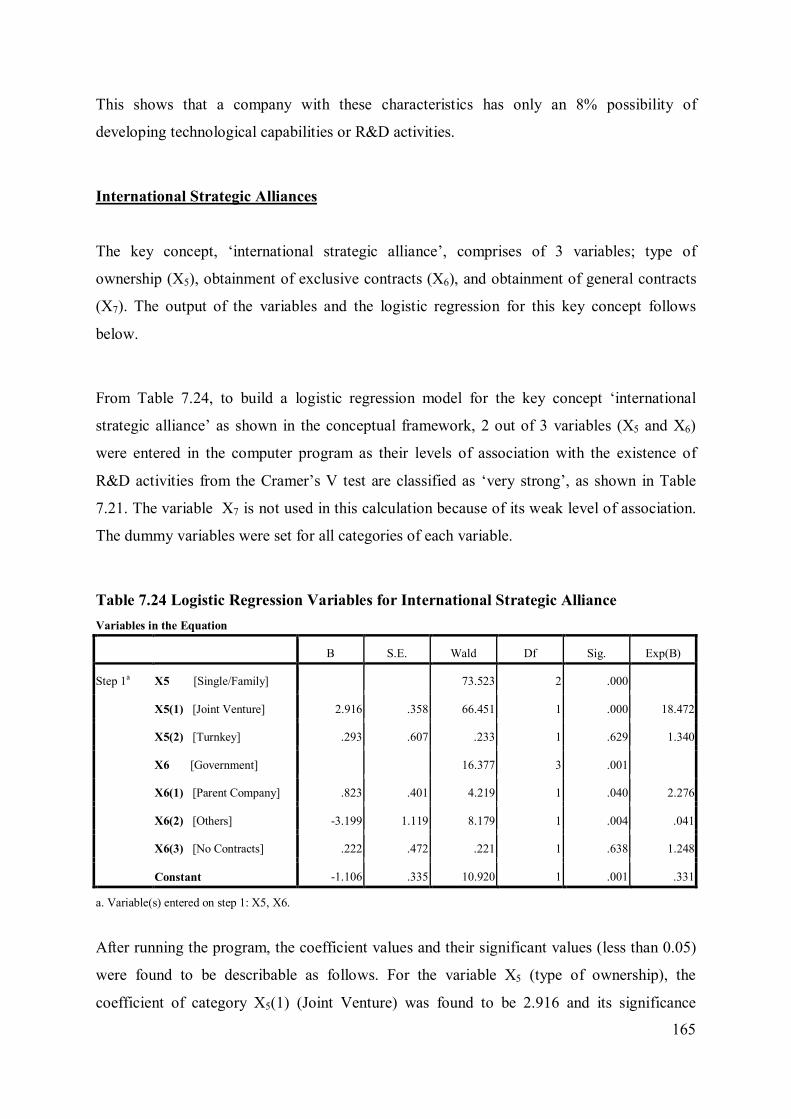
165
This shows that a company with these characteristics has only an 8% possibility of
developing technological capabilities or R&D activities.
International Strategic Alliances The key concept, ‘international strategic alliance’, comprises of 3 variables; type of
ownership (X5), obtainment of exclusive contracts (X6), and obtainment of general contracts
(X7). The output of the variables and the logistic regression for this key concept follows
below.
From Table 7.24, to build a logistic regression model for the key concept ‘international
strategic alliance’ as shown in the conceptual framework, 2 out of 3 variables (X5 and X6)
were entered in the computer program as their levels of association with the existence of
R&D activities from the Cramer’s V test are classified as ‘very strong’, as shown in Table
7.21. The variable X7 is not used in this calculation because of its weak level of association.
The dummy variables were set for all categories of each variable.
Table 7.24 Logistic Regression Variables for International Strategic Alliance Variables in the Equation
B S.E. Wald Df Sig. Exp(B)
Step 1a X5 [Single/Family] 73.523 2 .000
X5(1) [Joint Venture] 2.916 .358 66.451 1 .000 18.472
X5(2) [Turnkey] .293 .607 .233 1 .629 1.340
X6 [Government] 16.377 3 .001
X6(1) [Parent Company] .823 .401 4.219 1 .040 2.276
X6(2) [Others] -3.199 1.119 8.179 1 .004 .041
X6(3) [No Contracts] .222 .472 .221 1 .638 1.248
Constant -1.106 .335 10.920 1 .001 .331
a. Variable(s) entered on step 1: X5, X6.
After running the program, the coefficient values and their significant values (less than 0.05)
were found to be describable as follows. For the variable X5 (type of ownership), the
coefficient of category X5(1) (Joint Venture) was found to be 2.916 and its significance
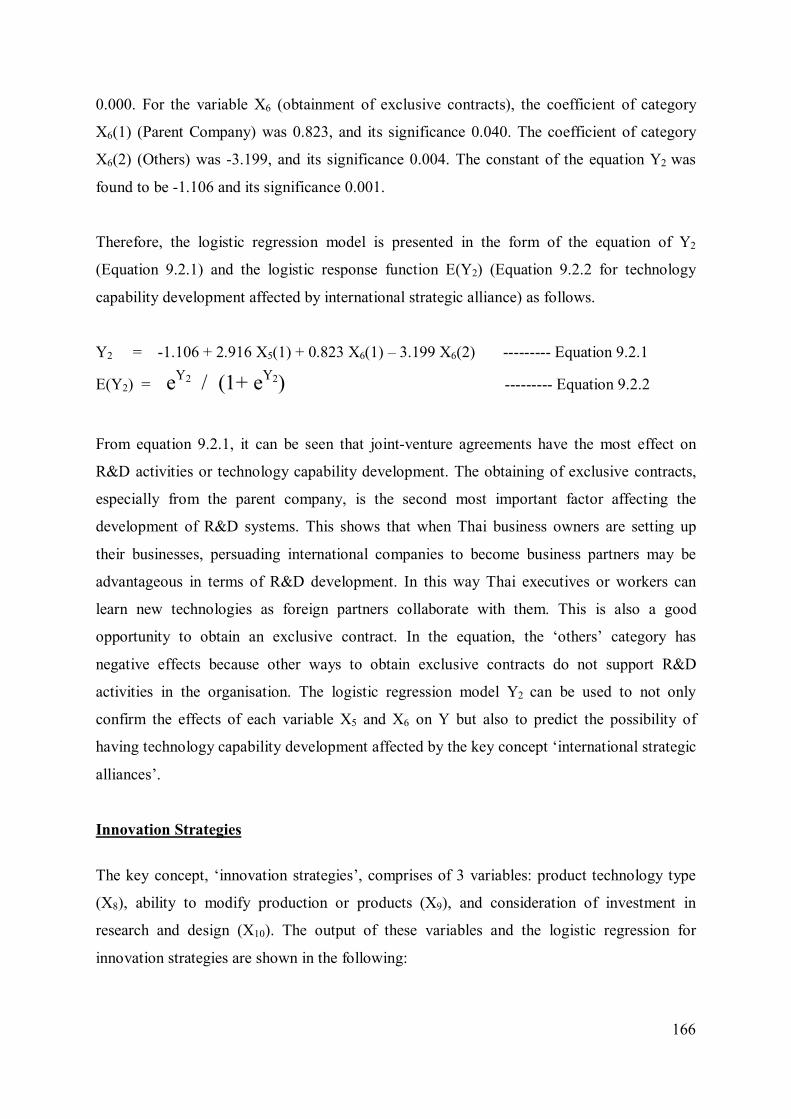
166
0.000. For the variable X6 (obtainment of exclusive contracts), the coefficient of category
X6(1) (Parent Company) was 0.823, and its significance 0.040. The coefficient of category
X6(2) (Others) was -3.199, and its significance 0.004. The constant of the equation Y2 was
found to be -1.106 and its significance 0.001.
Therefore, the logistic regression model is presented in the form of the equation of Y2
(Equation 9.2.1) and the logistic response function E(Y2) (Equation 9.2.2 for technology
capability development affected by international strategic alliance) as follows.
Y2 = -1.106 + 2.916 X5(1) + 0.823 X6(1) – 3.199 X6(2) --------- Equation 9.2.1
E(Y2) = eY2 / (1+ eY2) --------- Equation 9.2.2
From equation 9.2.1, it can be seen that joint-venture agreements have the most effect on
R&D activities or technology capability development. The obtaining of exclusive contracts,
especially from the parent company, is the second most important factor affecting the
development of R&D systems. This shows that when Thai business owners are setting up
their businesses, persuading international companies to become business partners may be
advantageous in terms of R&D development. In this way Thai executives or workers can
learn new technologies as foreign partners collaborate with them. This is also a good
opportunity to obtain an exclusive contract. In the equation, the ‘others’ category has
negative effects because other ways to obtain exclusive contracts do not support R&D
activities in the organisation. The logistic regression model Y2 can be used to not only
confirm the effects of each variable X5 and X6 on Y but also to predict the possibility of
having technology capability development affected by the key concept ‘international strategic
alliances’.
Innovation Strategies
The key concept, ‘innovation strategies’, comprises of 3 variables: product technology type
(X8), ability to modify production or products (X9), and consideration of investment in
research and design (X10). The output of these variables and the logistic regression for
innovation strategies are shown in the following:
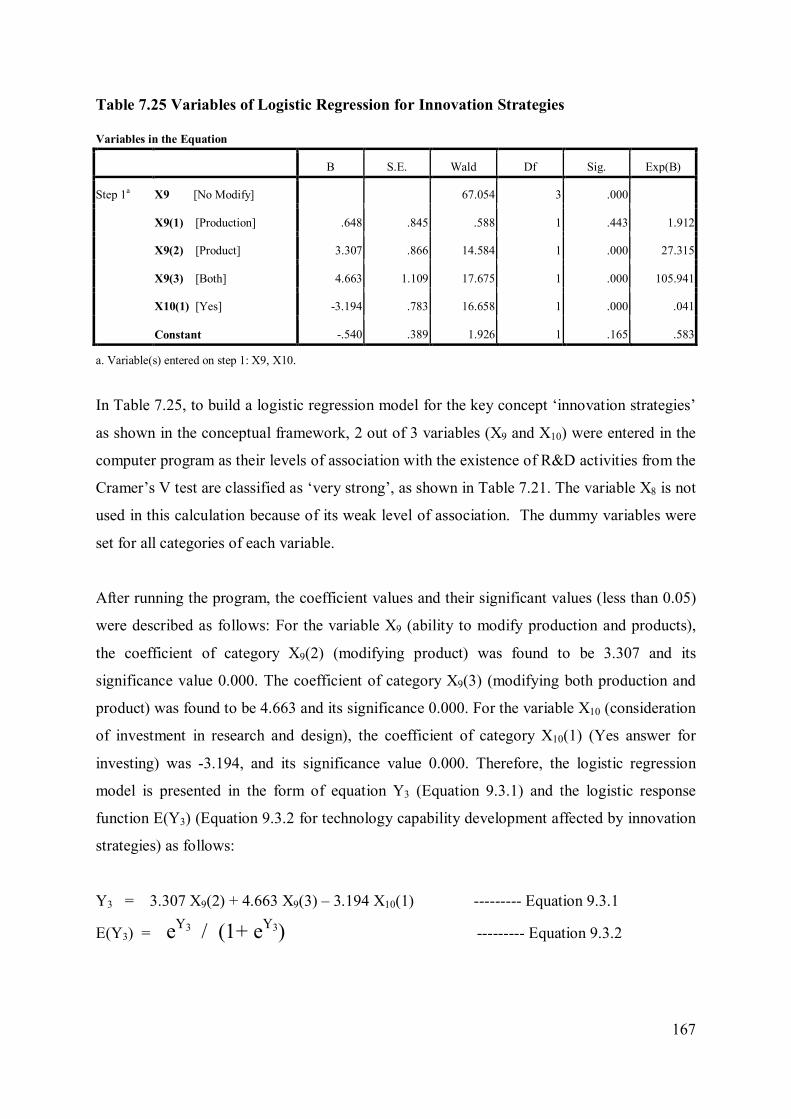
167
Table 7.25 Variables of Logistic Regression for Innovation Strategies
Variables in the Equation
B S.E. Wald Df Sig. Exp(B)
Step 1a X9 [No Modify] 67.054 3 .000
X9(1) [Production] .648 .845 .588 1 .443 1.912
X9(2) [Product] 3.307 .866 14.584 1 .000 27.315
X9(3) [Both] 4.663 1.109 17.675 1 .000 105.941
X10(1) [Yes] -3.194 .783 16.658 1 .000 .041
Constant -.540 .389 1.926 1 .165 .583
a. Variable(s) entered on step 1: X9, X10.
In Table 7.25, to build a logistic regression model for the key concept ‘innovation strategies’
as shown in the conceptual framework, 2 out of 3 variables (X9 and X10) were entered in the
computer program as their levels of association with the existence of R&D activities from the
Cramer’s V test are classified as ‘very strong’, as shown in Table 7.21. The variable X8 is not
used in this calculation because of its weak level of association. The dummy variables were
set for all categories of each variable.
After running the program, the coefficient values and their significant values (less than 0.05)
were described as follows: For the variable X9 (ability to modify production and products),
the coefficient of category X9(2) (modifying product) was found to be 3.307 and its
significance value 0.000. The coefficient of category X9(3) (modifying both production and
product) was found to be 4.663 and its significance 0.000. For the variable X10 (consideration
of investment in research and design), the coefficient of category X10(1) (Yes answer for
investing) was -3.194, and its significance value 0.000. Therefore, the logistic regression
model is presented in the form of equation Y3 (Equation 9.3.1) and the logistic response
function E(Y3) (Equation 9.3.2 for technology capability development affected by innovation
strategies) as follows:
Y3 = 3.307 X9(2) + 4.663 X9(3) – 3.194 X10(1) --------- Equation 9.3.1
E(Y3) = eY3 / (1+ eY3) --------- Equation 9.3.2
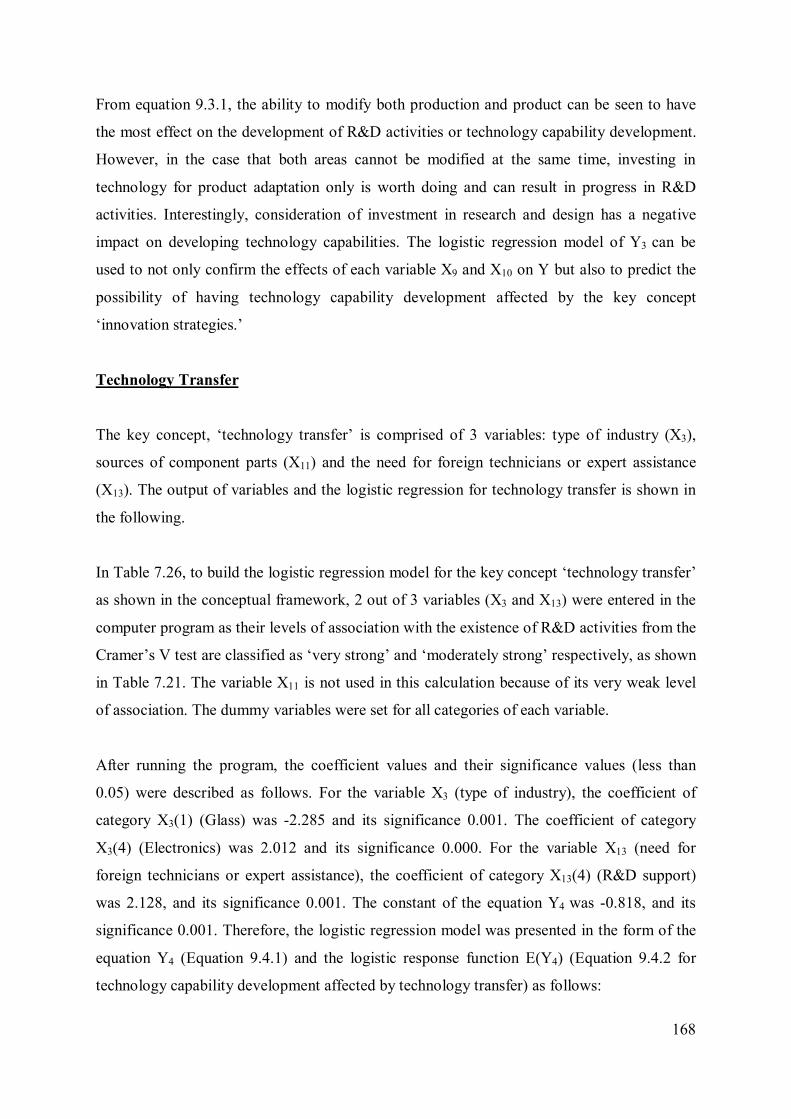
168
From equation 9.3.1, the ability to modify both production and product can be seen to have
the most effect on the development of R&D activities or technology capability development.
However, in the case that both areas cannot be modified at the same time, investing in
technology for product adaptation only is worth doing and can result in progress in R&D
activities. Interestingly, consideration of investment in research and design has a negative
impact on developing technology capabilities. The logistic regression model of Y3 can be
used to not only confirm the effects of each variable X9 and X10 on Y but also to predict the
possibility of having technology capability development affected by the key concept
‘innovation strategies.’
Technology Transfer
The key concept, ‘technology transfer’ is comprised of 3 variables: type of industry (X3),
sources of component parts (X11) and the need for foreign technicians or expert assistance
(X13). The output of variables and the logistic regression for technology transfer is shown in
the following.
In Table 7.26, to build the logistic regression model for the key concept ‘technology transfer’
as shown in the conceptual framework, 2 out of 3 variables (X3 and X13) were entered in the
computer program as their levels of association with the existence of R&D activities from the
Cramer’s V test are classified as ‘very strong’ and ‘moderately strong’ respectively, as shown
in Table 7.21. The variable X11 is not used in this calculation because of its very weak level
of association. The dummy variables were set for all categories of each variable.
After running the program, the coefficient values and their significance values (less than
0.05) were described as follows. For the variable X3 (type of industry), the coefficient of
category X3(1) (Glass) was -2.285 and its significance 0.001. The coefficient of category
X3(4) (Electronics) was 2.012 and its significance 0.000. For the variable X13 (need for
foreign technicians or expert assistance), the coefficient of category X13(4) (R&D support)
was 2.128, and its significance 0.001. The constant of the equation Y4 was -0.818, and its
significance 0.001. Therefore, the logistic regression model was presented in the form of the
equation Y4 (Equation 9.4.1) and the logistic response function E(Y4) (Equation 9.4.2 for
technology capability development affected by technology transfer) as follows:
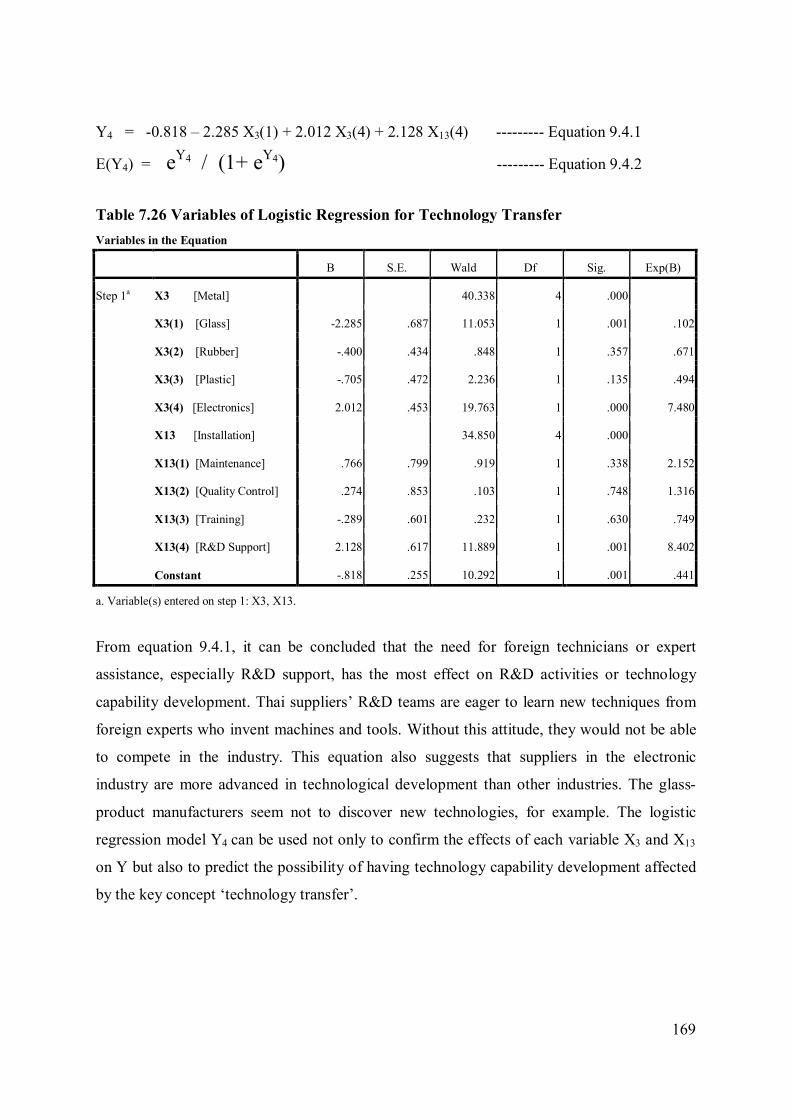
169
Y4 = -0.818 – 2.285 X3(1) + 2.012 X3(4) + 2.128 X13(4) --------- Equation 9.4.1
E(Y4) = eY4 / (1+ eY4) --------- Equation 9.4.2
Table 7.26 Variables of Logistic Regression for Technology Transfer Variables in the Equation
B S.E. Wald Df Sig. Exp(B)
Step 1a X3 [Metal] 40.338 4 .000
X3(1) [Glass] -2.285 .687 11.053 1 .001 .102
X3(2) [Rubber] -.400 .434 .848 1 .357 .671
X3(3) [Plastic] -.705 .472 2.236 1 .135 .494
X3(4) [Electronics] 2.012 .453 19.763 1 .000 7.480
X13 [Installation] 34.850 4 .000
X13(1) [Maintenance] .766 .799 .919 1 .338 2.152
X13(2) [Quality Control] .274 .853 .103 1 .748 1.316
X13(3) [Training] -.289 .601 .232 1 .630 .749
X13(4) [R&D Support] 2.128 .617 11.889 1 .001 8.402
Constant -.818 .255 10.292 1 .001 .441
a. Variable(s) entered on step 1: X3, X13.
From equation 9.4.1, it can be concluded that the need for foreign technicians or expert
assistance, especially R&D support, has the most effect on R&D activities or technology
capability development. Thai suppliers’ R&D teams are eager to learn new techniques from
foreign experts who invent machines and tools. Without this attitude, they would not be able
to compete in the industry. This equation also suggests that suppliers in the electronic
industry are more advanced in technological development than other industries. The glass-
product manufacturers seem not to discover new technologies, for example. The logistic
regression model Y4 can be used not only to confirm the effects of each variable X3 and X13
on Y but also to predict the possibility of having technology capability development affected
by the key concept ‘technology transfer’.
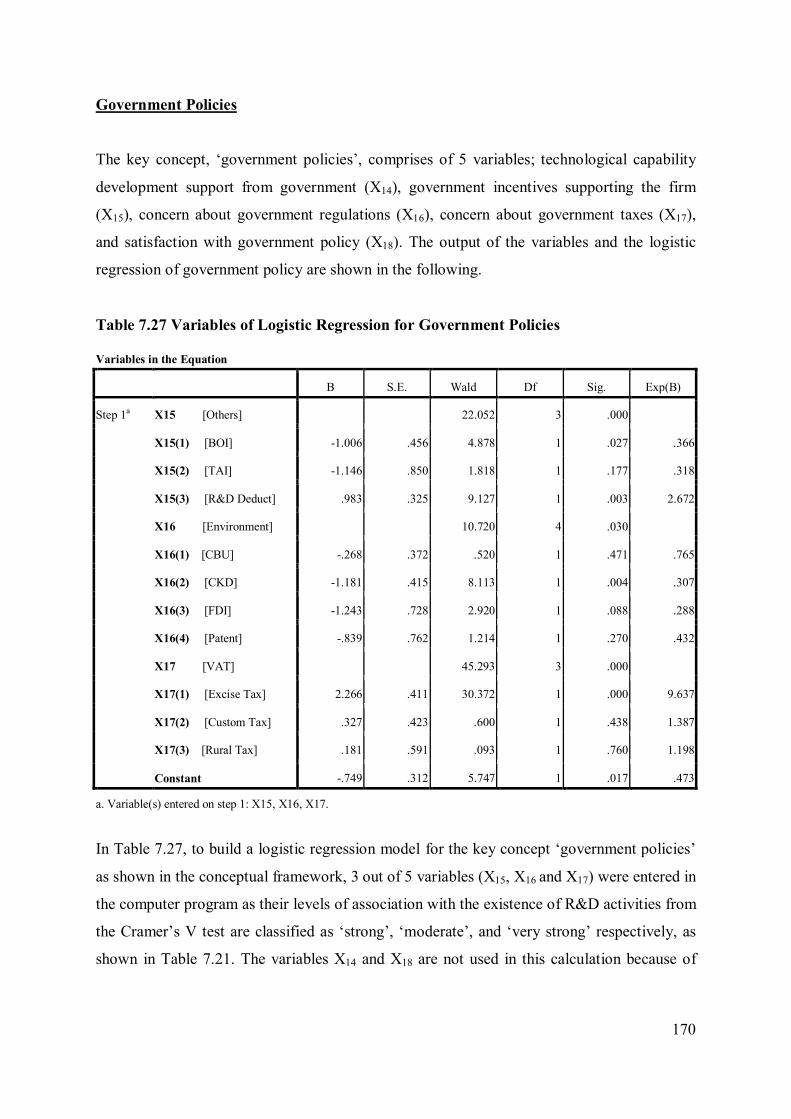
170
Government Policies
The key concept, ‘government policies’, comprises of 5 variables; technological capability
development support from government (X14), government incentives supporting the firm
(X15), concern about government regulations (X16), concern about government taxes (X17),
and satisfaction with government policy (X18). The output of the variables and the logistic
regression of government policy are shown in the following.
Table 7.27 Variables of Logistic Regression for Government Policies
Variables in the Equation
B S.E. Wald Df Sig. Exp(B)
Step 1a X15 [Others] 22.052 3 .000
X15(1) [BOI] -1.006 .456 4.878 1 .027 .366
X15(2) [TAI] -1.146 .850 1.818 1 .177 .318
X15(3) [R&D Deduct] .983 .325 9.127 1 .003 2.672
X16 [Environment] 10.720 4 .030
X16(1) [CBU] -.268 .372 .520 1 .471 .765
X16(2) [CKD] -1.181 .415 8.113 1 .004 .307
X16(3) [FDI] -1.243 .728 2.920 1 .088 .288
X16(4) [Patent] -.839 .762 1.214 1 .270 .432
X17 [VAT] 45.293 3 .000
X17(1) [Excise Tax] 2.266 .411 30.372 1 .000 9.637
X17(2) [Custom Tax] .327 .423 .600 1 .438 1.387
X17(3) [Rural Tax] .181 .591 .093 1 .760 1.198
Constant -.749 .312 5.747 1 .017 .473
a. Variable(s) entered on step 1: X15, X16, X17.
In Table 7.27, to build a logistic regression model for the key concept ‘government policies’
as shown in the conceptual framework, 3 out of 5 variables (X15, X16 and X17) were entered in
the computer program as their levels of association with the existence of R&D activities from
the Cramer’s V test are classified as ‘strong’, ‘moderate’, and ‘very strong’ respectively, as
shown in Table 7.21. The variables X14 and X18 are not used in this calculation because of
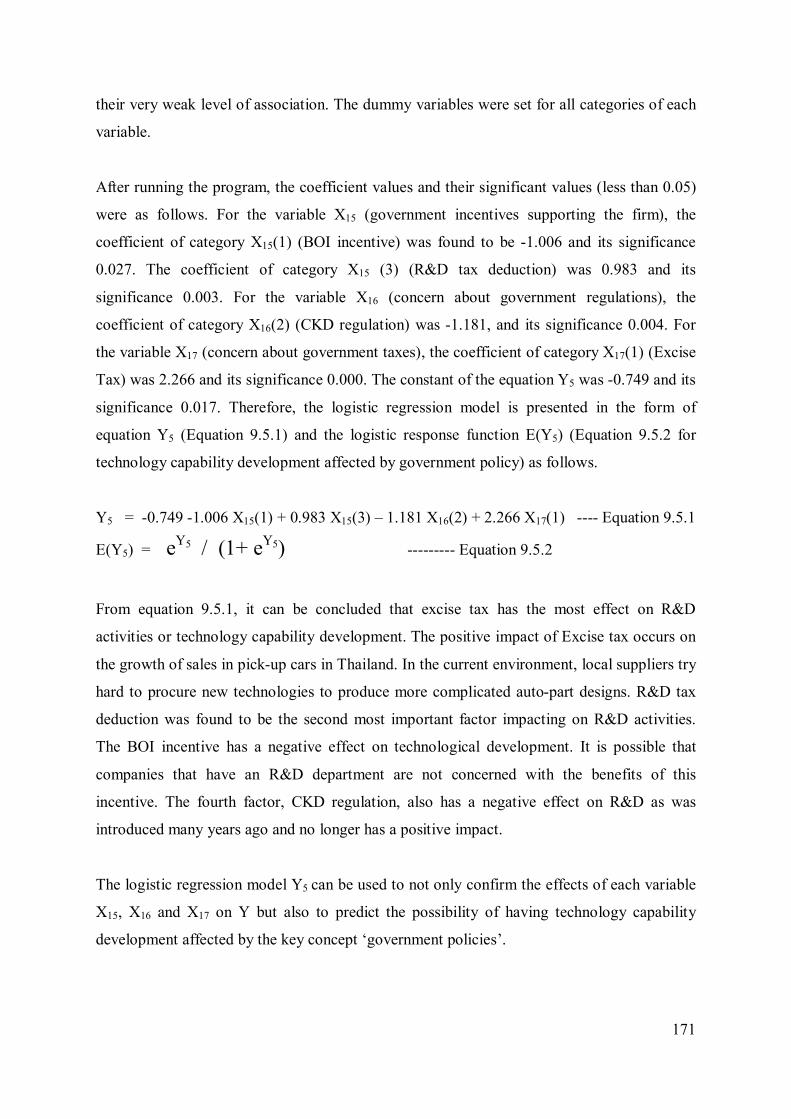
171
their very weak level of association. The dummy variables were set for all categories of each
variable.
After running the program, the coefficient values and their significant values (less than 0.05)
were as follows. For the variable X15 (government incentives supporting the firm), the
coefficient of category X15(1) (BOI incentive) was found to be -1.006 and its significance
0.027. The coefficient of category X15 (3) (R&D tax deduction) was 0.983 and its
significance 0.003. For the variable X16 (concern about government regulations), the
coefficient of category X16(2) (CKD regulation) was -1.181, and its significance 0.004. For
the variable X17 (concern about government taxes), the coefficient of category X17(1) (Excise
Tax) was 2.266 and its significance 0.000. The constant of the equation Y5 was -0.749 and its
significance 0.017. Therefore, the logistic regression model is presented in the form of
equation Y5 (Equation 9.5.1) and the logistic response function E(Y5) (Equation 9.5.2 for
technology capability development affected by government policy) as follows.
Y5 = -0.749 -1.006 X15(1) + 0.983 X15(3) – 1.181 X16(2) + 2.266 X17(1) ---- Equation 9.5.1
E(Y5) = eY5 / (1+ eY5) --------- Equation 9.5.2
From equation 9.5.1, it can be concluded that excise tax has the most effect on R&D
activities or technology capability development. The positive impact of Excise tax occurs on
the growth of sales in pick-up cars in Thailand. In the current environment, local suppliers try
hard to procure new technologies to produce more complicated auto-part designs. R&D tax
deduction was found to be the second most important factor impacting on R&D activities.
The BOI incentive has a negative effect on technological development. It is possible that
companies that have an R&D department are not concerned with the benefits of this
incentive. The fourth factor, CKD regulation, also has a negative effect on R&D as was
introduced many years ago and no longer has a positive impact.
The logistic regression model Y5 can be used to not only confirm the effects of each variable
X15, X16 and X17 on Y but also to predict the possibility of having technology capability
development affected by the key concept ‘government policies’.
172
7.4 Conclusion
This study used the SPSS program to calculate significant factors and statistical models. The
statistical tools used were Frequency Analyses, Chi-square, Cramer’s V, Fisher’s Exact Test,
Yates’ Correction Chi Square (Continuity Correction), Logistic Regression, and
Multicollinearity Correction.
From the Chi-Square Test, 12 out of 18 Xs variables (factors) were found to have a
relationship with the Y dependent variable (the existence of R&D activities or technology
capability development). As mentioned in Section 3.5.2 of Chapter 3, R&D is used as the
sole indicator of technology capability development. When considering Cramer’s V scores,
the top three factors that had the most relationship with technology capability development
were ability to modify productions or products (X9), type of ownership (X5), and nationality
of ownership (X2). Although the Chi-Square test does not prove that these 12 significant
variables are the cause of developing technological capabilities, the outputs did facilitate the
creation of logistic regression models.
The main objective of this chapter was to build these logistic regression models to reveal
which factors (Xs) had casual relationships with technology capability development (Y). The
outputs of the Chi-Square tests were used as inputs. To facilitate the implementation of this
research’s results by the government and interested companies, the study built five logistic
regression models for each key concept (in the conceptual framework) as shown in table 7.28
(at the end of this chapter) and in Chapter 9.
Phase II was undertaken to identify important factors influencing the development of
technological capabilities in the Thai automotive industry. However, in order to validate and
triangulate the research findings, and ensure that all necessary data involved was collected as
the findings, Phase III in Figure 7.1 raised the opportunity for the respondents to express their
perceptions and attitudes toward the development of technological capabilities in their own
words. In addition, the data from Phase II was examined by 10 leading government policy
makers and automotive firm managers using the semi-structured interview technique. Phase
III is described in Chapter 8.
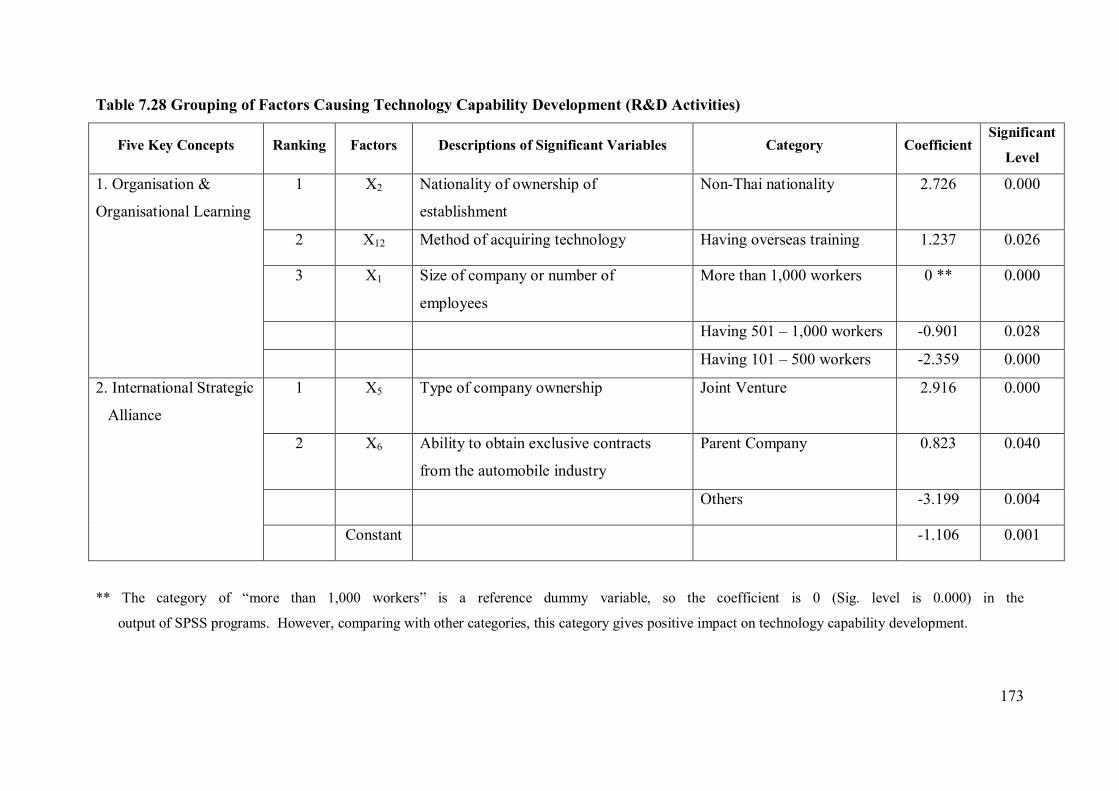
173
Table 7.28 Grouping of Factors Causing Technology Capability Development (R&D Activities)
Five Key Concepts Ranking Factors Descriptions of Significant Variables Category Coefficient Significant
Level
1. Organisation &
Organisational Learning
1 X2 Nationality of ownership of
establishment
Non-Thai nationality 2.726 0.000
2 X12 Method of acquiring technology Having overseas training 1.237 0.026
3 X1 Size of company or number of
employees
More than 1,000 workers 0 **
0.000
Having 501 – 1,000 workers -0.901 0.028
Having 101 – 500 workers -2.359 0.000
2. International Strategic
Alliance
1 X5 Type of company ownership Joint Venture 2.916 0.000
2 X6 Ability to obtain exclusive contracts
from the automobile industry
Parent Company 0.823 0.040
Others -3.199 0.004
Constant -1.106 0.001
** The category of “more than 1,000 workers” is a reference dummy variable, so the coefficient is 0 (Sig. level is 0.000) in the
output of SPSS programs. However, comparing with other categories, this category gives positive impact on technology capability development.
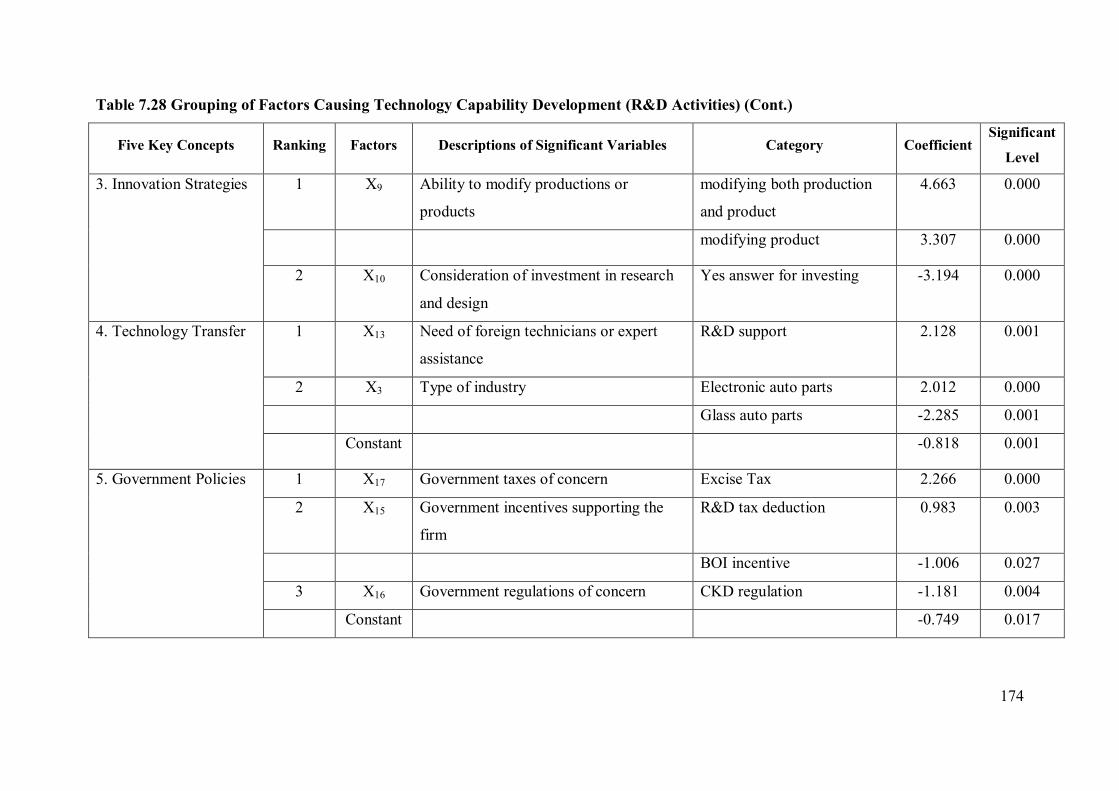
174
Table 7.28 Grouping of Factors Causing Technology Capability Development (R&D Activities) (Cont.)
Five Key Concepts Ranking Factors Descriptions of Significant Variables Category Coefficient Significant
Level
3. Innovation Strategies 1 X9 Ability to modify productions or
products
modifying both production
and product
4.663 0.000
modifying product 3.307 0.000
2 X10 Consideration of investment in research
and design
Yes answer for investing -3.194 0.000
4. Technology Transfer 1 X13 Need of foreign technicians or expert
assistance
R&D support 2.128 0.001
2 X3 Type of industry Electronic auto parts 2.012 0.000
Glass auto parts -2.285 0.001
Constant -0.818 0.001
5. Government Policies 1 X17 Government taxes of concern Excise Tax 2.266 0.000
2 X15 Government incentives supporting the
firm
R&D tax deduction 0.983 0.003
BOI incentive -1.006 0.027
3 X16 Government regulations of concern CKD regulation -1.181 0.004
Constant -0.749 0.017
175
Chapter 8
Phase III Qualitative Data Analysis of Current Technological Capability in
the Thai Automotive Industry
8.1 Introduction
This chapter concerns qualitative data analysis which involves the further uncovering of
several important issues relevant to the development of technological capability in the Thai
automotive industry above and beyond the findings of Phase I and II. Phase I provided an
opportunity to determine key issues about government policy that should be considered in
understanding Thai automotive industry development, and Phase II helped to identify factors
affecting technological capability development in the industry. A combination of quantitative
and qualitative research was necessary to gain a more comprehensive understanding of the
issues under study. Thus, Phase I and Phase II served as exploratory research. Then, in order
to triangulate, Phase III was carried out to validate the findings of Phase II, and, more
importantly, to ensure that the findings covered all issues and factors involved (see Figure
8.1).
This chapter presents an analysis of key interviews with leading experts regarding the
development of technology in the Thai automotive industry. In Section 8.2, the sample and
the instrument for collecting and analysing data is described. In Section 8.3, the research
findings from Phase II are reviewed. The results of reviewing all 12 significant variables
(factors) are presented in Table 8.1. In Section 8.4, the Phase III findings identify three new
issues: The first, the issue of the clustering of automobile suppliers, is presented in Section
8.4.1. The second, in Section 8.4.2, relates to technology transfer from MNEs to local
suppliers. And the third, in Section 8.4.3, relates to the pick-up truck phenomenon. Section
8.5 concludes the chapter.
8.2 Phase III Sample and Instrument Description
The sample comprised of 10 leading government policy makers and automotive firm
managers who were taken from a purposively sampled selection. Semi-structured face-to-face
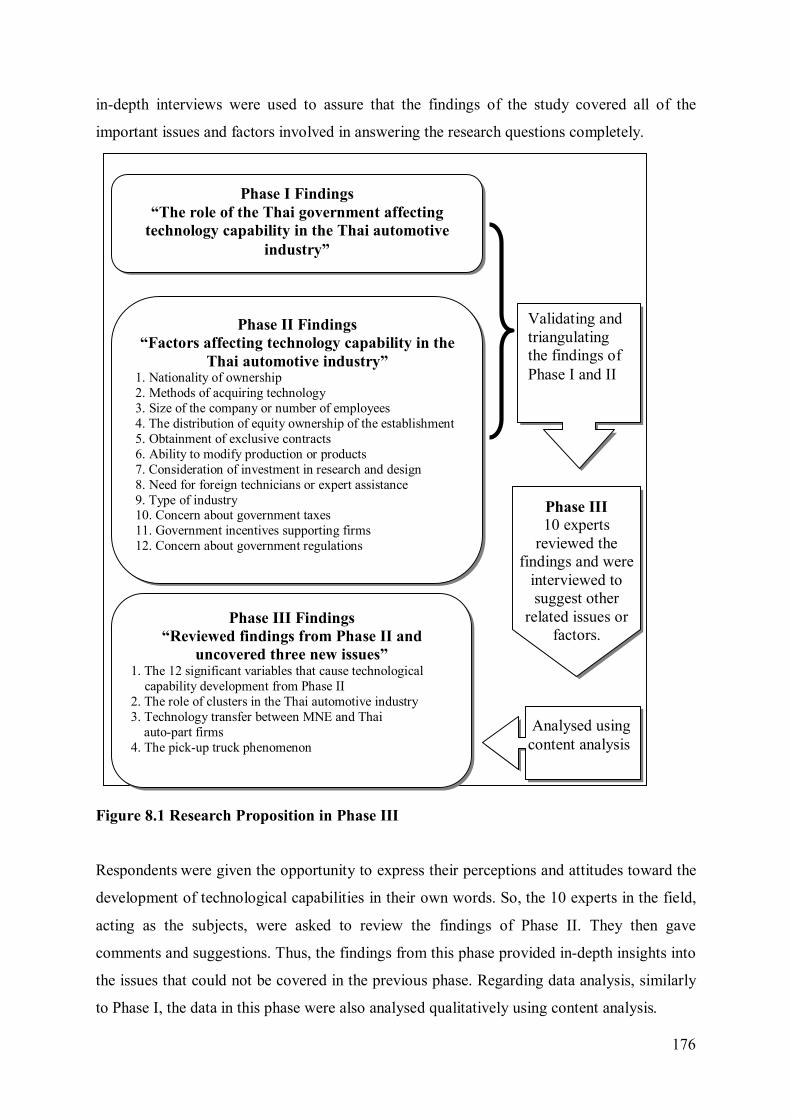
176
in-depth interviews were used to assure that the findings of the study covered all of the
important issues and factors involved in answering the research questions completely.
Figure 8.1 Research Proposition in Phase III
Respondents were given the opportunity to express their perceptions and attitudes toward the
development of technological capabilities in their own words. So, the 10 experts in the field,
acting as the subjects, were asked to review the findings of Phase II. They then gave
comments and suggestions. Thus, the findings from this phase provided in-depth insights into
the issues that could not be covered in the previous phase. Regarding data analysis, similarly
to Phase I, the data in this phase were also analysed qualitatively using content analysis.
Phase I Findings
“The role of the Thai government affecting technology capability in the Thai automotive
industry”
Phase II Findings “Factors affecting technology capability in the
Thai automotive industry” 1. Nationality of ownership 2. Methods of acquiring technology 3. Size of the company or number of employees 4. The distribution of equity ownership of the establishment 5. Obtainment of exclusive contracts 6. Ability to modify production or products 7. Consideration of investment in research and design 8. Need for foreign technicians or expert assistance 9. Type of industry 10. Concern about government taxes 11. Government incentives supporting firms 12. Concern about government regulations
Validating and triangulating the findings of Phase I and II
Phase III 10 experts
reviewed the findings and were
interviewed to suggest other
related issues or factors.
Analysed using content analysis
Phase III Findings “Reviewed findings from Phase II and
uncovered three new issues” 1. The 12 significant variables that cause technological capability development from Phase II 2. The role of clusters in the Thai automotive industry 3. Technology transfer between MNE and Thai
auto-part firms 4. The pick-up truck phenomenon
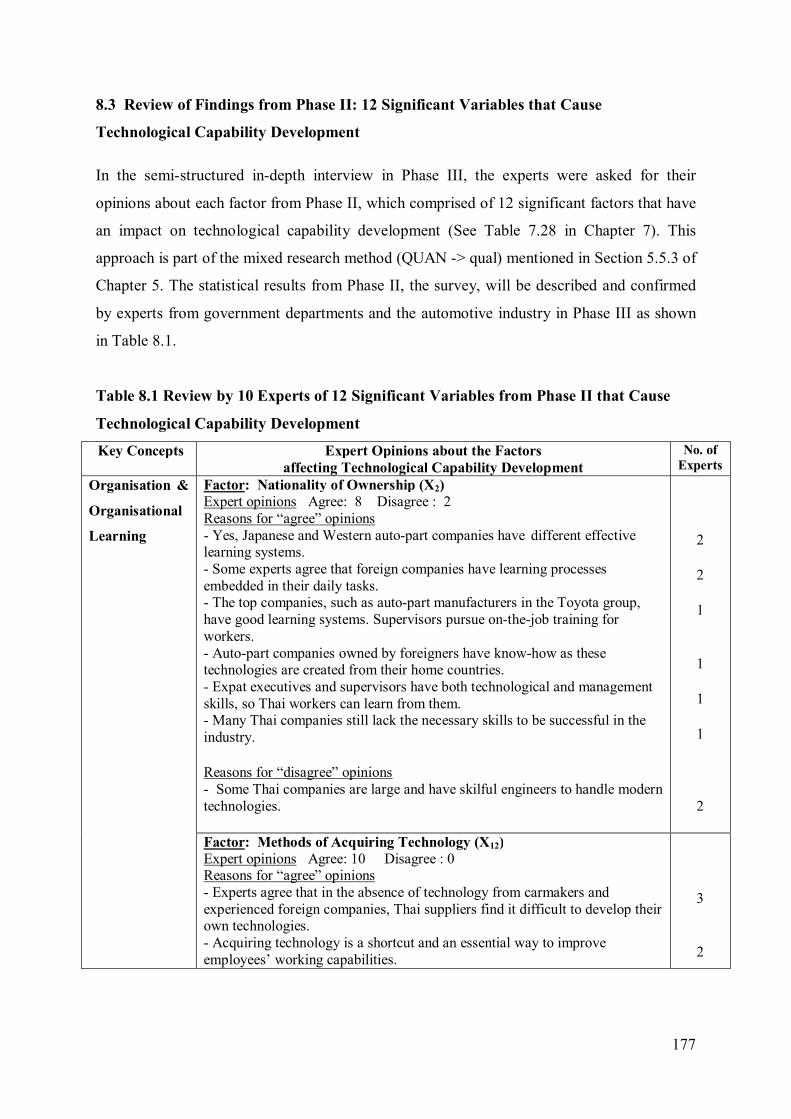
177
8.3 Review of Findings from Phase II: 12 Significant Variables that Cause
Technological Capability Development
In the semi-structured in-depth interview in Phase III, the experts were asked for their
opinions about each factor from Phase II, which comprised of 12 significant factors that have
an impact on technological capability development (See Table 7.28 in Chapter 7). This
approach is part of the mixed research method (QUAN -> qual) mentioned in Section 5.5.3 of
Chapter 5. The statistical results from Phase II, the survey, will be described and confirmed
by experts from government departments and the automotive industry in Phase III as shown
in Table 8.1.
Table 8.1 Review by 10 Experts of 12 Significant Variables from Phase II that Cause
Technological Capability Development
Key Concepts Expert Opinions about the Factors affecting Technological Capability Development
No. of Experts
Organisation &
Organisational
Learning
Factor: Nationality of Ownership (X2) Expert opinions Agree: 8 Disagree : 2 Reasons for “agree” opinions - Yes, Japanese and Western auto-part companies have different effective learning systems. - Some experts agree that foreign companies have learning processes embedded in their daily tasks. - The top companies, such as auto-part manufacturers in the Toyota group, have good learning systems. Supervisors pursue on-the-job training for workers. - Auto-part companies owned by foreigners have know-how as these technologies are created from their home countries. - Expat executives and supervisors have both technological and management skills, so Thai workers can learn from them. - Many Thai companies still lack the necessary skills to be successful in the industry. Reasons for “disagree” opinions - Some Thai companies are large and have skilful engineers to handle modern technologies.
2
2
1
1
1
1
2
Factor: Methods of Acquiring Technology (X12) Expert opinions Agree: 10 Disagree : 0 Reasons for “agree” opinions - Experts agree that in the absence of technology from carmakers and experienced foreign companies, Thai suppliers find it difficult to develop their own technologies. - Acquiring technology is a shortcut and an essential way to improve employees’ working capabilities.
3
2
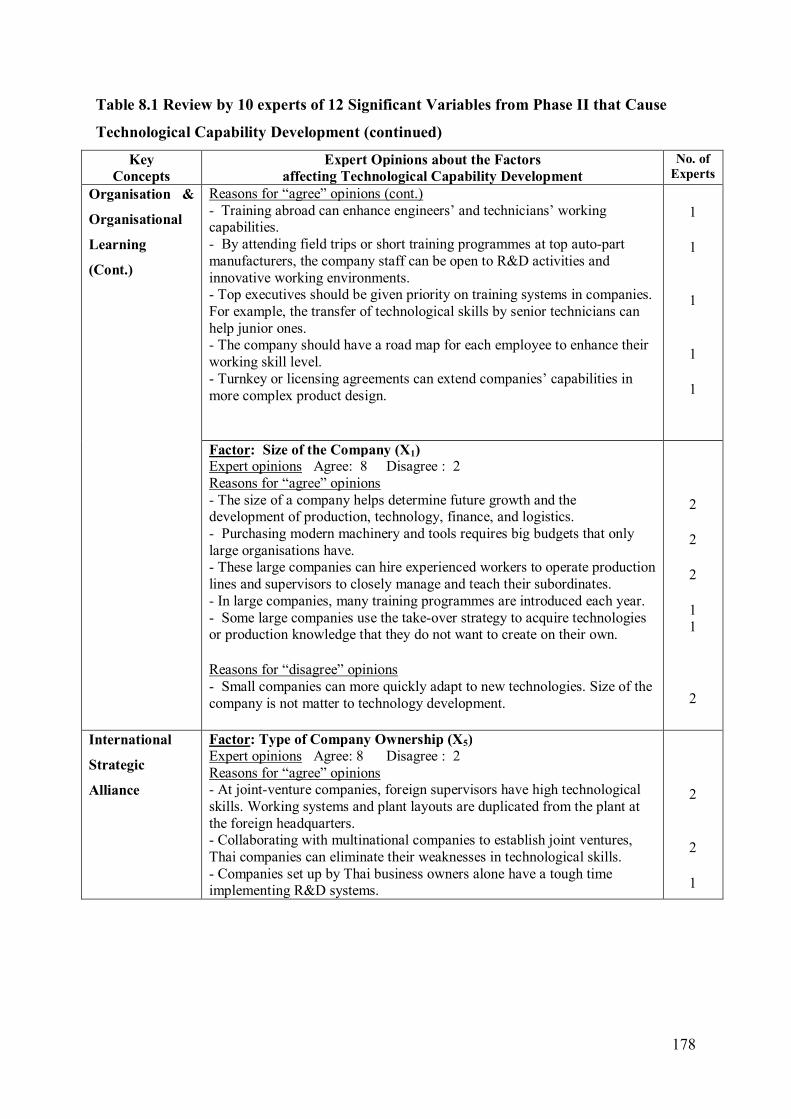
178
Table 8.1 Review by 10 experts of 12 Significant Variables from Phase II that Cause
Technological Capability Development (continued)
Key Concepts
Expert Opinions about the Factors affecting Technological Capability Development
No. of Experts
Organisation &
Organisational
Learning (Cont.)
Reasons for “agree” opinions (cont.) - Training abroad can enhance engineers’ and technicians’ working capabilities. - By attending field trips or short training programmes at top auto-part manufacturers, the company staff can be open to R&D activities and innovative working environments. - Top executives should be given priority on training systems in companies. For example, the transfer of technological skills by senior technicians can help junior ones. - The company should have a road map for each employee to enhance their working skill level. - Turnkey or licensing agreements can extend companies’ capabilities in more complex product design.
1
1
1
1
1
Factor: Size of the Company (X1) Expert opinions Agree: 8 Disagree : 2 Reasons for “agree” opinions - The size of a company helps determine future growth and the development of production, technology, finance, and logistics. - Purchasing modern machinery and tools requires big budgets that only large organisations have. - These large companies can hire experienced workers to operate production lines and supervisors to closely manage and teach their subordinates. - In large companies, many training programmes are introduced each year. - Some large companies use the take-over strategy to acquire technologies or production knowledge that they do not want to create on their own. Reasons for “disagree” opinions - Small companies can more quickly adapt to new technologies. Size of the company is not matter to technology development.
2
2
2
1 1
2
International Strategic
Alliance
Factor: Type of Company Ownership (X5) Expert opinions Agree: 8 Disagree : 2 Reasons for “agree” opinions - At joint-venture companies, foreign supervisors have high technological skills. Working systems and plant layouts are duplicated from the plant at the foreign headquarters. - Collaborating with multinational companies to establish joint ventures, Thai companies can eliminate their weaknesses in technological skills. - Companies set up by Thai business owners alone have a tough time implementing R&D systems.
2
2
1
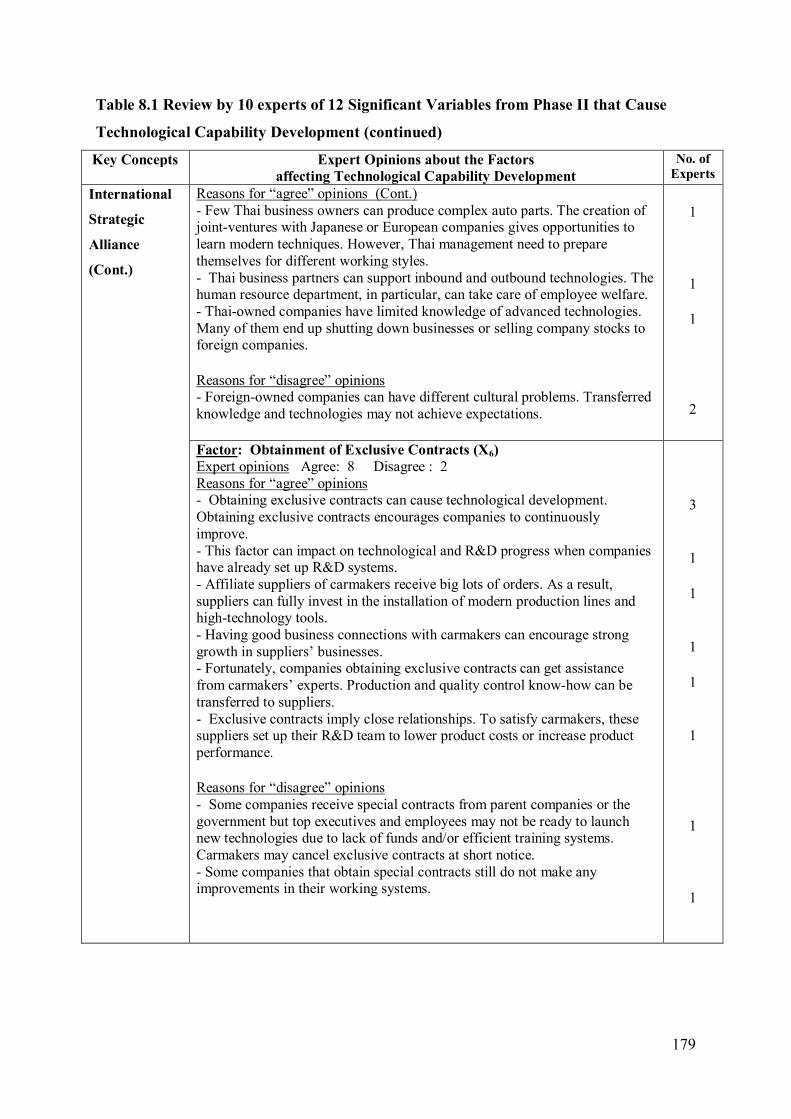
179
Table 8.1 Review by 10 experts of 12 Significant Variables from Phase II that Cause
Technological Capability Development (continued)
Key Concepts Expert Opinions about the Factors affecting Technological Capability Development
No. of Experts
International Strategic
Alliance
(Cont.)
Reasons for “agree” opinions (Cont.) - Few Thai business owners can produce complex auto parts. The creation of joint-ventures with Japanese or European companies gives opportunities to learn modern techniques. However, Thai management need to prepare themselves for different working styles. - Thai business partners can support inbound and outbound technologies. The human resource department, in particular, can take care of employee welfare. - Thai-owned companies have limited knowledge of advanced technologies. Many of them end up shutting down businesses or selling company stocks to foreign companies. Reasons for “disagree” opinions - Foreign-owned companies can have different cultural problems. Transferred knowledge and technologies may not achieve expectations.
1
1
1
2
Factor: Obtainment of Exclusive Contracts (X6) Expert opinions Agree: 8 Disagree : 2 Reasons for “agree” opinions - Obtaining exclusive contracts can cause technological development. Obtaining exclusive contracts encourages companies to continuously improve. - This factor can impact on technological and R&D progress when companies have already set up R&D systems. - Affiliate suppliers of carmakers receive big lots of orders. As a result, suppliers can fully invest in the installation of modern production lines and high-technology tools. - Having good business connections with carmakers can encourage strong growth in suppliers’ businesses. - Fortunately, companies obtaining exclusive contracts can get assistance from carmakers’ experts. Production and quality control know-how can be transferred to suppliers. - Exclusive contracts imply close relationships. To satisfy carmakers, these suppliers set up their R&D team to lower product costs or increase product performance. Reasons for “disagree” opinions - Some companies receive special contracts from parent companies or the government but top executives and employees may not be ready to launch new technologies due to lack of funds and/or efficient training systems. Carmakers may cancel exclusive contracts at short notice. - Some companies that obtain special contracts still do not make any improvements in their working systems.
3
1
1
1
1
1
1
1
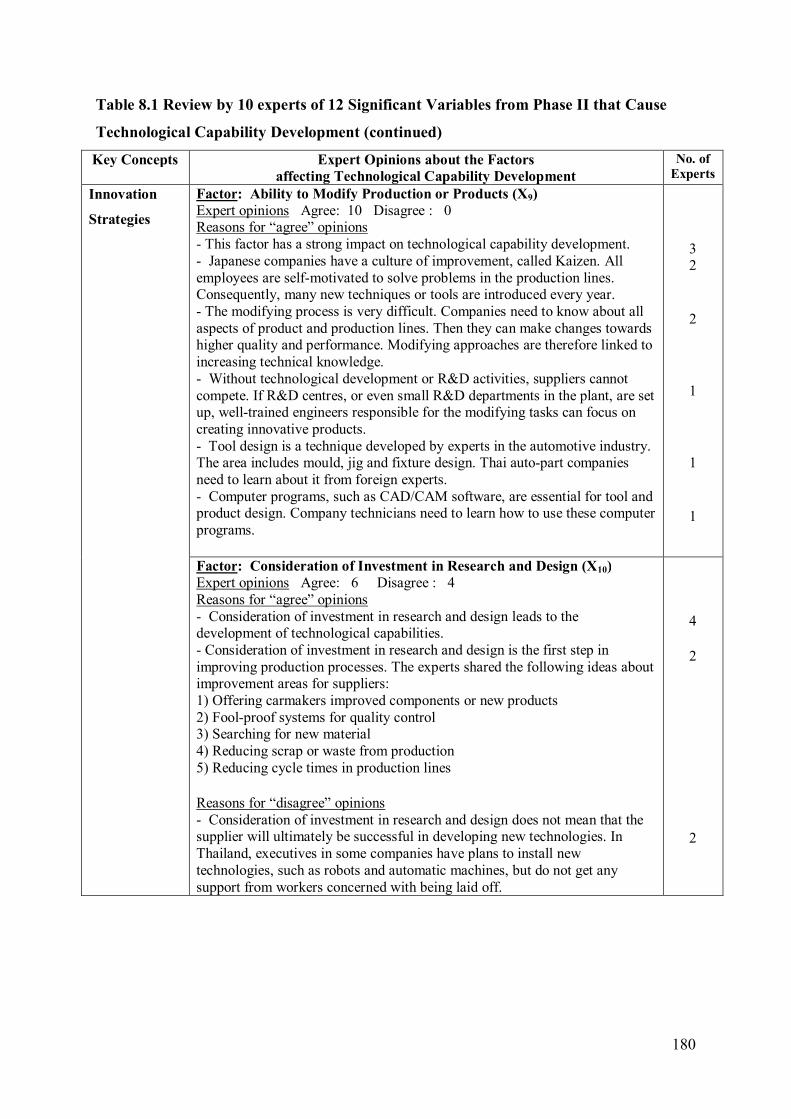
180
Table 8.1 Review by 10 experts of 12 Significant Variables from Phase II that Cause
Technological Capability Development (continued)
Key Concepts Expert Opinions about the Factors affecting Technological Capability Development
No. of Experts
Innovation
Strategies
Factor: Ability to Modify Production or Products (X9) Expert opinions Agree: 10 Disagree : 0 Reasons for “agree” opinions - This factor has a strong impact on technological capability development. - Japanese companies have a culture of improvement, called Kaizen. All employees are self-motivated to solve problems in the production lines. Consequently, many new techniques or tools are introduced every year. - The modifying process is very difficult. Companies need to know about all aspects of product and production lines. Then they can make changes towards higher quality and performance. Modifying approaches are therefore linked to increasing technical knowledge. - Without technological development or R&D activities, suppliers cannot compete. If R&D centres, or even small R&D departments in the plant, are set up, well-trained engineers responsible for the modifying tasks can focus on creating innovative products. - Tool design is a technique developed by experts in the automotive industry. The area includes mould, jig and fixture design. Thai auto-part companies need to learn about it from foreign experts. - Computer programs, such as CAD/CAM software, are essential for tool and product design. Company technicians need to learn how to use these computer programs.
3 2
2
1
1
1
Factor: Consideration of Investment in Research and Design (X10) Expert opinions Agree: 6 Disagree : 4 Reasons for “agree” opinions - Consideration of investment in research and design leads to the development of technological capabilities. - Consideration of investment in research and design is the first step in improving production processes. The experts shared the following ideas about improvement areas for suppliers: 1) Offering carmakers improved components or new products 2) Fool-proof systems for quality control 3) Searching for new material 4) Reducing scrap or waste from production 5) Reducing cycle times in production lines Reasons for “disagree” opinions - Consideration of investment in research and design does not mean that the supplier will ultimately be successful in developing new technologies. In Thailand, executives in some companies have plans to install new technologies, such as robots and automatic machines, but do not get any support from workers concerned with being laid off.
4
2
2
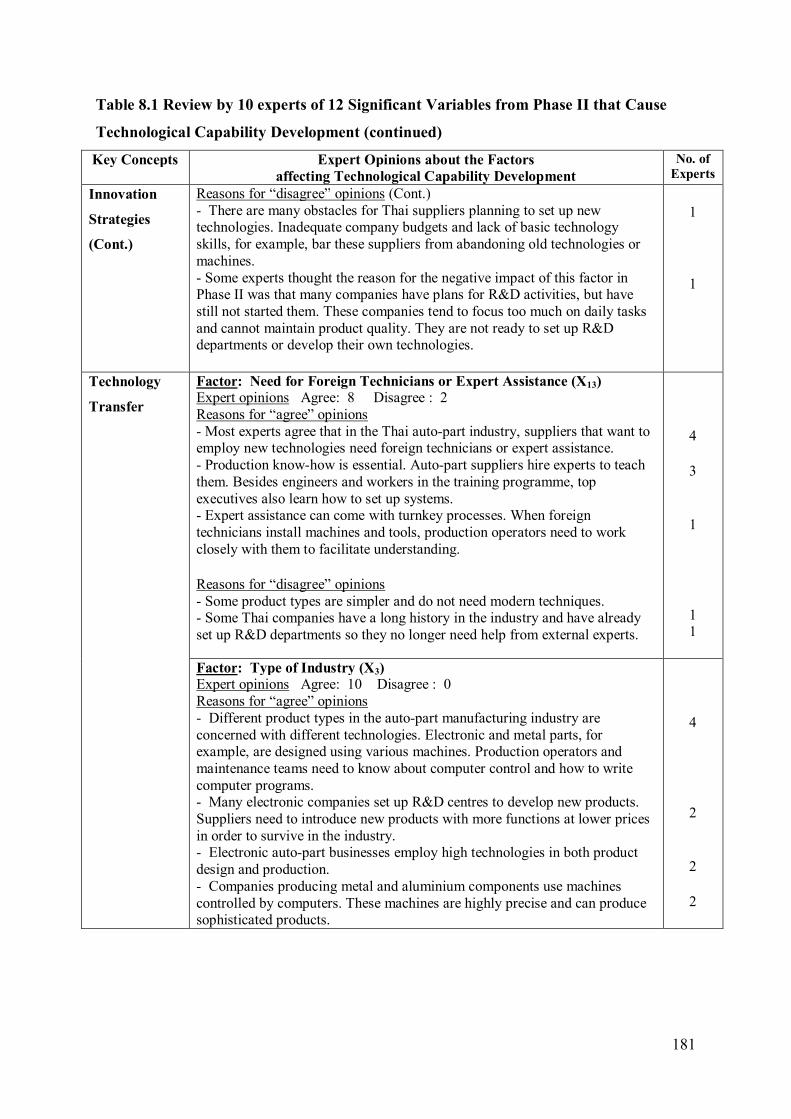
181
Table 8.1 Review by 10 experts of 12 Significant Variables from Phase II that Cause
Technological Capability Development (continued)
Key Concepts Expert Opinions about the Factors affecting Technological Capability Development
No. of Experts
Innovation
Strategies (Cont.)
Reasons for “disagree” opinions (Cont.) - There are many obstacles for Thai suppliers planning to set up new technologies. Inadequate company budgets and lack of basic technology skills, for example, bar these suppliers from abandoning old technologies or machines. - Some experts thought the reason for the negative impact of this factor in Phase II was that many companies have plans for R&D activities, but have still not started them. These companies tend to focus too much on daily tasks and cannot maintain product quality. They are not ready to set up R&D departments or develop their own technologies.
1
1
Technology
Transfer
Factor: Need for Foreign Technicians or Expert Assistance (X13) Expert opinions Agree: 8 Disagree : 2 Reasons for “agree” opinions - Most experts agree that in the Thai auto-part industry, suppliers that want to employ new technologies need foreign technicians or expert assistance. - Production know-how is essential. Auto-part suppliers hire experts to teach them. Besides engineers and workers in the training programme, top executives also learn how to set up systems. - Expert assistance can come with turnkey processes. When foreign technicians install machines and tools, production operators need to work closely with them to facilitate understanding. Reasons for “disagree” opinions - Some product types are simpler and do not need modern techniques. - Some Thai companies have a long history in the industry and have already set up R&D departments so they no longer need help from external experts.
4
3
1
1 1
Factor: Type of Industry (X3) Expert opinions Agree: 10 Disagree : 0 Reasons for “agree” opinions - Different product types in the auto-part manufacturing industry are concerned with different technologies. Electronic and metal parts, for example, are designed using various machines. Production operators and maintenance teams need to know about computer control and how to write computer programs. - Many electronic companies set up R&D centres to develop new products. Suppliers need to introduce new products with more functions at lower prices in order to survive in the industry. - Electronic auto-part businesses employ high technologies in both product design and production. - Companies producing metal and aluminium components use machines controlled by computers. These machines are highly precise and can produce sophisticated products.
4
2
2
2
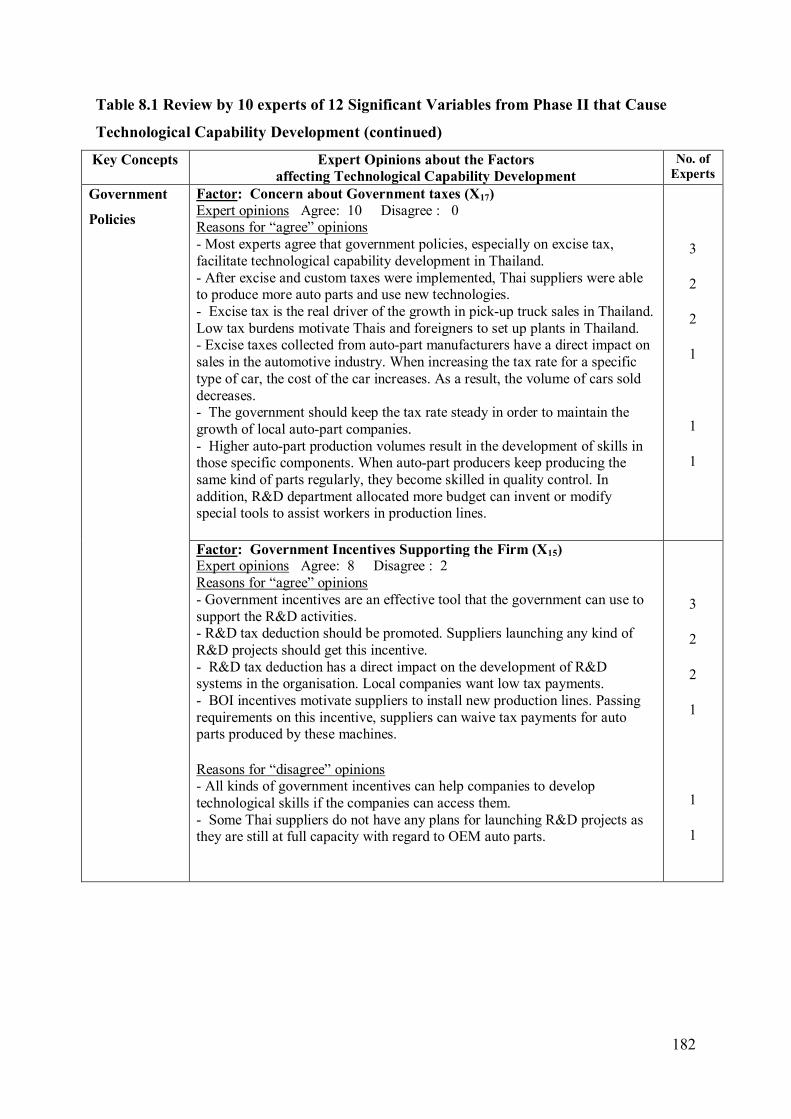
182
Table 8.1 Review by 10 experts of 12 Significant Variables from Phase II that Cause
Technological Capability Development (continued)
Key Concepts Expert Opinions about the Factors affecting Technological Capability Development
No. of Experts
Government
Policies
Factor: Concern about Government taxes (X17) Expert opinions Agree: 10 Disagree : 0 Reasons for “agree” opinions - Most experts agree that government policies, especially on excise tax, facilitate technological capability development in Thailand. - After excise and custom taxes were implemented, Thai suppliers were able to produce more auto parts and use new technologies. - Excise tax is the real driver of the growth in pick-up truck sales in Thailand. Low tax burdens motivate Thais and foreigners to set up plants in Thailand. - Excise taxes collected from auto-part manufacturers have a direct impact on sales in the automotive industry. When increasing the tax rate for a specific type of car, the cost of the car increases. As a result, the volume of cars sold decreases. - The government should keep the tax rate steady in order to maintain the growth of local auto-part companies. - Higher auto-part production volumes result in the development of skills in those specific components. When auto-part producers keep producing the same kind of parts regularly, they become skilled in quality control. In addition, R&D department allocated more budget can invent or modify special tools to assist workers in production lines.
3
2
2
1
1
1
Factor: Government Incentives Supporting the Firm (X15) Expert opinions Agree: 8 Disagree : 2 Reasons for “agree” opinions - Government incentives are an effective tool that the government can use to support the R&D activities. - R&D tax deduction should be promoted. Suppliers launching any kind of R&D projects should get this incentive. - R&D tax deduction has a direct impact on the development of R&D systems in the organisation. Local companies want low tax payments. - BOI incentives motivate suppliers to install new production lines. Passing requirements on this incentive, suppliers can waive tax payments for auto parts produced by these machines. Reasons for “disagree” opinions - All kinds of government incentives can help companies to develop technological skills if the companies can access them. - Some Thai suppliers do not have any plans for launching R&D projects as they are still at full capacity with regard to OEM auto parts.
3
2
2
1
1
1
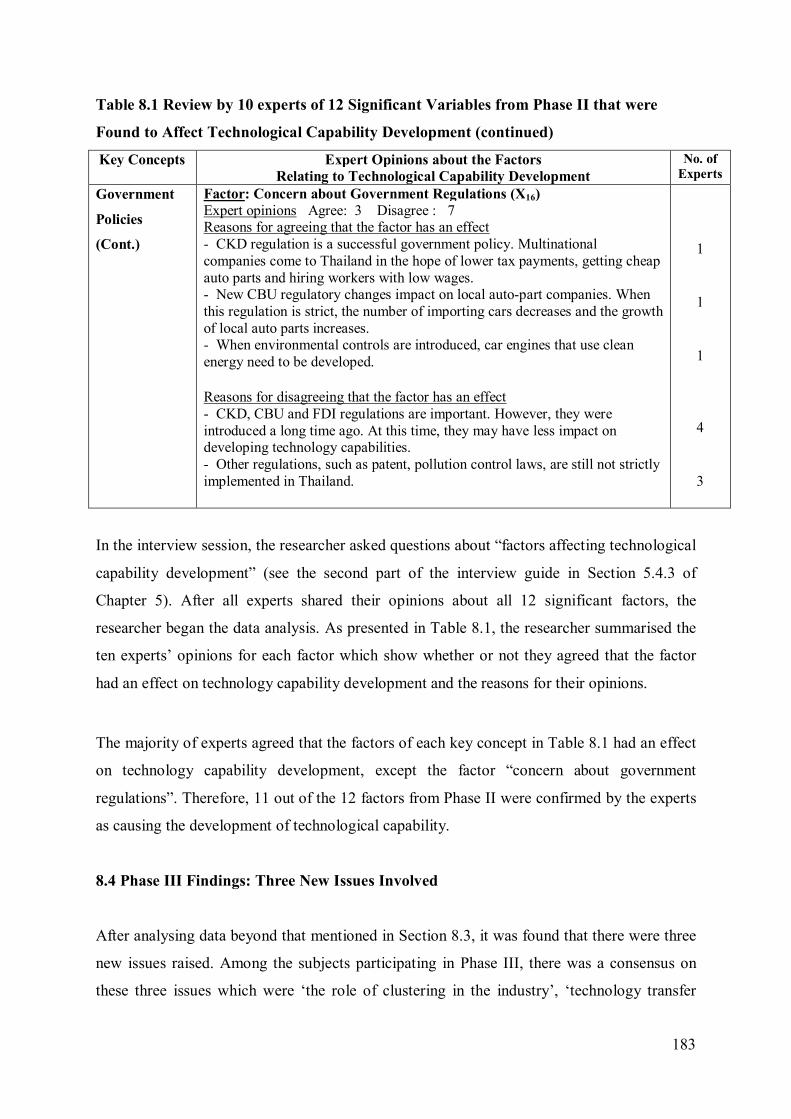
183
Table 8.1 Review by 10 experts of 12 Significant Variables from Phase II that were
Found to Affect Technological Capability Development (continued)
Key Concepts Expert Opinions about the Factors Relating to Technological Capability Development
No. of Experts
Government
Policies (Cont.)
Factor: Concern about Government Regulations (X16) Expert opinions Agree: 3 Disagree : 7 Reasons for agreeing that the factor has an effect - CKD regulation is a successful government policy. Multinational companies come to Thailand in the hope of lower tax payments, getting cheap auto parts and hiring workers with low wages. - New CBU regulatory changes impact on local auto-part companies. When this regulation is strict, the number of importing cars decreases and the growth of local auto parts increases. - When environmental controls are introduced, car engines that use clean energy need to be developed. Reasons for disagreeing that the factor has an effect - CKD, CBU and FDI regulations are important. However, they were introduced a long time ago. At this time, they may have less impact on developing technology capabilities. - Other regulations, such as patent, pollution control laws, are still not strictly implemented in Thailand.
1
1
1
4
3
In the interview session, the researcher asked questions about “factors affecting technological
capability development” (see the second part of the interview guide in Section 5.4.3 of
Chapter 5). After all experts shared their opinions about all 12 significant factors, the
researcher began the data analysis. As presented in Table 8.1, the researcher summarised the
ten experts’ opinions for each factor which show whether or not they agreed that the factor
had an effect on technology capability development and the reasons for their opinions.
The majority of experts agreed that the factors of each key concept in Table 8.1 had an effect
on technology capability development, except the factor “concern about government
regulations”. Therefore, 11 out of the 12 factors from Phase II were confirmed by the experts
as causing the development of technological capability.
8.4 Phase III Findings: Three New Issues Involved
After analysing data beyond that mentioned in Section 8.3, it was found that there were three
new issues raised. Among the subjects participating in Phase III, there was a consensus on
these three issues which were ‘the role of clustering in the industry’, ‘technology transfer
184
between MNE and the Thai auto-parts firms’, and ‘the pick-up truck phenomenon’ (see Table
8.2). Details of the Phase III findings are presented in Sections 8.4.1 to 8.4.3.
Table 8.2 New Issues as Findings in Phase III
New Issues as Findings in Phase III Sub Topics of Issues
8.4.1 The role of clustering in the Thai automotive industry
8.4.2 Technology transfer between MNE and Thai auto-parts firms
8.4.2.1 Importance of MNE technology transfer
8.4.2.2 The local part procurements of Japanese MNE automotive assemblers
8.4.2.3 The local part procurements of Western MNE automotive assemblers
8.4.2.4 Technology transfer patterns between first-tier suppliers and MNE Japanese automakers.
8.4.2.5 Technology transfer to lower-tier suppliers
8.4.3 The pick-up truck phenomenon 8.4.3.1 Thailand as a pick-up production base
8.4.3.2 The unintended outcome of the tax policy
8.4.1 The Role of Clustering in the Thai Automotive Industry
Most respondents talked about various issues regarding the clustering of automobile
suppliers. The director of the Thai Automotive Institute (B3) revealed that after its
development in the 1990s, the Thai automobile cluster grew at a rapid pace, particularly after
the financial crisis, into a leading export sector.
In their analysis of the driving forces behind Thai automotive cluster development, specialists
at the office of industrial economics (C2) suggested that key factors included improvement in
the Context for Firm Strategy and Rivalry (CSR) and strong local demand.
According to the Deputy Secretary-General at the Thai Board of Investment (C3), gradual
reductions in auto part tariffs and government initiated liberalisation of local content
185
requirements have allowed for the continuous improvement of the CSR condition of the
cluster. As such, the country has been able to receive the full benefits of the global trend that
occurred during the mid-nineties of Japanese firms relocating their production facilities. And
as existing Japanese companies expanded investment, major European and US auto
companies involved in parts manufacturing and assembly also entered the market.
Despite startling performance, the specialist from the Office of Industrial Economies (C2)
argued that the cluster remained in a relatively shallow state. The majority of its activities
were still concentrated on assembly rather than on the technologically more sophisticated
activities of R&D, process engineering and product development. Despite a number of signs
of improvement in recent years, respondents C2 and B1 warned that weaknesses in related
and supporting industries have slowed moves towards a deepening of the cluster. However,
the Senior Vice President of Toyota Motor Thailand disagreed mentioning:
“We founded Toyota Technical Centre Asia Pacific in 2005. This centre is responsible for
R&D for the Pacific area. We granted around 200 scholarships for engineers to study further
in Japan. We expect that there will be 500 engineers in this centre composed of 200 Japanese
and 300 Thais and eventually all Thais.”
The Vice President of the Thai Autoparts Manufacturers Association (B2) expressed his
concern about key cluster areas that remain uncompetitive, including second- and third-tier
parts producers. Foreign firms still produce or import the majority of the more sophisticated
parts. Local firms are mostly small- and medium-size companies which act as producers of
second-tier parts, and supply basic components and raw materials to first-tier suppliers.
Respondent B2 also said that:
“a lack of skilled workers and low quality control management in indigenous firms were the
primary reasons for their failure to develop products meeting international standards.”
According to respondents B1, B2, B3 and C2, the current skills shortage exists for three main
reasons. Firstly, universities and automotive companies lack links, which means graduate
skills are not properly matched with company requirements. Secondly, the public education
system does not provide strong technically-based labour. The situation is reflective of current
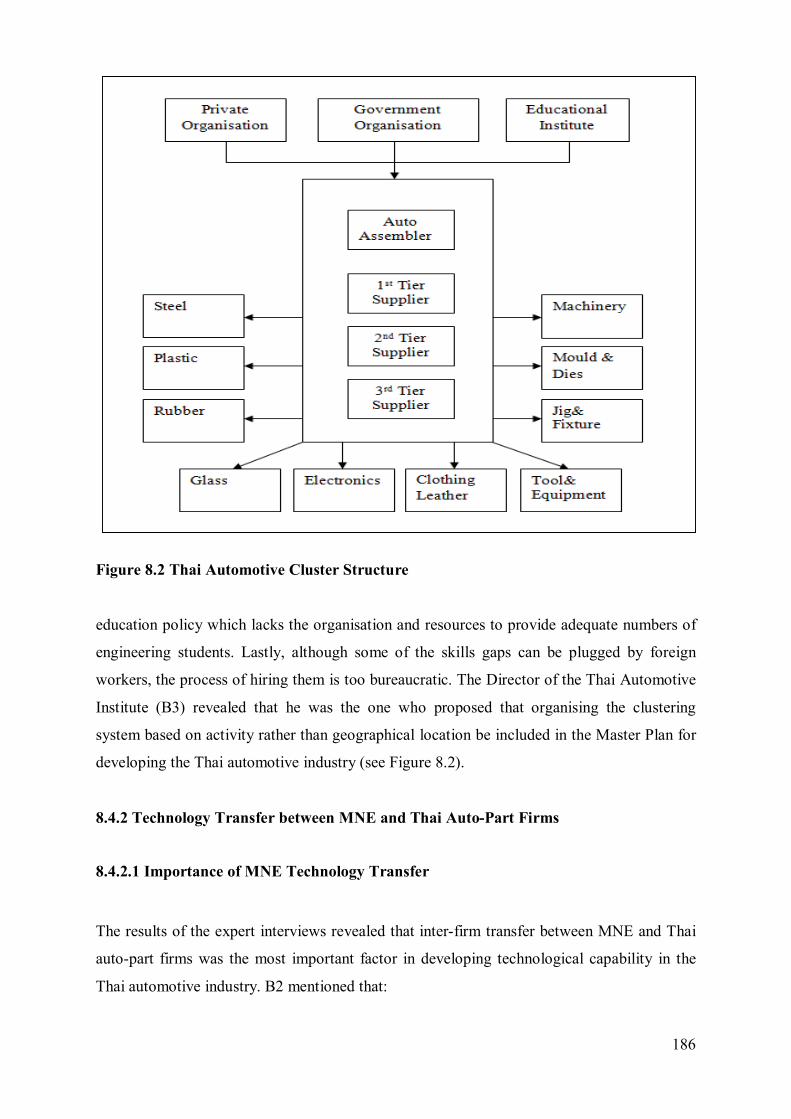
186
Figure 8.2 Thai Automotive Cluster Structure
education policy which lacks the organisation and resources to provide adequate numbers of
engineering students. Lastly, although some of the skills gaps can be plugged by foreign
workers, the process of hiring them is too bureaucratic. The Director of the Thai Automotive
Institute (B3) revealed that he was the one who proposed that organising the clustering
system based on activity rather than geographical location be included in the Master Plan for
developing the Thai automotive industry (see Figure 8.2).
8.4.2 Technology Transfer between MNE and Thai Auto-Part Firms
8.4.2.1 Importance of MNE Technology Transfer
The results of the expert interviews revealed that inter-firm transfer between MNE and Thai
auto-part firms was the most important factor in developing technological capability in the
Thai automotive industry. B2 mentioned that:
187
“Strong links could promote more efficient production in local suppliers, along with higher
levels of technological skills and managerial abilities, which in turn could result in positive
side-effects in terms of technology for the remainder of the Thai automotive industry.”
B1 mentioned that “The reason for MNE to transfer the technology to a local supplier is not
the direct profit or dividends but productivity or cost-reduction by the local suppliers”.
Interestingly, a significant number of respondents revealed that they do not think that inter-
firm technology is as important as intra-firm technology. They think that with intra-firm
technology, parent companies will give full support to their foreign affiliates but the
development of technological capability will normally remain with the foreign affiliates.
A1 stated that it would be better if: “...automakers utilised local resources to achieve global
sales targets. Utilising these resources tends to result in increases in local part
procurements...”
8.4.2.2 The Local Part Procurements of Japanese MNE Auto Assemblers
Both A1 and A2 are Senior Vice Presidents of two of the largest Japanese MNE Automakers
in Thailand. They stated that, in Thailand, Japanese automakers are heavily reliant on
procuring parts from local producers. Only some parts requiring high technology production
processes such as car engines, electronic control units, electronic systems, and fuel injection
pumps need to be produced in Japan because of the lack of expertise in Thailand.
B2, the Vice President of Thai Auto-part Manufacturers, was concerned that: “quality being
the most crucial requirement of Japanese automakers, it must rise to international standards
in terms of locally assembled automobiles, or first-tier suppliers would lose business.”
Moreover, B3 indicated that first-tier suppliers have recently been expected to exhibit
capability in concept generation of process design and product engineering.
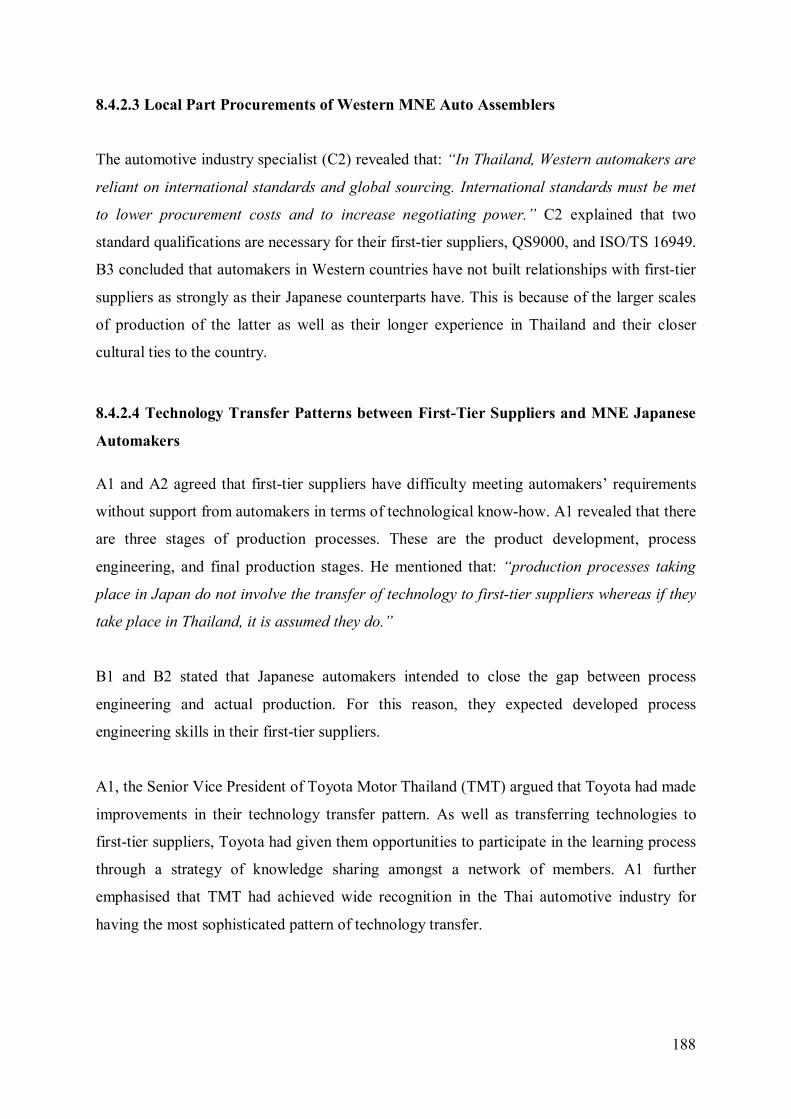
188
8.4.2.3 Local Part Procurements of Western MNE Auto Assemblers
The automotive industry specialist (C2) revealed that: “In Thailand, Western automakers are
reliant on international standards and global sourcing. International standards must be met
to lower procurement costs and to increase negotiating power.” C2 explained that two
standard qualifications are necessary for their first-tier suppliers, QS9000, and ISO/TS 16949.
B3 concluded that automakers in Western countries have not built relationships with first-tier
suppliers as strongly as their Japanese counterparts have. This is because of the larger scales
of production of the latter as well as their longer experience in Thailand and their closer
cultural ties to the country.
8.4.2.4 Technology Transfer Patterns between First-Tier Suppliers and MNE Japanese
Automakers
A1 and A2 agreed that first-tier suppliers have difficulty meeting automakers’ requirements
without support from automakers in terms of technological know-how. A1 revealed that there
are three stages of production processes. These are the product development, process
engineering, and final production stages. He mentioned that: “production processes taking
place in Japan do not involve the transfer of technology to first-tier suppliers whereas if they
take place in Thailand, it is assumed they do.”
B1 and B2 stated that Japanese automakers intended to close the gap between process
engineering and actual production. For this reason, they expected developed process
engineering skills in their first-tier suppliers.
A1, the Senior Vice President of Toyota Motor Thailand (TMT) argued that Toyota had made
improvements in their technology transfer pattern. As well as transferring technologies to
first-tier suppliers, Toyota had given them opportunities to participate in the learning process
through a strategy of knowledge sharing amongst a network of members. A1 further
emphasised that TMT had achieved wide recognition in the Thai automotive industry for
having the most sophisticated pattern of technology transfer.
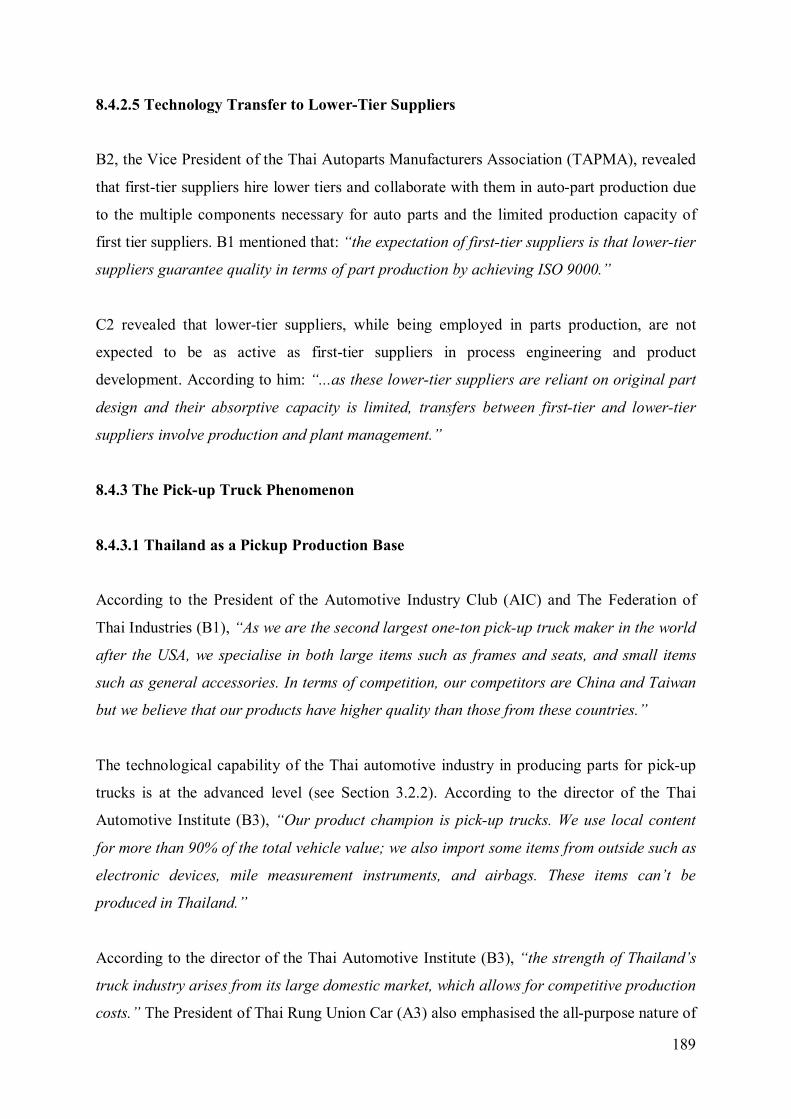
189
8.4.2.5 Technology Transfer to Lower-Tier Suppliers
B2, the Vice President of the Thai Autoparts Manufacturers Association (TAPMA), revealed
that first-tier suppliers hire lower tiers and collaborate with them in auto-part production due
to the multiple components necessary for auto parts and the limited production capacity of
first tier suppliers. B1 mentioned that: “the expectation of first-tier suppliers is that lower-tier
suppliers guarantee quality in terms of part production by achieving ISO 9000.”
C2 revealed that lower-tier suppliers, while being employed in parts production, are not
expected to be as active as first-tier suppliers in process engineering and product
development. According to him: “...as these lower-tier suppliers are reliant on original part
design and their absorptive capacity is limited, transfers between first-tier and lower-tier
suppliers involve production and plant management.”
8.4.3 The Pick-up Truck Phenomenon
8.4.3.1 Thailand as a Pickup Production Base
According to the President of the Automotive Industry Club (AIC) and The Federation of
Thai Industries (B1), “As we are the second largest one-ton pick-up truck maker in the world
after the USA, we specialise in both large items such as frames and seats, and small items
such as general accessories. In terms of competition, our competitors are China and Taiwan
but we believe that our products have higher quality than those from these countries.”
The technological capability of the Thai automotive industry in producing parts for pick-up
trucks is at the advanced level (see Section 3.2.2). According to the director of the Thai
Automotive Institute (B3), “Our product champion is pick-up trucks. We use local content
for more than 90% of the total vehicle value; we also import some items from outside such as
electronic devices, mile measurement instruments, and airbags. These items can’t be
produced in Thailand.”
According to the director of the Thai Automotive Institute (B3), “the strength of Thailand’s
truck industry arises from its large domestic market, which allows for competitive production
costs.” The President of Thai Rung Union Car (A3) also emphasised the all-purpose nature of
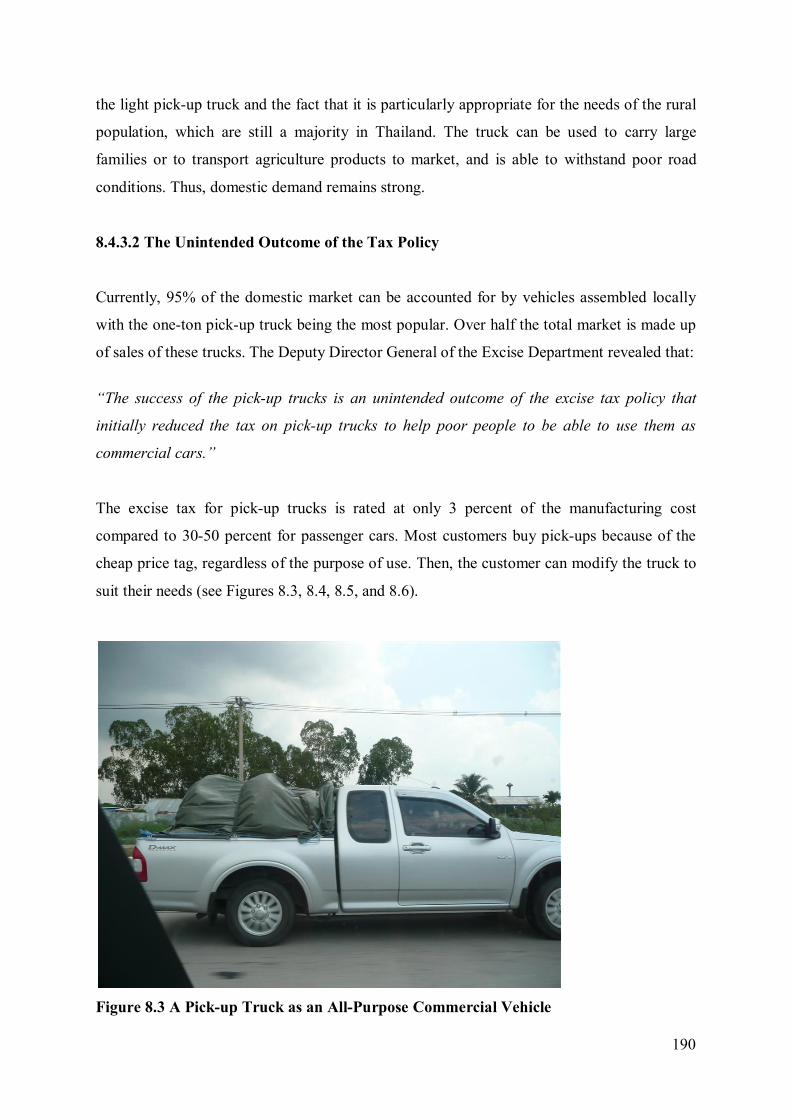
190
the light pick-up truck and the fact that it is particularly appropriate for the needs of the rural
population, which are still a majority in Thailand. The truck can be used to carry large
families or to transport agriculture products to market, and is able to withstand poor road
conditions. Thus, domestic demand remains strong.
8.4.3.2 The Unintended Outcome of the Tax Policy
Currently, 95% of the domestic market can be accounted for by vehicles assembled locally
with the one-ton pick-up truck being the most popular. Over half the total market is made up
of sales of these trucks. The Deputy Director General of the Excise Department revealed that:
“The success of the pick-up trucks is an unintended outcome of the excise tax policy that
initially reduced the tax on pick-up trucks to help poor people to be able to use them as
commercial cars.”
The excise tax for pick-up trucks is rated at only 3 percent of the manufacturing cost
compared to 30-50 percent for passenger cars. Most customers buy pick-ups because of the
cheap price tag, regardless of the purpose of use. Then, the customer can modify the truck to
suit their needs (see Figures 8.3, 8.4, 8.5, and 8.6).
Figure 8.3 A Pick-up Truck as an All-Purpose Commercial Vehicle
191
Figure 8.4 A One-Ton Pick-up Truck as a Passenger Car
Figure 8.5 A One-Ton Pickup Truck as a Bus
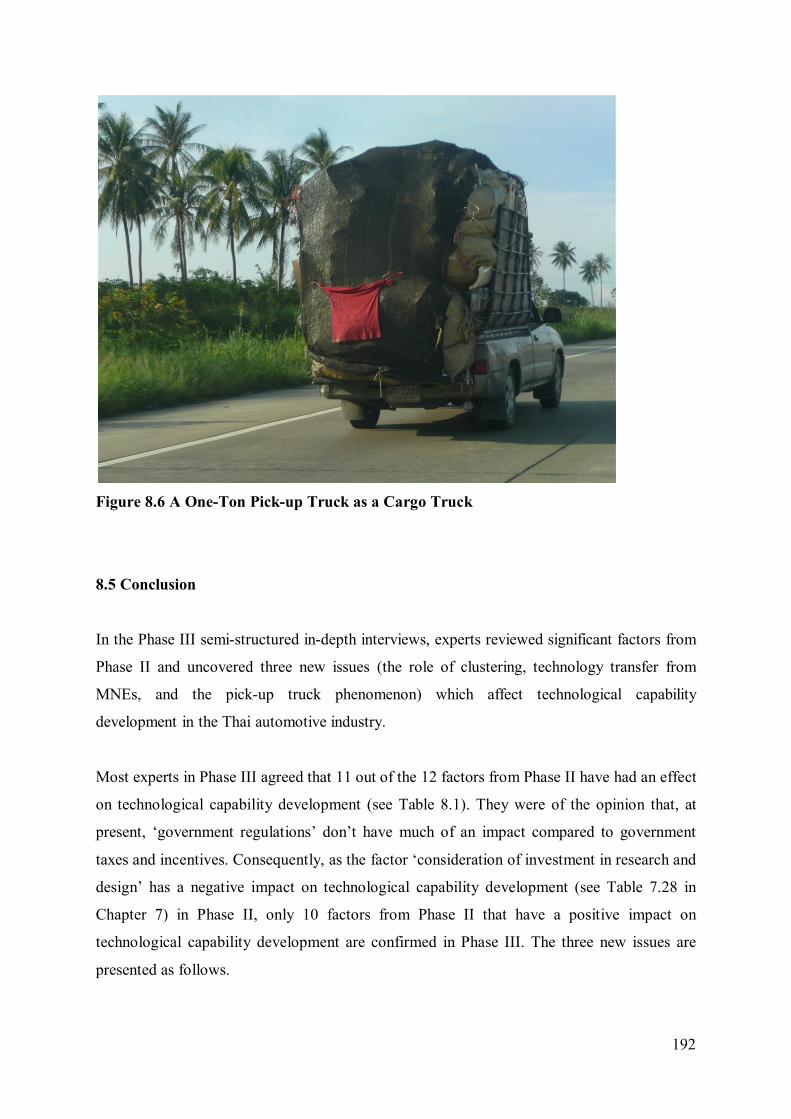
192
Figure 8.6 A One-Ton Pick-up Truck as a Cargo Truck
8.5 Conclusion
In the Phase III semi-structured in-depth interviews, experts reviewed significant factors from
Phase II and uncovered three new issues (the role of clustering, technology transfer from
MNEs, and the pick-up truck phenomenon) which affect technological capability
development in the Thai automotive industry.
Most experts in Phase III agreed that 11 out of the 12 factors from Phase II have had an effect
on technological capability development (see Table 8.1). They were of the opinion that, at
present, ‘government regulations’ don’t have much of an impact compared to government
taxes and incentives. Consequently, as the factor ‘consideration of investment in research and
design’ has a negative impact on technological capability development (see Table 7.28 in
Chapter 7) in Phase II, only 10 factors from Phase II that have a positive impact on
technological capability development are confirmed in Phase III. The three new issues are
presented as follows.
193
The clustering in the automotive industry in Thailand has been developed by MNEs
(carmakers) with support from the government. Many government policies, such as tax
incentives, support the operation of MNEs. Although some regulations, such as LCR, have
forced carmakers to procure local auto parts, these regulations have become less strict. The
challenge for local suppliers in the clusters lies in their lack of expertise in producing
sophisticated products. In order to survive in this industry it is imperative that they develop
their technological capabilities. In addition, some carmakers, such as Toyota, have set up
technical centres in Thailand and their technological knowledge can spill over into suppliers
in the clusters.
Technology transfer can be classified into intra-firm and inter-firm transfer. Intra-firm
transfer is faster, involving carmakers giving assistance in product development and process
engineering to their affiliate suppliers. When carmakers introduce a management system,
such as JIT, inter-firm transfer is involved as carmakers transfer knowledge throughout the
automotive network (see more details in Chapter 2). In the last decade, Thailand has focused
on car and auto-part exports where quality needs to be high. Japanese carmakers focus on
transferring production and technological skills to first-tier suppliers. First-tier suppliers play
an important role in assisting second- and third-tier suppliers to develop quality systems.
Western carmakers force their suppliers to apply for certificates of quality. These approaches
support Thai suppliers in improving their technological capabilities.
The growth of the pick-up industry has affected technology development capability in
Thailand. Thailand is top of the pick-up truck market. Almost all parts can be produced
locally. Local suppliers have already launched R&D projects, and for more complex parts
experts are hired.
To conclude, ten factors from Phase II and three new issues have been confirmed as having
an impact on technological capability development. The government and auto-part
manufacturers can consider these factors as areas for improvement. Chapter 9 will present the
answers to the two research questions and there will be a discussion of the findings of the
three phases.
194
Chapter 9
Discussion of Findings and Development of the Model
9.1 Introduction
This chapter involves a discussion of the findings of three phases: Phase I, the in-depth elite
interviews and documentary research, in Section 9.2; Phase II, the survey, in Section 9.3; and
Phase III, the semi-structured in-depth interviews, in Section 9.4. The main goal was to
answer the two research questions. In Section 9.5, the research findings of this study are
compared with evidence from other research in the literature review. Section 9.6 presents the
development of the empirical conceptual framework, and the conclusion can be found in
Section 9.7.
9.2 Discussion of Findings of Phase I: In-depth Elite Interviews
To answer research question 1: “What government policies were used to develop
technological capability in the Thai automotive industry from 1960-2009?” the opinions of
experts (see Chapter 6) and findings from the documentary research (see Chapter 2) are
discussed in the following section.
9.2.1 Regulations
(1) LCR (Local Content Requirement): LCR has had a big impact on the development of
technological capability. In the localisation period (1978 – 1986), LCR regulation was
stricter, up to 50% for passenger cars and 45% for commercial cars (see more details in
Chapter 2). The experts in Phase I agreed that when launching LCR it was difficult for
assemblers to acquire a supply of high-quality products. They also agreed however that LCR
encourages technology transfer. However, in 1998, the government abolished all LCRs for
passenger cars (see Section 2.3.5 of Chapter 2). Thus, LCR was not used in the conceptual
framework or in Phase II.
(2) CBU (Completely Built-Up): In 1969, the executive of the Excise Department in Phase
I revealed, the CBU tax rate on passenger cars was raised to 80 percent, on CBU commercial
cars to 60 percent, and on CBU trucks to 40 percent as the government tried to decrease the
195
number of completely built-up cars it imported. A promising option for MNEs was to set up
their assembling plants in Thailand. But in order that local suppliers could supply high-
quality parts, carmakers needed to transfer technological know-how to them.
(3) CKD (Completely Knocked-Down): In 1969, the executive of the Excise Department in
Phase I revealed, the CKD tax rate (50%) was set lower than the CBU tax rate (80%) and
assemblers tended to import car components rather than whole cars. To save on purchasing
costs, these assemblers only imported parts that could not be produced by local suppliers.
Other components were cheaper and could be procured locally. As with the CBU regulations,
carmakers needed to advise local suppliers on best practice regarding quality control and
other production skills. The experts interviewed in Phase I agree that the CBU and CKD
regulations were effective. An expert in Phase I says, “Tariffs for CBU and CKD in 1962
were the first effective showcases of the importance of taxation policy.”
(4) FDI (Foreign Direct Investment): This regulation has motivated MNEs to engage in all
kinds of business abroad as the growth of revenues in their home countries slows and they set
up activities in emerging markets such as Thailand to offset this.
(5) Emission Regulation: In 1992 European markets set up emission regulations. As
Thailand moved its focus to car exports, this regulation had to be strictly implemented and
car engines needed to perform better. As a result, local suppliers had to learn how to use
higher-technology machines and tools in the production lines.
(6) Limited car models for assemblers: In 1971, the Ministry of Industry (MOI) planned to
restrict the number of car models for each assembler. In the case of passenger cars, new
assemblers were to be allowed to assemble only one model with an engine size of over
2000 cc. However, this law did not pass.
9.2.2 Incentives
(1) BOI (Board of Investment Promotion): In 1992, the BOI incentive package was
introduced. When installing machines or production lines and registering with the BOI,
companies could be granted a reduction in import taxes for raw materials (BOI, 2011). The
196
experts interviewed mentioned the need for the BOI to support the process of transferring
technologies from foreign companies.
(2) R&D Tax Deduction: The executives in Phase I agreed that the government should
employ tax strategies in order to support R&D projects for the automotive industry.
Investment in R&D activities is costly, and most of the time R&D projects are not successful.
(3) TAI (Thailand Automotive Institute): In 1998, the Thailand Automotive Institute
(TAI), which is responsible for developing the automotive industry, was set up. Executives
from the TAI revealed that it is continuously conducting research and has a master plan for
the automotive industry. It is obvious that the TAI has consulted local suppliers about various
production techniques.
9.2.3 Taxes
(1) Excise Tax: Excise tax rates have supported the growth of cars sales, especially pick-up
trucks. The experts interviewed expressed their wish that the excise tax rate be fixed for the
next five years. Thailand is currently a production base for pick-ups and as there are a high
volume of orders, Thai suppliers can receive high returns by investing in R&D. The experts
revealed that R&D for pick-ups is at a high level.
(2) Customs Tax: This is a tax covering the import and export of products. The Thai
Customs Department sets a lower tax rate for importing auto-parts than it does for cars to
support local suppliers. As a result, these local suppliers can produce certain parts to supply
carmakers and can develop their technical capabilities.
(3) VAT (Value Added Tax): In 1992 (during the liberalisation period), the introduction of
VAT resulted in a decrease of custom taxes from 100% to 42% (see more details in
Chapter 2). The number of MNEs in the automotive industry increased significantly as a
result and Thai suppliers installing new production lines to serve their needs.
It can be seen then that top executives from government departments and automotive
companies agreed that some government policies have an effect on developing technology
capability. Therefore, the government policies listed in Table 9.1 answer the first research
question. They were also chosen to be part of the questionnaire for the Phase II survey.
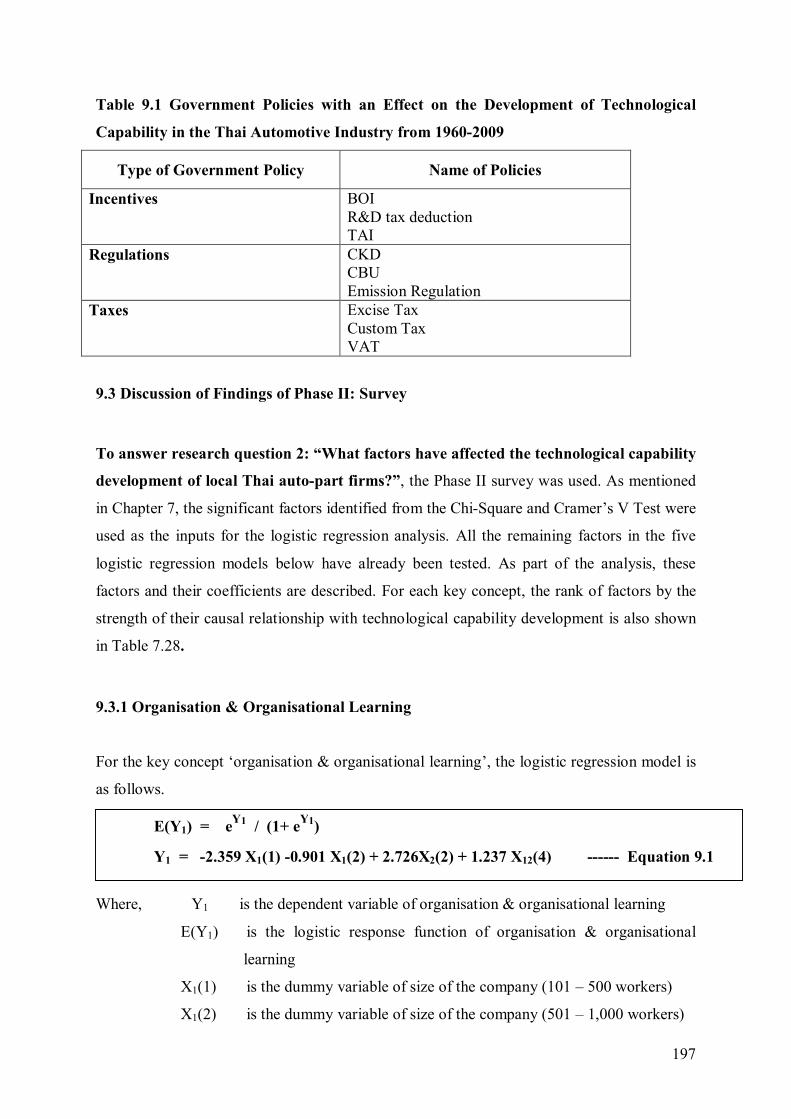
197
Table 9.1 Government Policies with an Effect on the Development of Technological
Capability in the Thai Automotive Industry from 1960-2009
Type of Government Policy Name of Policies
Incentives BOI R&D tax deduction TAI
Regulations CKD CBU Emission Regulation
Taxes Excise Tax Custom Tax VAT
9.3 Discussion of Findings of Phase II: Survey
To answer research question 2: “What factors have affected the technological capability
development of local Thai auto-part firms?”, the Phase II survey was used. As mentioned
in Chapter 7, the significant factors identified from the Chi-Square and Cramer’s V Test were
used as the inputs for the logistic regression analysis. All the remaining factors in the five
logistic regression models below have already been tested. As part of the analysis, these
factors and their coefficients are described. For each key concept, the rank of factors by the
strength of their causal relationship with technological capability development is also shown
in Table 7.28.
9.3.1 Organisation & Organisational Learning
For the key concept ‘organisation & organisational learning’, the logistic regression model is
as follows.
Where, Y1 is the dependent variable of organisation & organisational learning
E(Y1) is the logistic response function of organisation & organisational
learning
X1(1) is the dummy variable of size of the company (101 – 500 workers)
X1(2) is the dummy variable of size of the company (501 – 1,000 workers)
E(Y1) = eY1 / (1+ eY1)
Y1 = -2.359 X1(1) -0.901 X1(2) + 2.726X2(2) + 1.237 X12(4) ------ Equation 9.1
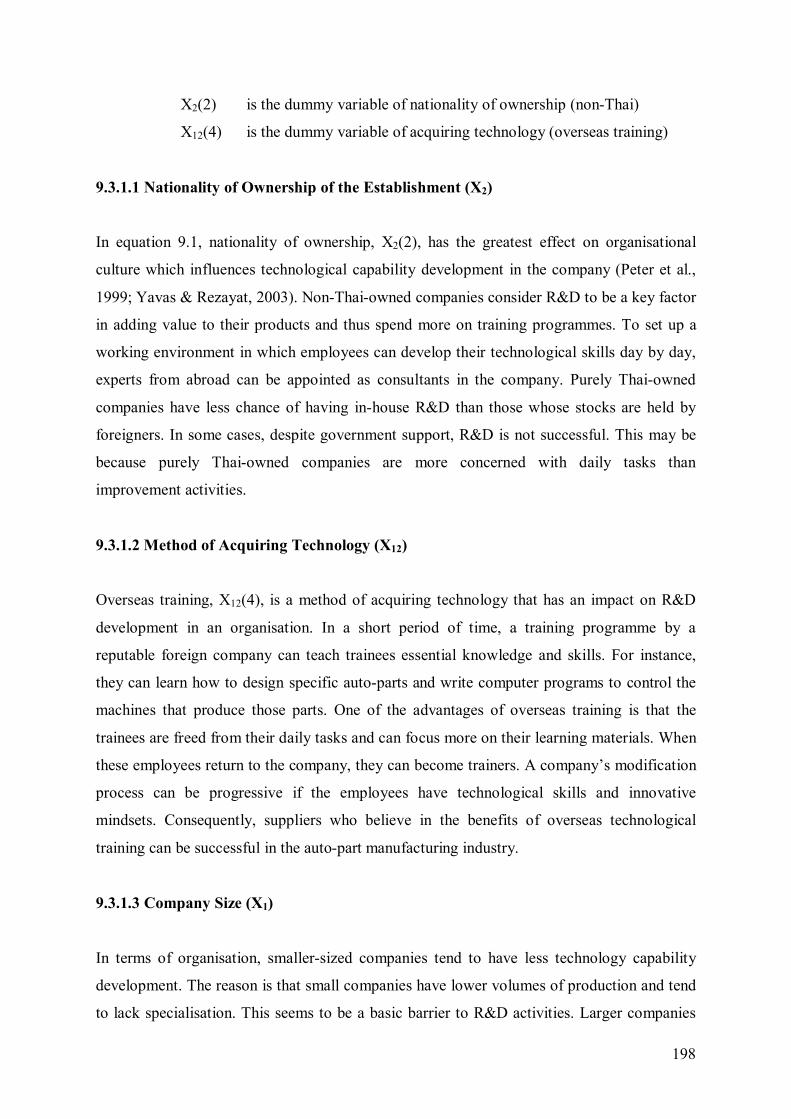
198
X2(2) is the dummy variable of nationality of ownership (non-Thai)
X12(4) is the dummy variable of acquiring technology (overseas training)
9.3.1.1 Nationality of Ownership of the Establishment (X2)
In equation 9.1, nationality of ownership, X2(2), has the greatest effect on organisational
culture which influences technological capability development in the company (Peter et al.,
1999; Yavas & Rezayat, 2003). Non-Thai-owned companies consider R&D to be a key factor
in adding value to their products and thus spend more on training programmes. To set up a
working environment in which employees can develop their technological skills day by day,
experts from abroad can be appointed as consultants in the company. Purely Thai-owned
companies have less chance of having in-house R&D than those whose stocks are held by
foreigners. In some cases, despite government support, R&D is not successful. This may be
because purely Thai-owned companies are more concerned with daily tasks than
improvement activities.
9.3.1.2 Method of Acquiring Technology (X12)
Overseas training, X12(4), is a method of acquiring technology that has an impact on R&D
development in an organisation. In a short period of time, a training programme by a
reputable foreign company can teach trainees essential knowledge and skills. For instance,
they can learn how to design specific auto-parts and write computer programs to control the
machines that produce those parts. One of the advantages of overseas training is that the
trainees are freed from their daily tasks and can focus more on their learning materials. When
these employees return to the company, they can become trainers. A company’s modification
process can be progressive if the employees have technological skills and innovative
mindsets. Consequently, suppliers who believe in the benefits of overseas technological
training can be successful in the auto-part manufacturing industry.
9.3.1.3 Company Size (X1)
In terms of organisation, smaller-sized companies tend to have less technology capability
development. The reason is that small companies have lower volumes of production and tend
to lack specialisation. This seems to be a basic barrier to R&D activities. Larger companies
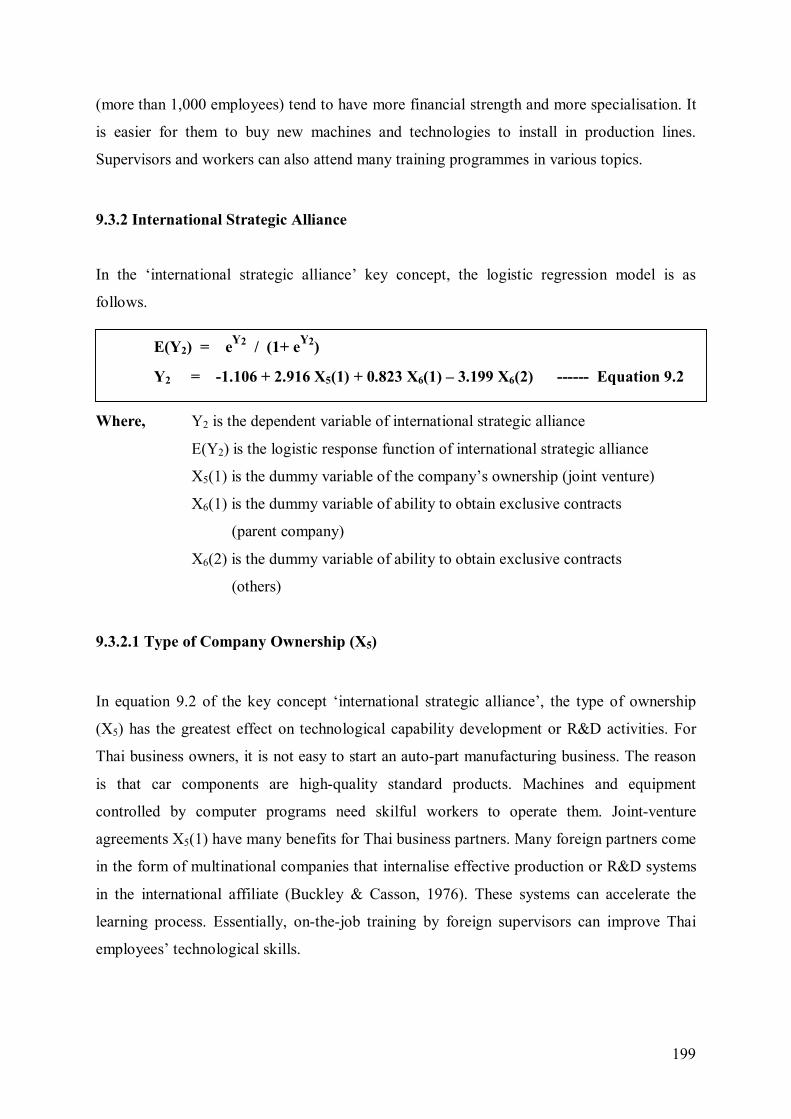
199
(more than 1,000 employees) tend to have more financial strength and more specialisation. It
is easier for them to buy new machines and technologies to install in production lines.
Supervisors and workers can also attend many training programmes in various topics.
9.3.2 International Strategic Alliance
In the ‘international strategic alliance’ key concept, the logistic regression model is as
follows.
Where,
Where, Y2 is the dependent variable of international strategic alliance
E(Y2) is the logistic response function of international strategic alliance
X5(1) is the dummy variable of the company’s ownership (joint venture)
X6(1) is the dummy variable of ability to obtain exclusive contracts
(parent company)
X6(2) is the dummy variable of ability to obtain exclusive contracts
(others)
9.3.2.1 Type of Company Ownership (X5)
In equation 9.2 of the key concept ‘international strategic alliance’, the type of ownership
(X5) has the greatest effect on technological capability development or R&D activities. For
Thai business owners, it is not easy to start an auto-part manufacturing business. The reason
is that car components are high-quality standard products. Machines and equipment
controlled by computer programs need skilful workers to operate them. Joint-venture
agreements X5(1) have many benefits for Thai business partners. Many foreign partners come
in the form of multinational companies that internalise effective production or R&D systems
in the international affiliate (Buckley & Casson, 1976). These systems can accelerate the
learning process. Essentially, on-the-job training by foreign supervisors can improve Thai
employees’ technological skills.
E(Y2) = eY2 / (1+ eY2)
Y2 = -1.106 + 2.916 X5(1) + 0.823 X6(1) – 3.199 X6(2) ------ Equation 9.2
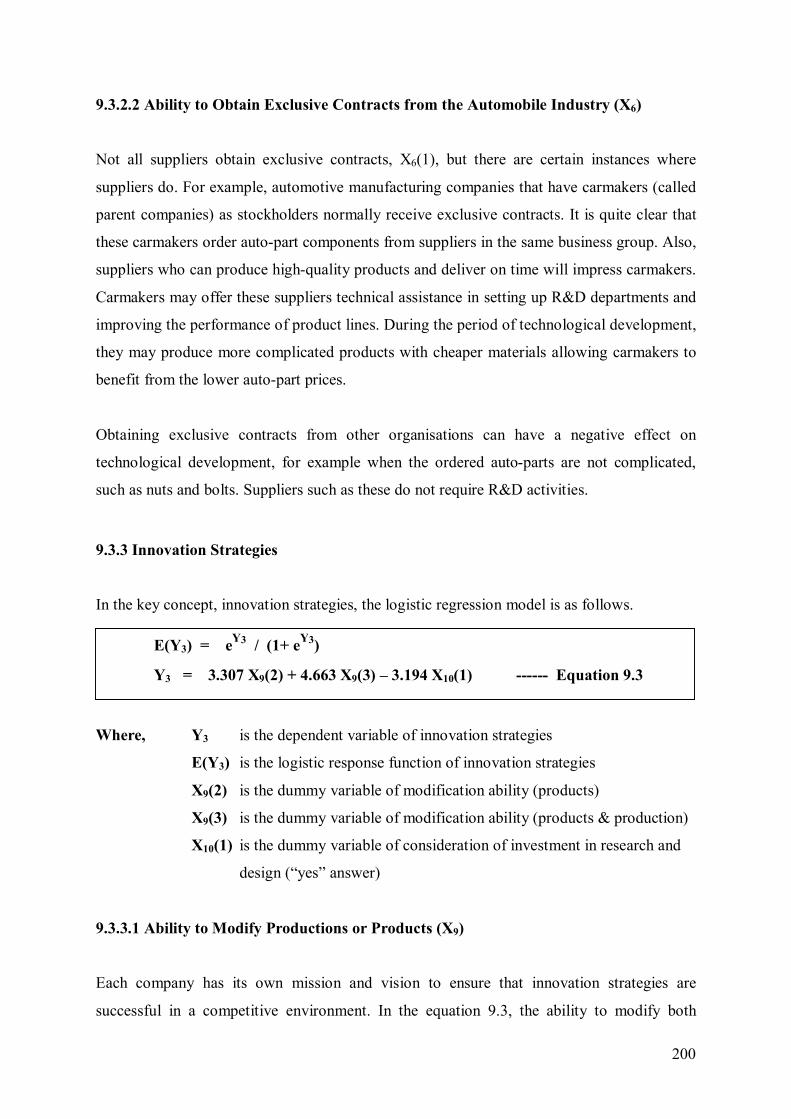
200
9.3.2.2 Ability to Obtain Exclusive Contracts from the Automobile Industry (X6)
Not all suppliers obtain exclusive contracts, X6(1), but there are certain instances where
suppliers do. For example, automotive manufacturing companies that have carmakers (called
parent companies) as stockholders normally receive exclusive contracts. It is quite clear that
these carmakers order auto-part components from suppliers in the same business group. Also,
suppliers who can produce high-quality products and deliver on time will impress carmakers.
Carmakers may offer these suppliers technical assistance in setting up R&D departments and
improving the performance of product lines. During the period of technological development,
they may produce more complicated products with cheaper materials allowing carmakers to
benefit from the lower auto-part prices.
Obtaining exclusive contracts from other organisations can have a negative effect on
technological development, for example when the ordered auto-parts are not complicated,
such as nuts and bolts. Suppliers such as these do not require R&D activities.
9.3.3 Innovation Strategies
In the key concept, innovation strategies, the logistic regression model is as follows.
Where, Y3 is the dependent variable of innovation strategies
E(Y3) is the logistic response function of innovation strategies
X9(2) is the dummy variable of modification ability (products)
X9(3) is the dummy variable of modification ability (products & production)
X10(1) is the dummy variable of consideration of investment in research and
design (“yes” answer)
9.3.3.1 Ability to Modify Productions or Products (X9)
Each company has its own mission and vision to ensure that innovation strategies are
successful in a competitive environment. In the equation 9.3, the ability to modify both
E(Y3) = eY3 / (1+ eY3)
Y3 = 3.307 X9(2) + 4.663 X9(3) – 3.194 X10(1) ------ Equation 9.3
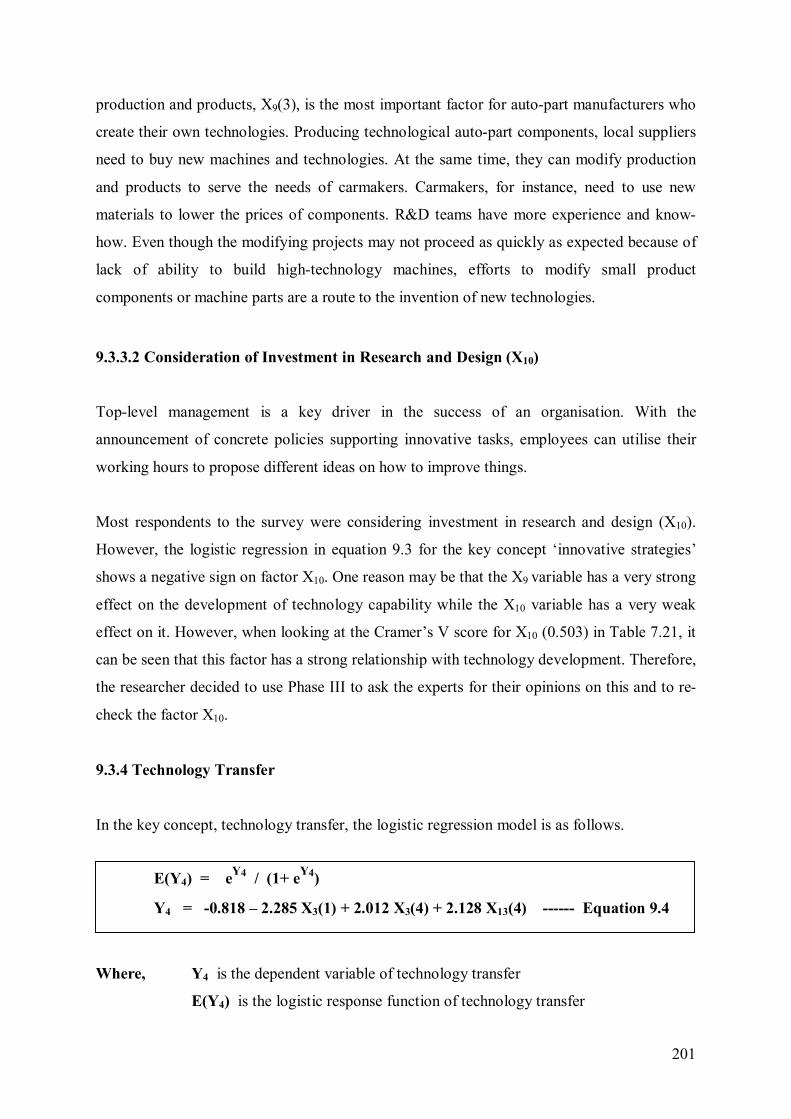
201
production and products, X9(3), is the most important factor for auto-part manufacturers who
create their own technologies. Producing technological auto-part components, local suppliers
need to buy new machines and technologies. At the same time, they can modify production
and products to serve the needs of carmakers. Carmakers, for instance, need to use new
materials to lower the prices of components. R&D teams have more experience and know-
how. Even though the modifying projects may not proceed as quickly as expected because of
lack of ability to build high-technology machines, efforts to modify small product
components or machine parts are a route to the invention of new technologies.
9.3.3.2 Consideration of Investment in Research and Design (X10)
Top-level management is a key driver in the success of an organisation. With the
announcement of concrete policies supporting innovative tasks, employees can utilise their
working hours to propose different ideas on how to improve things.
Most respondents to the survey were considering investment in research and design (X10).
However, the logistic regression in equation 9.3 for the key concept ‘innovative strategies’
shows a negative sign on factor X10. One reason may be that the X9 variable has a very strong
effect on the development of technology capability while the X10 variable has a very weak
effect on it. However, when looking at the Cramer’s V score for X10 (0.503) in Table 7.21, it
can be seen that this factor has a strong relationship with technology development. Therefore,
the researcher decided to use Phase III to ask the experts for their opinions on this and to re-
check the factor X10.
9.3.4 Technology Transfer
In the key concept, technology transfer, the logistic regression model is as follows.
Where,
Where, Y4 is the dependent variable of technology transfer
E(Y4) is the logistic response function of technology transfer
E(Y4) = eY4 / (1+ eY4)
Y4 = -0.818 – 2.285 X3(1) + 2.012 X3(4) + 2.128 X13(4) ------ Equation 9.4
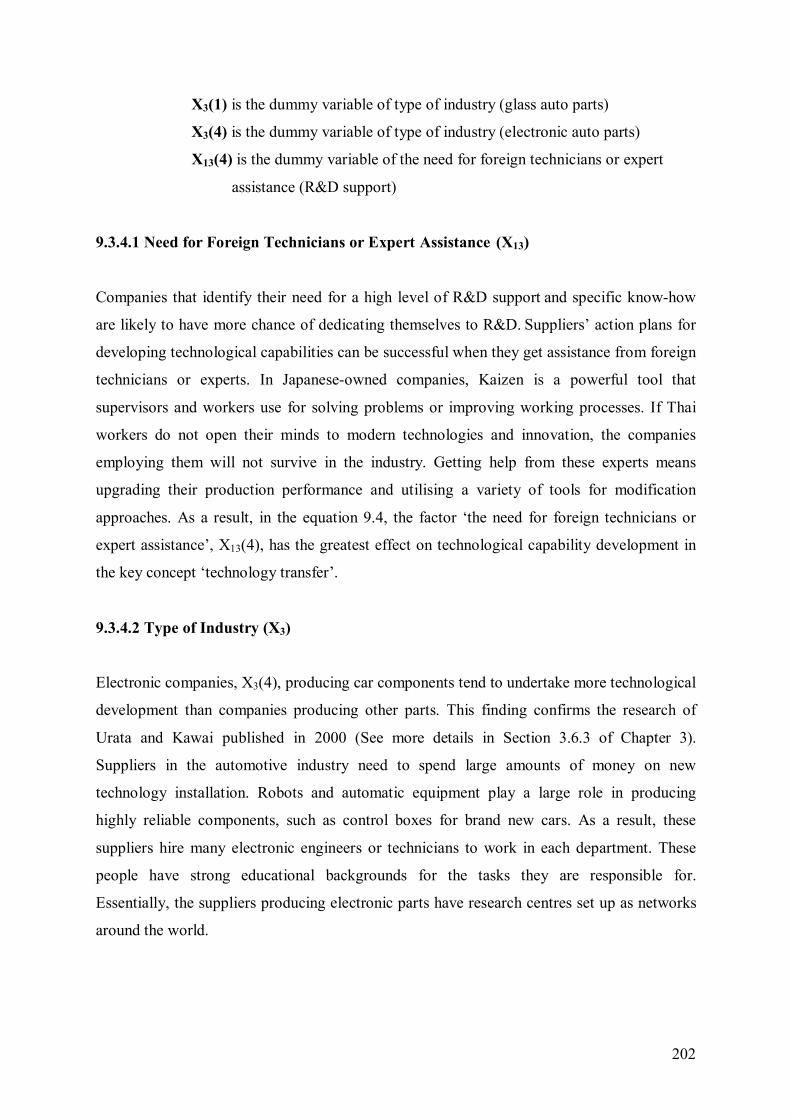
202
X3(1) is the dummy variable of type of industry (glass auto parts)
X3(4) is the dummy variable of type of industry (electronic auto parts)
X13(4) is the dummy variable of the need for foreign technicians or expert
assistance (R&D support)
9.3.4.1 Need for Foreign Technicians or Expert Assistance (X13)
Companies that identify their need for a high level of R&D support and specific know-how
are likely to have more chance of dedicating themselves to R&D. Suppliers’ action plans for
developing technological capabilities can be successful when they get assistance from foreign
technicians or experts. In Japanese-owned companies, Kaizen is a powerful tool that
supervisors and workers use for solving problems or improving working processes. If Thai
workers do not open their minds to modern technologies and innovation, the companies
employing them will not survive in the industry. Getting help from these experts means
upgrading their production performance and utilising a variety of tools for modification
approaches. As a result, in the equation 9.4, the factor ‘the need for foreign technicians or
expert assistance’, X13(4), has the greatest effect on technological capability development in
the key concept ‘technology transfer’.
9.3.4.2 Type of Industry (X3)
Electronic companies, X3(4), producing car components tend to undertake more technological
development than companies producing other parts. This finding confirms the research of
Urata and Kawai published in 2000 (See more details in Section 3.6.3 of Chapter 3).
Suppliers in the automotive industry need to spend large amounts of money on new
technology installation. Robots and automatic equipment play a large role in producing
highly reliable components, such as control boxes for brand new cars. As a result, these
suppliers hire many electronic engineers or technicians to work in each department. These
people have strong educational backgrounds for the tasks they are responsible for.
Essentially, the suppliers producing electronic parts have research centres set up as networks
around the world.
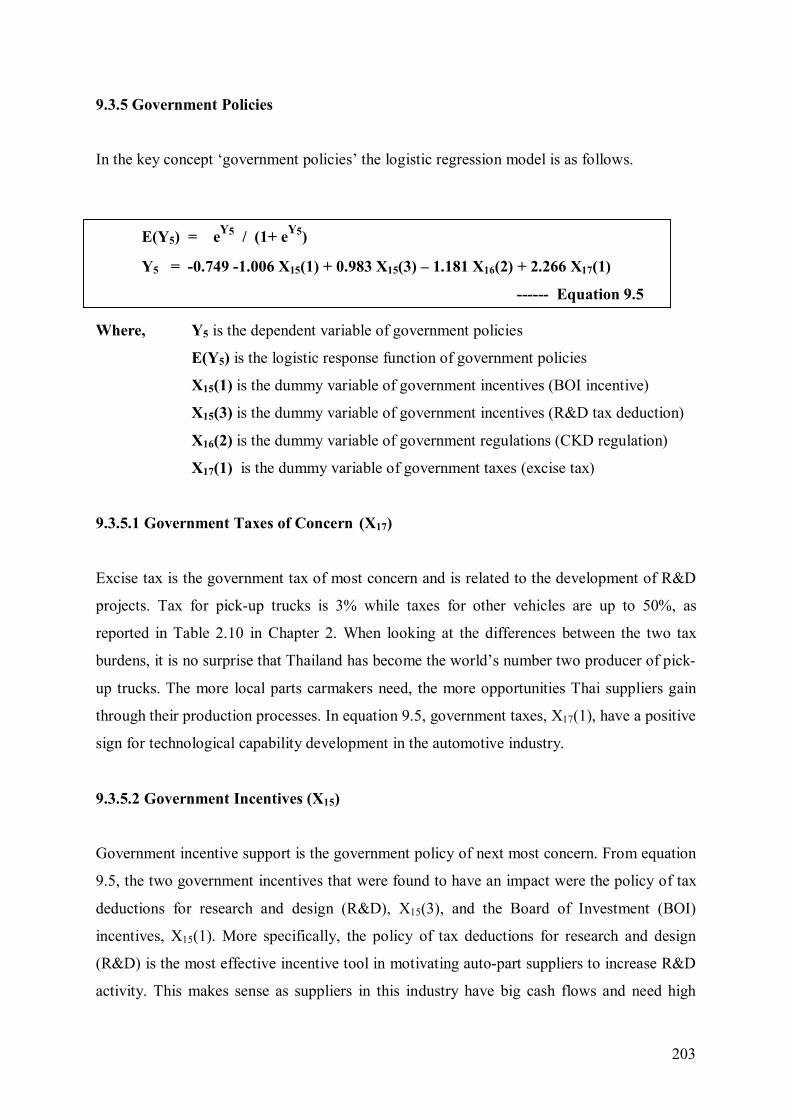
203
9.3.5 Government Policies
In the key concept ‘government policies’ the logistic regression model is as follows.
Where, Y5 is the dependent variable of government policies
E(Y5) is the logistic response function of government policies
X15(1) is the dummy variable of government incentives (BOI incentive)
X15(3) is the dummy variable of government incentives (R&D tax deduction)
X16(2) is the dummy variable of government regulations (CKD regulation)
X17(1) is the dummy variable of government taxes (excise tax)
9.3.5.1 Government Taxes of Concern (X17)
Excise tax is the government tax of most concern and is related to the development of R&D
projects. Tax for pick-up trucks is 3% while taxes for other vehicles are up to 50%, as
reported in Table 2.10 in Chapter 2. When looking at the differences between the two tax
burdens, it is no surprise that Thailand has become the world’s number two producer of pick-
up trucks. The more local parts carmakers need, the more opportunities Thai suppliers gain
through their production processes. In equation 9.5, government taxes, X17(1), have a positive
sign for technological capability development in the automotive industry.
9.3.5.2 Government Incentives (X15)
Government incentive support is the government policy of next most concern. From equation
9.5, the two government incentives that were found to have an impact were the policy of tax
deductions for research and design (R&D), X15(3), and the Board of Investment (BOI)
incentives, X15(1). More specifically, the policy of tax deductions for research and design
(R&D) is the most effective incentive tool in motivating auto-part suppliers to increase R&D
activity. This makes sense as suppliers in this industry have big cash flows and need high
E(Y5) = eY5 / (1+ eY5)
Y5 = -0.749 -1.006 X15(1) + 0.983 X15(3) – 1.181 X16(2) + 2.266 X17(1)
------ Equation 9.5
204
profits to expand production plants and to install new machines. R&D activities are therefore
necessary to provide these profits and incentives are effective mechanisms supporting them.
Surprisingly, the Board of Investment (BOI) incentive was found to have a negative impact
on technology development. Auto parts producers that registered in the BOI programme are
voided from most tax burden. BOI gives a tax benefit, but it was introduced a long time ago
and suppliers are no longer so enthusiastic about this incentive.
9.3.5.3 Government Regulations of Concern (X16)
CKD regulations, X16(2), encourage carmakers to import components and procure local parts
instead of importing whole cars as mentioned in Phase I. With current advances in car design,
suppliers who can sell components to carmakers need to constantly improve the performance
of products and production processes. From the evidence found in this study though, it
appears that the factor ‘government regulations’ has had an adverse impact upon
development in technological capabilities. This may be for the same reason that caused the
weakened impact of the BOI incentive. CKD regulations were also issued a long time ago.
Suppliers who are investing in R&D activities or technological capability development may
be willing to support new tax incentives or revised regulations.
The discussion of all factors in Section 9.3, shows that even though the research findings of
Phase II have already confirmed that there are causal relationships between the dependent
and independent variables (factors), the findings in Phase II can be utilised more effectively if
viewed in the light of the in-depth interviews in phase III. The main objective of Phase III is
to allow experts to discuss the reasonableness of the findings of Phase II. In addition, Phase
III aims to uncover new issues that were not uncovered in Phases I and II.
9.4 Discussion of the Findings of the Phase III Semi-Structured In-depth Interviews
Phase III involved semi-structured face-to-face in-depth interviews. Ten leading government
policy makers and automotive firm managers were recruited. The objective of this phase was
to confirm the findings of Phase II and uncover new issues in Phase III.
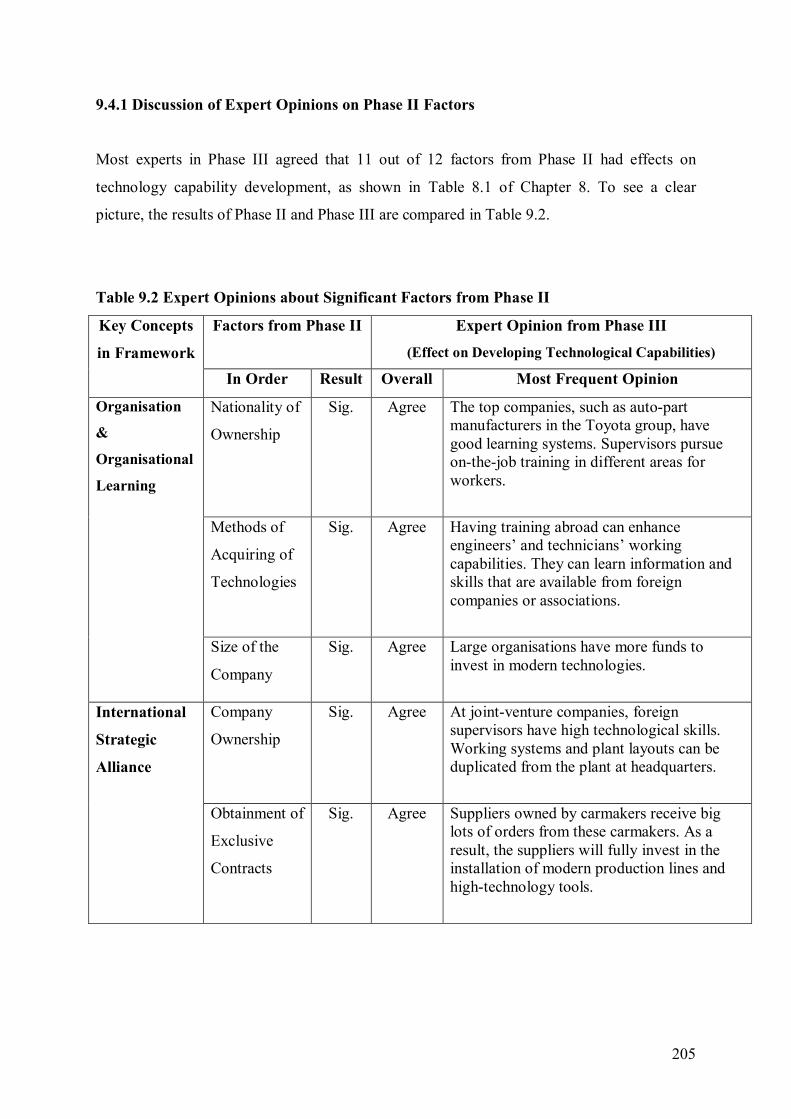
205
9.4.1 Discussion of Expert Opinions on Phase II Factors
Most experts in Phase III agreed that 11 out of 12 factors from Phase II had effects on
technology capability development, as shown in Table 8.1 of Chapter 8. To see a clear
picture, the results of Phase II and Phase III are compared in Table 9.2.
Table 9.2 Expert Opinions about Significant Factors from Phase II
Key Concepts
in Framework
Factors from Phase II Expert Opinion from Phase III
(Effect on Developing Technological Capabilities)
In Order Result Overall Most Frequent Opinion
Organisation
&
Organisational
Learning
Nationality of
Ownership
Sig. Agree The top companies, such as auto-part manufacturers in the Toyota group, have good learning systems. Supervisors pursue on-the-job training in different areas for workers.
Methods of
Acquiring of
Technologies
Sig. Agree Having training abroad can enhance engineers’ and technicians’ working capabilities. They can learn information and skills that are available from foreign companies or associations.
Size of the
Company
Sig. Agree Large organisations have more funds to invest in modern technologies.
International
Strategic
Alliance
Company
Ownership
Sig. Agree At joint-venture companies, foreign supervisors have high technological skills. Working systems and plant layouts can be duplicated from the plant at headquarters.
Obtainment of
Exclusive
Contracts
Sig. Agree Suppliers owned by carmakers receive big lots of orders from these carmakers. As a result, the suppliers will fully invest in the installation of modern production lines and high-technology tools.
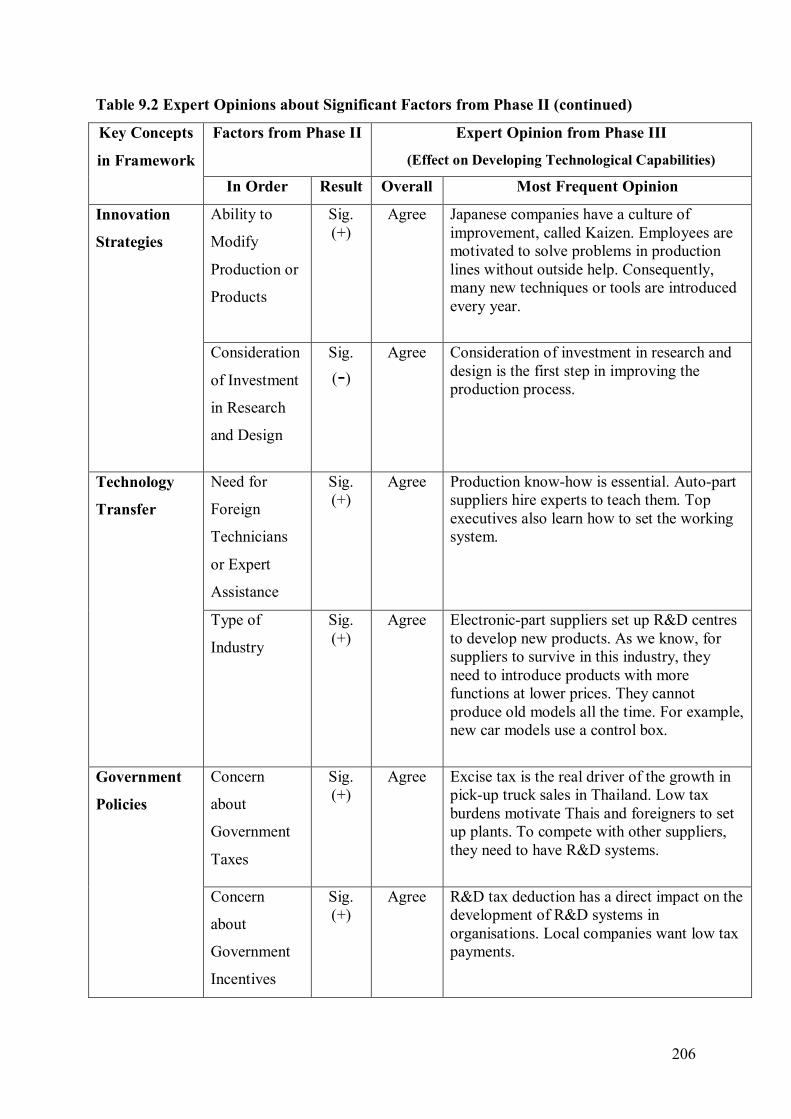
206
Table 9.2 Expert Opinions about Significant Factors from Phase II (continued)
Key Concepts
in Framework
Factors from Phase II Expert Opinion from Phase III
(Effect on Developing Technological Capabilities)
In Order Result Overall Most Frequent Opinion
Innovation
Strategies
Ability to
Modify
Production or
Products
Sig. (+)
Agree Japanese companies have a culture of improvement, called Kaizen. Employees are motivated to solve problems in production lines without outside help. Consequently, many new techniques or tools are introduced every year.
Consideration
of Investment
in Research
and Design
Sig. (-)
Agree Consideration of investment in research and design is the first step in improving the production process.
Technology
Transfer
Need for
Foreign
Technicians
or Expert
Assistance
Sig. (+)
Agree Production know-how is essential. Auto-part suppliers hire experts to teach them. Top executives also learn how to set the working system.
Type of
Industry
Sig. (+)
Agree Electronic-part suppliers set up R&D centres to develop new products. As we know, for suppliers to survive in this industry, they need to introduce products with more functions at lower prices. They cannot produce old models all the time. For example, new car models use a control box.
Government
Policies
Concern
about
Government
Taxes
Sig. (+)
Agree Excise tax is the real driver of the growth in pick-up truck sales in Thailand. Low tax burdens motivate Thais and foreigners to set up plants. To compete with other suppliers, they need to have R&D systems.
Concern
about
Government
Incentives
Sig. (+)
Agree R&D tax deduction has a direct impact on the development of R&D systems in organisations. Local companies want low tax payments.
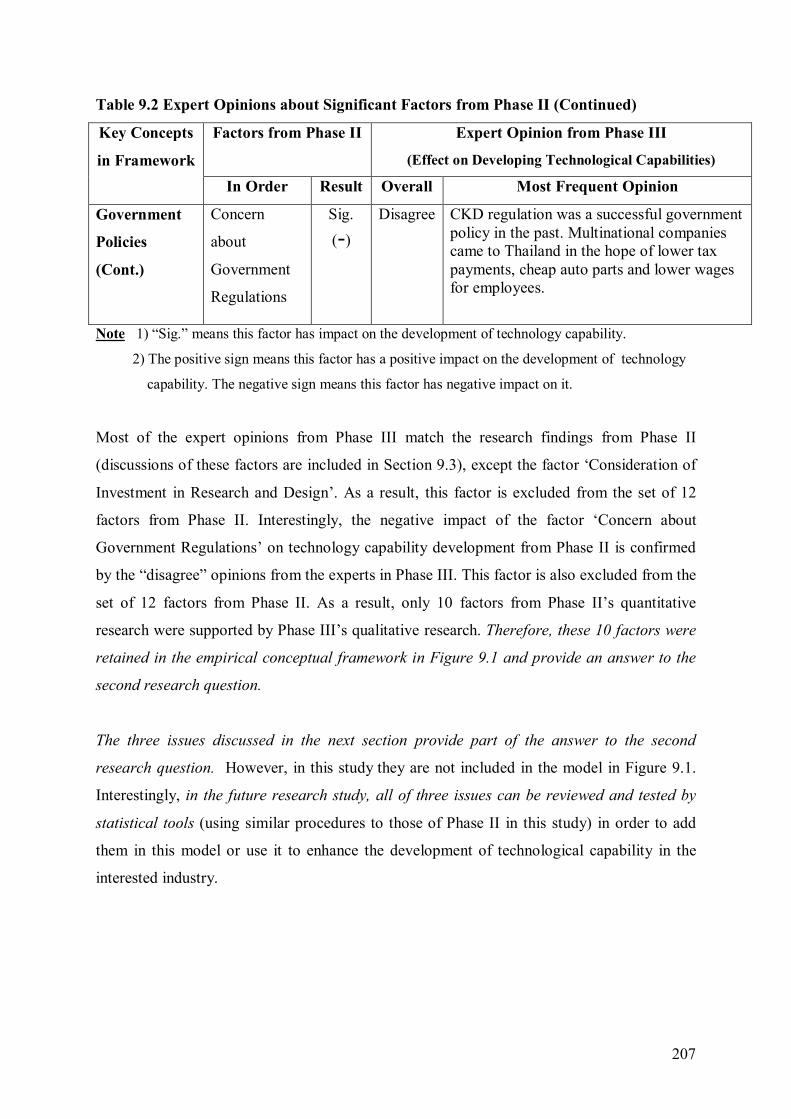
207
Table 9.2 Expert Opinions about Significant Factors from Phase II (Continued)
Key Concepts
in Framework
Factors from Phase II Expert Opinion from Phase III
(Effect on Developing Technological Capabilities)
In Order Result Overall Most Frequent Opinion
Government
Policies
(Cont.)
Concern
about
Government
Regulations
Sig. (-)
Disagree CKD regulation was a successful government policy in the past. Multinational companies came to Thailand in the hope of lower tax payments, cheap auto parts and lower wages for employees.
Note 1) “Sig.” means this factor has impact on the development of technology capability.
2) The positive sign means this factor has a positive impact on the development of technology
capability. The negative sign means this factor has negative impact on it.
Most of the expert opinions from Phase III match the research findings from Phase II
(discussions of these factors are included in Section 9.3), except the factor ‘Consideration of
Investment in Research and Design’. As a result, this factor is excluded from the set of 12
factors from Phase II. Interestingly, the negative impact of the factor ‘Concern about
Government Regulations’ on technology capability development from Phase II is confirmed
by the “disagree” opinions from the experts in Phase III. This factor is also excluded from the
set of 12 factors from Phase II. As a result, only 10 factors from Phase II’s quantitative
research were supported by Phase III’s qualitative research. Therefore, these 10 factors were
retained in the empirical conceptual framework in Figure 9.1 and provide an answer to the
second research question.
The three issues discussed in the next section provide part of the answer to the second
research question. However, in this study they are not included in the model in Figure 9.1.
Interestingly, in the future research study, all of three issues can be reviewed and tested by
statistical tools (using similar procedures to those of Phase II in this study) in order to add
them in this model or use it to enhance the development of technological capability in the
interested industry.
208
9.4.2 Three Issues Uncovered by Phase III
(1) Clustering of Automobile Suppliers
The experts in the Phase III interviews agreed that clustering in automotive industries has an
impact on the development of technological capability. The reasons are as follows:
- After the financial crisis in the 1997, many MNEs (carmakers) invested in plants in
Thailand. The automobile cluster emerged. Clustering (or networks) in the automotive
industry involves collaboration among carmakers and 1st, 2nd and 3rd tier suppliers. The
rationale for clustering in Thailand, as in other developing countries, is to lower production
costs and improve product quality. Obviously suppliers in the cluster need to learn about new
technologies. The entry of reputed auto-part manufacturers into Thailand has strengthened the
overall performance of carmakers’ clusters.
- Government policies supported the development of both the cluster and local businesses.
At the localisation stages, LCR and high import taxes were implemented. One way to deal
with this was that the carmakers assisted suppliers in the cluster so they would have both
production and technological skills. The experts in Phase III agreed that Thai suppliers
classified as the 2nd and 3rd tiers, in particular, needed to develop modification skills to
cooperate with 1st tier suppliers. During the liberalisation stage under AFTA, LCR was lifted.
Consequently, carmakers from Japan, Europe and the U.S. expanded their operations in
Thailand. .
- Clusters in Thailand still lack an effective R&D system because carmakers still focus on
production outcomes. 2nd and 3rd tier suppliers that produce unsophisticated parts do not
receive technology transfer from the 1st tier. Carmakers that can monitor and support their
suppliers in their R&D work will benefit from high-quality products, and local suppliers that
can survive should be proactive at the higher level of technological skills.
(2) Technology Transfer from MNEs to Local Suppliers
The experts in Phase III’s in-depth interviews agreed that technology transfer between MNEs
(carmakers) and local suppliers is the most important factor in the development of
technological capability because:
209
1) It is hard for these suppliers to create technologies themselves as they have no basic
know-how. Affiliate suppliers of MNEs can achieve higher levels of technology transfer than
other suppliers. This can be referred to as “intra transfer”.
2) Japanese carmakers implement a Just-In-Time system but this system cannot be
successful if suppliers cannot meet delivery schedules. Carmakers need to transfer
technological and production know-how to suppliers. “Inter-transfer” can be effective for this
approach.
3) Western carmakers force their suppliers to apply a quality system, such as QS9000 or
APQP. The experts explained that these carmakers want to increase their negotiation power.
The goal of these quality tools is to ensure that suppliers continuously improve, especially in
the quality of their products. To receive certification for these systems, suppliers need to
access new technologies and hire experts to train them.
4) The diffusion of technologies tends to be faster via 1st tier suppliers. Besides having
product development and process engineering, the experts suggested that 1st tier suppliers
should monitor, evaluate, and train those from the 2nd and 3rd tier. Therefore, to export auto
parts, carmakers need to transfer technology to 1st tier suppliers in the hope that they will
supply high-quality products to the assembly lines.
(3) The Pick-up Truck Phenomenon
The experts interviewed in Phase III agreed that the growth of the pick-up truck industry aids
technological capability development.
- According to these experts, the quality of pick-up parts in Thailand is better than it is in
China and Taiwan. The reason is that Thailand is the world’s number one producer of one-ton
pick-up trucks (Khenkum, 2007). Almost all parts can be produced locally, and technological
capabilities are at an advanced level. Suppliers producing the same kind of parts year by year
have the opportunity to improve technological skills. When carmakers introduce new pick-up
models to the market, suppliers, especially 1st tier suppliers, need to set up new machines and
learn how to use them.
- The excise tax for pick-up trucks is only 3 percent of the manufacturing cost compared to
30-50 percent for passenger cars (see Table 2.10 in Chapter 2). The purpose of setting a
lower tax rate for pick-up trucks is to serve customers in rural areas who need multi-purpose
cars. Consequently, pick-up assemblers and their suppliers need to collaborate in R&D
programmes to produce parts that can handle hard conditions on the roads.
210
9.5 Research Findings of this Study Compared with the Literature Review
Many researchers have studied technological capability development and its related factors.
In Table 9.3 (modified from Table 3.2) the ‘categories’ or main factors related to
technological capability development are pooled from other researchers’ findings. ‘Key
concepts’ in this study were modified from these categories to be commensurate with the
nature of the automotive industry. The research findings in Section 9.3 revealed five key
concepts (Organisation & Organisational Learning, International Strategic Alliance,
Innovation Strategies, Technology Transfer, and Government Policies) as having causal
relationships with technological capability development. These findings are compared with
the literature in the following discussion.
Along with others who studied ‘technology transfer’ as shown in Table 9.3, Maidique and
Zirger (1984) agreed with the importance of business practices that support technology
acquisition in the creation of new products. Their findings are confirmed by the findings of
other researchers as outlined in the table below. Phase II of this study also confirms this point
as it found the need for foreign technicians or expert assistance to be a priority in the
enhancement of technological capability development.
In the area of ‘innovation strategies’, many of the researchers listed confirmed that innovation
is key to business success. Innovation projects rely on technological and production skills,
and as a result the company launching these projects needs to develop technological
capabilities (Stuart & Abetti, 1987). In addition, Cooper and Kleinschmidt (1987) suggested
that innovative product concepts impact on the process of new technological product
introduction. This is consistent with this study’s finding that the ability to modify productions
or products is the most important factor affecting technological development with regard to a
firm’s innovation strategies.
When considering ‘organisational learning’, organisations should focus on collecting
knowledge about technologies and implementing them in production processes (Bell &
Pavitt, 1995). The research findings regarding organisational learning in this thesis reveal that
its related factors, namely nationality of ownership and method of acquiring technology, are
the main causes of the development of technological capabilities in organisations. These
findings confirm those of Bell and Pavitt and others in the literature as listed below.
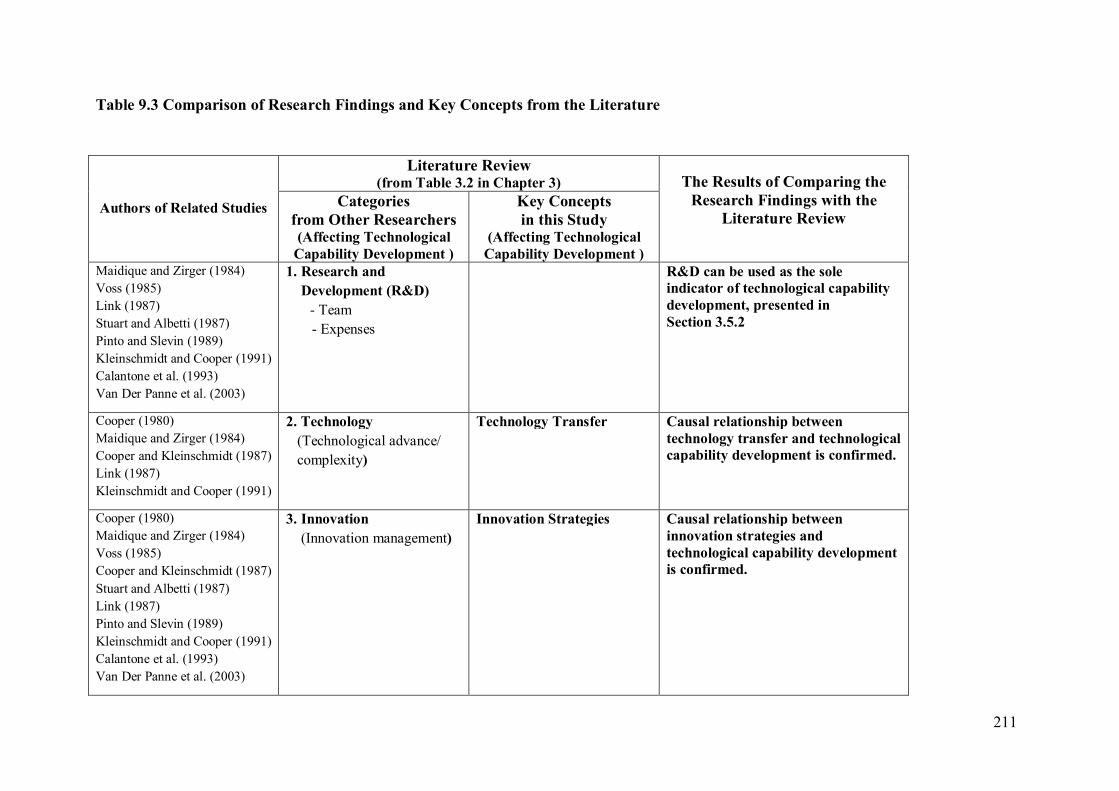
274
Table 9.3 Comparison of Research Findings and Key Concepts from the Literature
Authors of Related Studies
Literature Review (from Table 3.2 in Chapter 3) The Results of Comparing the
Research Findings with the Literature Review
Categories from Other Researchers (Affecting Technological
Capability Development )
Key Concepts in this Study
(Affecting Technological Capability Development )
Maidique and Zirger (1984) Voss (1985) Link (1987) Stuart and Albetti (1987) Pinto and Slevin (1989) Kleinschmidt and Cooper (1991) Calantone et al. (1993) Van Der Panne et al. (2003)
1. Research and Development (R&D)
- Team - Expenses
R&D can be used as the sole indicator of technological capability development, presented in Section 3.5.2
Cooper (1980) Maidique and Zirger (1984) Cooper and Kleinschmidt (1987) Link (1987) Kleinschmidt and Cooper (1991)
2. Technology (Technological advance/ complexity)
Technology Transfer Causal relationship between technology transfer and technological capability development is confirmed.
Cooper (1980) Maidique and Zirger (1984) Voss (1985) Cooper and Kleinschmidt (1987) Stuart and Albetti (1987) Link (1987) Pinto and Slevin (1989) Kleinschmidt and Cooper (1991) Calantone et al. (1993) Van Der Panne et al. (2003)
3. Innovation (Innovation management)
Innovation Strategies Causal relationship between innovation strategies and technological capability development is confirmed.
211
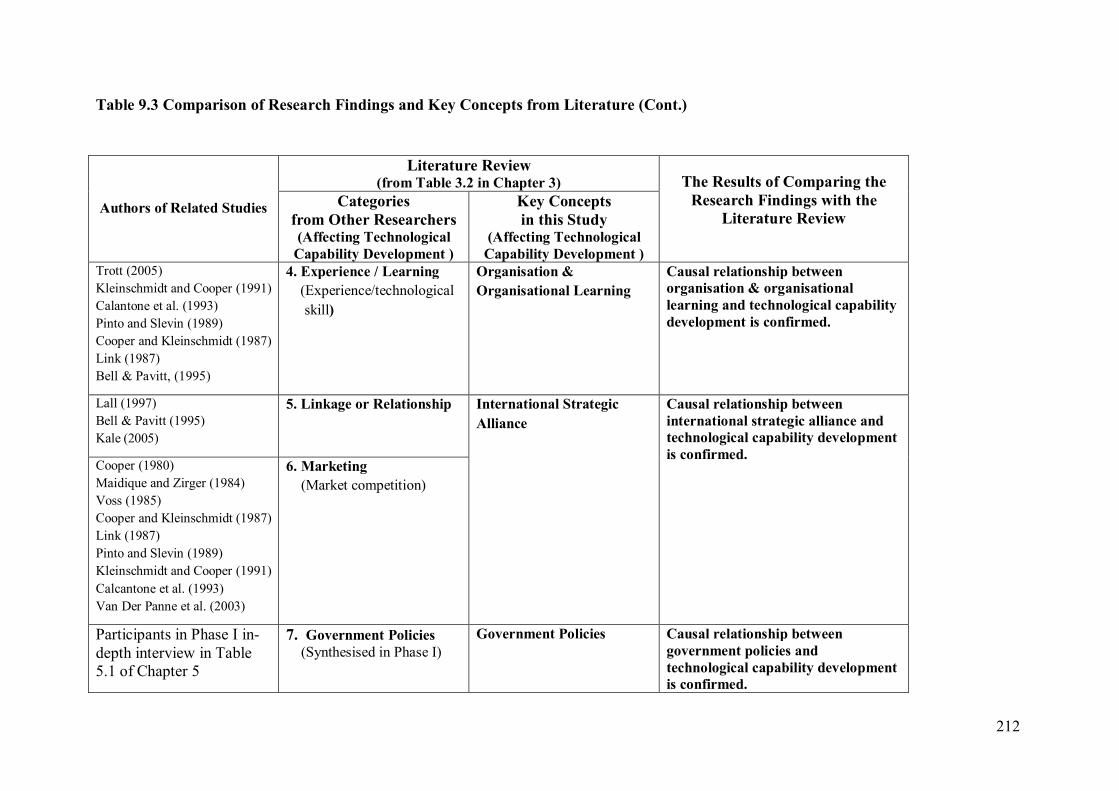
275
Table 9.3 Comparison of Research Findings and Key Concepts from Literature (Cont.)
Authors of Related Studies
Literature Review (from Table 3.2 in Chapter 3) The Results of Comparing the
Research Findings with the Literature Review
Categories from Other Researchers (Affecting Technological
Capability Development )
Key Concepts in this Study
(Affecting Technological Capability Development )
Trott (2005) Kleinschmidt and Cooper (1991) Calantone et al. (1993) Pinto and Slevin (1989) Cooper and Kleinschmidt (1987) Link (1987) Bell & Pavitt, (1995)
4. Experience / Learning (Experience/technological skill)
Organisation & Organisational Learning
Causal relationship between organisation & organisational learning and technological capability development is confirmed.
Lall (1997) Bell & Pavitt (1995) Kale (2005)
5. Linkage or Relationship International Strategic Alliance
Causal relationship between international strategic alliance and technological capability development is confirmed. Cooper (1980)
Maidique and Zirger (1984) Voss (1985) Cooper and Kleinschmidt (1987) Link (1987) Pinto and Slevin (1989) Kleinschmidt and Cooper (1991) Calcantone et al. (1993) Van Der Panne et al. (2003)
6. Marketing (Market competition)
Participants in Phase I in-depth interview in Table 5.1 of Chapter 5
7. Government Policies (Synthesised in Phase I)
Government Policies Causal relationship between government policies and technological capability development is confirmed.
212
213
In past decades, investors from developed countries have created partnerships, such as joint
ventures with local companies in developing countries. Lall (1997), one of the researchers
who has examined ‘international strategic alliance’, and who is listed in Table 9.3, contended
that investment from these developed countries offers local industries the chance to access
new technologies and various skills, and as a result can improve their capabilities in the long
run. Interestingly, this study arrived at the same conclusion, that the type of company
ownership, especially the creation of joint ventures with foreign companies, has a strong
effect on technological capability development.
Regarding ‘government policies’, the Automotive Industry Specialist from Phase I
mentioned, “Japanese assemblers developed their own supplied networks and gave technical
assistance to local auto-part firms. This represented the first and most important stage in the
development of supporting industries.” The research findings of this study confirmed this
statement. As government taxes and incentives have supported foreign companies in
investing in Thailand, it is clear that these policies have helped technological capability
development.
The research findings obtained from this study therefore confirm the findings from previous
studies of other researchers (as presented on the list of Table 9.3) concerning the effects of
all the key concepts mentioned above on technological capability development.
9.6 Developing the Empirical Conceptual Framework and its Implementation
After the literature review process and Phase I’s in-depth elite interview, the conceptual
framework comprising of five key concepts (organisation & organisational learning,
international strategic alliance, innovation strategies, technology transfer and government
policies) was defined. In the experts’ view, government policies are powerful tools that have
a crucial impact on technological development and the launching of R&D activities for Thai
auto-part manufacturers.
The conceptual framework with its 18 independent variables (factors) could still not be
verified because it had to be tested first with statistical techniques in Phase II to insure its fit
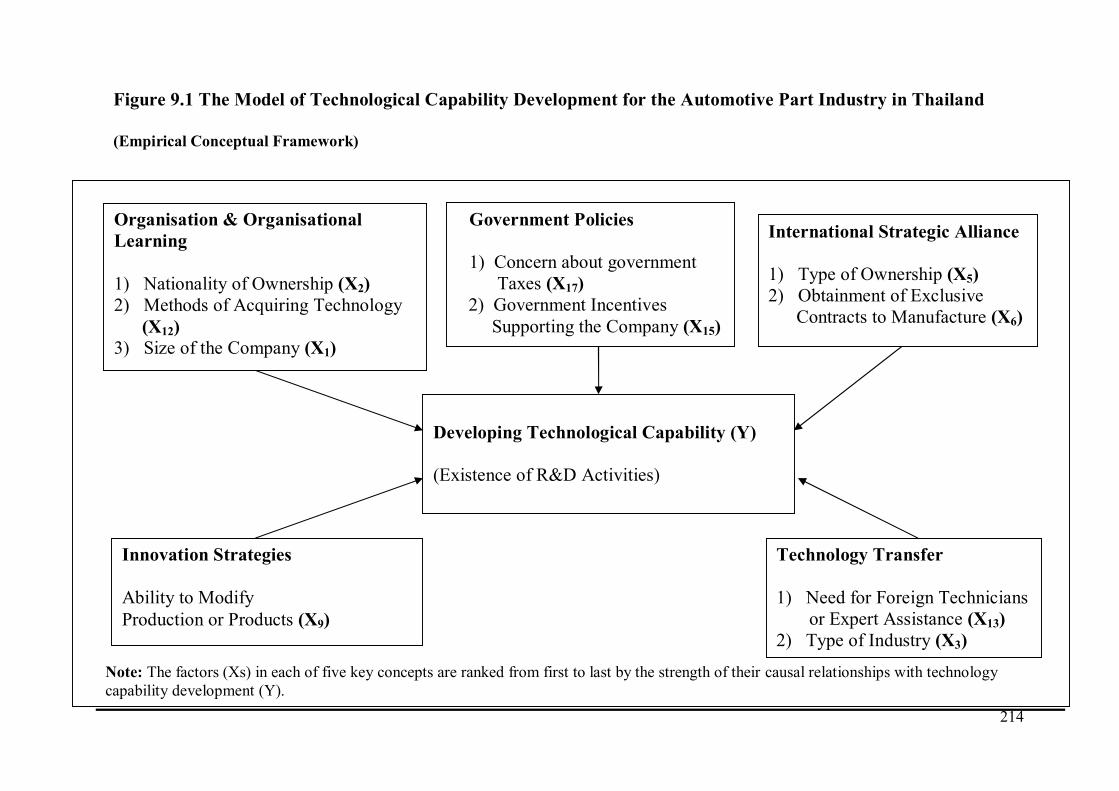
214
Government Policies 1) Concern about government Taxes (X17)
2) Government Incentives Supporting the Company (X15)
Organisation & Organisational Learning 1) Nationality of Ownership (X2) 2) Methods of Acquiring Technology (X12) 3) Size of the Company (X1)
Developing Technological Capability (Y) (Existence of R&D Activities)
International Strategic Alliance 1) Type of Ownership (X5) 2) Obtainment of Exclusive Contracts to Manufacture (X6)
Innovation Strategies Ability to Modify Production or Products (X9)
Technology Transfer 1) Need for Foreign Technicians or Expert Assistance (X13) 2) Type of Industry (X3) Note: The factors (Xs) in each of five key concepts are ranked from first to last by the strength of their causal relationships with technology
capability development (Y).
Figure 9.1 The Model of Technological Capability Development for the Automotive Part Industry in Thailand (Empirical Conceptual Framework)
215
with the Thai auto-part industry. These factors were expected to have a causal relationship
with the dependent variable (technological capability development or the existence of R&D
activities). All the data were tested using the SPSS program. The final statistical outputs are
five models of logistic regression for each key concept in the conceptual framework. In the
logistic regression model, significant variables (factors) and their regression coefficients were
presented (as mentioned earlier in this chapter). It was confirmed that 10 out of 18 variables
had a significant positive causal relationship with technological development. As a result, the
conceptual framework was revised and named the empirical conceptual framework in Figure
9.1. In Phase III (Chapter 8), the experts attending in-depth interviews gave their opinions on
the aforementioned factors. Most of them agreed that these factors were important and could
support the development of technological capabilities in the Thai auto-part industry.
The implementation of the empirical conceptual framework could occur as follows: First, the
government, auto-part manufacturers, and automotive associations could collaborate to create
a master plan (relating to the National Economic and Social Development Plan). Thailand
would then be able to achieve a higher level of technological capability than other ASEAN
countries. Secondly, the suppliers should know about the priority of factors affecting
technology capability development. After they evaluate their working performance under the
scope of each factor, they will know their weaknesses or the areas that need to be improved.
Even new companies can set their business strategies to align with the study’s framework.
Thirdly, carmakers can use this framework to develop technological capabilities in their
automotive networks. When their suppliers have strong production and technological skills,
they can modify their current products or even introduce new models of components to
carmakers. Promisingly, when the empirical conceptual framework is implemented in all
three ways, it may help the Thai automotive industry to achieve its goal of becoming the
“Detroit of Asia.”
9.7 Conclusion
This study employed three phases using mixed methods research. Two research questions are
dealt with in this chapter. Research question 1 is “What government policies were used to
develop technological capability in the Thai automotive industry from 1960-2009?” This
is answered in Phase I (which employed both in-depth elite interviews and documentation
216
research). Expert opinions and documentary research have revealed that the government
policies used to develop technological capability in the Thai automotive industry were as
follows: incentives comprised of BOI, R&D tax deduction, and TAI; CKD, CBU, and
Emission Regulation; and excise tax, custom tax, and VAT.
Research question 2 is: “What factors have affected the technological capability
development of local Thai auto part firms?” This research question can be answered by
Phase II and Phase III. In Phase II (the survey), logistic regression analysis revealed that 12
factors from five key concepts significantly affected the development of technological
capabilities. In Phase III (the in-depth interviews), expert opinions reviewed these factors
from Phase II. Only ten of them were confirmed to have a positive impact on technological
capability development. Therefore, all 10 significant factors were presented in the model of
technological capability development for the auto-part industry in Thailand (Figure 9.1) to
address the second research question. Phase III also revealed three more important issues as
part of the answer to research question 2 (the clustering of automobile suppliers, technology
transfer from MNE to local suppliers, and the pick-up truck phenomenon), and the experts
also agreed that these factors have an effect on the development of technological capability.
However, to put these three issues in the model of this study, they needed to be tested by
statistical tools, as with Phase II. Essentially, when comparing the findings of all Phases in
this thesis with the literature review of technological capability development and related
factors in Chapter 3, the existence of a relationship between all key concepts dealt with in the
literature and technological capability development is confirmed as shown in Table 9.3.
The government can use the model in Figure 9.1 to improve their policies on incentives and
taxes. Companies in the automotive industry, especially auto-part suppliers, for their part, can
employ this model to work on the respective factors involved, and automotive associations
can use it to improve their consulting programs. Interestingly, the logistic regression models
in Section 9.3 and Table 7.28 (the grouping of factors causing technological capability
development) in Chapter 7 suggest specific approaches to deal with each factor for these
parties as mentioned.
In Chapter 10, the contribution and conclusion of this study are presented. The
implementation of all significant factors is also recommended.
217
Chapter 10
Conclusion, Contributions and Implications
10.1 Introduction
In this final chapter, the answers to the research questions are discussed along with the
conceptual framework and its related factors. The study makes contributions and has
implications for various parties. Section 10.2 evaluates the conceptual framework and the
Technological Capability Matrix. Section 10.3 examines the findings of the research
questions. Section 10.4 looks at the generalisability of the research findings. Section 10.5
describes the various contributions and implications of the study. Section 10.6 explains the
limitations of the research. Finally, Section 10.7 provides some implications for future
research.
10.2 Evaluation of Main Models Developed in this Study
The study contributes to related literature by providing conceptually developed and
exploratory-based research. The study contributes in two significant ways: (1) It develops a
useful conceptual framework, and (2) It develops the technological capability matrix. This
section presents an evaluation of these two main contributions of the study to the existing
literature.
10.2.1 Development and Contributions of the Conceptual Framework
The conceptual framework developed in Figure 4.2 of Chapter 4 influenced all three phases
of the study. It aims to contribute a ‘new form of conceptual thinking’ regarding factors
having significant effects on technological capability development in the Thai automotive
industry. The development of technological capability in the automotive industry, particularly
in the context of Thailand, has been a previously unexplored research area. The conceptual
framework provides a different theoretical lens through which to view this process. It
integrates all factors of the key concepts ‘organisation & organisational learning’,
218
‘international strategic alliance’, ‘innovation strategies’, and ‘technology transfer’ in the
context of technological capability development. Importantly, this framework differs from
those presented in previous studies in the literature as it has introduced the key concept
‘government policies’ in order to fill the gap left by models from other studies. In the
research, the impact of government policies and their related factors on technological
capability development are tested. Consequently, the conceptual framework with its 18
factors provides a balancing perspective in contrast to previous studies (e.g. Cooper, 2003;
Veryzer, 2003; and Ovans, 1998).
From Phase I, II, and III of this study, only ten out of 18 factors in the conceptual framework
were confirmed to cause the development of technological capabilities. Therefore, in this
study, the final version of the framework with its ten factors is called the ‘empirical
conceptual framework’ or ‘The Model of Technological Capability Development for the
Automotive Part Industry in Thailand’ (see Figure 9.1). For further study, scholars in this
field can use these as core concepts to find additional key concepts or main factors that can
strengthen the structure of the model to make it applicable to a different business
environment. In addition, executives in the automotive industry can work on activities related
to these ten factors to upgrade technological capabilities in their organisation. Also,
government offices, such as the Ministry of Industry, the Excise Department, and the
Customs Department, can use this model to develop government policies to support
technology capability development in the automotive industry.
10.2.2 Development and Contributions of the Technological Capability Matrix
The technological capability matrix (see Table 3.1 in Chapter 3) provides a unique way of
integrating diverse theories (i.e. production capability, technological capability, and
technology transfer). Three main areas included in the matrix are investment, production, and
linkage. The activities of these main areas are at different levels of technology capability
development: basic, intermediate, and advanced. For instance, in the work group of product
engineering in the production area of the matrix, the activities ‘assimilation of product
design’, ‘incremental new product design’, and ‘in-house product innovation’ can be
classified at the basic, intermediate, and advanced levels respectively. To use this matrix as a
road map, the organisation needs to make a list of their daily activities and projects, and then
219
compare them with activities in the matrix. At this point, the organisation knows its level of
technological capability development. To reach a higher level, top management can put more
challenging activities in yearly or 5-year master plans of the organisation.
In line with the bulk of previous research about R&D, the matrix emphasised the important
role of R&D. It can be seen that at the highest level of technological capability development,
i.e. the Advanced level, R&D is embedded in each description of all three areas described. It
might be implied therefore that R&D is an essential element in indicating the high-end level
of technological capability development. Hence, in this study, R&D is employed as the sole
indicator of technological capability (see Section 3.5.2 in Chapter 3), in terms of the analysis
of which factors have an effect on the technological capability development of local Thai
auto parts firms.
10.3 Evaluation of the Findings of Research Questions
This section highlights the findings for the two research questions described in Chapter 1,
namely:
RQ1: What government policies were used to develop technological capability in the
Thai automotive industry from 1960-2009?
RQ2: What factors have affected the technological capability development of local Thai
auto parts firms?
Two research questions will be answered by three phases of the study as follows:
10.3.1 Phase I: The Role of Government Policies in the Development of the Thai
Automotive Industry
To answer research question 1, Phase I qualitative research aimed at providing important
background knowledge concerning the Thai automotive industry in terms of its development
under government policy according to the perspectives of five leading experts in the industry.
The results of this phase are outlined in Chapter 6. Government policies comprising
220
incentives, taxes, and regulations which have effects on developing technology capability are
presented below.
The expert interviews revealed that when Thailand started to develop its automobile industry
its experience of automobile assembly was very limited. The industrialisation of the
automotive industry began in the early 1960s. Although Thailand lacked manufacturing
expertise at the time, the automobile industrial specialist from the Office of Industrial
Economics stated the significance of incentives in the development of the industry. The BOI
(Board of Investment Promotion) supported the installation of new machines or production
lines. To operate new machines, Thai engineers and workers needed to attend training
programs about recent technologies. R&D tax deduction, for its part, has had a direct effect
on technological development and the experts suggested that the government should support
all R&D projects. The TAI (Thailand Automotive Institute) was set up to assist the operation
of Thai auto-part suppliers, classified as 2nd and 3rd tier suppliers. This institute conducts
research and has master plans for the automotive industry. All three incentives mentioned
above encourage Thai employees to develop their technological skills.
The experts in Phase I agreed that the government’s approach to three forms of taxation
helped with the development of technological capabilities in the automotive industry. Firstly,
excise tax policy has had a direct impact on the growth of the automotive industry, especially
with regard to pick-up trucks. The Excise tax rate is 3% for pick-up trucks and 30-50% for
passenger cars (see Table 2.10 in Chapter 2). This aims to help Thai people living in rural
areas to afford the former vehicles. At present, Thailand is the world number two in the pick-
up truck market. The experts in Phase I said that almost all pick-up parts can be produced in
Thailand. In addition, R&D projects have already been launched with assistance from foreign
technical teams. Secondly, custom tax policy has played a big role in generating demand for
local auto-parts. The Custom tax rate for importing auto-parts is less than for cars. This
shows that multinational firms are not supported in importing completely built-up cars.
Rather, they are motivated to set up assembly plants and order auto-parts from local
suppliers. Thirdly, VAT (Value Added Tax) policy has increased the number of assemblers in
Thailand. This is because after the implementation of VAT, import duties for assemblers are
reduced. Having high quality parts in their assembly lines, car makers need to transfer
technologies to suppliers, especially 1st tier suppliers, in the network. To maintain the growth
221
rate of the automotive industry and increase the number of R&D projects for the production
of auto-parts, the experts therefore suggest that the government should maintain present tax
rate policy.
Executives of the Thai Automotive Institute (TAI) identified regulations from the
government as the most important factor in the development of the industry. The “Local
Content Requirement (LCR)” of 1971, one of the most important policies, required
automobile companies to acquire their parts locally. High import tariff rates and local content
requirements have aided development in Thailand’s automotive industry in two major ways.
Firstly, the policies have resulted in the extensive use of subcontracting, which has been of
benefit to the indigenous parts industry. Secondly, local firms have received the transfer of
management and production know-how, along with technology, as a result of multinational
firms making efforts to meet LCRs and increase quality in local suppliers. However, in the
liberalisation period, the Thai government joined the WTO and AFTA. As a result, LCR
regulations were lifted. The CBU (Completely Built-Up) and CKD (Completely Knocked-
Down) regulations were also effective. The CKD tax rate is lower than that for the CBU. As a
result, multinational firms have been forced to procure local auto parts. These policies no
longer have an impact on technological development, however, according to the findings in
the Phase II Survey and the expert opinions in Phase III. In order that the implementation of
CKD and CBU can motivate local suppliers to launch R&D activities, a laws committee
should be appointed to improve the contents of these laws. Lastly, emission regulations
should be introduced in order that exported cars and auto parts can pass international
environmental standards. As car designs conform to environmental agreements and most car
makers have already worked to high assembly standards, Thai suppliers need to upgrade their
production to supply modern car parts for the coming decades.
10.3.2 Phase II: Factors Affecting the Technological Capability Development of Local
Thai Auto-Part Firms
To answer research question 2, the conceptual framework presents all 18 factors expected to
cause development in technological capabilities. All of these factors were tested step by step
in Chapter 7 by the Chi-Square test, Cramer’s V, and the Logistic Regression technique. At
the end of the calculating process, the logistical regression model was built and 10 factors
were found to have positive effects on technology capability development (see the regression
222
coefficients presented in Table 7.28 in Chapter 7). Phase II findings are also discussed in
Chapter 9. All 10 factors ranked by their degree of causal relationship with technological
capability development are presented in the Model of Technology Capability Development
for the Automotive Part Industry in Thailand (the empirical conceptual framework) in Figure
9.1 and are related to the five key concepts as shown below.
Organisation & Organisational Learning
1) Nationality of ownership of establishment
2) Method of acquiring technology
3) Size of company
International Strategic Alliance
1) Type of company ownership
2) Ability to obtain exclusive contracts from the automobile industry
Innovation Strategies
Ability to modify production or products
Technology Transfer
1) Need of foreign technicians or expert assistance
2) Type of industry
Government Policies
1) Government taxes of concern
2) Government incentives supporting the firm
In this chapter, possible applications of these factors by Thai government and auto-part
manufacturing companies are introduced as follows:
1) Organisations that do not develop their technological capabilities find it hard to
survive in today’s competitive environment. In the key concept ‘organisation &
organisational learning’, the factor of nationality of ownership has the most effect on
technological development. Companies managed by expats have expert staff to train
employees in the plant. Thai business investors who want to benefit from this approach may
set up their companies with a joint-venture agreement. Acquiring technology through
overseas training may be a short-cut in this respect. Trainees with high work performance
who have travelled for training aboard can transfer this know-how to their colleagues.
Companies with overseas training programs can therefore advance to setting up their own
R&D activities in a shorter period.
223
This study suggests that larger companies, such as those having more than 1,000
employees, seem to have more technological capability. However, in the case that a company
is owned by Thais and its size is still small, it should focus on overseas training to achieve its
technological development goals. When the company has higher revenues and becomes
larger, they can follow the same steps to technological development as non-Thai companies.
2) Thai business owners who want to start up businesses but have no experience in
producing automotive parts should establish joint ventures (the most impactful factor in the
‘international strategic alliance’ key concept) with skilled producers, especially foreign
producers. Car components are high quality standard products, and production technologies
change very fast. Modern machinery and equipment requires skilful workers to operate. Joint-
venture agreements accelerate the learning process. Foreign supervisors can take close
control of production lines and on-the-job training by these supervisors can improve Thai
workers’ technological skills. Foreign partners generally have more chance of obtaining
exclusive contracts from car makers, particularly parent companies. Japanese suppliers, for
instance, have a high potential for getting orders from Japanese car makers. In Thailand,
suppliers with no connections will find it hard to survive in the industry. Also, the higher
production volumes suppliers receive, the more product quality improvement and
technological capability advances they can potentially achieve.
3) ‘The ability to modify production or products’ causes development in technological
capability. Thai suppliers working on modification tasks need to use modern technologies as
tools to eliminate weak points and create strong points in specific products. The R&D
department also needs to take responsibility for procuring new materials or creating high-
performance products as part of energy saving and emission decreasing strategies in new car
models. Employees of R&D teams and production lines can learn about new techniques day
by day. However, their action plans cannot be successful if top executives do not give them
full support. They need, for instance, to approve budgets to launch R&D projects despite high
project expenditures. (No positive relationship between ‘consideration of investment in
research and design’ and ‘development of technological capabilities’ was found. This is dealt
with further in Phase III).
224
4) Most non-Thai suppliers are advanced in technology. This is in large part due to
the assistance they receive from foreign technicians or experts. Some Thai suppliers try hard
to improve production processes or even invent new machines or equipment themselves.
However, this approach is too slow to serve the needs of car makers. Learning new
techniques from foreign experts can help to upgrade their technical skills. During the
technology transfer process suppliers’ R&D teams can use their new know-how to fast-track
their own technologies. Interestingly, this study also reveals that suppliers who produce
electronic parts tend to have already worked on technology development.
5) When the government drafts a new policy, opinions from auto-part suppliers
should be taken into consideration. The study reveals that auto-part suppliers are most
concerned about Excise taxes, and this tax policy causes the advancement of technology
capability. Excise taxes support local auto-part producers, especially those supplying pickup
truck manufacturers. The tax for pickup trucks is 3% while the taxes for passenger vehicles
vary from 30 - 50%. The second effective policy is tax deduction for research and design
(R&D). To pass the tax requirement and receive tax deductions, companies’ top executives
are more willing to take the risk of investing in R&D projects even though the outcomes of
these projects may not yield as large returns as they expected. However, not all policies are
suited to the same purpose. This study suggests that some government regulations and
policies, such as CKD regulations and BOI incentives, should be revised in order encourage
local auto-part suppliers to launch R&D activities or develop their own technologies.
10.3.3 Phase III: Important Issues in Developing the Thai Automotive Industry
To answer research question 2 Phase III was undertaken to confirm the validity of the
statistical results from Phase II and to further identify other important factors influencing the
development of technological capability in the industry. Thus the findings found in Phases I
and II were triangulated and it was ensured that all necessary data needed to answer the
research questions were covered. The following important issues which were not explored in
Phase II were examined.
225
1) The Role of Clusters in the Thai Automotive Industry.
The emergence of clusters comprising car makers and suppliers producing different types of
auto parts has a big role in technological development in Thailand. During the financial crisis
and liberalisation period, the inflow of MNEs was massive. Many Japanese and Western car
makers set up their plants in Thailand. 1st tier suppliers, Denso and Visteon, also moved their
production lines to Thailand. Some experts in Phase III said that the cluster over-emphasised
assembly and under-emphasised more sophisticated activities. The main obstacle has been
that 2nd and 3rd tier suppliers still depend on ineffective techniques. So, the TAI (Thailand
Automotive Institute) needs to be more proactive as the Phase II findings reveal that few
companies are concerned with assistance from the institute. The experts claimed that the Thai
education system does not provide them with enough employees with sufficient technological
skills. The Ministry of Education therefore has a role in improving this.
Thai government policies have supported MNEs’ operations. Many incentives have also been
offered. During the last decade, Thailand has become a regional hub for many of the large car
makers. However, there is still room for development in R&D. The Toyota Technological
Center, mostly operated by Thai engineers, is one of the most successful centres for
promoting the development of R&D. Essentially, technological development should start
with local suppliers, and the Thai government has the opportunity to support them.
2) Technology transfer between MNEs and Thai Auto-Parts Firm.
The experts agree that inter-firm technology transfer between MNEs and Thai auto-part
suppliers was the most important tool in developing technological capability in the Thai
automotive industry. Linkages between MNEs and Thai auto-part suppliers are channels for
the diffusion of knowledge and skills.
To export auto-parts or supply them to Western car markers, Thai suppliers need to receive
quality certifications, such as QS9000. Having good quality systems, the suppliers may not
only decrease the number of product defects but also continuously improve production
processes and product design.
226
Japanese car makers like to create strong relationships with 1st tier suppliers, and help them to
improve product development, process engineering and quality control. Most Thai suppliers
are still 2nd and 3rd tier and have to learn about technological and production skills from those
in the 1st tier. Promisingly, Thai suppliers can quickly upgrade to the 1st tier and with greater
production capabilities may be offered exclusive contracts for more sophisticated parts with
higher volumes. When car makers launch new working systems in the cluster, suppliers’
production managers and engineers need to implement them. Then, car makers can transfer
the necessary know-how (inter-firm transfer) to get supplies of high quality products at low
prices from suppliers.
3) The Pickup Truck Phenomenon
Thailand is the world’s largest producer of pickup trucks (Stimpson, 2006). The drivers of
pick-ups sales are domestic demand and government tax policy, especially Excise tax policy.
The Excise tax for pickup trucks is only 3 per cent of the manufacturing cost compared to 30-
50 percent for passenger cars. The experts indicated that more than 90 percent of pickup
components are produced locally. Pickup customers buy pick-ups for many purposes
including transport and delivery. As a result, their auto-parts should be able to handle difficult
conditions.
R&D projects need to be developed as new models with new or updated parts are introduced
into the market. Foreign experts from reputed automotive manufacturers can help Thai
suppliers to develop themselves to an advanced level of technological capability.
10.4 Generalisability of Research Findings
The countries in ASEAN are similar to Thailand in many respects. Large countries in the
region have major automotive production industries with high growth rates. Consequently,
they can use the Model of Technology Capability Development for the Automotive Parts
Industry (see Figure 9.1) as part of their plans to develop the industry, especially local auto
part manufacturers. The following supports the generalisability of this research’s findings to
ASEAN countries.
227
10.4.1 ASEAN
ASEAN (The Association of Southeast Asian Nations) comprises of 10 countries. All of
which, apart from Singapore, are still classified as developing countries (Information from
IMF World Economic Outlook 2011). To strengthen the regional economy, most countries in
ASEAN signed cooperative agreements in 1992, and later, at different times, the rest of the
countries signed the AFTA agreement that aimed to lower intra-regional tariffs (to 0 – 5%).
Next, the master plan of the Asian Economic Community (AEC) was introduced. ASEAN
expects to become one market and manufacturing base by 2015 and to focus on impartial
economic development. As a result, the ASEAN countries are expected to have similar
economic characteristics and a high potential for investment. The benefits of AEC among
members include a lack of tariffs, the exchange of experts, and effective custom processes.
After the economic crisis in 1998, FDI inflows into the ASEAN region were substantial.
Some countries, particular Singapore, Malaysia, Thailand and Indonesia, received the
benefits of technology transfer. Japan and the United States were two of the biggest countries
to set up their businesses in this region. The automotive industry has generated high revenues
for the region. Promisingly, the model presented in this study is a potential tool to facilitate
ASEAN governments and automotive manufacturers in developing their technological
capabilities.
10.4.2 The Automotive Industry in ASEAN
Since Thailand is a developing country, the research findings could be assumed to apply also
to other developing countries in ASEAN. Many of them share the same development goals
which include attempting to improve their automotive industry to the point where it can act as
a centre for vehicle and high-quality auto parts production. Whether these countries are
suitable for implementing this study’s findings is discussed below.
Even though the Philippines has a weak domestic market for its automotive industry, major
car makers that have set up production plants in the country aim to implement an export
strategy to be profitable. The Philippine automotive industry has therefore still attracted car
makers (Lau, 2006). Indonesia, like Thailand has failed to introduce a national car brand. The
automotive industry in Indonesia had recovered from the 1997 crisis in 2005, and car sales
228
accounted for about 500,000 units. Indonesia lacks the capability to produce sophisticated
parts. Japanese car makers in Indonesia are also concerned about the effect of the AFTA
agreement and are preparing to assemble a large number of export cars. Apparently, the
Philippine and Indonesian industries employ the same export strategy as Thailand does.
Vietnam still had low consumption volumes in car sales accounting for about 16,000 units in
the first half of 2005. The percentage of using local parts was still low at that time. Only 10%
of unsophisticated parts, such as car seats, are produced by Vietnamese companies (Binh &
Linh, 2011). However, Vietnam has had impressive economic growth rates for a considerable
number of years, and the domestic demand for cars has been increasing. This shows that like
Thailand, the Vietnamese auto business still includes a gap for other brands of foreign car
makers to come to invest or pre-established brands to expand their production lines.
Vietnamese businesses have also set up joint-venture companies with foreign car makers.
They created international strategic alliances and benefited from technology transfer among
Vietnamese and foreign partners. All three countries share many characteristics with the Thai
automotive industry, so this research study’s model has the potential to help accelerate
technology capability development in their automotive industries.
The automotive industries of countries in the rest of ASEAN have some characteristics that
are quite different from those of the countries mentioned above. Malaysia has the government
owned Proton as its national car brand. The government has naturally set up policies to
support this car brand. The automotive environment in Malaysia, therefore, is quite different
from Thailand and this research effort may not therefore be applicable to it. Singapore has a
small population and mainly imports cars into the market. Brunei Darussalam also has a
small automotive businesses compared to Thailand. Energy Department data shows sales of
cars in Brunei Darussalam from 2002 to 2006 being between 10,000 and 17,000 units per
year. The main industry of this country is petroleum and liquefied natural gas. Lao,
Cambodia, and Burma still have low GDP per capita, and their automotive industries are
relatively small when compared to that of Thailand. However, it is possible that whenever
these five countries, excluding Malaysia, experience an increasing number of local suppliers
and foreign car makers, they can use this research study’s model as part of their master plan
for developing their technological capabilities.
229
10.4.3 Government Involvement
The government of Thailand has recognised the developing nature of its domestic
technological capabilities and has therefore begun to encourage local firms to access and
acquire new technologies from various foreign sources. Several forms of support from
multinational automakers are involved. The local auto parts firms have had very close ties
with Japanese firms. Thus, the research findings of this study tend to be valid for countries
where the government has power to get involved in the private sector and enforce policy to
build technological capability for the automotive industry. Also, countries have to be open to
the involvement of multinational automakers -which leads to technology transfer- in order to
develop their technological capability.
The ASEAN countries have a shared approach to automotive industry policy. Governments
have got involved in supporting the growth of local companies and their investment policies
and have been successful in supporting the inflow of FDI. Government incentives have an
important role in regional investment (Konan, 1996). Thailand, for example, has
implemented regulations to generate revenues for local companies. In Vietnam, the
government has also become involved in encouraging joint ventures. And in 2005, about 14
joint ventures were operating in the country. This shows that Vietnam, like Thailand, can
benefit from technology transfer. Vietnam wanted to delay the effect of AFTA and maintain
its tax rates. However, in order not to break the agreement, it decided to reduce CBU taxes,
but maintain CKD taxes. In Vietnam, most auto parts were imported from Thailand. An
internal tax called the Special Consumption Tax was up to 60% and VAT was 10%. These
were quite high (Lau, 2006). In the Philippines, the government needed to introduce effective
policies to strengthen the automotive industry in the face of imported second hand cars. This
import pattern, if it could not be changed before the AFTA tax tariff in 2010, could cause car
makers to change their focus from a CKD to a CBU strategy (Aldaba, 2008). The Vietnamese
and Philippine examples illustrate how governments in the region use policy to control the
direction of their automotive industries. Other governments in ASEAN countries also employ
policies to try to benefit from the inflow of MNEs.
In conclusion, the research findings of this study can be generalised to developing countries
in the ASEAN region in which governments encourage the development of technological
capability, especially in the automotive industry. The researcher believes that, with support
230
from government policies, a knowledge of the ten factors in the Model of Technology
Capability Development for the Automotive Parts Industry, and the use of the statistical
models from this study, developing countries in ASEAN could potentially improve their
automotive industries at a faster rate than at present.
10.5 Contribution and Implications of the Study
The contribution and implications of the study can be presented in three areas: theoretical
contribution, practical contribution, and pedagogical contribution.
10.5.1 Theoretical Contribution and Implications
This study has been among the first research projects to focus on developing an innovative
conceptual framework within the context of technological capability development. In
addition, the research provides suggestions on how the Thai automotive industry can develop
a technological capability strategy by identifying the factors involved based on data obtained
from the executives of automotive firms. It also provides insightful information and
contributes additional knowledge in the area of technological capability development.
Importantly, the results are relevant, not only in the context of the Thai automotive industry,
but also in the context of other developing countries, particularly ASEAN countries.
The findings of this research study helped to illuminate the role of Thai government policy as
well as other factors involved in affecting technological capability development. The study
also provided information about key aspects differing from existing literature, e.g. the role of
automotive industrial clusters in general, by concentrating on the results of government
policies and factors affecting these policies.
The study’s conceptual framework relates organisation & organisational learning, technology
transfer, international strategic alliance, innovation strategies, and government policies to the
development of technological capability. This should aid an understanding of the way in
which technology transfer can increase technological capability and firm competitiveness in
automotive industrialising countries, particularly Thailand. Although there have been many
attempts to investigate the development of the Thai automotive industry including technology
231
transfer issues, these studies have been mostly theoretical (e.g. Techakanont, 2003). This
dissertation has contributed to the literature by providing not only theoretically and
conceptually developed data but also empirical data, which emphasises the role of
government policies and the private sector and the factors influencing the developing of
technological capabilities of Thai auto-parts firms. The inclusion of government policy as a
new factor in the study fills a gap in the conceptual framework and in previous research
presented in Chapters 3 and 4.
With regard to the first research question, the key findings of this study provide policy
implications for the automotive industry and government bodies, as follows.
Firstly, it can be seen that, in retrospect, Thai policy makers have shown flexibility and
aligned themselves with multinational automakers. In different phases of the Thai automotive
industry as shown in Section 2.3 of Chapter 2, it can be seen that former Thai bureaucrat-
dominated governments made the right decisions by gradually taking a series of steps to
liberalise the automotive industry at the appropriate time. Investors could then predict trends
in Thai automotive industry development based on government policies.
Secondly, the findings suggest the government should adopt a more active investment
promotion scheme to spur technological development by inviting more foreign investment to
Thailand, and by targeting projects with clear and integrated technological development
activities; such as design or research and development.
With regard to the second research question, the study analysed the factors that have
influenced technological capability development in Thai auto part industry. The findings
support the study of Patarapong and Peerapong (2005) that private sector R&D activities can
help to develop collaboration among industry, academic and government institutions. As
R&D activities have an effect on technological capability development, it’s important that
they should be invested in. In this way, the research has provided reasons to encourage
companies to adjust their investment behaviour. The model for factors encouraging
technological capability (see Figure 9.1) can be used as a check list in this respect.
232
10.5.2 Practical Contribution and Implications
The results of the study have potential benefits for a number of parties involved, such as
government officers, companies’ owners, and staff, as follows:
10.5.2.1 Contribution and Implications for the Thai Government
Government policies play an important role in local technology development. The results of
this study imply that even though the Government has developed many comprehensive
measures and policies for developing technological capability in Thailand, the efficiency of
many Thai manufacturers has still not been impressive. Suggestions for the Thai government
are as follows.
1) The government should focus on two areas. First, it should maintains the dynamics
of the regional hub position allowing Thai manufacturers to continue supplying high volumes
of auto-parts and employment rates to increase. Secondly, it should strengthen the absorptive
capability of indigenous manufacturers in the cluster. This could increase overall technology
capabilities in the industry. It may also give Thai employees the opportunity to negotiate
higher wages and thus improve their living standards.
2) Government officials should develop the Thai automotive development plan on the
basis of real data with a firm intention to develop the industrial sector. The measures and
policies should be understandable, feasible, and really serve the needs of the industrial sector.
Excise Tax is an effective tool that causes high growth in the pick-up truck market. The
manufacturers for pick-up parts have impressive production skills, and have launched various
R&D projects. R&D tax deduction also directly supports R&D activities. In addition,
government officials should implement these plans with a common goal. They should use
their authority honestly and with the intention of helping the country as a whole. The
government’s budget should not be spent only to promote special interests or particular
agencies.
3) Since Thai auto-part firms have to take any technology that MNEs are willing to
transfer, the Board of Investment (BOI) should develop tougher measures regarding
technology transfers from MNEs. There should be inquiries into what technology companies
will introduce to Thailand and how this technology may be transferred. The impact of the
technology should be carefully evaluated in terms of environmental preservation, quality of
233
life, and advancement of know-how. Foreign investment should not be promoted only in
terms of inward financial flow but also in terms of upgrading the quality of personnel and
knowledge.
4) Some Thai auto-parts firms are interested only in short term outcomes and do not
have a clear intention to develop sustainable competency through knowledge transfer or trial.
This reflects the lack of a learning culture in Thai society. The Government, in particular, the
Ministry of Education should promote an environment for a creation of a learning culture in
the national education system. A research centre should be established in every school to
provide an appropriate level of knowledge for young researchers. This could help Thai
children to develop a learning habit which would in turn help them to become good
technology receivers and innovators in the future. Meanwhile, the Ministry of Industry should
also promote an environment of organisational learning in local auto-part firms. Training
courses should be organised to educate and create a learning culture for company employees.
And the executive and management levels of Thai auto-part firms should be educated about
the importance of developing sustainable competency through MNE technology transfer.
10.5.2.2 Contribution and Implications for Thai Auto Part Firms
The followings are the contributions and implications of the study for the development of
technological capability in Thai auto-part firms.
1) Thai auto-part firms must learn from their business partners, especially on how to
improve production technology and production methods. This is because Thailand has to
compete with other countries in the world market. Non-tariff barriers have been established in
some developed countries to protect their local industries. Car makers and 1st tier suppliers
can be used as a means for Thai local firms to learn how to meet the high standards and
requirements of foreign markets. To be successful in the long run, Thai business owners who
set up auto-part manufacturing business with little experience should create joint-ventures
with foreign business partners to benefit from the transfer of technologies.
2) Overseas training is one of the most effective ways to acquire technological know-
how in a short period. Large companies can more easily afford this option. Without intense
training programs, Thai engineers and workers will be limited to only a basic knowledge of
operating machines and tools. Another method of acquiring technology can occur during the
extension of the production process with new machine installations. Machine sellers teach
234
about how to use operating functions and about maintenance instructions. In this way, Thai
trainees can access advanced operation, maintenance, and product know-how. Later on, these
trainees can be the heads of in-house training and improve the companies’ overall technology
capabilities.
3) Ability to modify production and products is important. There are many suppliers
in competition with each other for higher creditability in the eyes of car makers. Clearly, Thai
suppliers who want to win orders need to offer car makers high performance products at
cheaper prices and with on-time delivery. Also, Thai suppliers need to have consistency in
their quality control systems and have well-developed engineering processes.
4) Thai auto-part firms should incorporate R&D activities into their yearly action
plans. Getting assistance from foreign experts or technicians is important, especially for a
new established company. Top executives should create a company culture of innovative
thinking, and all employees should be part of this development. In the long-run, R&D
departments should be set up to create new products, machines or tools, and also to
accumulate in-house techniques and know-how initiated by employees.
10.5.3 Pedagogical Contribution and Implications
This study highlights the extent that organisational learning centres for skills development in
specific fields of the automobile and auto-parts industries are required. In Section 3.9.2 of
Chapter 3, considering ‘learning as an informational-oriented process’ and ‘learning as an
experience oriented process’, the role of a facilitator in a person’s learning process seems to
be essential. In order to achieve highly effective organisational learning, the owners of
private sector companies cooperating with automotive institutes, such TAI, should provide a
teacher, coach or mentor, to help individual employees (managers, professionals, workers) to
improve their technological skills.
10.6 Limitations of the Research
This section describes the limitations of the research in six areas, i.e. the literature reviewed,
the conceptual framework, and the data gathered in the three phases of fieldwork.
235
10.6.1 Limitations of the Literature Reviewed
Although the research has extensively reviewed previous empirical work in line with the
theoretical background of the study, there are other areas of the existing literature that could
be useful in adding breadth and content to the subject. However, setting a limitation on the
scope of the research was imperative for the following reasons: Because of the immense
amount of literature in the automotive field, it was deemed important not to provide too much
emphasis on discussions which may lead to compromising more important areas that
demanded focus. Moreover, most of the existing literature centres on the context of
developed countries, thus it seemed to difficult to find literature in a developing country
context. However, questions or purposes addressed by potentially useful additional secondary
data were already answered sufficiently by the earlier literature gathered and included in the
review.
As the automotive industry is a large motor vehicle manufacturing group, there are several
aspects to it, such as the auto-parts industry, MNEs, automotive institutions and government
and industrial policies. Several aspects involved in the research context led to the broad scope
of the literature review. However, an effort has been made to emphasise and synthesise them.
Furthermore, data during the period 1960-2010 needed to be collected and explored but
finding previous studies and literature conducted in the past 50s years tended to be difficult.
Some data was irretrievable. Data from other sources such as the expert interviews, was used
to fill the gap and also for purposes of triangulation.
10.6.2 Limitations of the Conceptual Framework
The conceptual framework for the development of technological capability in the Thai
automotive industry has some limitations. It includes five key concepts, which are considered
in the study to be the most important in the development of technological capabilities. Some
less important concepts that would have made the framework more complicated were not
deemed worthy of inclusion. The study’s scope is limited and some further factors (or
variables) have been omitted from the framework.
The logistic regression method built in this study cannot predict the existence of R&D
activities or technology capability development in specific organisations. However, the study
does not aim to use the model for this purpose. Individual logistic regression equations for
236
each of the five key concepts can clearly present the degree of importance of their significant
factors. Each party associated with the automotive industry can focus on the specific factors
relevant to its area of responsibility.
10.6.3 Limitations of Research Activity Execution
For all phases of the study, there was a need to collect data from government officials from
different governmental agencies in order to elicit data relevant to government policy. A
limitation existed in that the respondents seemed to be reluctant to fully disclose the
requested information since they feared that some confidential information might be revealed
and might affect their career path in the future even though it was explained that all data
given would be kept strictly confidential and not be used for any other purposes. There was
an attempt, however, to validate and triangulate the research findings across different phases
of the study to ensure that all necessary data was collected. One of the advantages of
conducting research with samples from government organisations is that the rate of response
was high. This might be because government officials often deal with national and
international projects and they realised that the findings would be beneficial for industries in
Thailand.
Although a quantitative approach was utilised for Phase II of the study, a large amount of
responses would have potentially increased the reliability and generalisability of the findings.
However, the findings indicated a number of issues that have led to further examination in the
subsequent phase (Phase III). Subsequently, the results of these phases of the study were
triangulated in order to corroborate findings during the analysis stage and contribute to the
overall generalisability and reliability of the data.
10.6.4 Limitations of Research Methods Employed and Techniques Used
The limitation of the research methods used for Phase I and III of the study revolved around
issues related to sample size and sample frame. For Phases I and III, it is acknowledged that
the qualitative approach might not be appropriate for the drawing of generalised conclusions
in a strict methodological sense (Saunders et al., 1997), and that the findings are indicative
rather than conclusive considering. Because in-depth data was required from government
executives with high positions or chief executives in organisations, there seemed to be little
choice regarding samples. However, although the number of qualitative samples was less
237
than ideal, the high quality of the samples of top executives from government departments
and the private sector in Phase I and III aids the validity of the data.
Focusing on all phases of the study, the main limitation might have been the issue of
convenience and purposive sampling. It tends not to be often feasible to generalise the results
of such sampling to the whole population. However, the large size of the random samples in
Phase II (the quantitative method) assuages this limitation.
10.6.5 Limitations of Data Analysis
In Phase II of the study, the use of these categorical questions (as nominal or ordinal scales)
limits the choice of data analysis methods (statistical techniques). After consulting with
experts in the field, the decision was made to employ Chi-Square Tests and build the Logistic
Regression Model. Chi-Square Tests were used to find all factors having relationships with
the dependent variable, and these factors could be used as inputs for building Logistic
Regression Model. Then, the Logistic Regression Model presents the factors that really cause
the development of technological capabilities for Thai auto-part industry.
10.6.6 Limitations of Integrating Findings across a Mixed Methods Approach
Time, expense and difficulty of integrating results from each phase were limitations of
employing the mixed methods approach. As mentioned in Chapter 5, although this approach
can provide stronger evidence for a conclusion though integrating triangulated findings, it is
not easy to achieve convergence and corroboration of findings. However, in order to reach
the objectives of different phases (Phase I and III involved a descriptive type of research
design; Phase II entailed an exploratory research endeavour), the mixed methods approach
was considered the best choice of research methods. Saunders et al. (2003) claimed that one
of the most significant advantages of using the mixed methods approach in the same study is
the possibility of reaching different research objectives. In addition to that, using different
methods of inquiry in the same study gives a variety of information on the same issue. The
mixed methods approach can help to triangulate results and lead to higher quality findings.
238
10.7 Implications for Future Research
The researcher hopes that this study will stimulate further research on the development of
technological capability and how it is influenced by Thai government policies. The following
are some implementations and recommendations for future research:
First, further research is required to examine different industries and different settings in
order to develop further the viewpoint presented here and to verify whether the same
activities identified in the development of technological capability are also presented in other
industries.
Second, replicating this research in other countries; such as South American, Eastern
European, and other Asian countries with strong relations between the government and
industries is strongly recommended. Also, the conceptual framework of the study might be
applied in future studies in other countries to examine similarities and differences with
Thailand. A comparison might be conducted in the context of the automotive industries in
two countries in the same region, or between countries from different regions.
Third, apart from government policy and factors affecting it, other issues related to
technological capability development of the industry can be investigated; such as the role of
the private sector, the effect of import and export, and the strengths and weaknesses of Thai
parts suppliers.
Finally, future research could employ a longitudinal form of study to observe the effect of
additional variables; such as time, on the findings. More studies are required to increase
understanding of the issues surrounding partnerships in global automotive production
networks, particularly the effects of government policy and factors affecting technological
capability development in the automotive industry.
239
References Abdullah, A. S., & Husten, C. G. (2004). Promotion of smoking cessation in developing countries: a framework for urgent public health interventions. Thorax An International Journal of Respiratory Medicine, 59(7), 1. Abdulsomad, K. (2003). Building technological capabilities of local auto parts firms under contrasting industrial policies: A comparative study of Malaysia and Thailand 1960-2000. Stockholm: Almqvist & Wiksell International. Abeysinghe, D. P., & Paul, H. (2006). Technological capability development after privatization: Case studies of two telecommunications service providers. Retrieved February5, 2010, from www.nitropdf.com/professior Aldaba, R. M. (2008). Globalization and the need for strategic government-industry cooperation in the Philippine automotive industry (Discussion Papers DP 2008-21). Makati city, Philippines: Philippines institute for development studies. Alpar, P., & Reeves, S. (1990). Predictors of MS/OR application in small business. Interfaces, 20(2), 2-11. Alvarez, I., & Molero, J. (2005). Technology and the generation of international knowledge spillovers: An application to Spanish manufacturing firms. Research Policy, 34(9), 1440-1452. Anand, J., & Kogut, B. (1997). Technological capabilities of countries, firm rivalry and foreign direct investment. Journal of International Business Studies, 28(3), 445. Argyres, N. S., & Silverman, B. S. (2004). R&D, Organization Structure, and the Development of Corporate Technological Knowledge. Strategic Management Journal, 25(8-9), 929-958. Argyris, C., &Schön, D. A. (1978). Organization learning: A theory of action perspective. Reading: Addison-Wesley. Armstrong, M., & Baron, A. (1998). Performance management: The new realities. Institute of Personnel and Development, London. Arrow, E. (1962). The implications of learning by doing. Review of Economic Studies, 29, 166-170. Auster, E. (1987, Summer). International corporate linkages: Dynamic forms in changing environments. Columbia Journal of World Business, 22(2), 3-6. Babbie, E. (2001). The practice of social research (9th ed.). London: Wadsworth/Thomson Learning.
240
Badaracco, J. L. J. (1991). The knowledge link: How firms compete through strategic alliances. Boston: Harvard Business School. Balasubramanian, V. (1994, November 23). Organizational learning and information systems. Retrieved November 23, 2010, from http://www.bmgt.umd.edu/Business/ AcademicDepts/IS/Learning/orglrn1.html Barney, J. B. (1997). Gaining and sustaining competitive advantage. Reading: Addison-Wesley. Barney, J. B., & Hansen, M. H. (1994). Trustworthiness as a source of competitive advantage. Strategic Management Journal, 15, 175-190. Beamish, P. W. (1988). Multinational joint ventures in developing countries. New York: Routledge. Bell, M. (1984). Learning and the accumulation of industrial technology capacity in developing countries. In L. King, & M. Fransman (Eds.), Technological Capacity in the Third World (pp. 187-209). London: McMillan. Bell, M., & Pavitt, K. (1993). Technological accumulation and industrial growth: Contrasts between developed and developing countries. Industrial and Corporate Change, 2(2), 157-210. Bell, M., & Pavitt, K. (1995). The development of technological capabilities. In I. U. Haque (Ed.), Trade, technology and international competitiveness (pp. 69-101). Berg, S. V., Duncan, J., & Friedmam, P. (1982). Joint-venture strategies and corporate innovation. Cambridge: Oelgschlager, Gunn, and Hain. Bernard, H. R. (2000). Social research methods: Qualitative and quantitative approaches. London: Sage. Bierly, P., & Chakrabarti, A. (1996). Technological learning, strategic flexibility, and new product development. IEEE Transactions on Engineering Management,43(4), 368-380. Binh, T. T., & Linh, N. M. (2011). Development of automotive industries in Vietnam with improving the network capability. ERIA Research Project Report 2010, 9, 273-307. BOI (Thailand Board of Investment) (2011). Incentives. Thailand Board of Investment.RetrievedAugust 21, 2011, fromhttp://www.boi.go.th/index.php?page=incentive Borrego, M., Douglas, E. P., & Amelink, C. T. (2009, January). Quantitative, qualitative, and mixed research methods. Journal of Engineering Education, 98(1), 53-66. Boulding, K. E. (1956). General Systems Theory–The Skeleton of Science. Management Science, 2, 197-208.
241
Brayman, A. (2004). Social research methods (2nd ed.). Oxford: Oxford University. Brimble, P., & Doner, R. (2007). University-industry linkages and economic development: The case of Thailand. World Development, 35, 1021-1036. Brown, R. A. (2004). Technology transfers and technology linkage. Tech Future, 5(24), 5-10. Buckley, P. J., & Casson, M. (1976).The future of the multinational enterprise. New York: Holmes & Meier. Buckley, P. J., & Casson, M. (1988). A theory of cooperation in international business. In F. J. Contractor, & P. Lorange (Eds.), Cooperative strategies in international business: Joint ventures and technology partnerships between firms. Lexington: Lexington. Bunhlua, J., & Chan, P. (2006). Innovation in the automotive industry in Thailand. International Business & Economics Research Journal, 5(5), 29-40. Burgelman, R. A., Maidique, M. A., & Wheelwright, S. C. (1996). Strategic Management of Technology and Innovation., Chicago: Times Mirror Higher Education Group. Burgers, W. P., Hill, C. W. L., & Kim, W. C. (1993). A theory of global strategic alliances: The case of the global auto industry. Strategic Management Journal, 14(6), 419-431. Burn, J., Saxena, K. B., Ma, L., & Cheung, H. K. (1993, March). Critical issues in information system management in Hong Kong: a cultural comparison. Journal of Global Information Management,1(4), 23-46. Burton, F., & Saelens, F. (1989). International alliances as a strategic tool of Japanese electronic companies. Harvard Business Review, 67(2), 58-69. Calcantone, R. J., Benedetto, C. A., & Divine, R. (1993). Organisational, technical and marketing antecedents for successful new product development. R&D Management, 23(4), 337-349. Chandler, G. N. (1996). Business Similarity as a Moderator of the Relationship Between Pre-Ownership Experience and Venture Performance. Entrepreneurship Theory and Practice, 20, 51-65. Charoenporn, P. (2001). Automotive part procurement system in Thailand: A comparison of American and Japanese companies. Bangkok: Thammasat University Chesbrough, H. (2006). Open Innovation: The New Imperative for Creating and Profiting from Technology. Boston: Harvard Business School.
242
Cho, D., & Yu, P. (2000). Influential factors in the choice of technology acquisition mode: an empirical analysis of small and medium size firms in Korean telecommunication industry. Technovation, 20(2), 691–704. Ciborra, C. (1991). Alliances as learning experiences: Competition and change in high-tech Industries. In L. Mytelka (Ed.), Strategic partnerships and the world economy. London: Pinter. Cohen, W. M., & Levinthal, D. A. (1989). Innovation and learning: The two faces of R&D. Economic Journal, Royal Economic Society, 99(397), 69-96. Cohen, W. M., & Levinthal, D. A. (1990). Absorptive capacity: A new perspective on learning and innovation. Administrative Science Quarterly, 35L, 128-152. Contractor, F. J., & Lorange, P. (1988). Why should firms cooperate? The strategy and economic basis for cooperative ventures. In F. J. Contractor, & P. Lorange (Eds.), Cooperative strategies in international business: Joint ventures and technology partner ships between firms. Lexington: Lexington. Cooper, R. G. (1980). Project newprod: Factors in new product success. European Journal of Marketing, 14(5/6), 277-291. Cooper, R. G. (2003). Profitable product innovation: The critical success factors. In L. V. Shavinina (Ed.), The international handbook on innovation. Oxford: Pergamon. Cooper, R. G., & Kleinschmidt, E. J. (1987). New products: What separates winners from losers. Journal of Product Innovation Management, 4(3), 169-184. Cottam, A., Ensor, J., & Band, C. (2001). A benchmark study of strategic commitment to innovation. European Journal of Innovation Management, 4, 88-94. Cragg, P. B., & King, M. (1993, March). Small-firm Computing: Motivators and Inhibitors. MIS Quarterly, 17(1), 47-59. Creswell, J. W. (2003). Research design: Qualitative, quantitative, and mixed-methods approaches. Thousand Oaks: Sage. Creswell, J. W., Plano Clark, V. L., Gutmann, M. L., & Hanson, W. E. (2003). Advanced mixed methods research designs. In A. Tashakkori, & C. Teddlie (Eds.), Handbook of mixed methods in social and behavioral research (pp. 209-240). Thousand Oaks: Sage. Czinkota, M. R., Ronkainen, I. A., & Moffett, M. H. (1994). International business (3rd ed.). Fort Worth: The Dryden. Czinkota, M. R., Ronkainen, I. A., & Moffett, M. H. (2005). International Business (7th ed.). Ohio: Thomson South-Western.
243
Daft, R. L. (2010). Organization Theory and Design (10th ed.). Cincinnati: Cengage. Daft, R. L., & Huber, G. P. (1987). How organizations learn: A communication framework. Research in the Sociology of Organizations,5, 1-36. Dahlman, C., & Westphal, L. E. (1982). Technological effort in industrial development: An interpretative survey of recent research. In F. Stewart, & J. James (Eds.), The economics of new technology in developing countries (pp. 105-137). London: McMillan. Dahlman, C., Ross-Larson, B., & Westphal, L. E. (1987). Managing technological development:Lessons from the newly industrializing countries. World Development,15(6), 759-775. Das, T. K., & Teng, B. (2007).Risk types and inter-firm alliance structures. Journal of Management Studies, 33(6), 827-843. Datta, D. K. (1991). International joint ventures: A framework for analysis. In H.Vernon-Wortzel, & L. H. Wortzel (Eds.), Global strategic management: The essentials. New York: John Wiley & Sons. David, M., & Sutton, D. C. (2004). Social research: The basics. London: Sage. Davidsson, C. (2010, Jan 20). Toyota predicts 9% growth in 2010. Thailand Business News p.7. Deloitte Touche Tohmatsu (2009). A new era: Accelerating toward 2020 - An automotive industry transformed. Retrived May 15, 2010, from http://www.deloitte.com/assets/Dcom-Global/Local%20Assets/Documents/A%20New%20Era_Online_final.pdf. Dewar, R. D., & Dutton, J. E. (1986). The adoption of radical and incremental innovations: an empirical analysis. Management Science, 32(11). 1422-1433. Diamantopoulos, A., & Schlegelmilch, B. B. (1997). Taking the fear out of data analysis. London: The Dryden. Dodgson, M. (1991). Technology learning, technology strategy, and competitive pressures. British Journal of Management, 2(3), 132-149. Dodgson, M. (1993a). Technological collaboration in industry: Strategy, policy and internationalization in innovation. London and New York: Routledge. Dodgson, M. (1993b). Organizational learning: A review of some literature. Organizations Studies,14(3), 375-394. Dodgson, M. (2000). Policies for science, technology and innovation in Asian newly industrializing economies. In L. Kim, & R. Nelson (Eds.), Technology, learning and innovation. Cambridge: Cambridge University.
244
Doner, R. F. (1991). Driving a bargain: Automobile industrialization and Japanese firms in Southeast Asia. Berkeley: University of California. Doner, R. F., & Schneider, B. (2000). The new institutional economics, business associa tions and development. Geneva: International Labour Organisation. Doner, R. F., Noble, G. W., & Ravenhill, J. (2004). Production networks in East Asia’s automobile parts industry. In S. Yusuf, M. A. Altaf, & K. Nabeshima (Eds.), Global production networking and technological change in East Asia (pp. 159-208). World Bank, DC: Oxford University. Dörnyei, Z. (2007). Research methods in applied linguistics: Quantitative, qualitative, and mixed methodologies. Oxford: Oxford University. Dosi, G. (1988). The nature of innovative process. In G. Dosi, R. R. Nelson, G. Silverberg, & L. Soete (Eds.), Technical change and economic theory. London: Printer. Dosi, G., Nelson, R. R., & Winter, S. (2000). The nature and dynamics of organisational capabilities. Oxford: Oxford University. Doyle, C., Reed, J., Woodcock, T., & Bell, D. (2010). Understanding what matters to patients – identifying key patients’ perceptions of quality. JRSM Short Rep,1(1), 1-11. Drucker, P. F. (1985). Innovation and entrepreneurship (1st ed.). New York: HarperCollins Publishers. Drucker, P. F. (1995, March). The network society. Wall Street Journal, 29, 12. Dufficy, M. (2001). Training for success in a new industrial world. Industrial and Commercial Training, 33(2), 48-53. Dunning, J. H. (1997). Alliance capitalism and global business. London: Routledge. Dunning, J. H. (1998). The new style multinational-circa the late 1980s and early 1990s’. In J. H. Dunning (Ed.), Explaining international production. London: Unwin Hyman. ESCAP(Economic and social commission for Asia and the pacific)(2002). Development of the automotive sector in selected countries of the ESCAP region. Proceedings and country papers presented at the Regional Consultative Meeting on Promotion of Intraregional Trade and Economic Cooperation in the Automotive Sector. United Nations. Fichman, R. G., & Kemerer, C. F. (1997). The assimilation of software process innovations: An organizational learning perspective. Management Science, 43(1), 1345-1363.
245
Forbes, N., & Weid, D. (2002). From followers to leaders: Managing technology and innovation. London: Routledge. Freeman, C. (1982a). The economics of industrial innovation. London: Penguin. Freeman, C. (1982b). Unemployment and technical innovation: A study of long waves and economic development. Westport: Greenwood. Gibbons, M., Limoges, C., Nowotny, H., Schwartzman, S., Scott, P., & Trow, M. (1994). The new production of knowledge: The dynamics of science and research in contemporary societies. London: Sage. Gillham, B. (2000). The research interview. London: Continuum.
Glass, A. J., & Saggi, K. (2002). Multinational Firms and Technology Transfer. The Scandinavian Journal of Economics, 104(4), 495 - 513. Glazer, R. (1991, October). Marketing in an information-intensive environment: Strategic implications of knowledge as an asset. Journal of Marketing, 55, 1-20. Glynn, M. A. (1996). Innovative genius: A framework for relating individual and organizational intelligences to innovation, Academy of Management Review, 21(4), 1081-1111. Grant, R. M. (1991). The Resource-Based Theory of Competitive Advantage: Implications for Strategy Formulation. California Management Review, 33(3), 114–135 Gray, C., & Yan, A. (1997). Formation and evolution of international joint ventures: Examples from U.S.-Chinese partnerships. In P. W. Beamish, & J. P. Killing (Eds.), Cooperative strategies: Asian Pacific perspectives. San Francisco: The New Lexington. Greiner, L. E. (1972). Evolution and Revolution as Organizations. Harvard Business Review, 50(4). Gubriel, R. (2002). Impact of Innovation and Technology Transfer on Economic Growth: The Central and Eastern Europe Experience. Retrieved May 19, 2010, from European Association of Development Research and Training Institutes: www.eadi.org/fileadmin/WG_Documents/Reg_WG/gurbiel.pdf Gulati, R. (1995). Does familiarity breed trust? The implications of repeated ties for contractual choice in alliances. Academy of Management Journal,38, 85-112. Hagedoorn, J. (1993). Understanding the Rationale of Strategic Technology Partnering: Inter-organizational modes of cooperation and sectoral differences. Strategic Management Journal, 14, 371-385.
246
Hair, J. F., Bush, R. P., & Ortinau, D. J. (2000). Marketing research: A practical approach for the new millennium. Singapore: McGraw-Hill. Hakura, D., & Jaumotte, F. (1999). The role of inter-and intra-industry trade in technology diffusion. Unpublished Working Paper, IMF: Washington, D.C. Hall, A. (1995). A structure for organizational learning. Journal of Technology Transfer, 20, 11-19. Hall, R. H. (1996). Organizations: Structures, processes, and outcomes. Englewood Cliffs: Prentice-Hall International. Hamel, G. (1990). Competitive collaboration: Learning, power, and dependence in international strategic alliances. Unpublished doctoral dissertation, The University of Michigan: Michigan. Hamel, G. (Ed.). (1991, Summer). Competition for competence and inter-partner learning within international strategic alliances [Special issue]. Strategic Management Journal, 112, 83-103. Han, K. S., Lee, M. J., & Jeon, B. (2002). An Integrated Model of the Adoption of e - Commerce and the Extent of e - Commerce Development: The Case Study of the Small and Medium - size Firms in Korea. Korean Small Business Review, 24(2), 3-29. Harrigan, K. R. (1988). Joint ventures and competitive strategy. Strategic Management Journal,9(2), 141-158. Heide, J. B., & Miner, A. S. (1992). The shadow of the future: Effects of anticipated interaction and the frequency of contact on buyer-seller cooperation. Academy of Management Journal, 35, 265-291. Hergert, M., & Morris, D. (1988). Trends in international collaborative agreements. In F. Contractor, & P. Lorange (Eds.), Cooperative strategies in international business. Lexington: Lexington. Hill, C. W. (1990). Cooperation, opportunism, and the invisible hand: Implications for transaction cost theory. Academy of Management Review,15(3), 500-513. Hill, C. W. L. (1994). International business: Competing in the global marketplace. Burr Ridge: Irwin. Hill, C. W. L. (2007). International business - Competing in the global market place (6th ed.). Irwin: McGraw-Hill. Hobday, M. (1995). Innovation in East Asia: The challenge to Japan. England: Edward Elgar-Aldershot.
247
Hobday, M., Rush, H., & Bessant, J. (2004). Approaching the innovation frontier in Korea: The transition phase to leadership. Research Policy,33(10), 1433-1457. Hosmer, L. T. (1995). Trust: The connecting between organizational theory and philosophical ethics. Academy of Management Review, 20(2), 379-403. Huber, G. P. (1991). Organizational learning: The contributing processes and the literatures. Organization Science, 2(1), 88-115. Humphrey, J., & Memedovic, O. (2003). The global automotive industry value chain: What prospects for upgrading by developing countries. Vienna: United Nations Industrial Development Organization. Humphrey, J., & Oeter, A. (2000). Motor industry policies in emerging markets: Globalisation and the promotion of domestic industry. In J. Humphrey, Y. Lecler, & M. S. Salerno (Eds.), Global strategies and local realities: The auto industry in emerging markets. New York: St. Martin's. Hymer, S. (1960). The international operations of national firms: A study of foreign direct investment. Cambridge: MIT. Hymer, S. H. (1968). La grande multinationale. Revue Economique, 14(b), 949-973. IAC. (2010). Climate change assessments: Review of the processes and procedures of the IPCC. Inter Academy Council: Amsterdam, The Netherlands. Inkpen, A. (1995). The management of international joint ventures: An organizational learning perspective. London: Routledge. Inkpen, A. (1997). An examination of knowledge management in international joint ventures. In P. W. Beamish, & J. P. Killing (Eds.), Cooperative strategies: North American perspectives. San Francisco: The New Lexington. Inkpen, A. C., & Beamish, P. W. (1997). Knowledge, bargaining power, and the instability of international joint ventures. Academy of Management Review, 22(1), 177-202. Inkpen, A., & Crossan, M. M. (1995). Believing is seeing: Joint ventures and organizational learning. Journal of Management Studies, 32, 595-618. International Monetary Fund (2011, September). World Economic Outlook, 202. International Trade Centre. (2010). Thailand in global automobile networks. Export import for good: The development partner for small business export success in developing countries. Geneva: International Trade Centre.
248
Jensen, M. C., & Meckling, W. H. (1992). Specific and general knowledge, and organizational structure. In L. Werin, & H. Wijkander (Eds.), Contract Economics, Oxford: Blackwell. Johansson, B., & Lööf, H. (2008). The impact of firm’s R&D strategy on profit and productivity. (CESIS electronic working paper series 156). Stockholm: Centre of excellence for science and innovation studies. Johne, A. F., & Snelson, P. A. (1988). Success factors in product innovation: A selective review of the literature. Product Innovation Management, 5, 114-128. Kale, D. (2005). Developing a knowledge creation capability for innovation: The case of Indian pharmaceutical industry. Unpublished doctoral thesis, Open University: Milton Keynes. Kanlaya, V. (2010). Analysis of advance statistics with SPSS for Windows (9th ed.). Bangkok: Thammasart. Kaosa-ard, M.S. (1993). TNC involvement in the Thai auto industry. TDRI QuarterlyReview,8(1), 9-16. Katz, J. (1987). Technology generation in Latin American manufacturing industries. London: McMillan. Kessler, E. H., Bierly, P. E., & Gopalakrishnan, S. (2000). Internal vs. external learning in new product development: Effects on speed, costs and competitive advantage. R&D Management, 30(3), 213-223. Khenkum, S. (2007, April-June). BOI and Its Important Roles in Promoting Investors in Global Business Arenas. Thailand Illustrated, 24(2), 12-16. Killing, J. P. (1983). Strategies for joint venture success. New York: Praeger. Kim, D. H. (1993). The link between individual and organizational learning. Sloan Management Review, 33(1), 37-50. Kim, L. (1999). Management of technology in developing countries: Lessons for Africa (Paper produced for ECA in the framework of "Visiting Scholar" scheme). Ethiopia: Addis Ababa. Kim, S.G., & Ro, K.K. (1995). A strategic technology management model under different technology acquisition modes between developing-countries—the case of telecommunications in Korea and China. International Journal of Technology Management,10(7-8), 767-776. Kindleberger, C. P. (1969). American business abroad. New Haven: Yale University. Kleinschmidt, E. J., & Cooper, R. G. (1991). The impact of product innovativeness on performance. Journal of Product Innovation Management, 8, 240-251
249
Kogut, B. (1988). Joint ventures: Theoretical and empirical perspectives. Strategic Management Journal, 9(2), 319-332. Kogut, B. (1989). The stability of joint ventures: Reciprocity and competitive rivalry. Journal of Industrial Economics, 38(2), 183-197. Konan, D. E. (1996, March). The need for common investment measures within ASEAN. ASEAN Economic Bulletin, 12(3), 339-350. Krüger, V. (1996). How can a company achieve improved levels of quality performance: technology versus employees?The TQM Magazine, 8(3), 11-20. Lall, S. (1987). Learning to industrialise: The acquisition of technology capability by India. London: MacMillan. Lall, S. (1992). Technological capabilities and industrialisation. World Development, 20(2), 165-186. Lall, S. (1997). Investment, technology and international competitiveness. In J. H. Dunning and K. A. Hamdani (Eds.), The new globalism and developing countries. Tokio, NY, Paris: United Nations University Press. Laosirihongthong, T., Paul, H., & Speece, M. W. (2003). Evaluation of new manufacturing technology implementation: An empirical study in the Thai automotive industry. Technovation, 23, 321–331. Lau, T. J. (2006, Spring). Distinguishing fiction from reality: The ASEAN free trade area and implications for the global auto industry. University of Dayton Law Review, 31(3), 453-476. Lei, D. (1997). Offensive and defensive uses of alliances. In H. Vernon-Wortzel, & L. H. Wortzel (Eds.), Strategic management in a global economy. New York: John Wiley & Sons. Levinthal, D. A., & Fichman, M. (1988). Dynamics of interorganizational attachments: Auditor-Client relationships. Administrative Science Quarterly, 33, 345-369. Liebetrau, A. M. (1983). Series: Quantitative Applications in the Social Sciences. California: Sage. Lin, J. Y. (2003, January). Development Strategy, Viability, and Economic Convergence. Economic Development and Cultural Change, 53(2), 277-308. Lin, P., & Saggi, K. (2007). Multinational firms, exclusivity, and backward linkages. Journal of International Economics, 71(1), 206-220. Lind, D. A., Marchal, W. G., & Wathen, S. A. (2005). Statistical Techniques in Business & Economics (12th ed.). New York: McGraw-Hill/Irwin.
250
Link, P. (1987). Keys to new product success and failure. Journal of Industrial Marketing Management, 16, 109-118. Longman Business English Dictionary (ELT Dictionaries). (2008). In J. C.Adam (Ed.),Business Dictionary, Essex: Pearson Education Limited. Loveridge, R., & Pitt, M. (1990). The strategic management of technological innovation. Chichester: Wiley. Lyles, M. A., & Salk, J. E. (1997). Knowledge acquisition from foreign parents in inter national joint ventures: An empirical examination in the Hungarian context. In P. W. Beamish, & J. P. Killing (Eds.), Cooperative strategies: European perspectives. San Francisco: The New Lexington. Madhok, A. (1995, First quarter). Revisiting multinational firms’ tolerance for joint ventures: A trust-based approach. Journal of International Business Studies, 26, 117-137. Maidique, M. A., & Patch, P. (1988). Corporate strategy and technology policy. In M. L. Tushman, W. L. Moore, & L. Ballinger (Eds.), Reading in the Management of Innovation (2nd ed., pp. 326-248). Cambridge: Balinger. Maidique, M. A., & Zirger, B. J. (1984). A study of success and failure in product innovation: The case of US electronics industries. EEE Transactions on Engineering Management, 31(4), 192-203. Maidique, M. A., & Zirger, B. J. (1985). The new product learning cycle. Research Policy, 14, 299-313. Maira, A., & Scott-Morgan, P. (1997). The accelerating organization: Embracing the human face of change. New York: McGraw-Hill. Malhotra, N., & Birks, D. (2000). Marketing research: An applied approach (4th ed.). London: Prentice Hall. Mark E. S., & Araujo, L. (1999). Organizational learning: Current debates and opportunities. In M. Easterby-Smith, L. Araujo, & J. Burgoyne (Eds.), Organizational learning and the learning organization (pp. 1-21). London/Thousand Oaks/New Delhi: Sage. Maxwell, J. A. (1996). Qualitative research design:An interactive approach. London: Sage. McKelvey, M. (1998). Evolutionary innovations: Learning, entreneurship and the dynamics of the firm. Journal of Evolutionary Economics, 8, 157-175. Merriam, S. B., & Caffarella, R. S. (1999). Learning in adulthood: A comprehensive guide. (2nd ed.). San Francisco, CA: Jossey-Bass.
251
Miles, M. B., & Huberman, A. M. (1994). Qualitative data analysis: An expanded sourcebook (2nd ed.).California: Sage. Ministry of Commerce. (2009). StatisticAnnual Report for the year 2008. Bangkok: Information Centre of Ministry of Commerce. Modell, S. (2009). In defence of triangulation: A critical realist approach to mixed methods research in management accounting. Management Accounting Research, 20, 208–221. Mowery, D., & Rosenberg, N. (1998). Paths of innovation: Technological change in 20th century America. Cambridge: Cambridge University. Narayanan, K. (1998). Technology acquisition, de-regulation and competitiveness: a study of Indian automobile industry. Research Policy, 27, 215–228 Neuman, W. L. (2003). Social research methods: Qualitative and quantitative approaches (5th ed.).Boston: Pearson. Nonaka, I., & Takeuchi, H. (1995). The knowledge-creating company. Oxford: Oxford University. Oh, J. (1996). Global strategic alliances in the telecommunications industry. Telecommunication Policy, 20(9), 713-720. Okazaki, S. (2005). Mobile advertising adoption by multinationals: Senior executives’ initial responses. Internet Research, 15(2), 160-180. Onwuegbuzie, A. J., & Leech, N. L. (2004). Enhancing the interpretation of “significant” findings: The role of mixed methods research. The Qualitative Report, 9(4), 770-792. Osborn, R. N., & Hagedoorn, J. (1997). The institutionalization and evolutionary dynamics of inter-organizational alliances and networks. Academy of Management Journal, 40(2), 261-278. Ovans, L. (1998). The customer doesn’t always know best. Market Research, 7(3), 12-14. Padilla-Perez, R. (2008). A regional approach to study technology transfer through foreign direct investment: The electronics industry in two Mexican regions. Research Policy, 37(5), 849-860. Parkhe, A. (1991). Interfirm diversity, organizational learning, and longevity in global strategic alliances. Journal of International Business Studies, 22, 579-601. Patarapong, I., & Peerapol, S. (2005, May). Foreign direct investment in R&D in Thailand: Evolution and challenges. Paper presented at the meeting of ASEAN/UNCTAD Seminar on Attracting Quality FDI.
252
Pate, J. L. (1969). Joint venture activity, 1960-1968. In Federal Reserve Bank of Cleveland (Ed.), Economic Review (pp. 16-23). PBM SIG (The performance-based management special interest group) (2001). Establishing an integrated performance measurement system. Vol.2. The performance-based management handbook: A six-volume compilation of techniques and tools for implementing the government performance and results act of 1993. Retrieved June 10, 2010, from: http://www.orau.gov/pbm. Peduzzi, P., Concato, J., Kemper, E., Holford, TR., & Feinstein, A. R. (1996). A simulation study of the number of events per variable in logistic regression analysis. Journal of Clinical Epidemiology, 49(12), 1373-1379. Peter, B., Lee, G., & Sohal, A. S. (1999). Lessons for implementing AMT: Some case experience with CNC in Australia, Britain and Canada. International Journal of Operation and Production Management, 19(5/6), 515-526. Pinto, J. K., & Slevin, D. P. (1989). Critical success factors in R&D projects. Research Technology Management, 32(1), 31-35. Porter, M. E. (1998). On competition. Boston: Harvard Business School. Porter, M. E., & Fuller, M. B. (1986). Coalitions and global strategy. In M. E. Porter (Ed.), Competition in global industries. Boston: Harvard Business School. Powell, A. W., Koput, K. W., & Smith-Doerr, L. (1996). Interorganizational collaboration and the locus of innovation: Networks of learning in biotechnology. Administrative Science Quarterly, 41, 116-145. Prajogo, D. I., & Sohal, A. S. (2006). The relationship between organization strategy, total quality management (TQM), and organization performance– the mediating role of TQM. European Journal of Operational Research, 168(1), 35-50. Price, R. M. (1996, Spring). Technology and strategic advantage. California Management Review, 38, 38-56. Pucik, V. (1991). Technology transfer in strategic alliances: Competitive collaboration and organizational learning. In T. Agmon, & M. A. Von Glinow (Eds.), Technology transfer in international business. New York: Oxford University. Pucik, V. (1992). Strategic alliances, organizational learning, and competitive advantage: The HRM agenda. In V. Pucik, N. M. Tichy, & C. K. Barnett (Eds.), Globalizing management: Creating and leading the competitive organization. New York: John Wiley and Sons. Quinn, J. B. (1992). Intelligent enterprise. New York: Free.
253
Quinn, R. E., & Rohrbaugh, J. (1983). A spatial model of effectiveness criteria: Towards a competing values approach to organizational analysis. Management Science, 29, 363-377. Rath, A. (1990). Science, technology, and policy in the periphery: A perspective from the center. World Development, 18(11), 1429-1443. Ray, A. S. (2008). Emerging through technological capability: An overview of India’s technological trajectory. (Working Paper No.227). New Delhi: Indian council for research on international economic relations. Revesz, R. T., & Cauley, M. L. (1986, July). Competitive alliances: Strategy for global markets. Business International, 1-3. Ring, P. S., & Van de Ven, A. H. (1994). Developmental processes of cooperative inter-organizational relationships. Academy of Management Review, 19, 90-118. Robbins, S. P. (2005). Essentials of organizational behavior (8th ed.). New Jersey: Pearson Prentice Hall. Robins, S.P., & Judge, T.A. (2008). Organization behavior (12th ed.). Upper Saddle River, NJ: Pearson Prentice Hall. Robson, C. (1993). Real world research: A resource for social scientists and practitioner researchers. London: Blackwell. Robson, C. (2002). Real world research (2nd ed.). Hong Kong: Blackwell. Root, F. R. (1988). Some taxonomies of international cooperative arrangements. In F. J. Contractor, & P. Lorange (Eds.), Cooperative strategies in international business: Joint ventures and technology partnerships between firms. Lexington: Lexington. Rosenberg, N. (1982). Inside the black box: Technology and economic. Cambridge: Cambridge University. Rugman, A. M. (1981). Inside the multinationals. New York: Columbia University. Rugman, A. M. (1986). New theories of the multinational enterprise: An assessment of Internalization theory. Bulletin of Economic Research, 38(2), 3307-3378. Sandelowski, M. (2003). Tables or tableaux? Writing and reading mixed methods studies. In A. Tashakkori, & C. Teddlie (Eds.), Handbook of Mixed Methods in Social and Behavioral Research (pp. 321-350). Thousand Oaks, CA: Sage. Sarantakos, S. (1993). Social research (2nd ed.). London: MacMillan.
254
Sarkar, M., Cavusgil, S. T., & Evirgen, C. (1997). A commitment-trust mediated frame work of international collaborative venture performance. In P. W. Beamish, & J. P. Killing (Eds.), Cooperative strategies: North American perspectives. San Francisco: The New Lexington. Saunders, L., Stoney, S., & Weston, P. (1997). The impact of the work-related curriculum on 14- to 16- year-olds. Journal of Education & Work, 10, 151-167. Saunders, M., Lewis, P., & Thornhill, A. (2003). Research Methods for Business Students. Essex: Pearson. Scott-Kemmis, D., & Bell, M. (1985). Technological capability and technical change: Case studies. Brighton: SPRU. Seabright, M. A., Levinthal, D. A., & Fichman, M. (1992). Role of individual attachments in the dissolution of inter-organizational relationships. Academy of Management Journal, 35, 122-160. Seaton, R. A. F., & Cordey-Hayes, M. (1993). The development and application of interactive models of industry technology transfer. Technovation, 13(1), 45-53. Simon, H. A. (1991). Bounded rationality and organizational learning. Organization Science, 2, 125-134. Simonin, B. L. (1991). Transfer of knowledge of international strategic alliances: A structural approach. Unpublished doctoral dissertation, The University of Michigan: Ann Arbor. Simonin, B. L., & Helleloid, D. (1993). Do organizations learn? An empirical test of organizational learning in international strategic alliances. In D. Moore (Ed.), Academy of Management Best Paper Proceedings (pp. 222-226). Briarcliff Manor, NY: Academy of Management. Sinkula, J. M. (1994). Market information processing and organizational learning. Journal of Marketing, 58, 35-45. Slater, S. F., & Narver, J. C. (1995). Market orientation and the learning organization. Journal of Marketing, 59, 63-74. Somekh, B., & Lewin, C. (2005). Research methods in social sciences. London: Sage. Stewart, F. (1979). International technology transfer: Issues and policy options (Working Paper 1979-344). Washington: World Bank. Stimpson, M. (2006, September). Logistically – Thailand as a Transport Hub. Thai-American Business, 29-31.
Straub, D. (1994). The effect of culture on IT diffusion: E-mail and fax in Japan and US. Information Systems Research, 27, 23-47.
255
Stuart, R., & Abetti, P. A. (1987). Start-up venture: Towards the prediction of initial success. Journal of Business Venturing, 2, 215-230. Takayasu, K., & Mori, M. (2004). The global strategies of Japanese vehicle assemblers and the implications for the Thai automobile industry. In S. Yusuf, M. A. Altaf, & K. Nabeshima (Eds.), Global production networking and technological change in East Asia (pp. 210-253). Washington: World Bank. Tanaphat, I. (2002). Regulation: Tools supporting Automotive Industry? Unpublished Working Paper, Kasetsart University: Bangkok. Tatikonda, M.V., & Stock, G.N. (2003). Product Technology Transfer in the Upstream Supply Chain. Journal of Product Innovation Management,20(5), 444-467. Techakanont, K. (2003). Globalization strategy of assemblers and changes in inter-firm technology transfer in the Thai automobile industry (Working paper 2003-23). Kitakyushu: The International Centre for the Study of East Asian Development. Techakanont, K. (2011). Thailand automotive parts industry. In M. Kagami (Ed.), Intermediate goods trade in East Asia: Economic deepening through FTAs/EPAs (BRC Research Report No.5). Bangkok: Bangkok Research Centre. Teitel, S. (1984). Technology creation in semi-industrial economics. Journal of Development Economics, 16(1-2), 39-61. Teo, T., & Pian, Y. (2003). A contingency perspective on internet adoption and competitive advantage. European Journal of Information Systems, 12, 78-92. Teo, T., & Pian, Y. (2004). A model for web adoption. Information and Management, 41, 457-468. Thai Automobile Industry Association (2007). Annual Report 2006. Bangkok: Thai Automobile Industry Association. Thai Automobile Industry Association (2010). Automotive industry as the leading role to increase value of productions. Bangkok: Thai Automobile Industry Association. Thai Automotive Institute (2009).Local Employment in Automotive industry. Retrieved November 22, 2009, from http://www.thaiauto.or.th/about_us/localemp.html Thorelli, H. B. (1986). Networks: Between markets and hierarchies. Strategic Management Journal, 7, 37-51. Timmer, M. P. (2003). Technological development and rates of return to investment in a catching-up economy: The case of South Korea. Structure Change and Economic Dynamics, 14(4), 405-425.
256
Trott, P. (2005). Innovation management and new product development (3rd ed.). United Kingdom: Prentice Hall-Financial Times. UN ESCAP (1992). Training manual on capacity building for adoption of environmental management systems (ISO 14000) (The United Nations Conference on Environment and Development). Rio de Janerio: UNCED. UNIDO (United Nations Industrial Development Organization)(2010).Impact of the Global Economic Crisis on the Thai Automotive Industry: From the Perspective of the Interplay between Shocks and the Industrial Structure.Research and Statistics Branch. Programme Coordination and Field Operations Division. University of Toronto: Faculty of Arts & Science. (2012). Crosstabulation with nominal variables. Toronto: University of Toronto. Urata, S., & Kawai, H. (2000). Intrafirm technology transfer by Japanese manufacturing firms in Asia. National Bureau of Economic Research, 9, 49-77. Van der Panne, G., Van de Beers, C., & Kleinknecht, A. (2003). Success and failure of innovation: A review of literature. International Journal of Innovation Management, 7(3), 309-338. Vernon, R. (1966). International investment and international trade in the product life cycle. Quarterly Journal of Economics, 80, 190-207. Veryzer, R. W. (2003). Marketing and the development of innovative new products. In L. V. Shavinina (Ed.), International handbook on innovation (pp. 845-855). New York: Pergamon/Elsevier Science. Vimoktanon, B., & Piyawan, P. (1994). The use of computer for accounting in five star hotels in Bangkok. Chulalongkon Varasa, 3(12), 86-91. Voss, C. A. (1985). Determinants of success in the development of application software. Journal of Product Innovation Management, 2, 122-129. Wei, L. (1995). International technology transfer and development of technological capabilities: A theoretical framework. Technology in Society, 17(1), 103-120. Weir, C. J. (2005). Language Testing and Validation: An Evidence-Based Approach. Basingstoke: Palgrave Macmillan. Wenger, E. (2007). Communities of practice. Retrieved January 14, 2009, from http://www.ewenger.com/theory/
257
Westney, E. (1988). Domestic and foreign learning curves in managing international co operative strategies. In F. Contractor, & P. Lorange (Eds.), Cooperative strategies in international business. Lexington: Lexington. Westphal, L. E. (2002). Technology strategies for economic development in a fast changing global economy. Economics for Innovative New Technologies, 11(4-5), 275-320. Wilson, G. (2006). Beyond the technocrat? The professional expert in development practice. Development and Change, 37(3), 501-23. Yamaguchi, T. (1994). Cross cultural technology transfer in Taiwan and Thailand from the view point of the technology supplier:Research finding report.In Proceedings for the workshop on impact of cultural difference on cross cultural transfer. China Productivity Center: China. Yasamutr, S. (2000). How to improve productivity for the Thai auto-part industry. Banking and Industry, 4(19), 33-40. Yavas, B. F., & Rezayat, F. (2003). The Impact of Culture on Managerial Perceptions of Quality. International Journal of Cross Cultural Management, 3(2), 213-234. Zahra, S. A., & George, G. (2002). Absorptive capacitive capacity: A review, re-conceptualisation, and extension. Academy of Management Review, 27(2), 185-203. Zahra, S. A., & George, G. (2003). International entrepreneurship research: What scope for international business theories? Journal of International Entrepreneurship, 1(1), 31-42. Zikmund, W. G., & Babin, B. J. (2007). Exploring marketing research (9th ed.). Ohio: Thomson South-Western.
258
Appendices
Appendix I
Example of Semi-Structured Interview Questions for Automotive Industry Executives
for Phase I (Translated from Thai Language)
Mr. Phaibool Poocharoen
Chairman of Automotive Industry Club, The Federation of Thai Industries, Board of
directors of Isuzu Company (Japanese Company).
Questions (60 minutes)
Q1: What does your company support in transferring technology to Thai Auto- part
Company over the past two decade? (Training Center)
A1: In terms of technology transfer, in my opinion, I do not feel that the government has
done anything to support us. They have addressed the policy but have not truly supported
this industry. In the beginning, they started with the idea of import substitution and then they
changed their orientation. That could be one way to promote technology transfer. However,
in my view, this campaign was effective for technical assistance, not for Joint ventures (JV).
It was disappointing to us because we expected it to help us to permanently develop the Thai
automobile industry. Instead, if the government granted appropriate incentives to car makers,
it would attract those companies to purchase parts from Thai companies. For example, in the
past Japanese companies rarely bought parts from Thai companies but recently they became
more interested in taking over Thai manufacturers. Again, I think that the government did not
sincerely support us in terms of taxation, for instance, they did not allow us to deduct R&D
expenses or training expenses from financial statements in order to benefit us in terms of
taxes. Moreover, it is very difficult to bring this issue into a cabinet meeting. From time to
time, the government only said that they were paying attention to this issue but they did not
come up with any actual plan or regulation. The founding of the BOI should help us by
encouraging foreign companies to transfer technology to us, but it might not. In Korea, if any
company intends to sign a contract with foreign company, the Korean government will
259
intervene to protect the interests of the Korean company. In Thailand, people who come to
work in manufacturing are technicians. In fact, they just came to solve problems occurring in
production but their knowledge transferring skill is low. This is only “on the job training.”
Furthermore, Thai workers have also not been ready for technology transfer. It is not that we
have no regulations to force these companies to transfer knowledge and technology. We do
have some. The BOI also launched regulations about what foreign companies have to do in
order to encourage technology transfer but, again, they have not been seriously used.
Therefore, Thailand has never taken advantage of these regulations because the government
is concerned that foreign companies will lose interest in investing in Thailand.
Q2: What are the average percentages of the local contents in your car company?
A2: For trucks, models produced in Thailand are divided into 2 kinds: export trucks and
domestically used trucks. There are some different specs, such as kinds of engine. In
Thailand, we use diesel engines but in the middle east or Australia they mainly use benzyl
engines. In Europe, they use both. The circuits, ECU, and automatic devices, are imported
from outside and the auto frame is produced in Thailand. Gears are parts that the car makers
transfer from their factories in the Philippines. These parts are imported in very high
volumes. Factories produce them as a form of mass production. If there is a low volume, they
will reduce production times to 3-5 months per operation. For instance, truck’s knot, which
requires high technology and skill to produce, also used to be produced in Thailand.
Q3: Do you have your own research and design department which is not adopted from
Japan? What has been produced in that department?
A3: We hire a professional company to work on R&D but it can not reach the level of
producing cars. Mostly, car makers will bring completed cars to Thailand for testing along
with sending them to test in Japan. In Japan, they have a standard testing course. In Thailand,
we do not. In the test, they use sample cars in order to check the initial quality of cars and in
an “Endurance Test.” They could not do that in Thailand. In fact, this is against the law.
They have to find the appropriate private course to take the tests. Another problem is that our
technicians have a low ability to communicate in English, unlike designers. This problem is a
factor in the unsuccessful transfer of “Know How”. Mr. Adisak, a Honda specialist, should
be the person to explain this issue well because his company, which produces motorcycles
260
that make up 70-80% of the Thai market, has a number of R&D centers. Added to that,
Toyota also plan to build a testing course in Thailand since they will locate their center to
Thailand.
Q4: What technology has been transferred to Thai auto parts companies and what has not?
A4: For some production issues, such as gears, it is just molds involved. We want to know
how to make major changes in producing cars. It is about production orientation. Recently,
we discussed more about this issue but the people who came to the meeting could not make
any final decision on this. They were skilled at only the composing not the producing. Since
technology transfer concentrates more on the composers in the past, we had to ask part
manufacturers for a VAVA proposal because we did not have mass production.
Unfortunately, the Japanese technician did not pay attention to many kinds of parts, since,
firstly, they think that the problem falls under standard quality procedures. Secondly, testing
has to take place abroad and has to be done under the head company’s control because we do
not have any standard testing course. As a result, it is harder to reduce the cost of production.
We believe that we can change some processes in the production line but we do not have the
capability to change designs or raw materials. Sometimes, we have a problem with some
processes, such as production of frames; metal is pumped from different factories which have
different levels of quality. This may be caused by molds or time lags in transportation.
Therefore, if the parent company does not truly attend to transfer its technology to us.
Q5: What are the strengths and weaknesses of Thai Auto- part companies compared to other
developing countries such as Korea, China, India, and Malaysia ?
A5: We are good at neat works, not at creativity. Since we do not have any places to take a
test. This cost a lot. The Japanese used to teach us about production and developing control.
They started with Taiwan. The Taiwanese who were taught brought that knowledge which
was to be executed in real situations. For Thai workers, they worked only on what the
technician said. We are good at doing, not at thinking. Unlike, Indian workers keep asking
and asking but after that nothing happened. R&D uses up time, human resources, and
money. A company has to set particular budget for R&D and also has to assign the best
employees to do this job. The company then has to pay a higher wage for those workers. In
some cases, these workers are pursued by other companies. After the financial crisis,
261
American and European companies came to take these high quality workers to work with
them by offering high salaries. Companies that invested in training suffered from that trick.
Some trained workers also resigned from the company to found their own companies to
compete with their old employers. Therefore, a lot of companies cancelled this department
and both testing centres and training centres in order to prevent problems. Consequently,
those companies did not hire people to be spare workers.
Q6: Do you appreciate any of the current government policies (Tax, Regulations, and
Incentives)?
A6: None
Q7: Could you please provide your ideas for policies you would like to see in the future?
A7: As mentioned above, the BOI is trying to support R&D programs. For example, they
support and convince foreign car makers to undertake prototype car testing in Thailand.
However, taking cars to take a test in Thailand involves the payment of high taxes. Therefore,
I believe that having R&D centers in Thailand could help us to solve this problem. Although,
only for 2 times of tax reduction still may not be possible, we are still fighting for that. The
easiest part will be to convince the government not to change their policy for at least 5 years.
Changing policy may impact small companies more directly and seriously than big
companies. In my view, the government should focus on how to assist Thai manufacturers
decreasing the impact of policy changes. For instance, if the government raises the
automobile tax rate which affects car sales and finally affects the demand for spare parts
made in Thailand, some small companies may not be healthy enough to deal with the sudden
decrease of demand and will eventually close their factories. This is the most important
point.
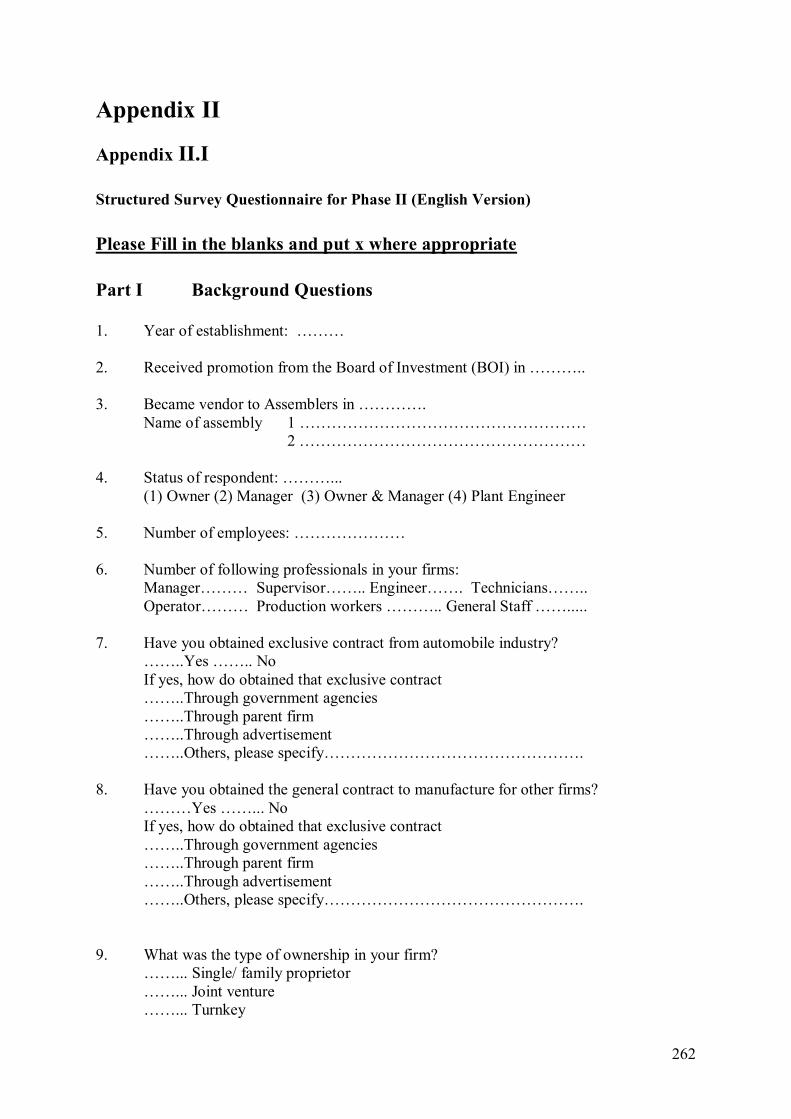
262
Appendix II Appendix II.I Structured Survey Questionnaire for Phase II (English Version) Please Fill in the blanks and put x where appropriate Part I Background Questions 1. Year of establishment: ……… 2. Received promotion from the Board of Investment (BOI) in ……….. 3. Became vendor to Assemblers in …………. Name of assembly 1 ……………………………………………… 2 ……………………………………………… 4. Status of respondent: ………... (1) Owner (2) Manager (3) Owner & Manager (4) Plant Engineer 5. Number of employees: ………………… 6. Number of following professionals in your firms: Manager……… Supervisor…….. Engineer……. Technicians…….. Operator……… Production workers ……….. General Staff ……..... 7. Have you obtained exclusive contract from automobile industry? ……..Yes …….. No If yes, how do obtained that exclusive contract
……..Through government agencies ……..Through parent firm ……..Through advertisement ……..Others, please specify…………………………………………. 8. Have you obtained the general contract to manufacture for other firms? ………Yes ……... No If yes, how do obtained that exclusive contract
……..Through government agencies ……..Through parent firm ……..Through advertisement ……..Others, please specify…………………………………………. 9. What was the type of ownership in your firm? ……... Single/ family proprietor ……... Joint venture ……... Turnkey
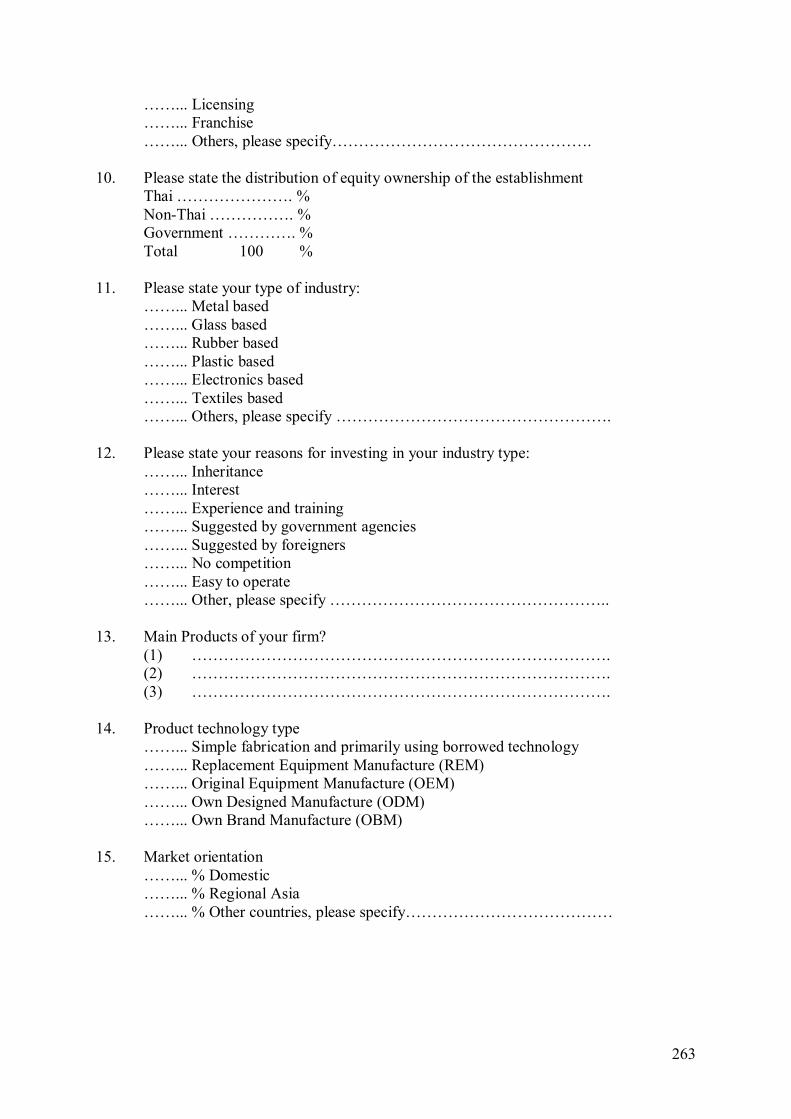
263
……... Licensing ……... Franchise ……... Others, please specify…………………………………………. 10. Please state the distribution of equity ownership of the establishment Thai …………………. % Non-Thai ……………. % Government …………. % Total 100 % 11. Please state your type of industry:
……... Metal based ……... Glass based ……... Rubber based ……... Plastic based ……... Electronics based ……... Textiles based ……... Others, please specify …………………………………………….
12. Please state your reasons for investing in your industry type: ……... Inheritance ……... Interest ……... Experience and training ……... Suggested by government agencies ……... Suggested by foreigners ……... No competition ……... Easy to operate ……... Other, please specify …………………………………………….. 13. Main Products of your firm?
(1) ……………………………………………………………………. (2) ……………………………………………………………………. (3) …………………………………………………………………….
14. Product technology type ……... Simple fabrication and primarily using borrowed technology ……... Replacement Equipment Manufacture (REM) ……... Original Equipment Manufacture (OEM) ……... Own Designed Manufacture (ODM) ……... Own Brand Manufacture (OBM) 15. Market orientation ……... % Domestic ……... % Regional Asia ……... % Other countries, please specify…………………………………
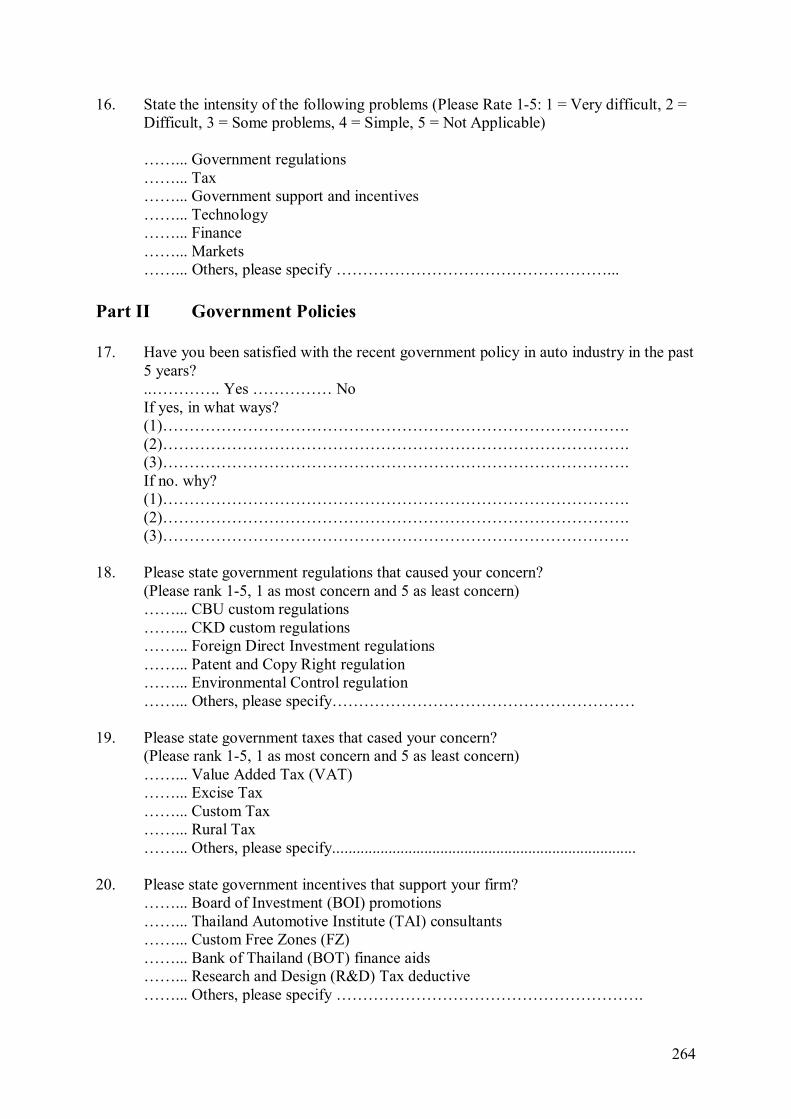
264
16. State the intensity of the following problems (Please Rate 1-5: 1 = Very difficult, 2 = Difficult, 3 = Some problems, 4 = Simple, 5 = Not Applicable)
……... Government regulations
……... Tax ……... Government support and incentives
……... Technology ……... Finance
……... Markets ……... Others, please specify ……………………………………………... Part II Government Policies 17. Have you been satisfied with the recent government policy in auto industry in the past
5 years? ..…………. Yes …………… No If yes, in what ways? (1)……………………………………………………………………………. (2)……………………………………………………………………………. (3)……………………………………………………………………………. If no. why? (1)……………………………………………………………………………. (2)……………………………………………………………………………. (3)……………………………………………………………………………. 18. Please state government regulations that caused your concern?
(Please rank 1-5, 1 as most concern and 5 as least concern) ……... CBU custom regulations ……... CKD custom regulations ……... Foreign Direct Investment regulations ……... Patent and Copy Right regulation ……... Environmental Control regulation ……... Others, please specify………………………………………………… 19. Please state government taxes that cased your concern? (Please rank 1-5, 1 as most concern and 5 as least concern) ……... Value Added Tax (VAT) ……... Excise Tax ……... Custom Tax ……... Rural Tax ……... Others, please specify............................................................................ 20. Please state government incentives that support your firm? ……... Board of Investment (BOI) promotions ……... Thailand Automotive Institute (TAI) consultants ……... Custom Free Zones (FZ) ……... Bank of Thailand (BOT) finance aids ……... Research and Design (R&D) Tax deductive ……... Others, please specify ………………………………………………….
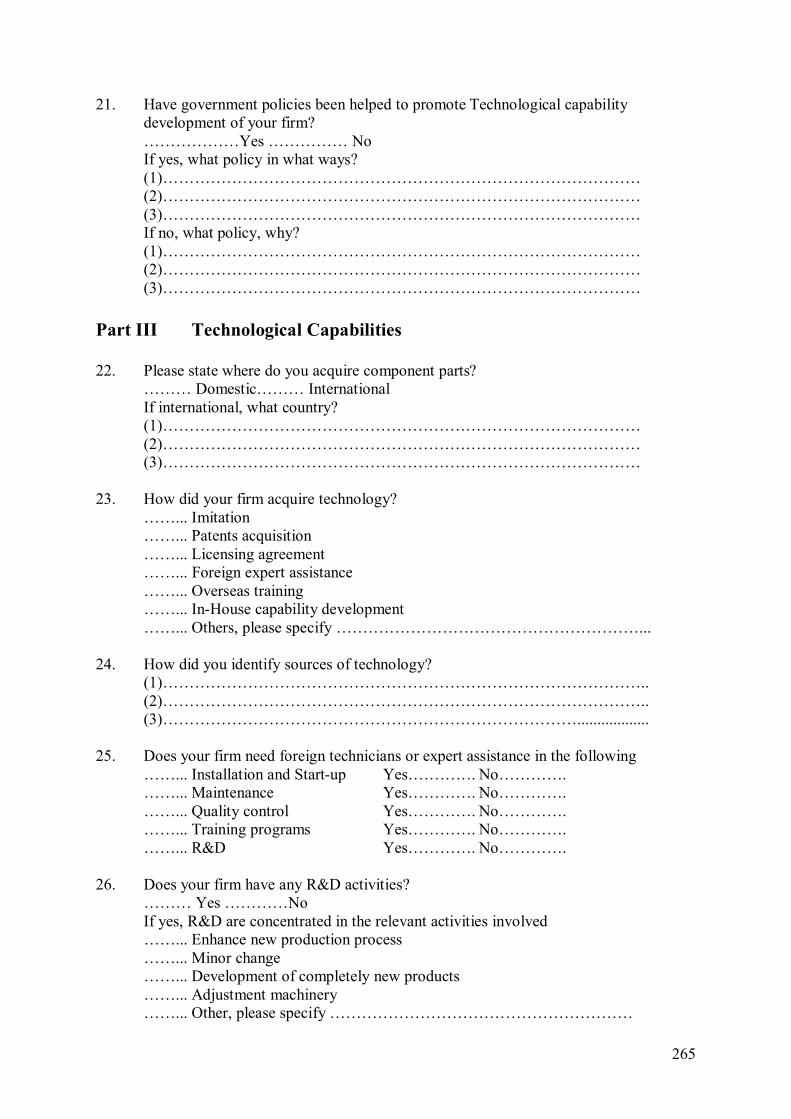
265
21. Have government policies been helped to promote Technological capability development of your firm?
………………Yes …………… No If yes, what policy in what ways? (1)……………………………………………………………………………… (2)……………………………………………………………………………… (3)……………………………………………………………………………… If no, what policy, why? (1)……………………………………………………………………………… (2)……………………………………………………………………………… (3)……………………………………………………………………………… Part III Technological Capabilities 22. Please state where do you acquire component parts? ……… Domestic……… International If international, what country? (1)……………………………………………………………………………… (2)……………………………………………………………………………… (3)……………………………………………………………………………… 23. How did your firm acquire technology? ……... Imitation
……... Patents acquisition ……... Licensing agreement ……... Foreign expert assistance
……... Overseas training ……... In-House capability development ……... Others, please specify …………………………………………………... 24. How did you identify sources of technology? (1)……………………………………………………………………………….. (2)……………………………………………………………………………….. (3)…………………………………………………………………….................. 25. Does your firm need foreign technicians or expert assistance in the following ……... Installation and Start-up Yes…………. No…………. ……... Maintenance Yes…………. No…………. ……... Quality control Yes…………. No…………. ……... Training programs Yes…………. No…………. ……... R&D Yes…………. No…………. 26. Does your firm have any R&D activities?
……… Yes …………No If yes, R&D are concentrated in the relevant activities involved ……... Enhance new production process ……... Minor change ……... Development of completely new products ……... Adjustment machinery ……... Other, please specify …………………………………………………
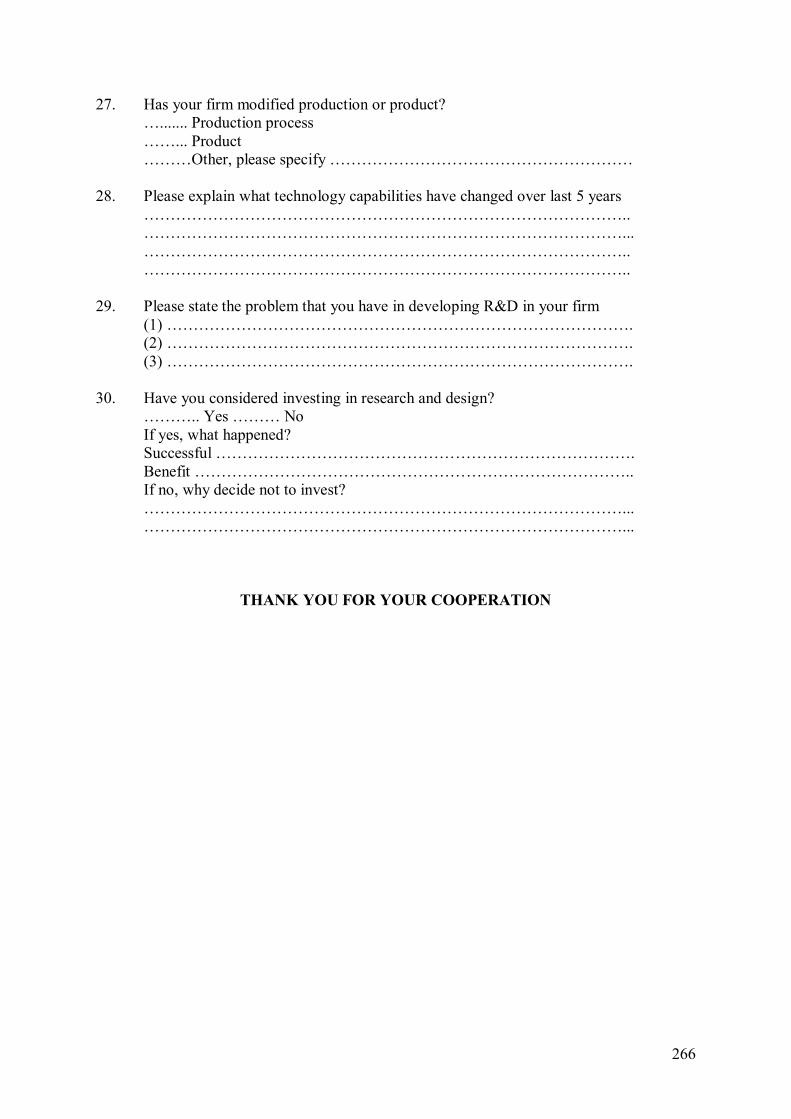
266
27. Has your firm modified production or product? …....... Production process
……... Product ………Other, please specify ………………………………………………… 28. Please explain what technology capabilities have changed over last 5 years ……………………………………………………………………………….. ………………………………………………………………………………... ……………………………………………………………………………….. ……………………………………………………………………………….. 29. Please state the problem that you have in developing R&D in your firm (1) ……………………………………………………………………………. (2) ……………………………………………………………………………. (3) ……………………………………………………………………………. 30. Have you considered investing in research and design? ……….. Yes ……… No
If yes, what happened? Successful ……………………………………………………………………. Benefit ……………………………………………………………………….. If no, why decide not to invest? ………………………………………………………………………………... ………………………………………………………………………………...
THANK YOU FOR YOUR COOPERATION
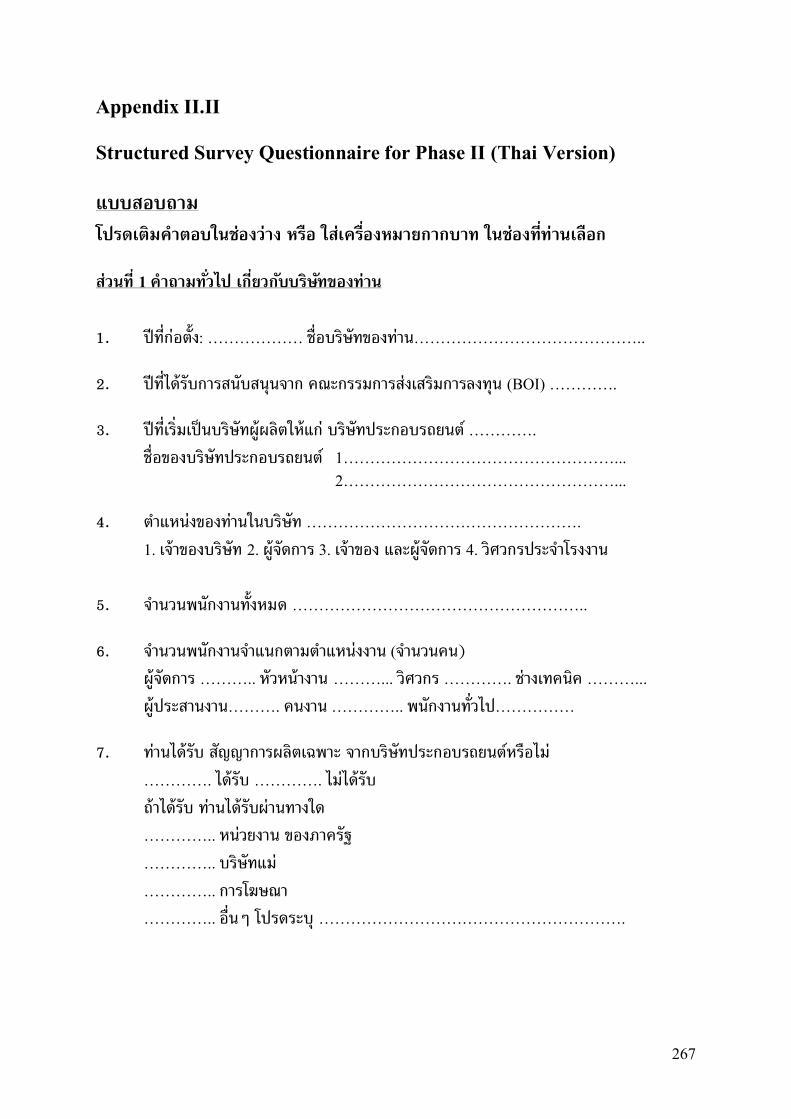
267
Appendix II.II Structured Survey Questionnaire for Phase II (Thai Version) แบบสอบถาม โปรดเตมคาตอบในชองวาง หรอ ใสเครองหมายกากบาท ในชองททานเลอก สวนท 1 คาถามทวไป เกยวกบบรษทของทาน
1. ปทกอตง: ……………… ชอบรษทของทาน…………………………………….. 2. ปทไดรบการสนบสนนจาก คณะกรรมการสงเสรมการลงทน (BOI) …………. 3. ปทเรมเปนบรษทผผลตใหแก บรษทประกอบรถยนต ………….
ชอของบรษทประกอบรถยนต 1……………………………………………... 2……………………………………………... 4. ตาแหนงของทานในบรษท …………………………………………….
1. เจาของบรษท 2. ผจดการ 3. เจาของ และผจดการ 4. วศวกรประจาโรงงาน
5. จานวนพนกงานทงหมด ……………………………………………….. 6. จานวนพนกงานจาแนกตามตาแหนงงาน (จานวนคน)
ผจดการ ……….. หวหนางาน ………... วศวกร …………. ชางเทคนค ………...
ผประสานงาน………. คนงาน ………….. พนกงานทวไป…………… 7. ทานไดรบ สญญาการผลตเฉพาะ จากบรษทประกอบรถยนตหรอไม
…………. ไดรบ …………. ไมไดรบ
ถาไดรบ ทานไดรบผานทางใด
………….. หนวยงาน ของภาครฐ
………….. บรษทแม
………….. การโฆษณา
………….. อนๆ โปรดระบ ………………………………………………….
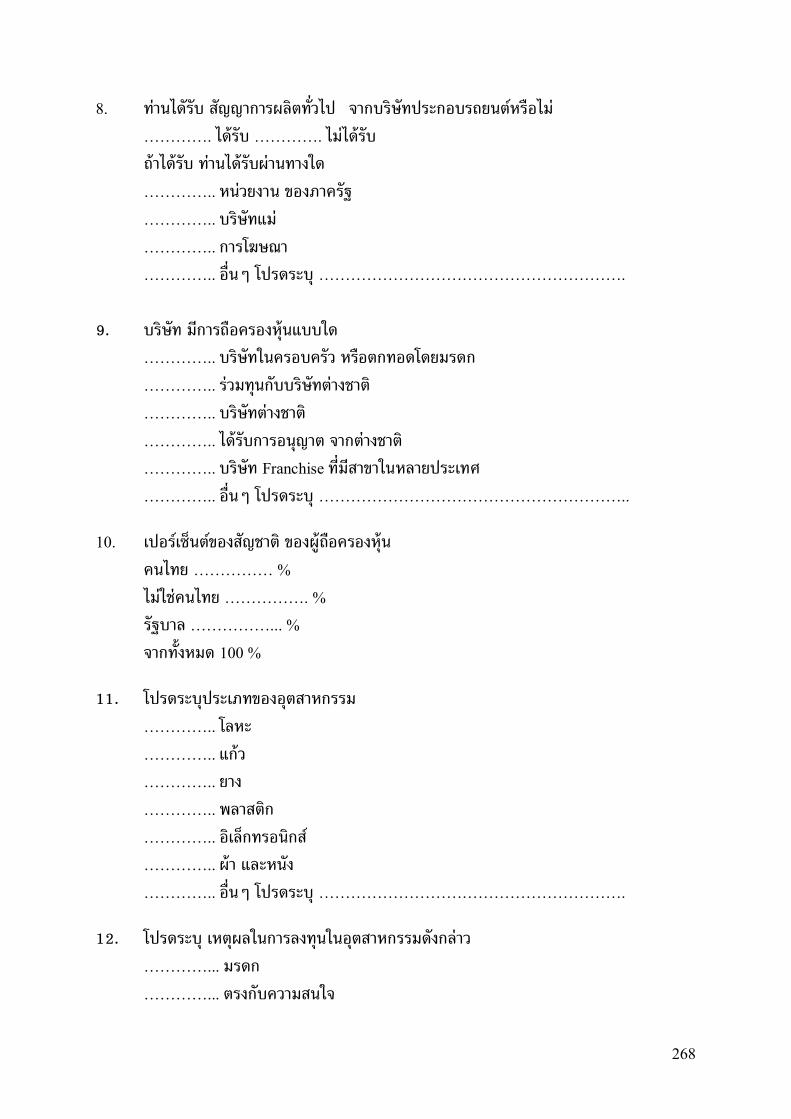
268
8. ทานไดรบ สญญาการผลตทวไป จากบรษทประกอบรถยนตหรอไม
…………. ไดรบ …………. ไมไดรบ
ถาไดรบ ทานไดรบผานทางใด
………….. หนวยงาน ของภาครฐ
………….. บรษทแม
………….. การโฆษณา
………….. อนๆ โปรดระบ ………………………………………………….
9. บรษท มการถอครองหนแบบใด
………….. บรษทในครอบครว หรอตกทอดโดยมรดก
………….. รวมทนกบบรษทตางชาต
………….. บรษทตางชาต
………….. ไดรบการอนญาต จากตางชาต
………….. บรษท Franchise ทมสาขาในหลายประเทศ
………….. อนๆ โปรดระบ ………………………………………………….. 10. เปอรเซนตของสญชาต ของผถอครองหน
คนไทย …………… %
ไมใชคนไทย ……………. %
รฐบาล ……………... %
จากทงหมด 100 % 11. โปรดระบประเภทของอตสาหกรรม
………….. โลหะ
………….. แกว
………….. ยาง
………….. พลาสตก
………….. อเลกทรอนกส
………….. ผา และหนง
………….. อนๆ โปรดระบ …………………………………………………. 12. โปรดระบ เหตผลในการลงทนในอตสาหกรรมดงกลาว
…………... มรดก
…………... ตรงกบความสนใจ
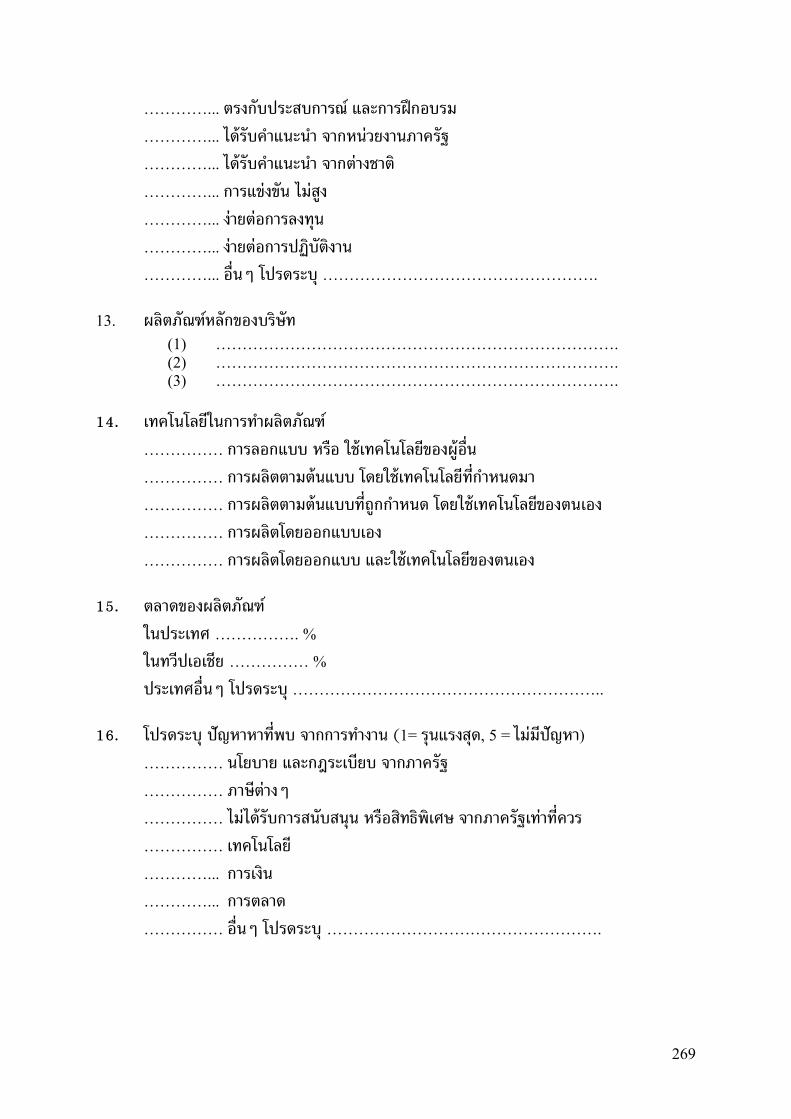
269
…………... ตรงกบประสบการณ และการฝกอบรม
…………... ไดรบคาแนะนา จากหนวยงานภาครฐ
…………... ไดรบคาแนะนา จากตางชาต
…………... การแขงขน ไมสง
…………... งายตอการลงทน
…………... งายตอการปฏบตงาน
…………... อนๆ โปรดระบ ……………………………………………. 13. ผลตภณฑหลกของบรษท
(1) …………………………………………………………………. (2) …………………………………………………………………. (3) ………………………………………………………………….
14. เทคโนโลยในการทาผลตภณฑ
…………… การลอกแบบ หรอ ใชเทคโนโลยของผอน
…………… การผลตตามตนแบบ โดยใชเทคโนโลยทกาหนดมา
…………… การผลตตามตนแบบทถกกาหนด โดยใชเทคโนโลยของตนเอง
…………… การผลตโดยออกแบบเอง
…………… การผลตโดยออกแบบ และใชเทคโนโลยของตนเอง 15. ตลาดของผลตภณฑ
ในประเทศ ……………. %
ในทวปเอเชย …………… %
ประเทศอนๆ โปรดระบ ………………………………………………….. 16. โปรดระบ ปญหาหาทพบ จากการทางาน (1= รนแรงสด, 5 = ไมมปญหา)
…………… นโยบาย และกฎระเบยบ จากภาครฐ
…………… ภาษตางๆ
…………… ไมไดรบการสนบสนน หรอสทธพเศษ จากภาครฐเทาทควร
…………… เทคโนโลย
…………... การเงน
…………... การตลาด
…………… อนๆ โปรดระบ …………………………………………….
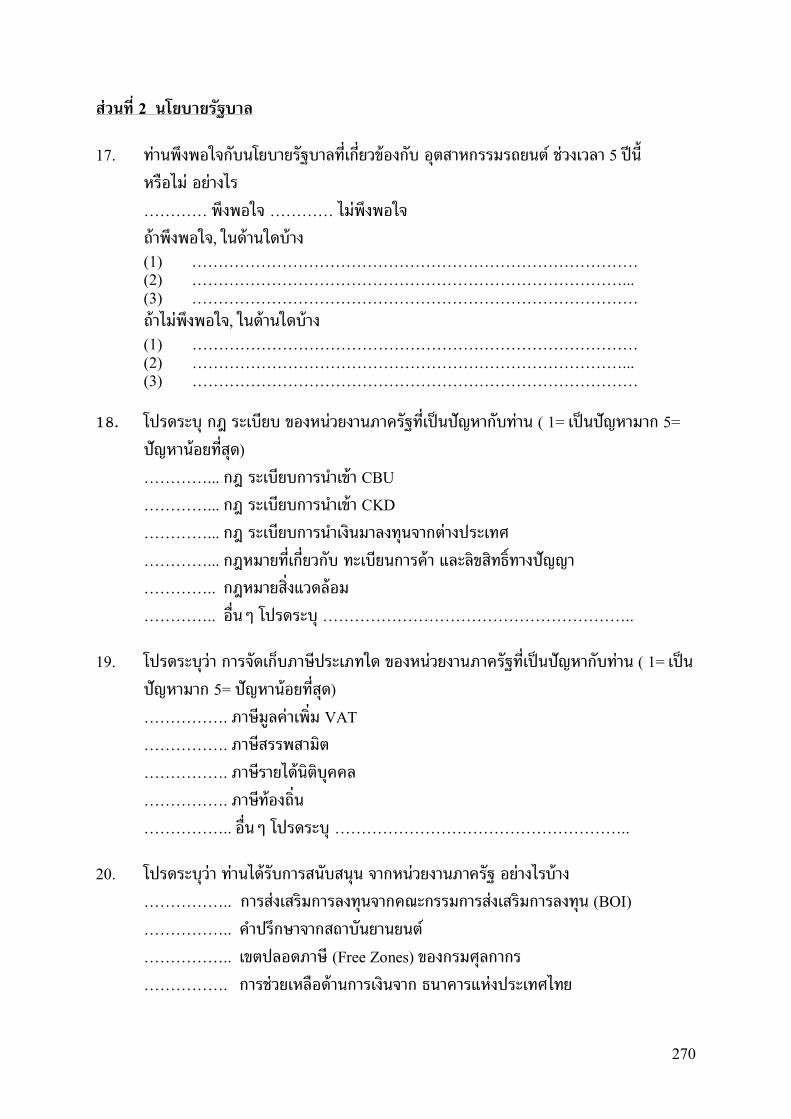
270
สวนท 2 นโยบายรฐบาล 17. ทานพงพอใจกบนโยบายรฐบาลทเกยวของกบ อตสาหกรรมรถยนต ชวงเวลา 5 ปน
หรอไม อยางไร
………… พงพอใจ ………… ไมพงพอใจ
ถาพงพอใจ, ในดานใดบาง (1) ………………………………………………………………………… (2) ………………………………………………………………………... (3) ………………………………………………………………………… ถาไมพงพอใจ, ในดานใดบาง (1) ………………………………………………………………………… (2) ………………………………………………………………………... (3) …………………………………………………………………………
18. โปรดระบ กฎ ระเบยบ ของหนวยงานภาครฐทเปนปญหากบทาน ( 1= เปนปญหามาก 5=
ปญหานอยทสด)
…………... กฎ ระเบยบการนาเขา CBU
…………... กฎ ระเบยบการนาเขา CKD
…………... กฎ ระเบยบการนาเงนมาลงทนจากตางประเทศ
…………... กฎหมายทเกยวกบ ทะเบยนการคา และลขสทธทางปญญา
………….. กฎหมายสงแวดลอม
………….. อนๆ โปรดระบ ………………………………………………….. 19. โปรดระบวา การจดเกบภาษประเภทใด ของหนวยงานภาครฐทเปนปญหากบทาน ( 1= เปน
ปญหามาก 5= ปญหานอยทสด)
……………. ภาษมลคาเพม VAT
……………. ภาษสรรพสามต
……………. ภาษรายไดนตบคคล
……………. ภาษทองถน
…………….. อนๆ โปรดระบ ……………………………………………….. 20. โปรดระบวา ทานไดรบการสนบสนน จากหนวยงานภาครฐ อยางไรบาง
…………….. การสงเสรมการลงทนจากคณะกรรมการสงเสรมการลงทน (BOI)
…………….. คาปรกษาจากสถาบนยานยนต
…………….. เขตปลอดภาษ (Free Zones) ของกรมศลกากร
……………. การชวยเหลอดานการเงนจาก ธนาคารแหงประเทศไทย
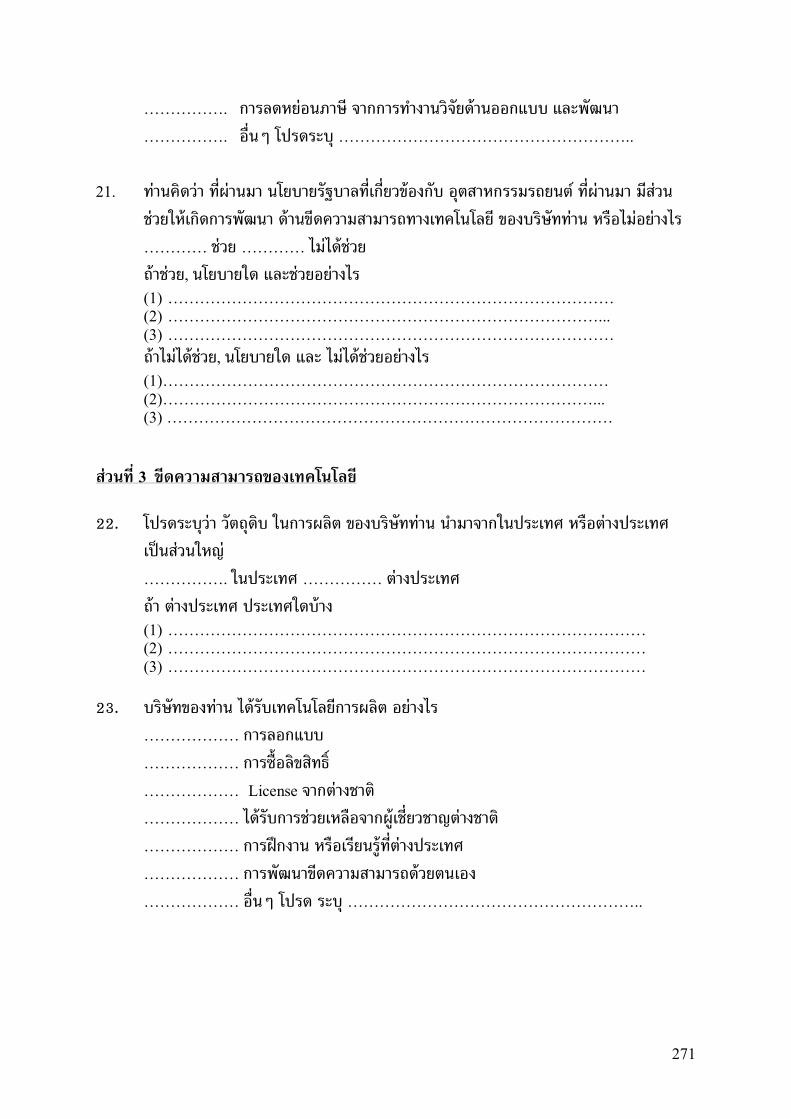
271
……………. การลดหยอนภาษ จากการทางานวจยดานออกแบบ และพฒนา
……………. อนๆ โปรดระบ ………………………………………………..
21. ทานคดวา ทผานมา นโยบายรฐบาลทเกยวของกบ อตสาหกรรมรถยนต ทผานมา มสวน
ชวยใหเกดการพฒนา ดานขดความสามารถทางเทคโนโลย ของบรษททาน หรอไมอยางไร
………… ชวย ………… ไมไดชวย
ถาชวย, นโยบายใด และชวยอยางไร (1) ………………………………………………………………………… (2) ………………………………………………………………………... (3) ………………………………………………………………………… ถาไมไดชวย, นโยบายใด และ ไมไดชวยอยางไร (1)………………………………………………………………………… (2)………………………………………………………………………...
(3) ………………………………………………………………………… สวนท 3 ขดความสามารถของเทคโนโลย 22. โปรดระบวา วตถดบ ในการผลต ของบรษททาน นามาจากในประเทศ หรอตางประเทศ
เปนสวนใหญ
……………. ในประเทศ …………… ตางประเทศ
ถา ตางประเทศ ประเทศใดบาง (1) ……………………………………………………………………………… (2) ……………………………………………………………………………… (3) ………………………………………………………………………………
23. บรษทของทาน ไดรบเทคโนโลยการผลต อยางไร
……………… การลอกแบบ
……………… การซอลขสทธ
……………… License จากตางชาต
……………… ไดรบการชวยเหลอจากผเชยวชาญตางชาต
……………… การฝกงาน หรอเรยนรทตางประเทศ
……………… การพฒนาขดความสามารถดวยตนเอง
……………… อนๆ โปรด ระบ ………………………………………………..
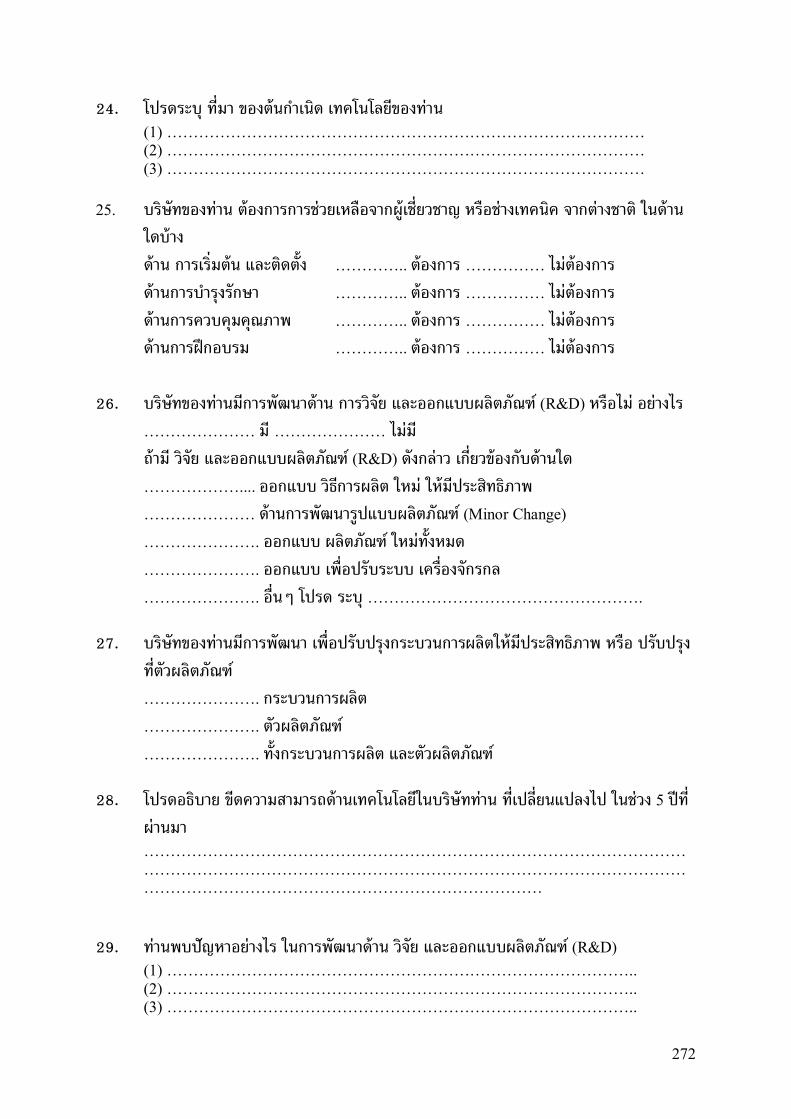
272
24. โปรดระบ ทมา ของตนกาเนด เทคโนโลยของทาน (1) ……………………………………………………………………………… (2) ……………………………………………………………………………… (3) ……………………………………………………………………………… 25. บรษทของทาน ตองการการชวยเหลอจากผเชยวชาญ หรอชางเทคนค จากตางชาต ในดาน
ใดบาง
ดาน การเรมตน และตดตง ………….. ตองการ …………… ไมตองการ
ดานการบารงรกษา ………….. ตองการ …………… ไมตองการ
ดานการควบคมคณภาพ ………….. ตองการ …………… ไมตองการ
ดานการฝกอบรม ………….. ตองการ …………… ไมตองการ
26. บรษทของทานมการพฒนาดาน การวจย และออกแบบผลตภณฑ (R&D) หรอไม อยางไร
………………… ม ………………… ไมม
ถาม วจย และออกแบบผลตภณฑ (R&D) ดงกลาว เกยวของกบดานใด
……………….... ออกแบบ วธการผลต ใหม ใหมประสทธภาพ
………………… ดานการพฒนารปแบบผลตภณฑ (Minor Change)
…………………. ออกแบบ ผลตภณฑ ใหมทงหมด
…………………. ออกแบบ เพอปรบระบบ เครองจกรกล
…………………. อนๆ โปรด ระบ ……………………………………………. 27. บรษทของทานมการพฒนา เพอปรบปรงกระบวนการผลตใหมประสทธภาพ หรอ ปรบปรง
ทตวผลตภณฑ
…………………. กระบวนการผลต
…………………. ตวผลตภณฑ
…………………. ทงกระบวนการผลต และตวผลตภณฑ 28. โปรดอธบาย ขดความสามารถดานเทคโนโลยในบรษททาน ทเปลยนแปลงไป ในชวง 5 ปท
ผานมา ………………………………………………………………………………………………………………………………………………………………………………………………………………………………………………………
29. ทานพบปญหาอยางไร ในการพฒนาดาน วจย และออกแบบผลตภณฑ (R&D) (1) …………………………………………………………………………….. (2) …………………………………………………………………………….. (3) ……………………………………………………………………………..
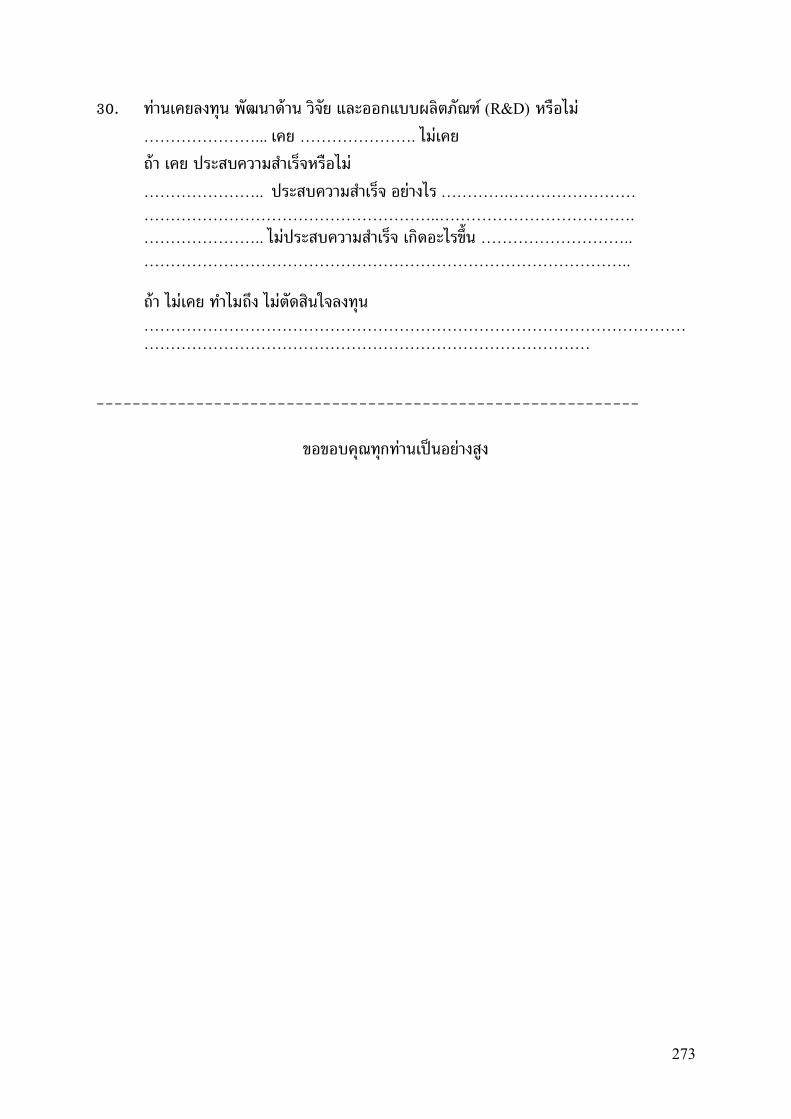
273
30. ทานเคยลงทน พฒนาดาน วจย และออกแบบผลตภณฑ (R&D) หรอไม
…………………... เคย …………………. ไมเคย
ถา เคย ประสบความสาเรจหรอไม
………………….. ประสบความสาเรจ อยางไร ………….…………………… ………………………………………………..………………………………. ………………….. ไมประสบความสาเรจ เกดอะไรขน ……………………….. ……………………………………………………………………………….. ถา ไมเคย ทาไมถง ไมตดสนใจลงทน
……………………………………………………………………………………………………………………………………………………………………
------------------------------------------------------------
ขอขอบคณทกทานเปนอยางสง
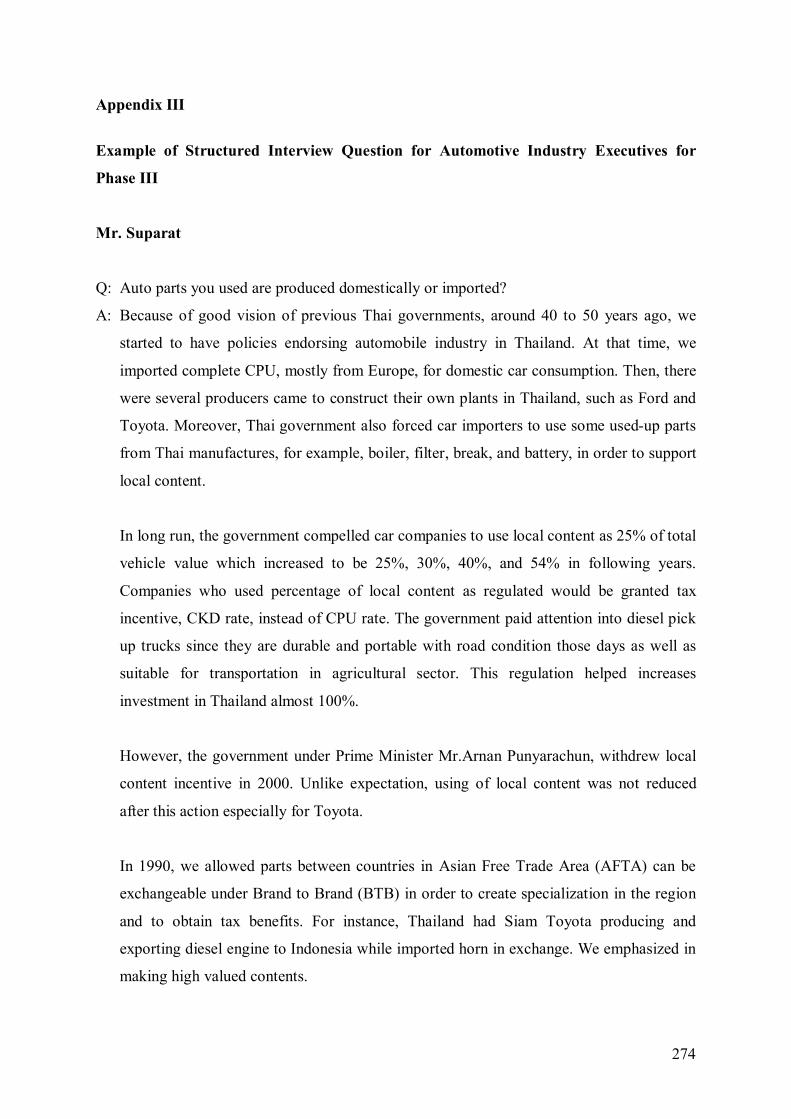
274
Appendix III
Example of Structured Interview Question for Automotive Industry Executives for
Phase III
Mr. Suparat
Q: Auto parts you used are produced domestically or imported?
A: Because of good vision of previous Thai governments, around 40 to 50 years ago, we
started to have policies endorsing automobile industry in Thailand. At that time, we
imported complete CPU, mostly from Europe, for domestic car consumption. Then, there
were several producers came to construct their own plants in Thailand, such as Ford and
Toyota. Moreover, Thai government also forced car importers to use some used-up parts
from Thai manufactures, for example, boiler, filter, break, and battery, in order to support
local content.
In long run, the government compelled car companies to use local content as 25% of total
vehicle value which increased to be 25%, 30%, 40%, and 54% in following years.
Companies who used percentage of local content as regulated would be granted tax
incentive, CKD rate, instead of CPU rate. The government paid attention into diesel pick
up trucks since they are durable and portable with road condition those days as well as
suitable for transportation in agricultural sector. This regulation helped increases
investment in Thailand almost 100%.
However, the government under Prime Minister Mr.Arnan Punyarachun, withdrew local
content incentive in 2000. Unlike expectation, using of local content was not reduced
after this action especially for Toyota.
In 1990, we allowed parts between countries in Asian Free Trade Area (AFTA) can be
exchangeable under Brand to Brand (BTB) in order to create specialization in the region
and to obtain tax benefits. For instance, Thailand had Siam Toyota producing and
exporting diesel engine to Indonesia while imported horn in exchange. We emphasized in
making high valued contents.
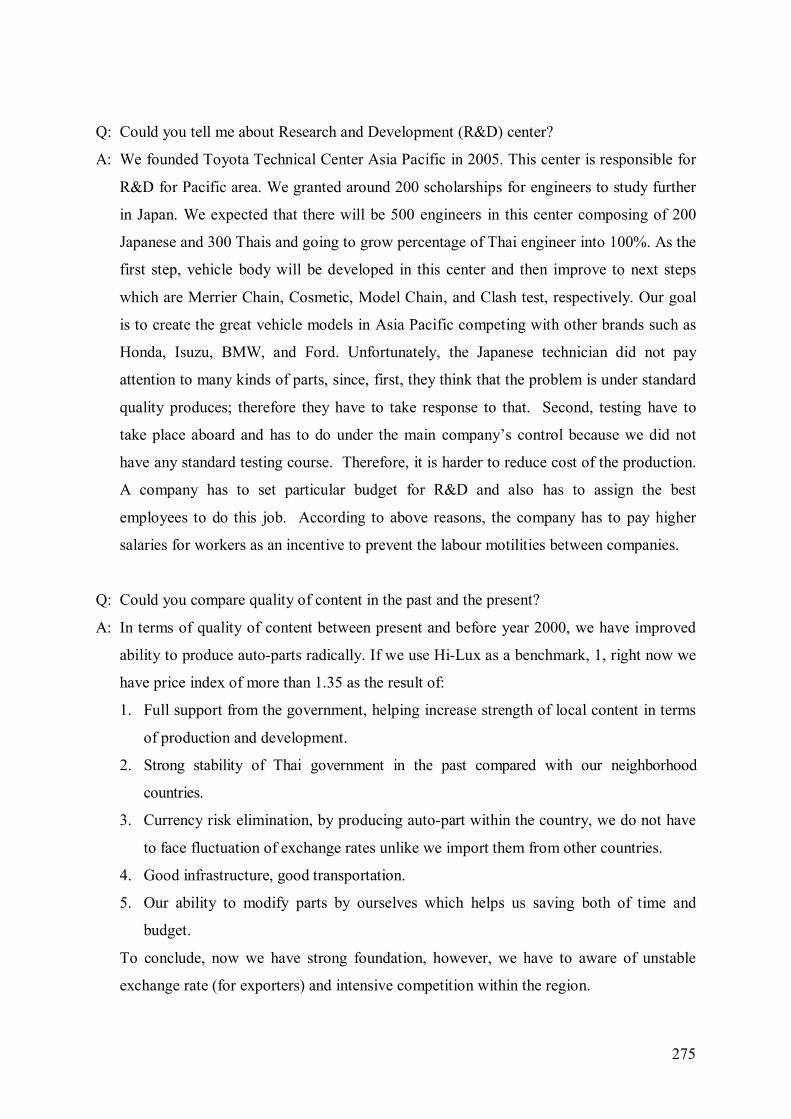
275
Q: Could you tell me about Research and Development (R&D) center?
A: We founded Toyota Technical Center Asia Pacific in 2005. This center is responsible for
R&D for Pacific area. We granted around 200 scholarships for engineers to study further
in Japan. We expected that there will be 500 engineers in this center composing of 200
Japanese and 300 Thais and going to grow percentage of Thai engineer into 100%. As the
first step, vehicle body will be developed in this center and then improve to next steps
which are Merrier Chain, Cosmetic, Model Chain, and Clash test, respectively. Our goal
is to create the great vehicle models in Asia Pacific competing with other brands such as
Honda, Isuzu, BMW, and Ford. Unfortunately, the Japanese technician did not pay
attention to many kinds of parts, since, first, they think that the problem is under standard
quality produces; therefore they have to take response to that. Second, testing have to
take place aboard and has to do under the main company’s control because we did not
have any standard testing course. Therefore, it is harder to reduce cost of the production.
A company has to set particular budget for R&D and also has to assign the best
employees to do this job. According to above reasons, the company has to pay higher
salaries for workers as an incentive to prevent the labour motilities between companies.
Q: Could you compare quality of content in the past and the present?
A: In terms of quality of content between present and before year 2000, we have improved
ability to produce auto-parts radically. If we use Hi-Lux as a benchmark, 1, right now we
have price index of more than 1.35 as the result of:
1. Full support from the government, helping increase strength of local content in terms
of production and development.
2. Strong stability of Thai government in the past compared with our neighborhood
countries.
3. Currency risk elimination, by producing auto-part within the country, we do not have
to face fluctuation of exchange rates unlike we import them from other countries.
4. Good infrastructure, good transportation.
5. Our ability to modify parts by ourselves which helps us saving both of time and
budget.
To conclude, now we have strong foundation, however, we have to aware of unstable
exchange rate (for exporters) and intensive competition within the region.
276
Q: How many auto-part maker you have?
A: For Toyota, we have Siam Toyota producing engines and Denso supporting electrical
parts. Other than that, we still have old partners in Thailand who make quality content
supplied for Toyota, such as Samitra Motors, Ch. Auto Parts, Summit group, Thai Arrow,
Yasaki, and several makers in the United States.
Q: Are these companies held by Thai investors?
A: It depends. Most of manufactures in Thailand are held by Thai investors and the rest are
owned by foreigners, Japanese and American.
Q: What is the percentage of parts used from Thai and foreign companies?
A: We use about 15-20% of contents from pure-Thai companies. We have to use some parts
from Japan since they have developed their technology through times. We planed to
improve our competency to produce parts on our own by support more on R&D.
Q: Is it true that nowadays Mother Company assigns only requirement of parts and let the
supplier design by themselves.
A: Yes, this is a strategy we planed to develop suppliers. We are responsible for confining
over all spec and allocating to suppliers. Unlike in Malaysia, they have many makers but
low R&D. As the results, they could not compete with other countries. We appointed high
spec for requirement and let the market compete on capability and cost to help improve
suppliers not to take advantage from them. We suggested old fashion suppliers to change
structure of production by employing engineers to control manufacture and dare to invest
more on technology. Especially, these days we have to take competition with China into
account because they have advantage in labors. In long run, although they still cannot
compete with Thailand, we believe that in the next 5 years they will be a strong
competitor in Asia. The important factor we are disadvantaged is that we still have to
import raw material while China can produce by themselves.
Q: Is there iron in China?
A: China has a large capacity to produce metal because they have abandon iron and
manufactures. Although we have manufactures, we still have to import iron from others.
Q: What are your strategies on this?
277
A: Framework of pick-up truck is used in car production but in smaller scale. Unlike pick-up
trucks that use the same platform and common parts between models, each personal car
model is much differentiated and uses different platforms. In this case, local contents are
rarely used.
Q: What do you do with the contents that we cannot produce in Thailand?
A: We import those parts from Japan and Taiwan depended on market size and production
base. In some cases, we exchange both of CPU and parts with them. To conclude, local
content in cars is less used than in trucks.
Q: How could you find material parts in Thailand? Both for the existing models and new
models
A: We ranked domestic makers as the first priority. If we cannot find required parts in
Thailand, then we will import them from makers inside Asian and makers outside Asian
as the second and the third priority, respectively. We have chosen manufactures by
bidding system.
Q: Are you using the same system to global sourcing?
A: We considered market condition, prices, and exchange rates in choosing suppliers.
Q: Now we targeted on number of car produced each year, how do you find this target?
A: It depends on vision of companies. For Toyota, we believe that each continent or country
has its own cycle. It is up to demand and supply in market regarding of number of car per
capita. We considered several factors to estimate target which are demand, infrastructure,
and stability of economy. Moreover, target may be sensitive upon other extraordinary
factors such as consumers’ purchasing power, terrorists. These factors could cause slow
consumption in the country. In my point of view, target of producing 1,800,000 vehicles
within the next 3 years is really difficult to meet.
Q: There are news claiming that Detroit of Asia will not be success, what do you think?
A: I think it can success, however, it may take some more time to recover from crisis. On the
producer stand point, we agree with government to construct mega facility such as public
roads, mass traffic, and sky trains. We do not afraid whether people who moving into
278
suburb will decrease their vehicle consumption since cars are one of the requisites for
comfort these days.
Q: How do you find government policies about BOI support or tax incentives? Do you think
it is enough to help improve this industry or do you have any recommendation?
A: I think that gap between CKD and CPU should be reduced to help producers compete
with imported cars. In present, we have a high gap of 80:30 which should be reduced to
about 60.
Q: Do you think this will be advantage for local content producers as smaller gap between
CKD and CPU?
A: I think it is good for us because we can set prices lower than those imported. Furthermore,
we know consumer behaviour better than outside producers and we use high quality parts
in production. As the results, foreigners look at our products as high quality vehicles.
Q: How do you compare products of Thailand with those of South Korea?
A: I think South Korea is a strong competitor of Thais since they have higher technology and
improvement, better than China. Other advantage of South Korea is that they can produce
metal materials by themselves as well as having high perseverant labour.
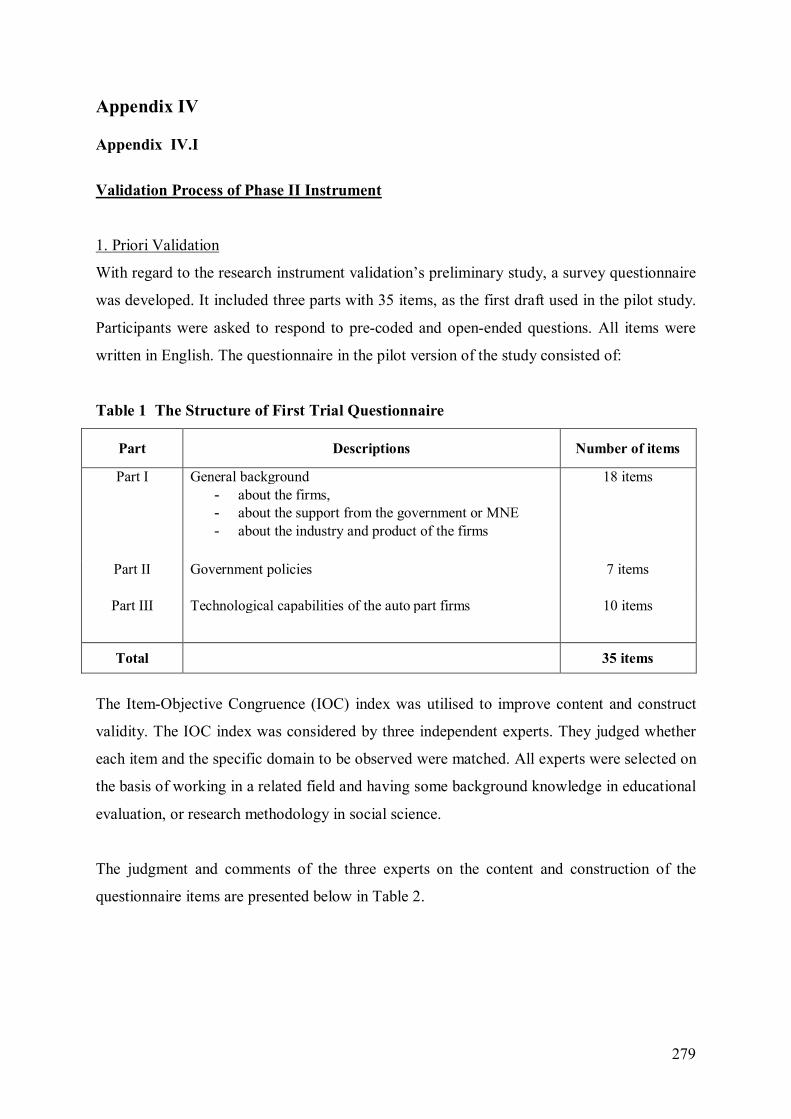
279
Appendix IV Appendix IV.I
Validation Process of Phase II Instrument
1. Priori Validation
With regard to the research instrument validation’s preliminary study, a survey questionnaire
was developed. It included three parts with 35 items, as the first draft used in the pilot study.
Participants were asked to respond to pre-coded and open-ended questions. All items were
written in English. The questionnaire in the pilot version of the study consisted of:
Table 1 The Structure of First Trial Questionnaire
Part Descriptions Number of items
Part I General background - about the firms, - about the support from the government or MNE - about the industry and product of the firms
18 items
Part II Government policies 7 items
Part III Technological capabilities of the auto part firms 10 items
Total 35 items The Item-Objective Congruence (IOC) index was utilised to improve content and construct
validity. The IOC index was considered by three independent experts. They judged whether
each item and the specific domain to be observed were matched. All experts were selected on
the basis of working in a related field and having some background knowledge in educational
evaluation, or research methodology in social science.
The judgment and comments of the three experts on the content and construction of the
questionnaire items are presented below in Table 2.
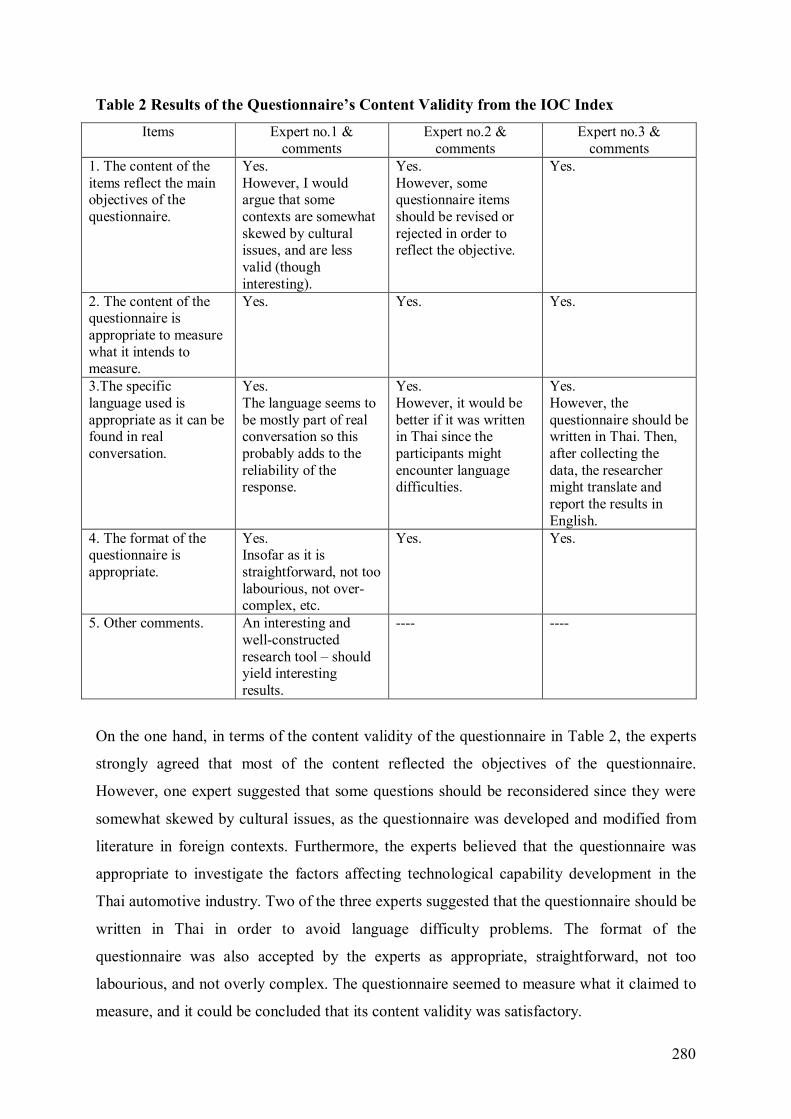
280
Table 2 Results of the Questionnaire’s Content Validity from the IOC Index
Items Expert no.1 & comments
Expert no.2 & comments
Expert no.3 & comments
1. The content of the items reflect the main objectives of the questionnaire.
Yes. However, I would argue that some contexts are somewhat skewed by cultural issues, and are less valid (though interesting).
Yes. However, some questionnaire items should be revised or rejected in order to reflect the objective.
Yes.
2. The content of the questionnaire is appropriate to measure what it intends to measure.
Yes. Yes. Yes.
3.The specific language used is appropriate as it can be found in real conversation.
Yes. The language seems to be mostly part of real conversation so this probably adds to the reliability of the response.
Yes. However, it would be better if it was written in Thai since the participants might encounter language difficulties.
Yes. However, the questionnaire should be written in Thai. Then, after collecting the data, the researcher might translate and report the results in English.
4. The format of the questionnaire is appropriate.
Yes. Insofar as it is straightforward, not too labourious, not over-complex, etc.
Yes. Yes.
5. Other comments. An interesting and well-constructed research tool – should yield interesting results.
---- ----
On the one hand, in terms of the content validity of the questionnaire in Table 2, the experts
strongly agreed that most of the content reflected the objectives of the questionnaire.
However, one expert suggested that some questions should be reconsidered since they were
somewhat skewed by cultural issues, as the questionnaire was developed and modified from
literature in foreign contexts. Furthermore, the experts believed that the questionnaire was
appropriate to investigate the factors affecting technological capability development in the
Thai automotive industry. Two of the three experts suggested that the questionnaire should be
written in Thai in order to avoid language difficulty problems. The format of the
questionnaire was also accepted by the experts as appropriate, straightforward, not too
labourious, and not overly complex. The questionnaire seemed to measure what it claimed to
measure, and it could be concluded that its content validity was satisfactory.
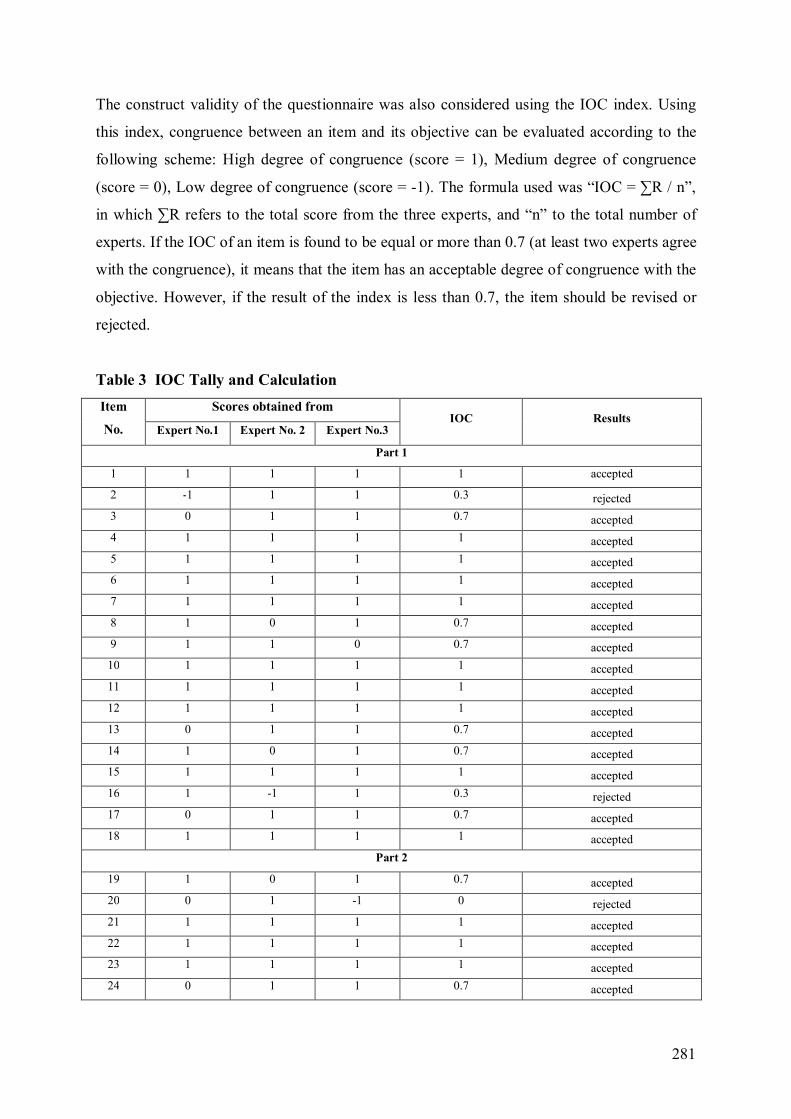
281
The construct validity of the questionnaire was also considered using the IOC index. Using
this index, congruence between an item and its objective can be evaluated according to the
following scheme: High degree of congruence (score = 1), Medium degree of congruence
(score = 0), Low degree of congruence (score = -1). The formula used was “IOC = ∑R / n”,
in which ∑R refers to the total score from the three experts, and “n” to the total number of
experts. If the IOC of an item is found to be equal or more than 0.7 (at least two experts agree
with the congruence), it means that the item has an acceptable degree of congruence with the
objective. However, if the result of the index is less than 0.7, the item should be revised or
rejected.
Table 3 IOC Tally and Calculation Item
No.
Scores obtained from IOC Results
Expert No.1 Expert No. 2 Expert No.3
Part 1
1 1 1 1 1 accepted
2 -1 1 1 0.3 rejected 3 0 1 1 0.7 accepted 4 1 1 1 1 accepted 5 1 1 1 1 accepted 6 1 1 1 1 accepted 7 1 1 1 1 accepted 8 1 0 1 0.7 accepted 9 1 1 0 0.7 accepted 10 1 1 1 1 accepted 11 1 1 1 1 accepted 12 1 1 1 1 accepted 13 0 1 1 0.7 accepted 14 1 0 1 0.7 accepted 15 1 1 1 1 accepted 16 1 -1 1 0.3 rejected 17 0 1 1 0.7 accepted 18 1 1 1 1 accepted
Part 2
19 1 0 1 0.7 accepted 20 0 1 -1 0 rejected 21 1 1 1 1 accepted 22 1 1 1 1 accepted 23 1 1 1 1 accepted 24 0 1 1 0.7 accepted
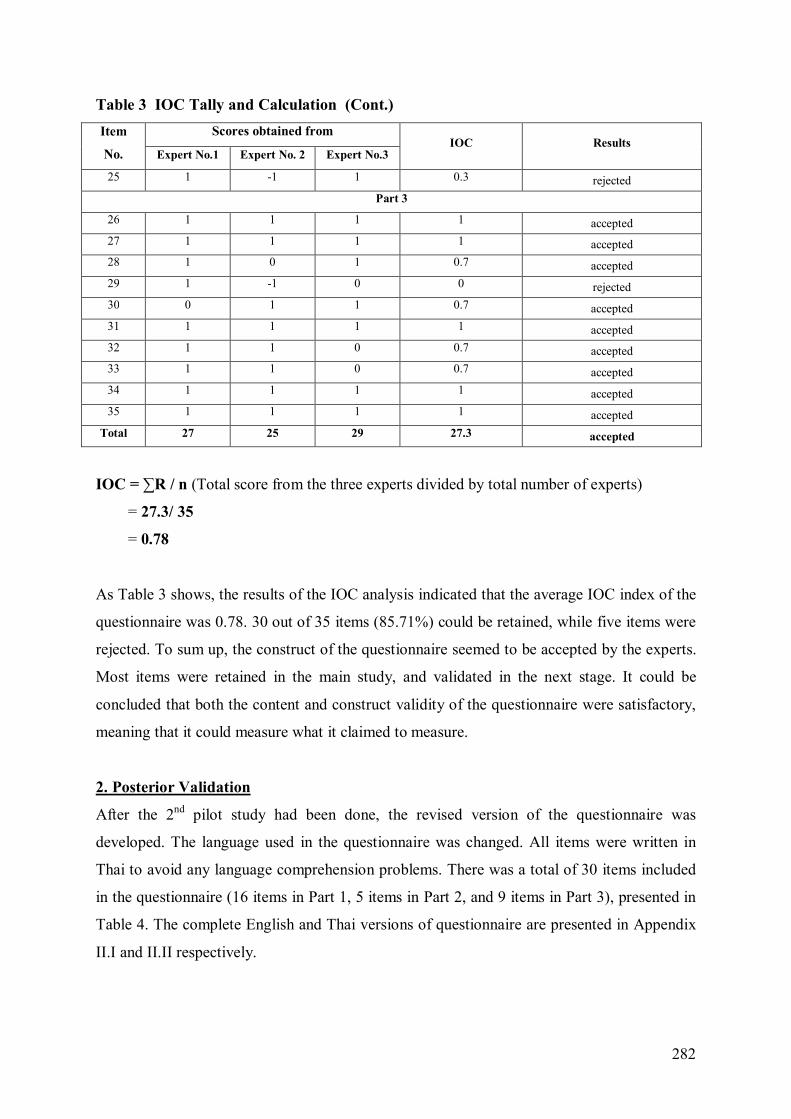
282
Table 3 IOC Tally and Calculation (Cont.) Item
No.
Scores obtained from IOC Results
Expert No.1 Expert No. 2 Expert No.3
25 1 -1 1 0.3 rejected Part 3
26 1 1 1 1 accepted 27 1 1 1 1 accepted 28 1 0 1 0.7 accepted 29 1 -1 0 0 rejected 30 0 1 1 0.7 accepted 31 1 1 1 1 accepted 32 1 1 0 0.7 accepted 33 1 1 0 0.7 accepted 34 1 1 1 1 accepted 35 1 1 1 1 accepted
Total 27 25 29 27.3 accepted
IOC = ∑R / n (Total score from the three experts divided by total number of experts)
= 27.3/ 35
= 0.78
As Table 3 shows, the results of the IOC analysis indicated that the average IOC index of the
questionnaire was 0.78. 30 out of 35 items (85.71%) could be retained, while five items were
rejected. To sum up, the construct of the questionnaire seemed to be accepted by the experts.
Most items were retained in the main study, and validated in the next stage. It could be
concluded that both the content and construct validity of the questionnaire were satisfactory,
meaning that it could measure what it claimed to measure.
2. Posterior Validation
After the 2nd pilot study had been done, the revised version of the questionnaire was
developed. The language used in the questionnaire was changed. All items were written in
Thai to avoid any language comprehension problems. There was a total of 30 items included
in the questionnaire (16 items in Part 1, 5 items in Part 2, and 9 items in Part 3), presented in
Table 4. The complete English and Thai versions of questionnaire are presented in Appendix
II.I and II.II respectively.
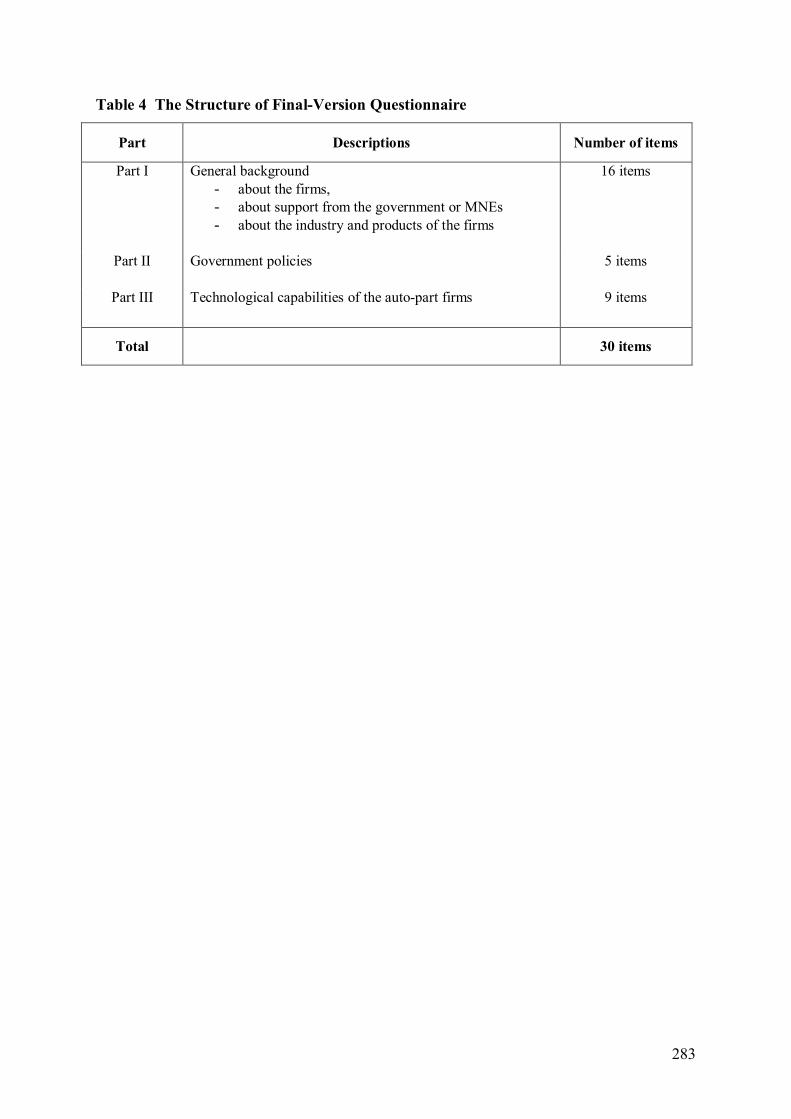
283
Table 4 The Structure of Final-Version Questionnaire
Part Descriptions Number of items
Part I General background - about the firms, - about support from the government or MNEs - about the industry and products of the firms
16 items
Part II Government policies 5 items
Part III Technological capabilities of the auto-part firms 9 items
Total 30 items
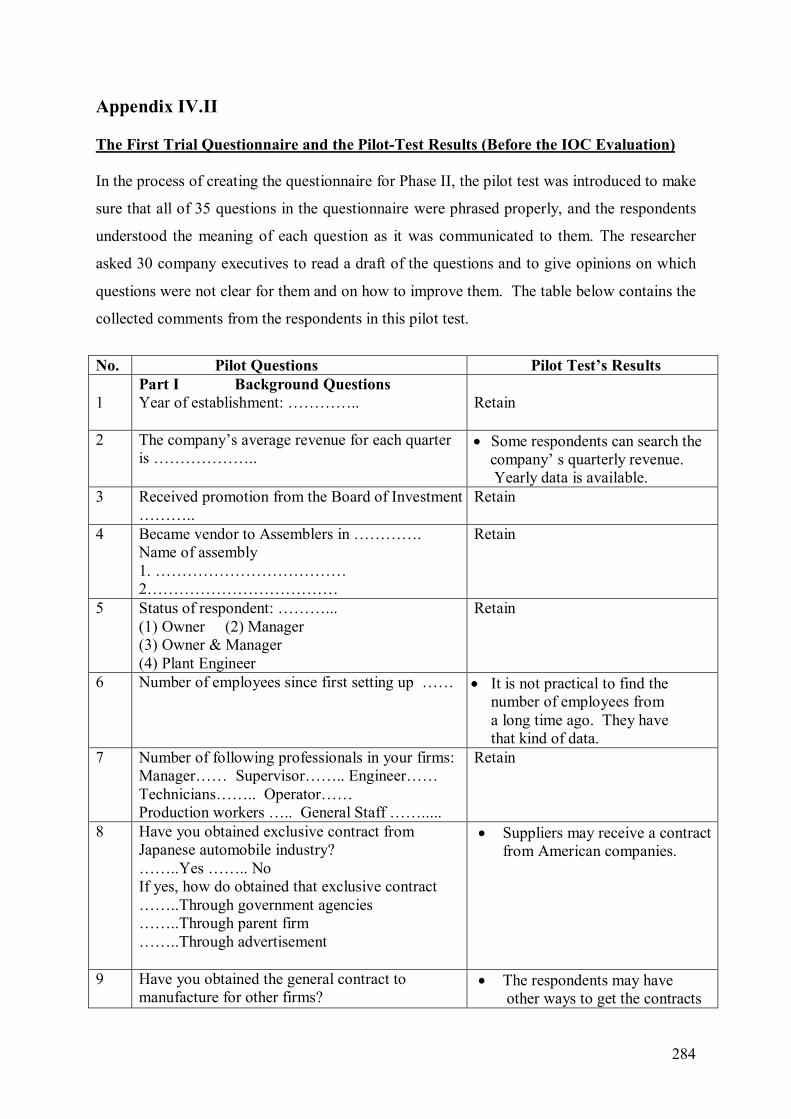
284
Appendix IV.II The First Trial Questionnaire and the Pilot-Test Results (Before the IOC Evaluation) In the process of creating the questionnaire for Phase II, the pilot test was introduced to make
sure that all of 35 questions in the questionnaire were phrased properly, and the respondents
understood the meaning of each question as it was communicated to them. The researcher
asked 30 company executives to read a draft of the questions and to give opinions on which
questions were not clear for them and on how to improve them. The table below contains the
collected comments from the respondents in this pilot test.
No. Pilot Questions Pilot Test’s Results 1
Part I Background Questions Year of establishment: …………..
Retain
2 The company’s average revenue for each quarter is ………………..
Some respondents can search the company’ s quarterly revenue. Yearly data is available.
3 Received promotion from the Board of Investment (BOI) in ………..
Retain
4 Became vendor to Assemblers in …………. Name of assembly 1. ……………………………… 2………………………………
Retain
5 Status of respondent: ………... (1) Owner (2) Manager (3) Owner & Manager (4) Plant Engineer
Retain
6 Number of employees since first setting up …… It is not practical to find the number of employees from a long time ago. They have that kind of data.
7 Number of following professionals in your firms: Manager…… Supervisor…….. Engineer…… Technicians…….. Operator…… Production workers ….. General Staff …….....
Retain
8 Have you obtained exclusive contract from Japanese automobile industry? ……..Yes …….. No If yes, how do obtained that exclusive contract ……..Through government agencies ……..Through parent firm ……..Through advertisement
Suppliers may receive a contract from American companies.
9 Have you obtained the general contract to manufacture for other firms?
The respondents may have other ways to get the contracts
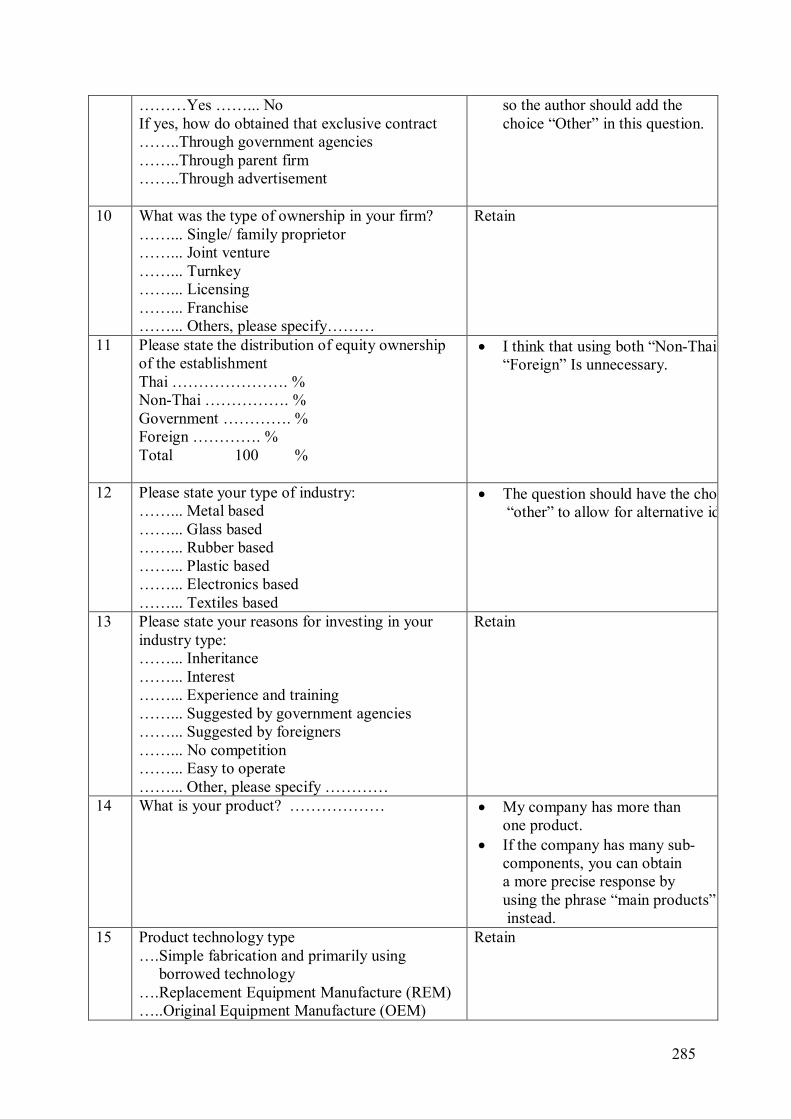
285
………Yes ……... No If yes, how do obtained that exclusive contract ……..Through government agencies ……..Through parent firm ……..Through advertisement
so the author should add the choice “Other” in this question.
10 What was the type of ownership in your firm? ……... Single/ family proprietor ……... Joint venture ……... Turnkey ……... Licensing ……... Franchise ……... Others, please specify………
Retain
11 Please state the distribution of equity ownership of the establishment Thai …………………. % Non-Thai ……………. % Government …………. % Foreign …………. % Total 100 %
I think that using both “Non-Thai” and “Foreign” Is unnecessary.
12 Please state your type of industry: ……... Metal based ……... Glass based ……... Rubber based ……... Plastic based ……... Electronics based ……... Textiles based
The question should have the choice of “other” to allow for alternative ideas
13 Please state your reasons for investing in your industry type: ……... Inheritance ……... Interest ……... Experience and training ……... Suggested by government agencies ……... Suggested by foreigners ……... No competition ……... Easy to operate ……... Other, please specify …………
Retain
14 What is your product? ………………
My company has more than one product.
If the company has many sub- components, you can obtain a more precise response by using the phrase “main products” instead.
15 Product technology type ….Simple fabrication and primarily using borrowed technology ….Replacement Equipment Manufacture (REM) …..Original Equipment Manufacture (OEM)
Retain
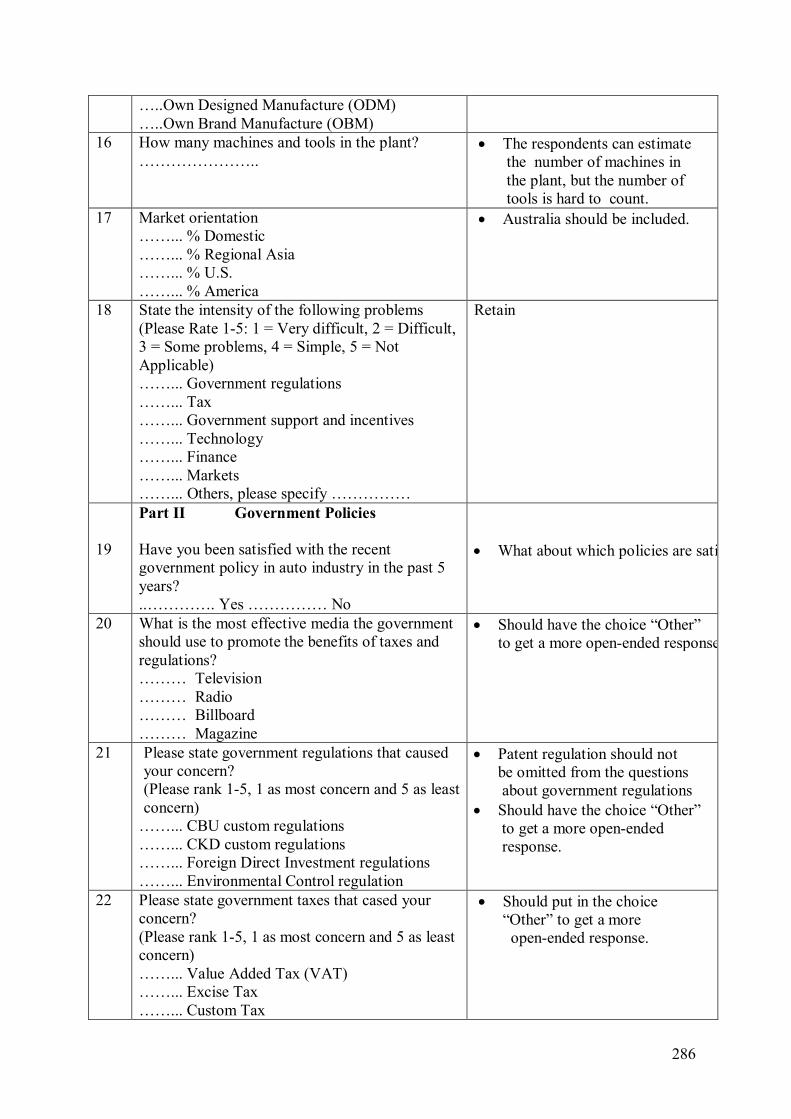
286
…..Own Designed Manufacture (ODM) …..Own Brand Manufacture (OBM)
16 How many machines and tools in the plant? …………………..
The respondents can estimate the number of machines in the plant, but the number of tools is hard to count.
17 Market orientation ……... % Domestic ……... % Regional Asia ……... % U.S. ……... % America
Australia should be included.
18 State the intensity of the following problems (Please Rate 1-5: 1 = Very difficult, 2 = Difficult, 3 = Some problems, 4 = Simple, 5 = Not Applicable) ……... Government regulations ……... Tax ……... Government support and incentives ……... Technology ……... Finance ……... Markets ……... Others, please specify ……………
Retain
19
Part II Government Policies Have you been satisfied with the recent government policy in auto industry in the past 5 years? ..…………. Yes …………… No
What about which policies are satisfactory?
20 What is the most effective media the government should use to promote the benefits of taxes and regulations? ……… Television ……… Radio ……… Billboard ……… Magazine
Should have the choice “Other” to get a more open-ended response.
21 Please state government regulations that caused your concern? (Please rank 1-5, 1 as most concern and 5 as least concern)
……... CBU custom regulations ……... CKD custom regulations ……... Foreign Direct Investment regulations ……... Environmental Control regulation
Patent regulation should not be omitted from the questions about government regulations
Should have the choice “Other” to get a more open-ended response.
22 Please state government taxes that cased your concern? (Please rank 1-5, 1 as most concern and 5 as least concern) ……... Value Added Tax (VAT) ……... Excise Tax ……... Custom Tax
Should put in the choice “Other” to get a more open-ended response.
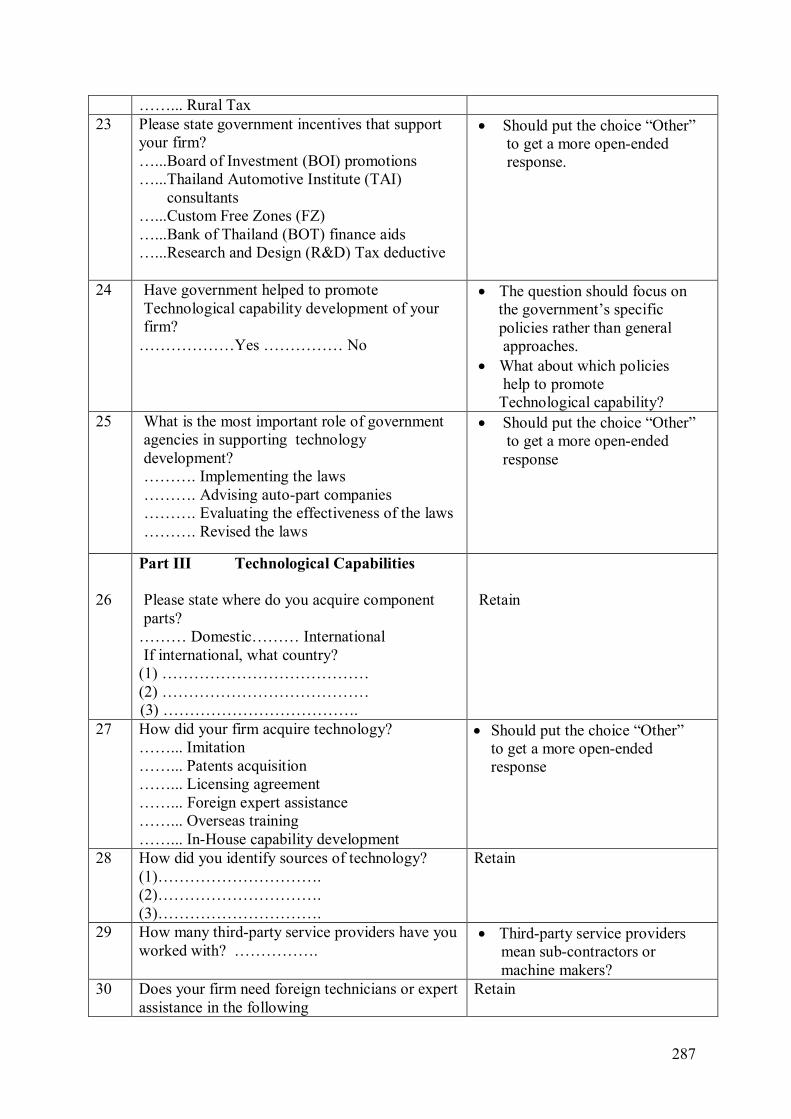
287
……... Rural Tax 23 Please state government incentives that support
your firm? …...Board of Investment (BOI) promotions …...Thailand Automotive Institute (TAI) consultants …...Custom Free Zones (FZ) …...Bank of Thailand (BOT) finance aids …...Research and Design (R&D) Tax deductive
Should put the choice “Other” to get a more open-ended response.
24 Have government helped to promote Technological capability development of your firm?
………………Yes …………… No
The question should focus on the government’s specific policies rather than general approaches. What about which policies help to promote Technological capability?
25 What is the most important role of government agencies in supporting technology development? ………. Implementing the laws ………. Advising auto-part companies ………. Evaluating the effectiveness of the laws ………. Revised the laws
Should put the choice “Other” to get a more open-ended response
26
Part III Technological Capabilities Please state where do you acquire component parts?
……… Domestic……… International If international, what country?
(1) ………………………………… (2) …………………………………
(3) ……………………………….
Retain
27 How did your firm acquire technology? ……... Imitation ……... Patents acquisition ……... Licensing agreement ……... Foreign expert assistance ……... Overseas training ……... In-House capability development
Should put the choice “Other” to get a more open-ended response
28 How did you identify sources of technology? (1)…………………………. (2)…………………………. (3)………………………….
Retain
29 How many third-party service providers have you worked with? …………….
Third-party service providers mean sub-contractors or machine makers?
30 Does your firm need foreign technicians or expert assistance in the following
Retain
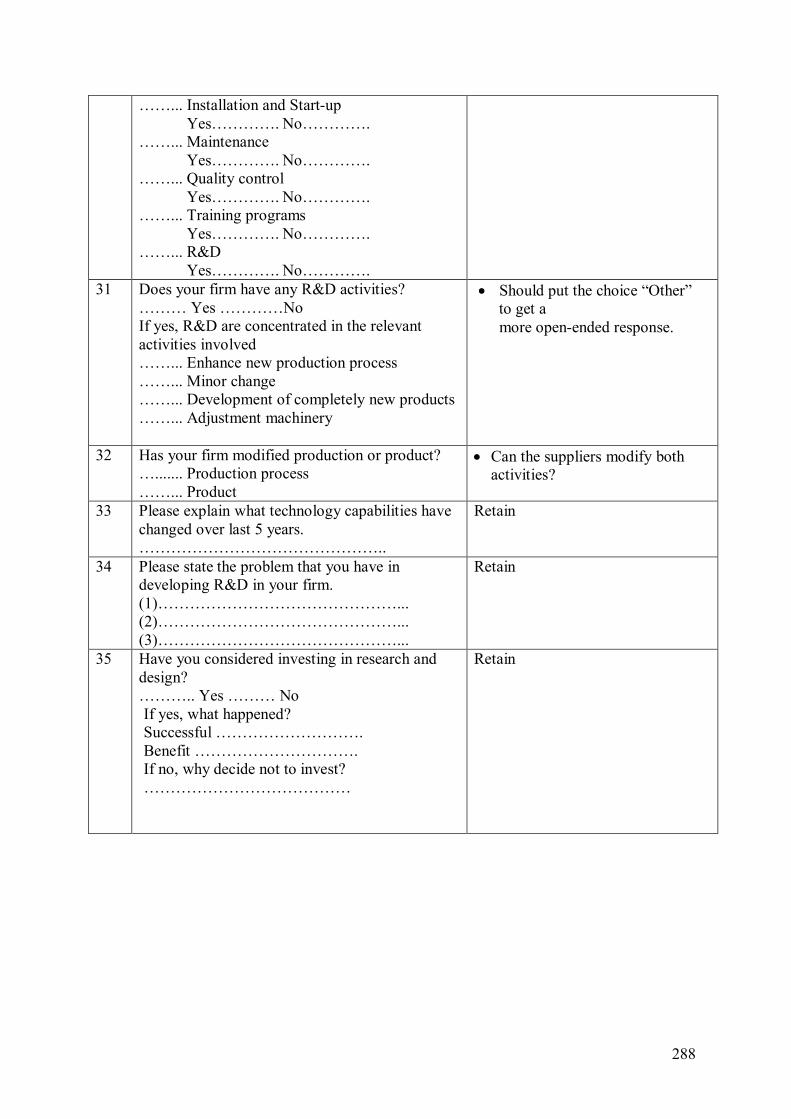
288
……... Installation and Start-up Yes…………. No………….
……... Maintenance Yes…………. No………….
……... Quality control Yes…………. No………….
……... Training programs Yes…………. No………….
……... R&D Yes…………. No………….
31 Does your firm have any R&D activities? ……… Yes …………No If yes, R&D are concentrated in the relevant activities involved ……... Enhance new production process ……... Minor change ……... Development of completely new products ……... Adjustment machinery
Should put the choice “Other” to get a more open-ended response.
32 Has your firm modified production or product? …....... Production process ……... Product
Can the suppliers modify both activities?
33 Please explain what technology capabilities have changed over last 5 years. ………………………………………..
Retain
34 Please state the problem that you have in developing R&D in your firm. (1)………………………………………... (2)………………………………………... (3)………………………………………...
Retain
35 Have you considered investing in research and design? ……….. Yes ……… No If yes, what happened? Successful ………………………. Benefit …………………………. If no, why decide not to invest? …………………………………
Retain