Embed Size (px)
Citation preview

AN EXAMINATION OF ASPHALTAN EXAMINATION OF ASPHALTCEMENT PROPERTIES ON LOWCEMENT PROPERTIES ON LOW
TEMPERATURE CRACKING ON THETEMPERATURE CRACKING ON THEC-LTPP AND C-SHRP TEST SITESC-LTPP AND C-SHRP TEST SITES
Susan Tighe, Ph.D., P.EngSusan Tighe, Ph.D., P.EngAssistant ProfessorAssistant Professor
The University of WaterlooThe University of Waterloo
Department of Civil EngineeringDepartment of Civil Engineering
Waterloo. ONWaterloo. ON
N2L 3G1N2L 3G1

PRESENTATION OUTLINEPRESENTATION OUTLINE
••Background - Background - University of Waterloo, University of Waterloo,
C-LTPP Experiment, C-SHRP Test RoadsC-LTPP Experiment, C-SHRP Test Roads
••Research Project & MethodologyResearch Project & Methodology
••Results and DiscussionResults and Discussion
••Conclusions and RecommendationsConclusions and Recommendations

UNIVERSITY OF WATERLOOUNIVERSITY OF WATERLOO
••One of largest civil engineering programs inOne of largest civil engineering programs in
CanadaCanada
••Located in Ontario - 1 hour west of TorontoLocated in Ontario - 1 hour west of Toronto
••33 tenured or tenure track professors33 tenured or tenure track professors
••80 graduate; 75 undergrads/year; co-op80 graduate; 75 undergrads/year; co-op

UNIVERSITY OF WATERLOOUNIVERSITY OF WATERLOO
••Roads and pavements research and educationRoads and pavements research and education
••Over 50 MA.Over 50 MA.ScSc and Ph.D graduates and Ph.D graduates
••Team: Profs. Ralph Haas, Susan TigheTeam: Profs. Ralph Haas, Susan Tighe
••Adjuncts: Drs. Norman McLeod, Gerhard Adjuncts: Drs. Norman McLeod, Gerhard
KennepohlKennepohl

C-LTPP EXPERIMENT24 Sites, 65 sections, Asphalt Overlays
Constructed 1989 - 1991

3 SitesBC
3 SitesSK
1 SiteAB 2 Sites
MB 4 SitesON
2 SitesQC
3 Sites3 SitesNFNF
1 Site1 SitePEPE
3 Sites3 SitesNBNB
2 Sites2 SitesNSNS

MAJOR FACTORSMAJOR FACTORS
Overlay Thickness (3 levels)Overlay Thickness (3 levels)
Climatic Zones (4 types)Climatic Zones (4 types)
Subgrade Types (2 types)Subgrade Types (2 types)
Traffic Levels (2 levels)Traffic Levels (2 levels)
AC Types (2 types)AC Types (2 types)

C-SHRP TEST SITESC-SHRP TEST SITES
••Test Roads - Lamont - Alberta (7 test sections), HearstTest Roads - Lamont - Alberta (7 test sections), Hearst
Ontario (4 test sections), Sherbrooke Quebec (4 testOntario (4 test sections), Sherbrooke Quebec (4 test
sections)sections)
••Constructed in 1991, 1992Constructed in 1991, 1992
••Validate or suggest changes to binder and mixtureValidate or suggest changes to binder and mixture
specifications for Canadian climatespecifications for Canadian climate

C-SHRP TEST SITESC-SHRP TEST SITES
••Validate or suggest changes to binder and mixtureValidate or suggest changes to binder and mixture
specifications for Canadian climatespecifications for Canadian climate
•• Investigate fracture temperature models Investigate fracture temperature models
••W.D. Roberston TAC Report 1997 (TB #15)W.D. Roberston TAC Report 1997 (TB #15)
••Anderson, Christison, Johnston TAC Report 1999 Anderson, Christison, Johnston TAC Report 1999
(TB #19), (TB #19), www.cshrp.orgwww.cshrp.org

RESEARCH PROJECTRESEARCH PROJECT
••Examine asphalt cement properties and lowExamine asphalt cement properties and low
temperature cracking on C-LTPP, C-SHRP sitestemperature cracking on C-LTPP, C-SHRP sites
••Existing data available for long term performanceExisting data available for long term performance
••Validity of empirical low temperature susceptibilityValidity of empirical low temperature susceptibility
indicesindices
••Low temperature model comparisonLow temperature model comparison

ACKNOWLEDGEMENTSACKNOWLEDGEMENTS
••C-SHRP C-LTPP Graduate Research GrantC-SHRP C-LTPP Graduate Research Grant
••Imperial Oil Limited University Research GrantImperial Oil Limited University Research Grant
••Natural Science and Engineering Research CouncilNatural Science and Engineering Research Council
••Transportation Association of Canada Emery-LindsayTransportation Association of Canada Emery-Lindsay
ScholarshipScholarship
•• Professors Ralph Haas and Park Reilly Professors Ralph Haas and Park Reilly

RESEARCH PROJECTRESEARCH PROJECT
••Examine asphalt cement properties and lowExamine asphalt cement properties and low
temperature cracking on C-LTPP, C-SHRP sitestemperature cracking on C-LTPP, C-SHRP sites
••Laboratory test data with in-service performance dataLaboratory test data with in-service performance data
••Compare predicted performance with observedCompare predicted performance with observed

RESEARCH METHODOLOGYRESEARCH METHODOLOGY
••Validation of empirical low temperature susceptibilityValidation of empirical low temperature susceptibility
indices - mainly CGSB information availableindices - mainly CGSB information available
••Statistical tests - ANOVA, Power TestStatistical tests - ANOVA, Power Test
••Low temperature cracking models - used PVN andLow temperature cracking models - used PVN and
other variables to predict crackingother variables to predict cracking
••Statistical tests to compare predictions to observedStatistical tests to compare predictions to observed
VERIFICATION OF PVNVERIFICATION OF PVN
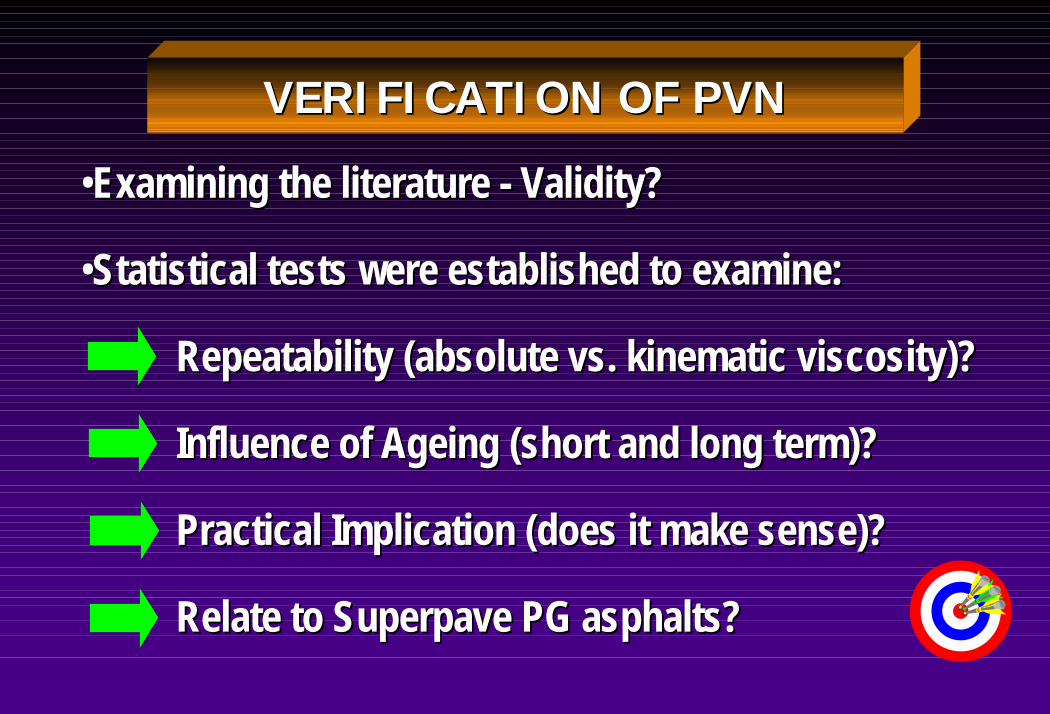
••Examining the literature - Validity?Examining the literature - Validity?
••Statistical tests were established to examine:Statistical tests were established to examine:
Repeatability (absolute vs. kinematic viscosity)?Repeatability (absolute vs. kinematic viscosity)?
Influence of Ageing (short and long term)?Influence of Ageing (short and long term)?
Practical Implication (does it make sense)?Practical Implication (does it make sense)?
Relate to Superpave PG asphalts?Relate to Superpave PG asphalts?

VERIFICATION OF PVNVERIFICATION OF PVN
PVN = PVN = -1.5 [L - log X]-1.5 [L - log X] [L - M] [L - M]
PVN PVN = Penetration Viscosity Number= Penetration Viscosity NumberXX = viscosity at 135C (= viscosity at 135C (cscs))LL = 4.258 - 0.797log P (= 4.258 - 0.797log P (cscs))MM = 3.463 - 0.611 log P= 3.463 - 0.611 log PP P = penetration at 25C= penetration at 25C*Ranges from - 1.0 to + 1.0, higher the value the less*Ranges from - 1.0 to + 1.0, higher the value the lesstemperature susceptible the asphalt cementtemperature susceptible the asphalt cement

VERIFICATION OF PVNVERIFICATION OF PVN
••Series of ANOVA and Power TestsSeries of ANOVA and Power Tests
••Repeatability: PVNRepeatability: PVNORIGINAL@135CORIGINAL@135C = PVN = PVNORIGINAL@60CORIGINAL@60C
••Influence of Ageing - short term:Influence of Ageing - short term:
PVN PVNORIGINAL@135CORIGINAL@135C = PVN = PVNAGED@60CAGED@60C
PVN PVNORIGINAL@60CORIGINAL@60C = PVN = PVNAGED@60CAGED@60C

VERIFICATION OF PVNVERIFICATION OF PVN
••Influence of Ageing - long term:Influence of Ageing - long term:
PVN PVNORIGINAL ORIGINAL = PVN= PVNAGEDAGED = PVN = PVNCONSTRUCTION CONSTRUCTION = PVN= PVN7YEARS7YEARS
••Engineering check - magnitudeEngineering check - magnitude
••Relate to Superpave PG asphalts - did a lower min PGRelate to Superpave PG asphalts - did a lower min PG
temperature relate to PVN?:temperature relate to PVN?:
PVN PVN58-2258-22 < PVN < PVN58-2858-28
VERIFICATION OF PVNVERIFICATION OF PVN
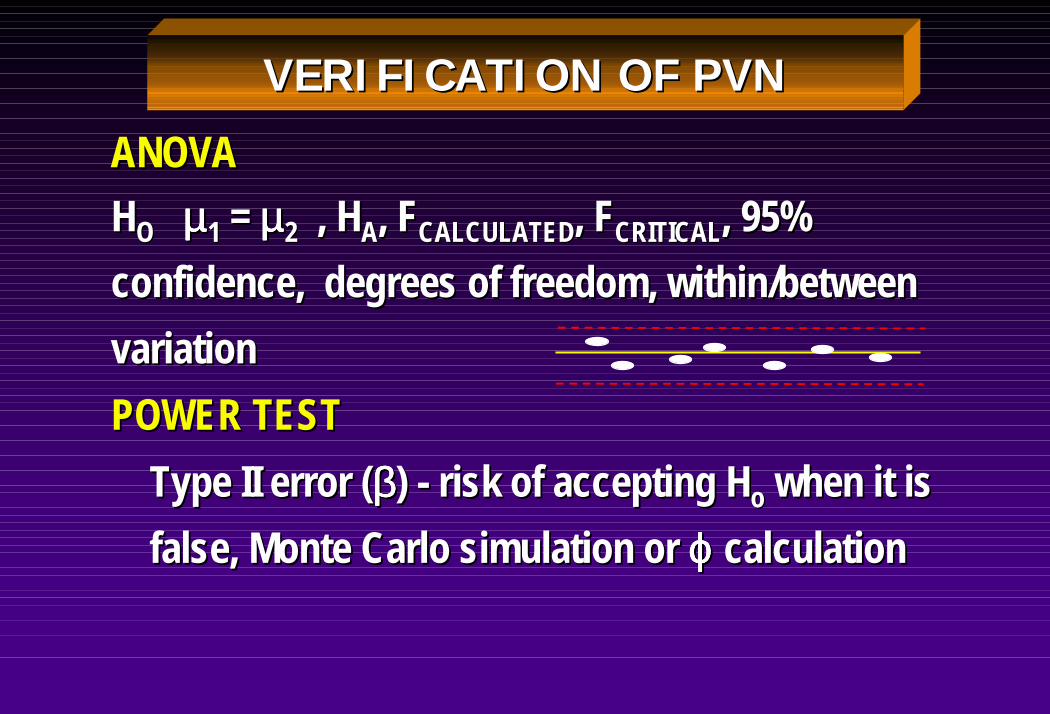
ANOVAANOVAHHOO µµµµµµµµ11 = = µµµµµµµµ22 , H , HAA, F, FCALCULATEDCALCULATED, F, FCRITICALCRITICAL, 95%, 95%confidence, degrees of freedom, within/betweenconfidence, degrees of freedom, within/betweenvariationvariationPOWER TEST POWER TEST Type II error ( Type II error (ββββββββ) - risk of accepting H) - risk of accepting Hoo when it is when it is false, Monte Carlo simulation or false, Monte Carlo simulation or ϕϕϕϕϕϕϕϕ calculation calculation

ANOVAANOVA TESTTEST FFCALCULATED CALCULATED FFCRITICAL CRITICAL Degrees DegreesOf FreedomOf Freedom
A A Between Between 55.4655.46 1.68 1.68 28 28 Within Within 0.36 0.36 3.16 3.16 2 2
B B Between Between 37.9037.90 1.62 1.62 48 48 Within Within 0.77 0.77 4.04 4.04 1 1
AA PVN PVNORIGINAL@135CORIGINAL@135C = PVN = PVNORIGINAL@60CORIGINAL@60C = PVN = PVNAGED@60CAGED@60C
BB PVN PVNORIGINAL@135CORIGINAL@135C = PVN = PVNORIGINAL@60CORIGINAL@60C
RESULTSRESULTS

ANOVAANOVA TESTTEST FFCALCULATED CALCULATED FFCRITICAL CRITICAL Degrees DegreesOf FreedomOf Freedom
C C Between Between 7.357.35 1.62 1.62 47 47 Within Within 3.613.61 4.04 4.04 1 1
D D Between Between 1.611.61 1.56 1.56 56 56 Within Within 1.041.04 4.04 4.04 1 1
CC PVN PVNORIGINAL@60CORIGINAL@60C = PVN = PVNAGED@60CAGED@60C
DD PVN PVNORIGINAL@60CORIGINAL@60C = PVN = PVNAGED@60C AGED@60C
RESULTSRESULTS

RESULTSRESULTS
Kandahl data AAPT 1996 - Kandahl data AAPT 1996 - (ANOVA E)(ANOVA E)
PVNPVNORIGINAL ORIGINAL = PVN= PVNAGEDAGED = PVN = PVNCONSTRUCTION CONSTRUCTION = PVN= PVN7YEARS7YEARS
WithinWithin F FCALCULATED CALCULATED 3.03 < F3.03 < FCRITICALCRITICAL 3.29 3.29
BetweenBetween F FCALCULATED CALCULATED 67.24 > F67.24 > FCRITICALCRITICAL 2.90 2.90

RESULTSRESULTS
Results Indicate:Results Indicate:
•• PVN remains constant with timePVN remains constant with time
•• PVN is repeatablePVN is repeatable
However Type II Error:However Type II Error:
•• Performed power test to examine errorPerformed power test to examine error
•• Probability of rejecting HProbability of rejecting Hoo
•• Power Curves were developedPower Curves were developed

POWER TESTPOWER TEST
YYijij = = µµµµµµµµijij + + αααααααα ijij + + ββββββββjj + + εεεεεεεε ijij
YYijij = probability of rejecting H= probability of rejecting Hoo
µµµµµµµµijij = a x [row averages matrix]= a x [row averages matrix]αααααααα ijij = [column averages matrix]= [column averages matrix]ββββββββjj = = iid iid N (N (µµµµµµµµ, , σσσσσσσσ22))εεεεεεεε ijij = percent difference in the true= percent difference in the true
population population

POWER TESTPOWER TEST
ϕϕϕϕϕϕϕϕ = [(1 / = [(1 / υυυυυυυυ11 + 1) + 1).5.5) + 1/) + 1/σσσσσσσσRR x (( x ((υυυυυυυυ22) ) ΣΣΣΣΣΣΣΣ αααααααα ii - - ααααααααmm))22)).5.5]/(]/(σσσσσσσσ22))
ϕϕϕϕϕϕϕϕ =coefficient Pearson & =coefficient Pearson & Hartley Hartley tabletableυυυυυυυυ11 = rows degrees of freedom = rows degrees of freedomυυυυυυυυ22 = column degrees of freedom = column degrees of freedomσσσσσσσσRR = standard deviation of rows = standard deviation of rowsσσσσσσσσ22 = variance of entire sample = variance of entire sampleαααααααα ii = mean for the = mean for the iithth row under Hrow under HAA
ααααααααmm = a [ row average matrix] = a [ row average matrix]

0.00.0
0.20.2
0.40.4
0.60.6
0.80.8
1.01.0
1.21.2
2.02.0 2.52.5 3.03.0 3.53.5 4.04.0
Percent Difference In True Values
Pro
ba
bil
ity
of
Re
jec
tin
g H
oββββββββ
Power Test For ANOVA EPower Test For ANOVA E
RESULTSRESULTS

Power % Difference Power % Difference υυυυυυυυ11 υυυυυυυυ 2 2 Purpose of ANOVA Purpose of ANOVAAnalysisAnalysis @ 95%@ 95%
A A 7.9%7.9% 2 2 28 28 Variability, Over Time(S) Variability, Over Time(S)
B B 6.7%6.7% 1 1 48 48 Variability Variability
C C 8.0%8.0% 1 1 47 47 Variability, Over Time(S) Variability, Over Time(S)
D D 45%45% 1 1 56 56 Over Time(S) Over Time(S)
E E 3.3%3.3% 3 3 5 5 Over Time (L) Over Time (L)
RESULTSRESULTS
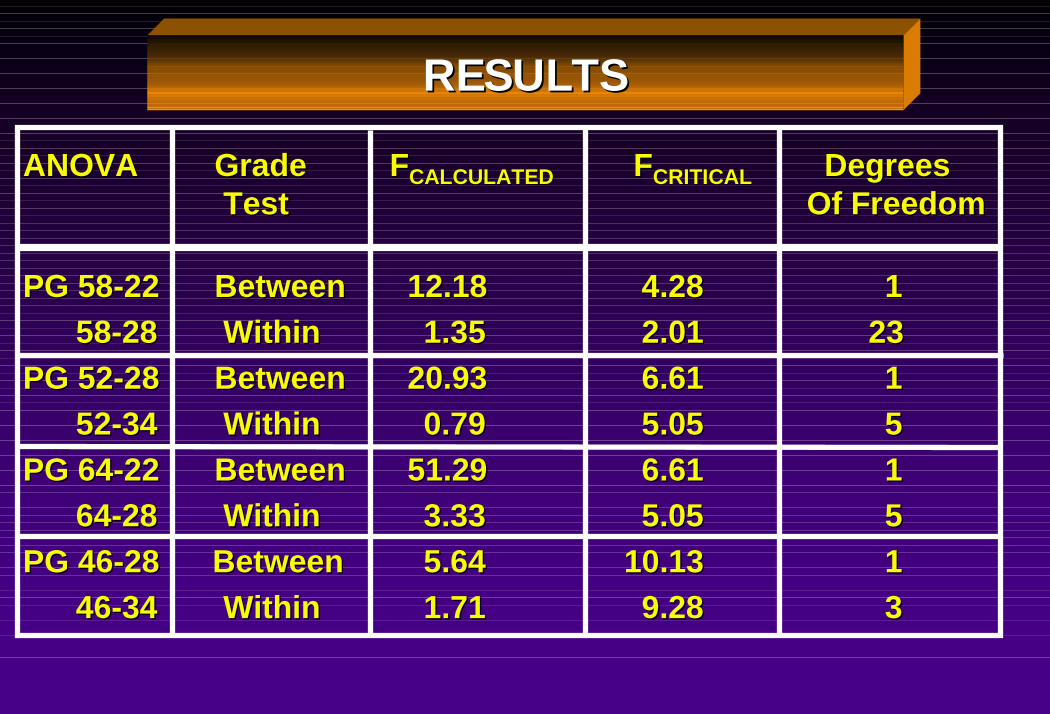
ANOVAANOVA GradeGrade F FCALCULATED CALCULATED FFCRITICAL CRITICAL Degrees Degrees Test Test Of Freedom Of Freedom
PG 58-22PG 58-22 Between 12.18Between 12.18 4.28 4.28 11
58-28 58-28 Within Within 1.35 1.35 2.01 2.01 23 23
PG 52-28PG 52-28 Between 20.93 Between 20.93 6.61 6.61 11
52-34 52-34 Within Within 0.79 0.79 5.05 5.05 55
PG 64-22PG 64-22 Between 51.29 Between 51.29 6.61 6.61 11
64-28 64-28 Within Within 3.33 3.33 5.05 5.05 55
PG 46-28 BetweenPG 46-28 Between 5.64 5.64 10.13 10.13 11
46-34 46-34 Within Within 1.71 1.71 9.28 9.28 33
RESULTSRESULTS

-0.8
-0.7
-0.6
-0.5
-0.4
-0.3
-0.2
-0.1
0
46 - 28 46 - 34 52 - 28 52 - 34 58 - 22 58 - 28 64 - 22 64 - 28
Superpave Performance GradesSuperpave Performance Grades
PV
NP
VN
RESULTSRESULTS
RESULTSRESULTS
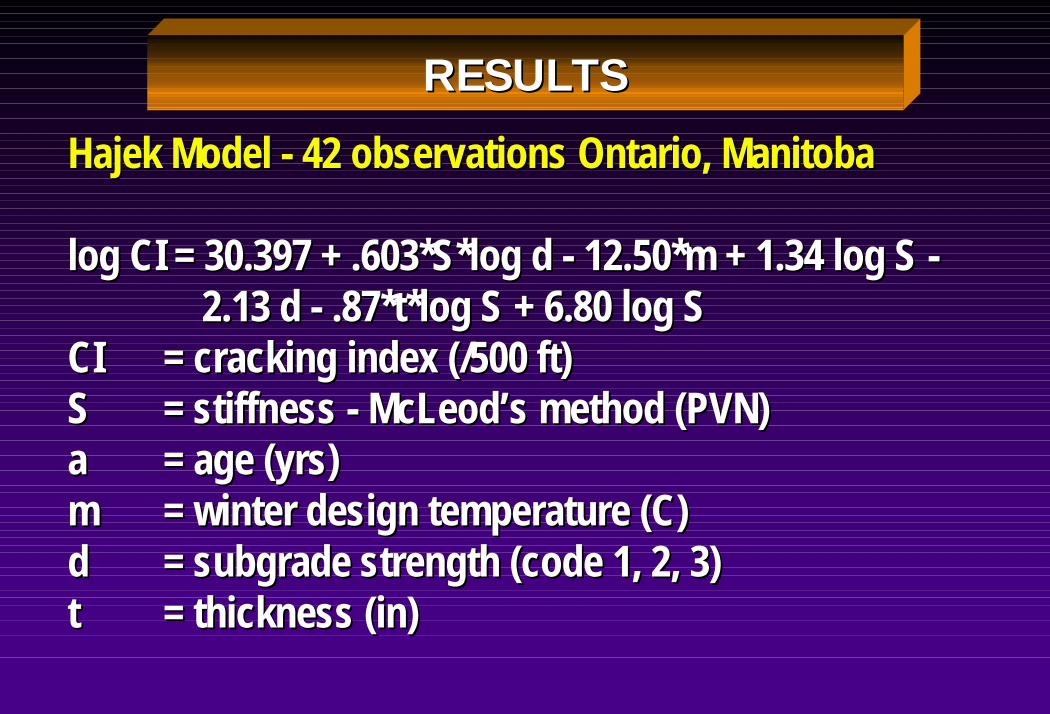
HajekHajek Model - 42 observations Ontario, Manitoba Model - 42 observations Ontario, Manitoba
log CI = 30.397 + .603*S*log d - 12.50*m + 1.34 log S -log CI = 30.397 + .603*S*log d - 12.50*m + 1.34 log S - 2.13 d - .87*t*log S + 6.80 log S 2.13 d - .87*t*log S + 6.80 log S
CI CI = cracking index (/500 ft)= cracking index (/500 ft)SS = stiffness - McLeod’s method (PVN)= stiffness - McLeod’s method (PVN)aa = age (= age (yrsyrs))mm = winter design temperature (C)= winter design temperature (C)dd = subgrade strength (code 1, 2, 3)= subgrade strength (code 1, 2, 3)t t = thickness (in)= thickness (in)

RESULTSRESULTS
Canadian Airport Model - 22 airports across CanadaCanadian Airport Model - 22 airports across Canada
TRANCRACK = 218 + 1.28 ACTHICK + 2.52MINTEMP +TRANCRACK = 218 + 1.28 ACTHICK + 2.52MINTEMP + 30 PVN - 60 COEFFX 30 PVN - 60 COEFFX
TRANCRACK = transverse crack spacing (m)TRANCRACK = transverse crack spacing (m)ACTHICKACTHICK = asphalt thickness (cm)= asphalt thickness (cm)PVNPVN = McLeod’s Penetration Viscosity Number= McLeod’s Penetration Viscosity NumberMINTEMP MINTEMP = minimum temperature recorded at site (C)= minimum temperature recorded at site (C)COEFFXCOEFFX = thermal contraction coefficient= thermal contraction coefficient
(mm/1000mm/C) (mm/1000mm/C)

0
20
40
60
80
100
120
140
Tra
nsv
erse
Cra
cks
Airport ModelHajek ModelObserved Cracking
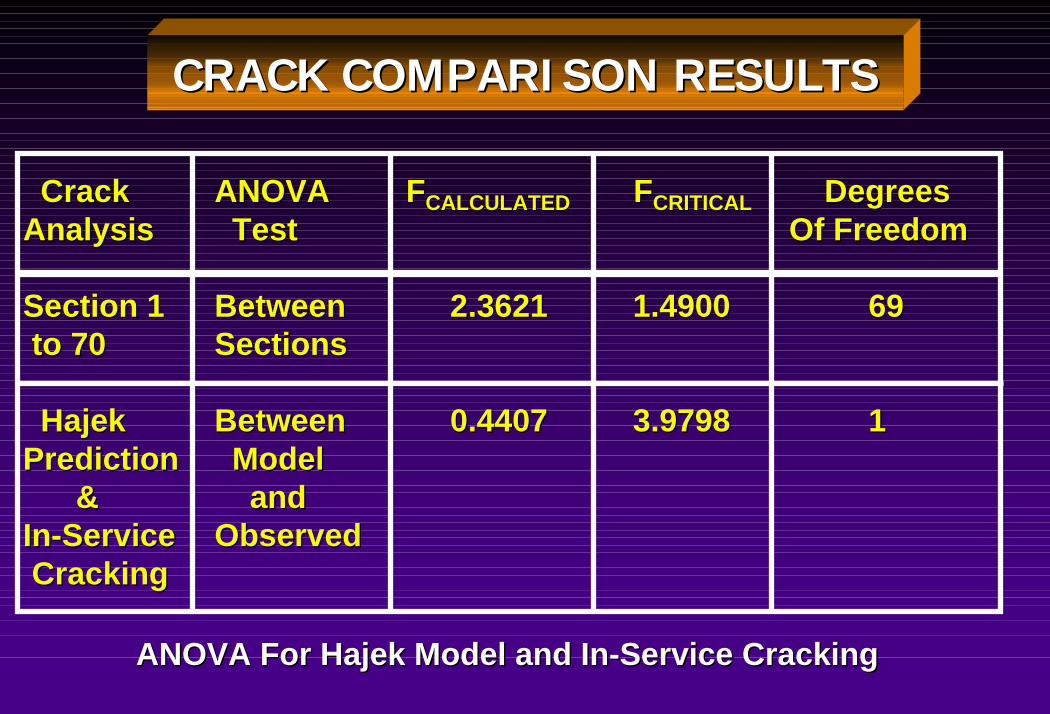
CRACK COMPARISON RESULTSCRACK COMPARISON RESULTS
Crack Crack ANOVAANOVA FFCALCULATED CALCULATED FFCRITICAL CRITICAL Degrees DegreesAnalysisAnalysis Test Test Of FreedomOf Freedom
Section 1 Section 1 BetweenBetween 2.3621 2.3621 1.4900 1.4900 69 69 to 70 to 70 SectionsSections
Hajek Hajek BetweenBetween 0.4407 0.4407 3.9798 3.9798 1 1PredictionPrediction Model Model & & and and In-ServiceIn-Service ObservedObserved Cracking Cracking
ANOVA For Hajek Model and In-Service CrackingANOVA For Hajek Model and In-Service Cracking
CRACK COMPARISON RESULTSCRACK COMPARISON RESULTS

0.00.0
0.20.2
0.40.4
0.60.6
0.80.8
1.01.0
1.21.2
3.03.0 3.33.3 3.73.7 4.14.1 4.54.5 4.94.9 5.35.3 5.75.7 6.16.1
Percent Difference In True ValuesPro
ba
bil
ity
of
Re
jec
tin
g H
oββββββββ
Power Test For Hajek Model and In-Service CrackingPower Test For Hajek Model and In-Service Cracking
CRACK COMPARISON RESULTSCRACK COMPARISON RESULTS

Crack Crack ANOVAANOVA FFCALCULATED CALCULATED FFCRITICAL CRITICAL Degrees DegreesAnalysisAnalysis Test Test Of FreedomOf Freedom
Section 1 Section 1 BetweenBetween 4.32 4.32 1.54 1.54 59 59 to 60 to 60 SectionsSections
Airport Airport BetweenBetween 3.44 3.44 4.04 4.04 1 1PredictionPrediction Model Model & & and and In-ServiceIn-Service ObservedObserved Cracking Cracking
ANOVA For Airport Model and In-Service Cracking < 70 cracksANOVA For Airport Model and In-Service Cracking < 70 cracks
CRACK COMPARISON RESULTSCRACK COMPARISON RESULTS

0.00.0
0.20.2
0.40.4
0.60.6
0.80.8
1.01.0
1.21.2
4.54.5 5.55.5 6.56.5 7.57.5 8.58.5 9.59.5 10.510.5
Percent Difference In True Values
Pro
ba
bil
ity
of
Re
jec
tin
g H
oββββββββ
Power Test For Airport Model and In-Service CrackingPower Test For Airport Model and In-Service Cracking
CRACK COMPARISON RESULTSCRACK COMPARISON RESULTS

CRACK COMPARISON RESULTSCRACK COMPARISON RESULTS
••Statistically Hajek Model same as observedStatistically Hajek Model same as observedcracking on C-LTPP and C-SHRPcracking on C-LTPP and C-SHRP••Power Tests Hajek is a good model with aPower Tests Hajek is a good model with asmall difference of 5.3%small difference of 5.3%••Statistically Canadian Airport Model sameStatistically Canadian Airport Model sameas observed less than 70 cracks / kmas observed less than 70 cracks / km••Power test Canadian Airport Model less thanPower test Canadian Airport Model less than70 cracks/km 8.5%70 cracks/km 8.5%

CONCLUSIONSCONCLUSIONS••Methodology predicting low temperatureMethodology predicting low temperaturecrackingcracking••PVN temporal, repeatable and appears to bePVN temporal, repeatable and appears to bea relationship with Superpave PG asphalta relationship with Superpave PG asphalt••Hajek model statistically same as observedHajek model statistically same as observedon C-LTPP and C-SHRPon C-LTPP and C-SHRP••Canadian Airport Model showed poorCanadian Airport Model showed poorprediction with sites where more than 70prediction with sites where more than 70cracks were observedcracks were observed

CONCLUSIONSCONCLUSIONS
••Continue monitoring at C-LTPP and C-SHRPContinue monitoring at C-LTPP and C-SHRP••Movement away from empirical tests: PVNMovement away from empirical tests: PVN may have some value: relatively simple, may have some value: relatively simple, good repeatability and finite sample good repeatability and finite sample••Good data available where Good data available where Superpave Superpave teststests results not available results not available••Pavement designers need tools:Pavement designers need tools:
DISTRESS PERFORMANCE DISTRESS PERFORMANCE COSTCOST


