Embed Size (px)
Citation preview

Ceramics-Silikáty 62 (4), 364-373 (2018)www.ceramics-silikaty.cz doi: 10.13168/cs.2018.0032
364 Ceramics – Silikáty 62 (4) 364-373 (2018)
THE PROPERTIES AND HYDRATION OF PORTLAND CEMENT CONTAINING CALCIUM SULFOALUMINATE CEMENT
WEIFENG LI*, JIN YU*, #SUHUA MA*, YUEYANG HU*, DASHUN GE*, XIAODONG SHEN*, **
*College of Materials Science and Engineering, Nanjing Tech University, Nanjing 210009, China**State Key Laboratory of Materials-Oriented Chemical Engineering, China
#E-mail: [email protected]
Submitted May 6, 2018; accepted July 17, 2018
Keywords: Portland cement, Calcium sulfoaluminate cement, Physical properties, Hydration kinetics
Calcium sulfoaluminate (CSA) cement has some attractive qualities, such as rapid setting, high early strength, and micro-expansion. It was commonly used to improve properties of Portland cement (PC). In this paper, the investigated results show that the setting times are notably reduced as the CSA cement content is increased. The compressive strength is slightly lower for the PC–CSA blends containing less than 10 % CSA cement, but notably lower for the PC–CSA blend containing 20 % CSA cement when compared to PC. High amounts of CSA cement significantly delay the hydration of alite, thereby increasing the porosity. Furthermore, the addition of CSA cement changes the ettringite morphology.
INTRODUCTION
Given the increasing requirements for Portland cement (PC), a series of problems have gradually emerged during the manufacturing of PC, such as envi-ronmental pollution and high energy consumption. Compared to PC clinker, calcium sulfoaluminate (CSA) clinker requires less limestone and energy [1, 2]. Additionally, the burning temperature of CSA clinker (1250 - 1350°C) is significantly lower than that of PC clinker (approx. 1450°C) [3]. CSA cement has some attractive properties, such as rapid setting, high early strength, and micro-expansion [4]. To save energy, reduce the cement industry’s emissions, and improve some of the properties of PC-based concrete, the majority of research has focused on the high addition of CSA cement on the properties and hydration of blends made of ordinary Portland cement (OPC) and CSA cement. For example, a direct encapsulation of low-level radio-active waste was made of a blend of 30 % OPC and 70 % CSA cement and increased the waste load by 56 % [5]. Péra and Ambroise [6] prepared a concrete with high early strength of 40 MPa at 6 h and higher than 55 MPa after 24 h by mixing 80 % CSA cement and 20 % OPC. The CSA clinker has been shown to be mainly respon-sible for the early mechanical properties, whereas OPC plays an important role at later ages in blends with OPC/CSA weight ratios of 6:3, 7:3, and 8:3 [8]. 10 % CSA cement did not affect the hydration mechanism of alite but did control the aluminate dissolution in OPC [9]. Chaunsali and Mondal [7] investigated the expansion
of OPC containing different amounts of CSA cement and proposed that increasing the CSA cement content increased the extent of expansion, and the samples containing the highest CSA cement content tested (30 % by mass) exhibited excessive expansion, which led to cracking because ettringite supersaturation gave rise to crystallisation stress. For more than ten years, we have been working on an Alite-ye’elimite system clinker. The Alite-ye’elimite clinker was synthesised by chemically introducing small amount of ye’elimite into Portland clinker during calcination [12-13]. We concluded that small amount of ye’elimite introduced could significantly improve early compressive strengths of Portland clinker, especially at 1 day. Consequently, we wanted to investigate whether small amount of CSA cement added physically could enhance the early compressive strength of Portland cement. Then, the effects of the small amount of CSA cement on the hydration of Portland cement have been studied.
EXPERIMENTAL
Raw materials
All of the experiments were conducted using Portland cement (PC) and commercial CSA cement. The chemical and mineralogical compositions of the two cements are given in Table 1 as determined by X-ray fluorescence (XRF) and quantitative X-ray diffraction (QXRD), respectively.

The properties and hydration of Portland cement containing calcium sulfoaluminate cement
Ceramics – Silikáty 62 (4) 364-373 (2018) 365
Preparation of the samples
The dosages of CSA cement are 1, 3, 5, 10 and 20 % by weight of PC. First, the PC and CSA cement were weighed separately, and then, they were mixed for 1 day in a shaker-mixer. The paste was prepared by stirring the mixture of a blend and water for 2 min with a speed of 500 rpm. The ratio of water to the blend was 0.5. The fresh paste was poured into plastic bottles, and then, the bottles were sealed and stored in a curing box with 98 % humidity at 20°C. After 30 min, 1 h, 6 h, 1 day, 3 days and 28 days, the hardened pastes were removed from the plastic bottles and cut into small pieces. Then, hydration was stopped by submerging the small pieces in ethanol for 1 day. After that, the pieces were dried in an oven at 40°C for 1 day. Some of the dried pieces were ground, and all the particles were passed through an 80-µm sieve for X-ray diffraction (XRD) and thermogravimetric (TG) experiments. The other pieces were retained for scanning electron microscopy (SEM) and mercury intrusion poro-simetry (MIP) experiments.
Methods
Amounts of water required for normal consistency and setting time
The amounts of required water for a normal con-sistency and setting time were determined with a Vicat apparatus in accordance with the Chinese National Standard (GB/T1346-2011).
Compressive strength The compressive strength was measured according to the Chinese National Standard (GB/T17671-1999). Mortar bars were cast at 20°C and 98 % relative humidity using a water-to-cement ratio of 0.5 and a sand-to-cement ratio of 3. The bars were removed from the mould after 24 h and placed into a curing box at 98 %
relative humidity and 20°C. The mortar bars were tested at 1, 3, and 28 days using an AEC-201 Automatic cement strength tester with a maximum load of 200 kN. The loading rate of the machine was 2.4 ± 0.2 kN·s-1.
Hydration heat flow The hydration heat release of the blended cement was determined by a conduction calorimeter (Thermometric TAM Air). The ratio of water to blended cement was 0.5. First, 4 ± 0.01 g of blended cement was weighed and poured into a plastic ampule. Then, an appropriate amount of water was suctioned by an admix ampoule and weighed according to the desired ratio of water to the blended cement. After that, the plastic ampule was sealed with the admix ampoule. Subsequently, the data was collected after the sealed plastic ampule was placed into the calorimeter. Finally, water was injected into the plastic ampule and mixed with the admix ampoule for 2 min when thermal equilibration of the conduction calorimeter was achieved.
X-ray diffraction (XRD) analysis The XRD experiments were performed with a PANalytical X’Pert Pro MPD diffractometer using Cu Ka radiation (λ = 1.54 Å) working in a Bragg-Brentano geometry with a 2θ-range of 5-65°. Qualitative analysis was performed using the Search Match software. A combination of XRD and Rietveld refinement was used for the phase quantification. The Rietveld quantitative analysis was performed with GSAS [14] and EXPGUI [15]. The refinements were performed based on the structure models shown in Table 2. The pro- file was fitted using pseudo-Voigt functions. The back-ground was fitted graphically with the shifted Chebyshev polynomial using 10 coefficients (more than 20 points were picked). The fitted parameters included phase fractions, lattice parameters and profile parameters.
Thermogravimetric (TG) analysis The TG experiments were performed on a Mettler Toledo TGA/DSC1 STARe instrument. Approximately 30 mg of the sample was placed in an alumina crucible and heated up to 1000°C at a rate of 10°C·min-1 under an N2 atmosphere.
Table 1. Chemical analysis of materials by XRF and the main phase composition of the materials by QXRD (O – Orthorhombic, C – Cubic).
Chemical PC
CSA Mineralogical PC
CSAanalysis cement composition cement (%) (%)Loss 3.24 3.63 C3S 51.2 –CaO 65.06 42.80 C2S 13.4 19.1MgO 0.71 2.94 C4A3$(O) – 23.0SO3 2.63 18.38 C4A3$2(C) – 23.5Al2O3 4.25 21.06 Anhydrite 0.4 15.3K2O 0.69 0.46 C3A 6.1 –Fe2O3 3.01 1.48 Ferrite 7.5 –SiO2 19.62 12.66 C12A7 – 2.5Na2O 0.01 0.05 Calcite 3.8 4.1TiO2 0.23 0.76 Dolomite – 3.9 Perovskite – 3.0
Table 2. Powder mixture proportions (volume) and designa-tions.
Designation % PC % CSA cement
P 100 0 1 % 100 1 3 % 100 3 5 % 100 5 10 % 100 10 20 % 100 20 S 0 100
Li W., Yu J., Ma S., Hu Y., Ge D., Shen X.
366 Ceramics – Silikáty 62 (4) 364-373 (2018)
Scanning electron microscopy(SEM) analysis
A JSM-7600F SEM was used to observe the mor-phologies of the hydration products. For this analysis, small pieces were coated with gold in advance and examined at 15 kV.
Mercury intrusion porosimetry(MIP) analysis
This measurement was performed on a Quanta chrome PoreMaster GT60 MIP. This instrument has high pressure in the range of 20 to 20 000 psi and low pressure in the range of 1.1 to 20 psi and can be used to measure pore sizes ranging from 0.0035 to 400 μm. The pore radii were calculated according to the Washburn equation, i.e., r = −2γcos θ/P, where r is the pore entry radius in which mercury intrudes, γ is the surface tension, and θ and P are the contact angle of mercury with the solid and the applied pressure, respectively. The contact angle was 140°, and γ was 0.48 N·m-1.
RESULTS AND DISCUSSION
Setting times and quantities of required water for normal consistency
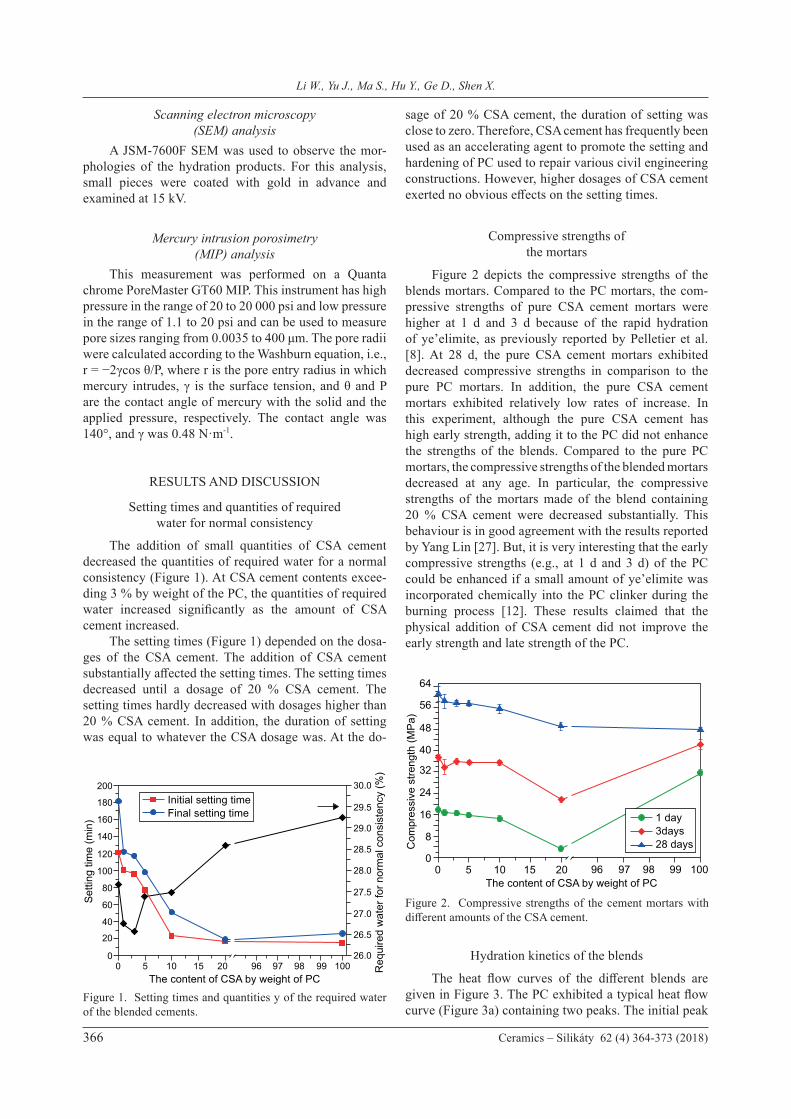
The addition of small quantities of CSA cement decreased the quantities of required water for a normal consistency (Figure 1). At CSA cement contents excee-ding 3 % by weight of the PC, the quantities of required water increased significantly as the amount of CSA cement increased. The setting times (Figure 1) depended on the dosa-ges of the CSA cement. The addition of CSA cement substantially affected the setting times. The setting times decreased until a dosage of 20 % CSA cement. The setting times hardly decreased with dosages higher than 20 % CSA cement. In addition, the duration of setting was equal to whatever the CSA dosage was. At the do-
sage of 20 % CSA cement, the duration of setting was close to zero. Therefore, CSA cement has frequently been used as an accelerating agent to promote the setting and hardening of PC used to repair various civil engineering constructions. However, higher dosages of CSA cement exerted no obvious effects on the setting times.
Compressive strengths ofthe mortars
Figure 2 depicts the compressive strengths of the blends mortars. Compared to the PC mortars, the com-pressive strengths of pure CSA cement mortars were higher at 1 d and 3 d because of the rapid hydration of ye’elimite, as previously reported by Pelletier et al. [8]. At 28 d, the pure CSA cement mortars exhibited decreased compressive strengths in comparison to the pure PC mortars. In addition, the pure CSA cement mortars exhibited relatively low rates of increase. In this experiment, although the pure CSA cement has high early strength, adding it to the PC did not enhance the strengths of the blends. Compared to the pure PC mortars, the compressive strengths of the blended mortars decreased at any age. In particular, the compressive strengths of the mortars made of the blend containing 20 % CSA cement were decreased substantially. This behaviour is in good agreement with the results reported by Yang Lin [27]. But, it is very interesting that the early compressive strengths (e.g., at 1 d and 3 d) of the PC could be enhanced if a small amount of ye’elimite was incorporated chemically into the PC clinker during the burning process [12]. These results claimed that the physical addition of CSA cement did not improve the early strength and late strength of the PC.
Hydration kinetics of the blends
The heat flow curves of the different blends are given in Figure 3. The PC exhibited a typical heat flow curve (Figure 3a) containing two peaks. The initial peak
0 10 20 97 99 1005 15 96 98The content of CSA by weight of PC
0
20
40
60
80
100
120
140
160
180
200
Set
ting
time
(min
)
26.0
26.5
27.0
27.5
28.0
28.5
29.0
29.5
30.0
Req
uire
d w
ater
for n
orm
al c
onsi
sten
cy (%
)
Initial setting timeFinal setting time
0 10 20 96 98 99 1005 15 97The content of CSA by weight of PC
0
8
16
24
48
56
64
32
40
Com
pres
sive
stre
ngth
(MP
a)
1 day3days28 days
Figure 1. Setting times and quantities y of the required water of the blended cements.
Figure 2. Compressive strengths of the cement mortars with different amounts of the CSA cement.

The properties and hydration of Portland cement containing calcium sulfoaluminate cement
Ceramics – Silikáty 62 (4) 364-373 (2018) 367
was assigned to a combination of exothermic wetting and the formation of a gelatinous coating and AFt-phase rods [9, 28-30], followed by an induction period until approximately 3 hours of hydration (Figure 3b). After the induction period, a maximum exothermic peak appeared at approximately 13 hours. The second peak corresponded to the hydration of C3S. The PC showed a shoulder to the right of the second peak at approximately 17 hours. The shoulder was associated with the renewed formation of AFt [9, 28, 31], and Rahhal [32] reported that this peak relates to the transformation of AFt to monosulfoaluminate (AFm). The heat flow curve of the pure CSA cement contained three main exothermic peaks (Figures 3a, b). However, the positions of the peaks differed from those of the PC, except for the first one. For the CSA cement, the initial peak appeared at 30 min and was attributed to a combination of wetting and AFt formation. Compared to the PC, the CSA cement exhibited a higher initial peak due to rapid hydration of ye’elimite (Figure 3b). In addition, the induction period of the CSA cement was shorter, which is in agreement with the setting times. After the induction period, the second exothermic peak was observed at about 1.75 h corresponding to the induction period of the PC. The CSA cement showed a shoulder on the right of the second peak. At about 22 h, the third peak presented in the heat flow curve of the CSA cement. As previously reported [33], hydration of the CSA cement involves a multi-stage acceleration-deceleration-acceleration process. However, some anhydrites were retained for up to 1 d (Figure 4d). Therefore, these peaks were attributed to the formation of ettringite at different stages of hydration. For the blends, their hydration kinetics were greatly different from that of the PC or CSA cement as the dosage of the CSA cement increased (Figure 3a, b). Compared to the PC, the exothermic heat flows were higher for the blends within 30 min due to the incorporation of ye’elimite. The blend containing 1 % CSA cement presented a second exothermic peak that was similar
to that of the PC. But the shoulder on the right of the second peak was advanced for the blend containing 1 % CSA cement. For the blend containing 5 % CSA cement, no shoulder was observed in the curve of the heat flow. However, there seemed to be an exothermic peak at about 70 h for the blend containing 5 % CSA cement. The hydration kinetics of the blend containing 20 % CSA changed obviously compared to those of the other blends. In addition to the initial peak, the blend containing 20 % CSA cement exhibited the second exothermic peak within 3 h, which was similar to the pure CSA cement. Small amounts of anhydrite were retained in the blend containing 20 % CSA cement within 1 h of hydration, and no portlandite was noted (Figure 5a). Therefore, the second peak was caused by the renewed formation of ettringite. In addition, the heat release peak from the hydration of alite was present at about 90 h, which was significantly delayed for the blend containing 20 % CSA cement (Figure 3a).
XRD analysis
The XRD patterns for the blends hydrated for 30 min, 1 h, 6 h, 1 d, 3 d, and 28 d are shown in Figure 4. For the PC, the clinker phases, such as C3A, ferrite, C3S and C2S, were consumed at different rates. Ettringite formed at 30 min of hydration due to the rapid reaction of the aluminate phase and gypsum (Figure 4a). Gypsum was no longer detectable after 1 d (Figures 4d, e, f). At 28 d, some of the ettringite transformed to monocarbo-aluminate because of the absence of gypsum (Figure 4f). In addition, C3A was almost depleted, whereas a small quantity of ferrite was retained because of its relatively slow hydration rate. Portlandite formed at 1 d (Figure 4d) via the hydration of C3S at the early ages, and its content increased steadily with the hydration age. The other hy-dration product, i.e., C–S–H, was not observed in the XRD patterns because of its poor crystallinity. For the pure CSA cement, the hydration products differed from those of the PC. As shown in Table 1, the
0 20 40 50 70 80 9010 30 60Time (h)
0
0.5
1.0
1.5
2.0
3.0
2.5
Hea
t flo
w (m
W g
-1)
P1 %5 %20 %S
P1 %5 %20 %S
0 1.0 2.0 2.50,5 1.5 3.0Time (h)
0
4
8
12
16
20
Hea
t flo
w (m
W g
-1)
Figure 3. Heat flow curves as a function of time for the different samples: a) 0 to 88 h, b) 0 to 3 h.a) 0 to 88 h b) 0 to 3 h

Li W., Yu J., Ma S., Hu Y., Ge D., Shen X.
368 Ceramics – Silikáty 62 (4) 364-373 (2018)
6 9 122θ (°CuKα)
P
1%
5%
20%
E
E F
FE E E
E
E
EY
Y
CH
Y
Y M
CF
Y
YB
BA
AA
AA
C$
C$Cc
S
15 18 21 24 27 30 33 36
6 9 122θ (°CuKα)
P
1%
5%
20%
E
F
E
E
E
E
E
EE
E
CH CH
CHY
YM
B
B
A
AMc
A
A
C$ C$Cc
S
15 18 21 24 27 30 33 36
6 9 122θ (°CuKα)
P
1%
5%
20%
E
F
E E EE
E
EY
Y
G
G
Y
Y M
CF
Y
YB
BA
A
AA
C$
C$
Cc
S
15 18 21 24 27 30 33 36
6 9 122θ (°CuKα)
P
1%
5%
20%
E
E
F
E
EE
E
E
E
EE
CH
CH
CH
Y
Y M
C
YB B
A
AA
AA
C$
C$Cc
S
15 18 21 24 27 30 33 36
6 9 122θ (°CuKα)
P
1%
5%
20%
E
F
E
E
E
E
E
E
E E
CH CH
CHY
Y MB BA
Mc
Hc
A
C$C$Cc
S
15 18 21 24 27 30 33 36
6 9 122θ (°CuKα)
P
1%
5%
20%
E
E F
E E E E
E
EY
Y Y
GG
Y
Y M
CF
Y
YB
BA
AA
AA
C$
C$Cc
S
15 18 21 24 27 30 33 36
Figure 4. XRD patterns of the different cements hydrated for 30 min, 1 h, 6 h, 1 d, 3 d, and 28 d (E – Ettringite; Y – Ye’elimite; C$ – Anhydrate; G – Gypsum; Cc – Calcite; CH – Portlandite; Ms: Monosulfoaluminate; Hc – Hemicarboaluminate; Mc – Mono-carboaluminate; C – Aluminate phase; F – Ferrite phase; A – Alite; B – Belite.
c) 6 hours
e) 3 days
a) 30 min
d) 1 day
f) 28 days
b) 1 hour

The properties and hydration of Portland cement containing calcium sulfoaluminate cement
Ceramics – Silikáty 62 (4) 364-373 (2018) 369
main phases were C2S, C4A3$, C12A7, and anhydrate. The total amounts of C4A3$ and C12A7 were much greater than that of C3A in the PC. At the early ages, the contents of ettringite were higher in the CSA than those in the PC due to rapid hydration of ye’elimite (Figures 4a, b, c), reaching a plateau within 30 min and remaining more or less constant until approximately 1 d. At 1 d, the con-tents of ettringite increased substantially in the CSA (Figures 4d, e, f). The diffraction peaks intensities of ye’eli-mite notably decreased. These results further indicated that the exothermic peak at about 20 h was attributed to the multiple hydration points of ye’elimite for the CSA cement. Simultaneously, the contents of sulphate decreased with the formation of ettringite. However, some anhydrite was retained up to 28 d. For the blended cements, the addition of CSA sig-nificantly accelerated the formation of ettringite at the early age, and the contents of ettringite increased with the CSA dosage at the same hydration age. It was very interesting that the contents of ettringite were higher for the blend with 20 % CSA within 6 h, compared to the pure CSA cement. S. Allevi et al. [35] reported that the increased soluble ettringite phase formation was detected with greater C4A3$ consumption in the first hours of the hydration of the CSA clinker in the presence
of gypsum compared to anhydrite. Furthermore, the addition of CSA cement accelerated the consumption of gypsum. Gypsum nearly disappeared from the blend with 20 % CSA cement at 1 h, whereas some gypsum was retained in the PC (Figure 4b). Interestingly, the characteristic peak of portlandite appeared in the XRD patterns for the blends pastes with 1 % and 5 % CSA cement after hydration of 6 h, but it did not appear in the PC paste and the blend paste containing 20 % CSA. The characteristic peak of portlandite did not appear until 3 d for the blend paste with 20 % CSA cement. At 28 d, some monocarboaluminate formed in the blends pastes due to the presence of calcite.
TGA
The TG curves and corresponding derivative TG (DTG) curves are shown in Figure 5 for all the samples hydrated for 1 h, 1 d, 3 d, and 28 d. Based on the results of the XRD experiments, the endothermic peak at approximately 100°C can be attributed to the dehydra-tion of ettringite/ and C–S–H for all the samples. The mass loss at approximately 100°C further showed that the addition of CSA cement promoted the formation of ettringite within 1 h (Figure 5a). The endothermic
0 100 200 300 400 450 50050 150 250 350T (°C)
AFt/C–S–H
Ms/Hc
CH
AH3
80
85
75
90
95
100
105
110
115
120
TG (%
)
0.50
0.45
0.40
0.35
0.30
0.25
0.20
0.15
0.10
0.05
0
DTG
(%/°
C)
P1%5%20%S
0 100 200 300 400 450 50050 150 250 350T (°C)
AFt/C–S–H
GCHAH3
93
96
99
102
105
108
111
TG (%
)
0.20
0.18
0.16
0.14
0.12
0.10
0.08
0.06
0.04
0.02
0
DTG
(%/°
C)
P1%5%20%S
0 100 200 300 400 450 50050 150 250 350T (°C)
AFt/C–S–H
Ms/HcCH
AH3
80
85
75
90
95
100
105
110
115
120
TG (%
)
0.50
0.45
0.40
0.35
0.30
0.25
0.20
0.15
0.10
0.05
0
DTG
(%/°
C)
P1%5%20%S
0 100 200 300 400 450 50050 150 250 350T (°C)
AFt/C–S–H
Ms
CH
AH3
80
85
90
95
100
105
110
115
120
TG (%
)
0.50
0.45
0.40
0.35
0.30
0.25
0.20
0.15
0.10
0.05
0
DTG
(%/°
C)
P1%5%20%S
Figure 5. The TG-DTG curves of the cement pastes at the different hydration ages (AFt – Ettringite; Ms – Monosulfoaluminate; Hc – Hemicarboaluminate; Mc – Monocarboaluminate; CH – Portlandite; G – Gypsum; AH3 – Al(OH)3.
c) 3 days
a) 1 hour
d) 28 days
b) 1 day

Li W., Yu J., Ma S., Hu Y., Ge D., Shen X.
370 Ceramics – Silikáty 62 (4) 364-373 (2018)
peak at 125°C corresponded to the dehydration of gypsum. Large amounts of gypsum were depleted in the blend with 20 % CSA cement at 1h. The endothermic peak at approximately 250°C was ascribed to the dehydration of Al(OH)3 from the hydration reaction of C4A3$, whereas that at approximately 400°C resulted from the dehydration of portlandite. As the hydration age increased, the content of portlandite also increased significantly for the PC and blends with 1 % and 5 % CAS cement hydrated. No portlandite formed in the CSA cement because of the lack of alite. Additionally, no portlandite was observed in the blend with 20 % CSA cement at 1d also, demonstrating that the addition of CSA hindered its formation. However, a small amount of monocarboaluminate formed at 1d in the blend with 20 % CSA because of the presence of calcite and the absence of sulfates; this formation corresponded to the endothermic peak at approximately 150°C (Figure 5b). Up until 3 d of hydration, portlandite formed in the blend containing 20 % CSA cement. Simultaneously, some monocarboaluminate emerged in the PC and blends with 1 % and 5 % CSA cement. However, no mono-carboaluminate formed in the CSA cement because anhydrite persisted throughout the hydration process.
Morphologies ofthe hydration products
The morphology of ettringite was changed by the addition of the CSA cement. Figure 5a shows that ettringite existed as a thin and long elongated needle in the PC hydrated for 1 d. However, its morphology became relatively thick and short when the CSA cement was added to the PC to generate the blended cements (Figures 6b, c, d). The morphology of ettringite in the blend pasture containing 20 % CSA cement was similar to that in the pure CSA cement paste at 1 d, in which it seemed to be covered by AH3 gel. In addition, portlandite was difficult to identify in the blend paste containing 20 % CSA cement, whereas some was detected in both the PC and the blend with 5 % CSA cement.
Pore size distribution
To investigate the effect of the CSA cement dosage on the pore structure of the PC, the pore size distribu-tions of all pastes were determined (Figure 7). At an early hydration age (1 d), a small amount of CSA cement decreased the pore size of the PC. The pore sizes were mainly distributed between 0.3 µm and 2 µm in the PC
Figure 6. The SEM images of the different cements hydrated for 1 day.
c) 20 % – 1 day
a) P – 1 day
d) S – 1 day
b) 5 % – 1 day

The properties and hydration of Portland cement containing calcium sulfoaluminate cement
Ceramics – Silikáty 62 (4) 364-373 (2018) 371
paste and were reduced in the blends pastes with the 1 % and 5 % CSA cement. However, the cumulative pore volumes hardly changed in the blended pastes with 1 % and 5 % CSA cement relative to that of the PC paste (Table 3). Compared with the PC paste, the addition of a greater amount of CSA cement (20 %) did not change the pore size. However, 20 % CSA significantly increased the pore volume in the 0.3 - 2 µm range. Consequently, the porosity of the blended paste with 20 % CSA cement was higher than that of the PC paste (Table 4). Although 20 % CSA cement accelerated the formation of ettringite in the blend paste at this age, it delayed the hydration of alite and hindered the formation of portlandite. Indeed, in the CSA cement paste, the pore size was very small because of the formation of large amounts of ettringite. As hydration progressed, the pore sizes of all samp-les decreased. After 3 days of hydration, the pore size distributions of the blended pastes were similar to that of the PC paste, and the pore sizes were mainly distribu-ted between 0.01 µm and 1 µm. A small amount of CSA cement increased the pore volumes in the 0.05 - 0.1 µm range, and a higher CSA cement content significant-ly enhanced the pore volumes in the 0.05 - 0.2 µm range. The blended pastes exhibited higher porosities than the PC paste. The pore volumes in the range of 0.1 µm to 1 µm were substantially lower in the CSA cement paste, which decreased its porosity (Table 4). At the late hydration age (28 d), small amounts of CSA cement had no effects on the pore size distribution. Pores were distributed from 0.03 µm to 0.1 µm for all pastes, except for the blended paste with 20 % CSA cement, which exhibited relatively large pore sizes. Additionally, the pore volumes in the 0.03 - 0.1 µm range were enhanced in the blended and CSA cement pastes.
Table 3. ICSD collection codes and references for all phases used in the Rietveld quantitative phase analysis.
Phase ICSD code Ref
C3S 81100 [16]C2S 81096 [17]C3A 151369 [18]C4AF 9197 [19]C4A3$(O) 237892 [20]C4A3$(C) 9560 [21]CaSO4 15876 [22]C12A7 6287 [23]Dolomite 10404 [24]Perovskite 38212 [25]Calcite 18165 [26]
Table 4. Total porosity of cements hydrated for 1 day, 3 days and 28 days.
Samples Total porosity (%) Samples Total porosity (%) Samples Total porosity (%)P – 1 day 41.1 P – 3 days 26.7 P – 28 days 18.71 % – 1 day 39.3 1 % – 3 days 32.5 1 % – 28 days 23.75 % – 1 day 40.7 5 % – 3 days 35.4 5 % – 28 days 22.820 % – 1 day 47.2 20 % – 3 days 36.9 20 % – 28 days 27.2S – 1 day 32.8 S – 3 days 24.5 S – 28 days 21.6
0.01 0.1 1 10010Pore diameter (µm)
0
0.1
0.2
0.3
0.4
0.6
0.5
-dV
/d(lo
g D
)
P1 %5 %20 %S
0.01 0.1 1 10010Pore diameter (µm)
0
0.1
0.2
0.3
0.4
0.6
0.5-d
V/d
(log
D)
P1 %5 %20 %S
0.01 0.1 1 10010Pore diameter (µm)
0
0.1
0.2
0.3
0.4
0.6
0.5
-dV
/d(lo
g D
)
P1 %5 %20 %S
Figure 7. Pore size distributions of the cements hydrated for 1 day, 3 days, and 28 days.
c) 28 days
b) 3 days
a) 1 day

Li W., Yu J., Ma S., Hu Y., Ge D., Shen X.
372 Ceramics – Silikáty 62 (4) 364-373 (2018)
CONCLUSION
● The setting times and compressive strengths depen-ded on the dosage of the CSA cement. The addition of the CSA cement to the PC substantially shortened the setting times, and the setting time of the blend with 20 % CSA cement approached that of the CSA cement. The compressive strengths of the blended mortar with less than 10 % CSA cement decreased slightly at every hydration age relative to those of the PC mortars. The addition of a large amount of CSA (20 %) significantly lowered the compressive strengths at the early ages (1 d and 3 d). However, the strong, negative effect of the CSA cement was reduced at late hydration ages.
● A small amount of CSA cement did not affect the hydration kinetics of the PC. The renewed hydration of C3A was delayed in the blend containing 5 % CSA cement. However, when the dosage of CSA cement was increased to 20 % by weight of the PC, the hydration kinetics changed substantially relative to that of the PC. The hydration of alite was seriously delayed. The second formation of ettringite was advanced and enhanced within 3 h of hydration of the blend with 20 % CSA cement compared to that of the pure CSA cement.
● At the early hydration ages, the formation of ettringite accelerated as the dosage of the CSA cement increased. Additionally, the blend with 20 % CSA cement contained higher contents of ettringite at 1 h than the pure CSA cement. However, the formation of portlandite was delayed by the addition of 20 % CSA cement, which led to larger pore sizes and higher porosity relative to those of the other hydrated samples. In addition, the addition of the CSA cement significantly affected the morphology of ettringite.
Acknowledgements
The authors are grateful for the financial support of the National Key R & D Programme of China (No. 2017YFB0309902), the National Natural Science Foundation of China (51772146), the Key University Science Research Project of Jiangsu Province (NO. 17KJA430008), the state key laboratory of green building materials, Jiangsu National Synergetic Innovation Centre for Advanced Materials (SICAM), the National Building Materials Industry Technology Innovation Programme (2015-M3-2) and a project funded by the Priority Academic Programme Development of Jiangsu Higher Education Institutions (PAPD). The support by the facilities of the Modern Analysis and Testing Centre at Nanjing TECH University, where the detailed microstructural analyses were performed, are also acknowledged.
REFERENCES
1. Sharp J. H., Lawrence C. D., Yang R. (1999): Calcium sulphoaluminate cements – low-energy cements, special cements or what. Advances in Cement Research, 11(1), 3-13. doi: 10.1680/adcr.1999.11.1.3
2. Glasser F. P., Zhang L. (2001): High-performance cement matrices based on calcium sulphoaluminate–belite compo-sitions. Cement and Concrete Research, 31(12), 1881-1886. doi: 10.1016/S0008-8846(01)00649-4
3. Chen I. A., Hargis C. W., Juenger M. C. G. (2012): Understanding expansion in calcium sulfoaluminate-belite cements. Cement and Concrete Research, 42(1), 51-60. doi: 10.1016/j.cemconres.2011.07.010
4. Zhang L., Su M. Z., Wang Y. M. (1999): Development of the use of sulfo-and ferroaluminate cements in China. Advances in cement research, 11(1), 15-21. doi: 10.1680/adcr.1999.11.1.15
5. Coumes C. C. D., Courtois S., Peysson S., Ambroise J., Pera, J. (2009): Calcium sulfoaluminate cement blended with OPC: A potential binder to encapsulate low-level radioactive slurries of complex chemistry. Cement and Concrete Research, 39, 740–747. doi: 10.1016/j.cem-conres.2009.05.016
6. Pe´ra J., Ambroise J. (2004): New applications of calcium sulfoaluminate cement. Cement and Concrete Research, 34, 671–676. doi: 10.1016/j.cemconres.2003.10.019
7. Chaunsali P., Mondal P. (2015): Influence of Calcium Sulfoaluminate (CSA) Cement Content on Expansion and Hydration Behavior of Various Ordinary Portland Cement-CSA Blends. Journal of the American Ceramic Society, 98(8), 2617-2624. doi: 10.1111/jace.13645
8. Pelletier L., Winnefeld F., Lothenbach B. (2010): The ternary system Portland cement-calcium sulphoaluminate clinker-anhydrite: Hydration mechanism and mortar pro-perties. Cement and Concrete Composites, 32(7), 497-507. doi: 10.1016/j.cemconcomp.2010.03.010
9. Le Saoût G., Lothenbach B., Hori A., Higuchi T., Winnefeld F. (2013): Hydration of Portland cement with additions of calcium sulfoaluminates. Cement and Concrete Research, 43, 81-94. doi: 10.1016/j.cemconres.2012.10.011
10. Trauchessec R., Mechling J.–M., Lecomte A., Roux A., Le Rolland B. (2015): Hydration of ordinary Portland cement and calcium sulfoaluminate cement blends. Cement and Concrete Composites, 56, 106-114. doi: 10.1016/j.cemcon-comp.2014.11.005
11. Lothenbach B., Le Saout G., Gallucci E., Scrivener K. (2008): Influence of limestone on the hydration of Portland cements. Cement and Concrete Research, 38(6), 848-860. doi: 10.1016/j.cemconres.2008.01.002
12. Ma S., Shen X., Gong X., Zhong B. (2006): Influence of CuO on the formation and coexistence of 3CaO·SiO2 and 3CaO·3Al2O3·CaSO4 minerals. Cement and Concrete Research, 2006, 36 (9):1784-1787. doi: 10.1016/j.cemcon-res.2006.05.030
13. Ma S., Snellings R., Li X., Shen X., Scrivener K. L. (2013): Alite-ye’elimite cement: Synthesis and mineralogical ana-lysis. Cement and Concrete Research, 45(1), 15-20. doi: 10.1016/j.cemconres.2012.10.020
14. Larson A.C., Dreele R.B.V., Larson A.C., Dreele R.B.V. (2000). General Structure Analysis System (GSAS). Report La-UR-86-748. Los Alamos National Laboratory, New Mexico, USA.

The properties and hydration of Portland cement containing calcium sulfoaluminate cement
Ceramics – Silikáty 62 (4) 364-373 (2018) 373
15. Toby B. H. (2001): EXPGUI, a graphical user interface for GSAS. Journal of Applied Crystallography, 34(2), 210-213. doi:10.1107/S0021889801002242
16. Mumme W G. (1995): Crystal structure of tricalcium sili-cate from a Portland cement clinker and its application to quantitative XRD analysis. Neues Jahrbuch fur Mineralogie Monatshefte, 4, 145-145.
17. Mumme W. G, Hill R. J, Bushnell-Wye G, Segnit E.R. (1995): Rietveld crystal structure refinements, crystal chemistry and calculated powder diffraction data for the polymorphs of dicalcium silicate and related phases. Neues Jahrbuch fur Mineralogie Abhandlungen, 169(1),35-68.
18. Mondal P., Jeffery J. W. (1975): The crystal structure of tricalcium aluminate, Ca3Al2O6. Acta Crystallographica Section B, 31(3), 689-697. doi: 10.1107/S0567740875003639
19. Pedersen B. F., Semmingsen D. (1982): Neutron diffraction refinement of the structure of gypsum, CaSO4. 2H2O. Acta Crystallographica, 38(4), 1074–1077. doi: 10.1107/S0567740882004993
20. Cuesta A, De la Torre A. G, Losilla E. R, Peterson V. K, Rejmak P, Ayuela A, Aranda M. A. (2013): Structure, atomistic simulations, and phase transition of stoichiometric yeelimite. Chemistry of Materials, 25(9), 1680-1687. doi: 10.1021/cm400129z
21. Calos N. J, Kennard C. H. L, Whittaker A. K, Davis R. L. (1995): Structure of calcium aluminate sulfate Ca4Al6O16$. Journal of Solid State Chemistry, 119(1), 1-7. doi: 10.1016/ 0022-4596(95)80002-7
22. Cheng G. C. H, Zussman J. (1963): The crystal structure of anhydrite (CaSO4). Acta Crystallographica, 16(8), 767-769. doi: 10.1107/S0365110X63001997
23. Novák J, Coufová P. (1968): Zur defektstruktur des Al2O3. Collection of Czechoslovak Chemical Communications, 33(3), 656-663. :
24. Drits V. A, McCarty D. K, Sakharov B, Milliken K. L. (2005): New insight into structural and compositional variability in some ancient excess-Ca dolomite. The Ca-nadian Mineralogist, 43 (4), 1255-1290. doi: 10.2113/gscanmin.43.4.1255
25. Yamanaka T,. Hirai N., Komatsu Y. (2002): Structure change of Ca1–xSrxTiO3 perovskite with composition and pressure. American Mineralogist, 87(8-9), 1183-1189. doi: 10.2138/am-2002-8-917
26. Chessin H., Hamilton W.C., Post B. (1965): Position and thermal parameters of oxygen atoms in calcite. Acta Crystallographica, 18(4): 689-693. doi: 10.1107/S0365110 X65001585
27. Qian L. I. (2007): Research of Composite Cement on Silicate and Sulphoaluminate. Journal of Liaoning Univer-sity (Natural Sciences Edition), 2, 017.
28. Hesse C., Goetz-Neunhoeffer F., Neubauer J. (2011): A new approach in quantitative in-situ XRD of cement pastes: Correlation of heat flow curves with early hydration reactions. Cement and Concrete Research, 41(1), 123-128. doi: 10.1016/j.cemconres.2010.09.014
29. Jansen D., Goetz-Neunhoeffer F., Lothenbach B., Neubauer J. (2012) The early hydration of Ordinary Portland Cement (OPC): An approach comparing measured heat flow with calculated heat flow from QXRD. Cement and Concrete Research, 42(1), 134-138. doi: 10.1016/j.cemconres.2011. 09.001
30. Jansen D., Goetz-Neunhoeffer F., Stabler C., Neubauer J. (2011): A remastered external standard method applied to the quantification of early OPC hydration. Cement and Concrete Research, 41(6), 602-608. doi: 10.1016/j.cemconres.2011.03.004
31. Scrivener K. L., Juilland P., Monteiro P. J. M. (2015): Advances in understanding hydration of Portland cement. Cement and Concrete Research, 78, 38–56. doi: 10.1016/j.cemconres.2015.05.025
32. Rahhal V., Talero R. (2005): Early hydration of Portland cement with crystalline mineral additions. Cement and Concrete Research, 35(7), 1285-1291. doi: 10.1016/j.cemconres.2004.12.001
33. He Z., Yang H. M., Liu M. Y. (2014): Hydration mechanism of sulphoaluminate cement. Journal of Wuhan University of Technology-Mater. Sci. Ed., 29(1), 70-74. doi: 10.1007/s11595-014-0869-8
34. Minard H., Garrault S., Regnaud L., Nonat A., (2007): Mechanisms and parameters controlling the tricalcium aluminate reactivity in the presence of gypsum, Cement and Concrete Research, 37, 1418–1426. doi: 10.1016/j.cemconres.2007.06.001
35. Allevi S., Marchi M., Scotti F., Bertini S., Cosentino C. (2016): Hydration of calcium sulphoaluminate clinker with additions of different calcium sulphate sources, Materials and Structures, 49, 453–466. doi: 10.1617/s11527-014-0510-5