Embed Size (px)
Citation preview

Volume-II, Issue-II September 2015 59
International Journal of Humanities & Social Science Studies (IJHSSS) A Peer-Reviewed Bi-monthly Bi-lingual Research Journal ISSN: 2349-6959 (Online), ISSN: 2349-6711 (Print) Volume-II, Issue-II, September 2015, Page No. 59-72
Published by Scholar Publications, Karimganj, Assam, India, 788711 Website: http://www.ijhsss.com
An Evaluation of the Restructuring and Revival Packages
Implemented in the SLPEs in Kerala
Haseena Jasmine C K
Research Scholar, Research & Development Centre, Bharathiar University, Coimbatore,
Tamil Nadu, India
Abstract The financial health of public sector enterprises is severely affected by a number of problems such
as high interest burden, transport cost, accumulation of stock, outdated technology, low recovery,
high cost of production etc. This paper looks at the vulnerability of the restructured public sector
enterprises in Kerala. This article aims at using bankruptcy prediction model developed by
Edward Altman, Professor of Finance, Stern School of Business, New York University, i.e.,
the application of Z-Score method to the selected public sector enterprises in Kerala, for the
purpose of predicting their financial health. Three public sector enterprises located in the
state of Kerala were selected and their financial soundness is assessed with the help of ‘Z’
score analysis, Production Performance Analysis and Sales Performance Analysis and Break
Even Analysis. The conclusions drawn could provide effective guidelines to the management
of selected public sector enterprises in Kerala and their stakeholders.
Keywords: Financial Distress, Z score Analysis, Public Sector Enterprises, Production
Performance Analysis, Sales Performance Analysis and Break Even Analysis
Introduction
Financial analysis is a powerful mechanism which helps in ascertaining the strength and
weakness in the operations and finances of any enterprise. Generally a company will be able
to improve its financial image thereby enhancing its chances when applying for a bank loan
for various activities. Also it will be able to identify and correct per formance problems before
they have a major impact on the business.
The Public Sector Enterprises have played a significant role in the economic and social
development of our country since independence. In pursuit of these objectives, massive
investment has been made over the past five decades to build a strong Public Sector. Besides
acting as a wheel of economic development, Public Enterprises are entrusted with the task of
contributing to ensure social justice, poverty eradication, employment generat ion, achieving
balanced regional development and accelerating the growth of agriculture and industry.
The performance of Public Sector Enterprises during the past decades reveals a wide gap
between the aims and achievements. The poor performance of the Public Sector Enterprises
has been a great concern to the society in general and for planners and policy makers in
particular.

An Evaluation of the Restructuring and Revival Packages … Haseena Jasmine C K
Volume-II, Issue-II September 2015 60
The aim of industrial and economic development cannot be achieved by merely having an
ideological bias. It has to be supplemented with concrete and positive performance.
Unfortunately most of the Public Sector Undertakings have failed in developing positive
image in terms of financial performance. Some of them have even turned „sick‟. The sick
firms are either closed down or rehabilitated. Many Public sector enterprises have been
restructured or revived pumping in large sums of public money. Such rehabilitation
programmes have often been made on non-economic grounds. Since tax payers‟ and state
financial institution‟s money is spent on such revival programmes, it merits a bit of research
to analyse the objectives of such revival and restructuring programmes and how much these
have actually been met.
Financial Distress
Financial distress may be defined as a situation where a firm is not able to meet its
maturing obligations on time. A high degree of financial leverage increases the risk of
financial distress and it may ultimately lead to liquidation. Such a situation affects both the
equity and debt holders adversely.
Review of literature
Many of the research works have been conducted over the period to evaluate the financial
performance of the company with the help of various financial ratios or by applying the
Multiple Discriminant Analysis to predict the corporate failure. L. C. Guptha ( 1999)
attempted a refinement of Beaver‟s method with objective of predicting the business failure.
Whereas M. A. Mulla (2002) made a study in Textiles Mill with help of Z Score model for
evaluating the financial health with five weighted financial ratios and followed by Selvam M
and Others (2004) had revealed about Cement industry‟s financial health with special
reference India Cements limited. S K Bagchi (2004) analysed about practical implication of
accounting ratios in risk evaluation and concluded that accounting ratios are still dominant
factors in the matter of credit evaluation. K. Chitanya (2005) used Z model to measure the
financial distress of IDBI and concluded that IDBI is likely to become insolvent in the years
to come. From the above reviews, the researcher identified the research gap, which could
bedealt in this study.
Statement of the Problem
The Government of Kerala has spent large amounts of money year after year on
rehabilitating or restructuring state public sector enterprises. Such programmes have been
implemented at the cost of new enterprises or welfare spending. It is in public interest to
evaluate the outcomes of such large spending from the state‟s exchequer, often justified on
saving hundreds of jobs.
It is required to look into the objectives of such state spending and how much of it has
helped in reviving the enterprises involved. If it has not served the purpose, why the effort
and money went waste? Whether such revival or restructuring programmes need any
monitoring in the future?
The study will attempt to find answers to a few important questions like: whether such
state spending could have been saved? Does the revival or restructuring meet the objectives
set for such revival or restructuring?

An Evaluation of the Restructuring and Revival Packages … Haseena Jasmine C K
Volume-II, Issue-II September 2015 61
Objectives of study
The main focus of the present study is the evaluation of the restructuring and revival packages
implemented in the SLPEs in Kerala. The study centers on the following objectives.
1. To identify and measure the financial status of the selected public sector enterprises
and to compare the financial status before and after implementation of revival and
restructuring package
2. To assess the Production Performance of the selected public sector enterprises and to
compare the Production Performance before and after implementation of revival and
restructuring package
3. To assess the Sales Performance of the selected public sector enterprises and to
compare the Sales Performance before and after implementation of revival and
restructuring package.
4. To suggest appropriate measures for improving the status of the selected public sector
enterprises and restore them to sound health.
Methodology
There are 104 state enterprises in Kerala of which nine are statutory corporations. Of the
remaining, 63 are working under Industries Department out of which 17 are closed down for
long periods. The study identified the list of state public sector enterprises which were
restructured in the past ten years to evaluate the effectiveness of such interventions. For the
purpose of the study, three companies were selected about which data were available.
The secondary data required for the study were collected from the rehabilitated or restructured
state public sector enterprises in Kerala and from the Industries Department of the state and
also from various journals, magazines and related websites etc.
Z score Analysis
“Z” score analysis has been established by Edward I. Altman (1968) to evaluate the
general trend in the financial health of enterprises over a period. Many of the individual
accounting ratios used frequently to predict the financial performances of an enterprise might
only provide warnings when it is too late to take a corrective action. Further single ratio does
not convey much of the sense. There is no internationally accepted standard for financial
ratios against which the results can be compared. Therefore, Edwin I Altman combined a
number of accounting ratios (liquidity, leverage, activity and profitability) to form an index of
the probability, which is an effective indicator of corporate performance in predicting
bankruptcy. In this direction, the study has tried to evaluate the financial performance of three
selected public sector enterprises. That is the study tries to evaluate whether public sector
enterprises are solvent or bankrupt.
The formula used to evaluate the “Z” score established by Altman is as follows.
Z = 1.2 X1 + 1.4 X2 + 3.3 X3 + 0.6 X4 + 0.999 X5
Where, Z is the overall index.
1. X1 = Working capital / Total assets. This ratio is considered to be a reasonable
predictor of deepening trouble for a company.
An Evaluation of the Restructuring and Revival Packages … Haseena Jasmine C K
Volume-II, Issue-II September 2015 62
2. X2 = Retained earnings/ total assets. This ratio provides information on the extent to
which a company has been able to reinvest its earning in itself.
3. X3 = EBDIT / total assets. This ratio adjusts company earnings for varying income tax
factors and makes adjustments for leveraging due to borrowings.
4. X4 = Market value of equity / total debt. This ratio gives an indication on how much a
company‟s assets can decline in value before the liabilities exceeds the assets and the
firm becomes insolvent.
5. X5 = net sales / total assets. This ratio measures the ability of the company‟s assets to
generate the sales.
Interpretation of Z score
Altman established the following guidelines to be used to classify firms as either
financially sound or bankrupt and he outlined following three different guidelines for Healthy
Zone.
1. “Z” score value of below 1.86 - Bankruptcy Zone. Firm‟s failure is certain and
extremely likely and would occur within two years. That is the company is confirmed
to be financially sick.
2. Between 1.86 to 2.66 – Healthy Zone. The firm is considered to be healthy, but the
failure in this situation is uncertain to predict. That is the company is likely to become
financially sick.
3. “Z” score value of 2.66 and above – Very Healthy Zone. Firms‟ financial health is
very much viable and firm will not fail. That is, the company is said to be good in
financial status.
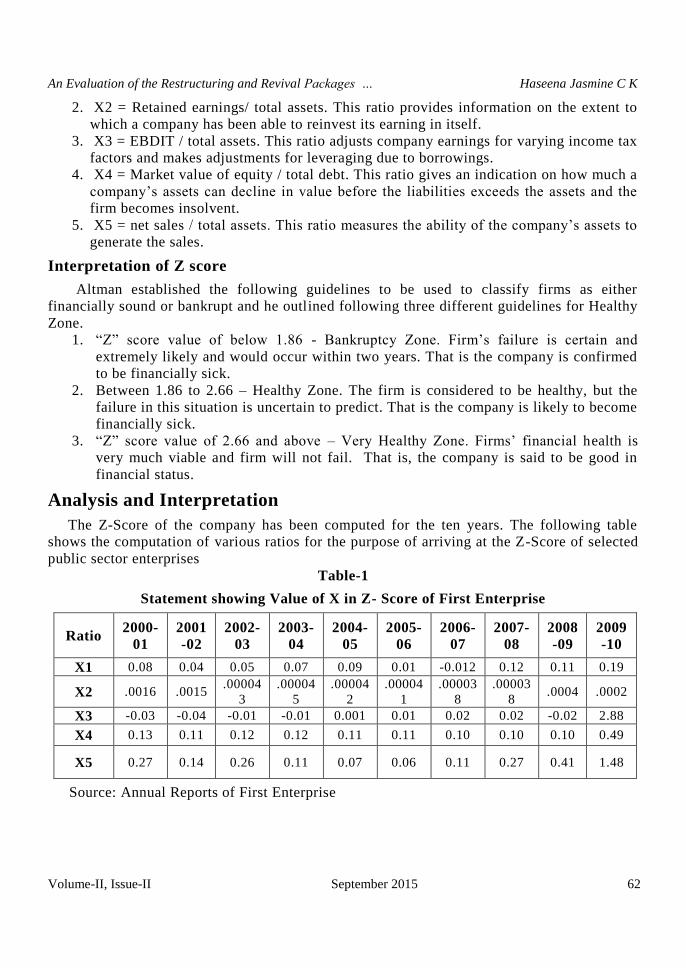
Analysis and Interpretation
The Z-Score of the company has been computed for the ten years. The following table
shows the computation of various ratios for the purpose of arriving at the Z-Score of selected
public sector enterprises
Table-1
Statement showing Value of X in Z- Score of First Enterprise
Ratio 2000-
01
2001
-02
2002-
03
2003-
04
2004-
05
2005-
06
2006-
07
2007-
08
2008
-09
2009
-10
X1 0.08 0.04 0.05 0.07 0.09 0.01 -0.012 0.12 0.11 0.19
X2 .0016 .0015 .00004
3
.00004
5
.00004
2
.00004
1
.00003
8
.00003
8 .0004 .0002
X3 -0.03 -0.04 -0.01 -0.01 0.001 0.01 0.02 0.02 -0.02 2.88
X4 0.13 0.11 0.12 0.12 0.11 0.11 0.10 0.10 0.10 0.49
X5 0.27 0.14 0.26 0.11 0.07 0.06 0.11 0.27 0.41 1.48
Source: Annual Reports of First Enterprise

An Evaluation of the Restructuring and Revival Packages … Haseena Jasmine C K
Volume-II, Issue-II September 2015 63
Table-2
Weighted Factors of Z-scores
Ratio 2000-
01
2001-
02
2002-
03
2003-
04
2004-
05
2005-
06
2006-
07
2007-
08
2008-
09
2009-
10
X1
0.0
96
0.0
48
0.0
6
0.0
84
0.1
08
0.0
12
-0.0
14
4
0.1
44
0.1
32
0.2
28
X2
.00
24
.00
21
.00
00
6
.00
00
6
.00
00
58
.00
00
57
.00
00
53
.00
00
53
0.0
00
53
.00
01
9
X3
-0.0
99
-0.1
32
-0.0
33
-0.0
33
0.0
03
3
0.0
66
0.0
66
-0.0
66
-0.0
66
9.5
04
X4
0.0
78
0.0
66
0.0
72
0.0
72
0.0
66
0.0
66
0.0
6
0.0
6
0.0
6
0.2
94
X5
0.0
27
0.1
39
0.2
59
0.1
09
0.0
69
9
0.0
59
9
0.1
09
8
0.2
69
0.4
09
5
1.4
78
Z
Score
0.3
46
0.1
24
0.3
58
0.2
33
0.2
47
0.1
71
0.2
21
0.5
39
0.5
36
11
.50
Source: Annual Reports of First Enterprise
The Z-Score of the first enterprise has been computed for the ten years from 2000 to 2010,
because the company‟s revival was in 2007. The Z-Score values during 2001 to 2009 were
generally low. In the year 2010 Z-score value (11.50) is higher than the Standard (2.66) which
indicates satisfactory financial performance. The above analysis indicates that, financial status
of the company has improved fairly well subject to rehabilitation steps taken up during 2007 -
08. Hence, the firm wants to solvent if it delivers consistent results in the next few years.

An Evaluation of the Restructuring and Revival Packages … Haseena Jasmine C K
Volume-II, Issue-II September 2015 64
Table-3
Statement showing Value of X in Z- Score for Second Enterprise
Ratio 1990-
91
1991-
92
1992-
93
1993-
94
1994-
95
1995-
96
1996-
97
1997-
98
1998-
99
1999-
00
X1 0.14 0.15 0.12 0.07 0.13 0.23 0.31 0.35 0.48 0.51
X2 0.004 0.004 0.004 0.003 0.003 0.004 0.005 0.005 0.005 0.005
X3 0.003 0.03 0.02 .0004 0.06 0.09 0.12 0.11 0.08 0.02
X4 0.21 0.21 0.20 0.18 0.67 0.28 0.33 0.37 0.33 0.90
X5 0.32 0.36 0.29 0.31 0.45 0.68 0.71 0.75 0.71 0.69
Source: Annual Reports of Second Enterprise
Table-4
Weighted Factors of Z-scores
Ratio 1990
-91
1991
-92
1992
-93
1993
-94
1994
-95
1995
-96
1996
-97
1997
-98
1998
-99
1999
-00
X1
0.1
68
0.1
8
0.1
44
0.0
84
0.1
56
0.2
76
0.3
72
0.4
2
0.5
76
0.6
12
X2
0.0
05
6
0.0
05
6
0.0
05
6
0.0
04
2
0.0
04
2
0.0
05
6
0.0
07
0.0
07
0.0
07
0.0
07
X3
0.0
09
9
0.0
99
0.0
66
0.0
01
3
0.1
98
0.2
97
0.3
96
0.3
63
0.2
64
0.0
66
X4
0.1
26
0.1
26
0.1
2
0.1
08
0.4
02
0.1
68
0.1
98
0.2
22
0.1
98
0.5
4
X5
0.3
19
6
0.3
59
6
0.2
89
0.3
09
6
0.4
49
0.6
79
0.7
09
0.7
49
0.7
09
0.6
89
Z
Score
0.6
29
0.7
70
0.6
25
0.5
07
1.2
09
1.4
25
1.6
8
1.7
61
1.7
54
1.9
14
Source: Annual Reports of Second Enterprise
The Z-Score of the second enterprise has been computed for the ten years from 1990 to
2000, because the company‟s revival was in 1995. The Z-Score value of second enterprise
An Evaluation of the Restructuring and Revival Packages … Haseena Jasmine C K
Volume-II, Issue-II September 2015 65
during 1990 to 1994 was generally low. From the year 1995 to 2000 (1.209 to 1.914), Z-Score
value is increasing. Presently the firm‟s financial performance is good. The above analysis reveals
that, financial status of the company has improved fairly subject to rehabilitation steps taken up
during 1995-96. Hence, the firm should continue to maintain the improvement to be out of
bankruptcy.
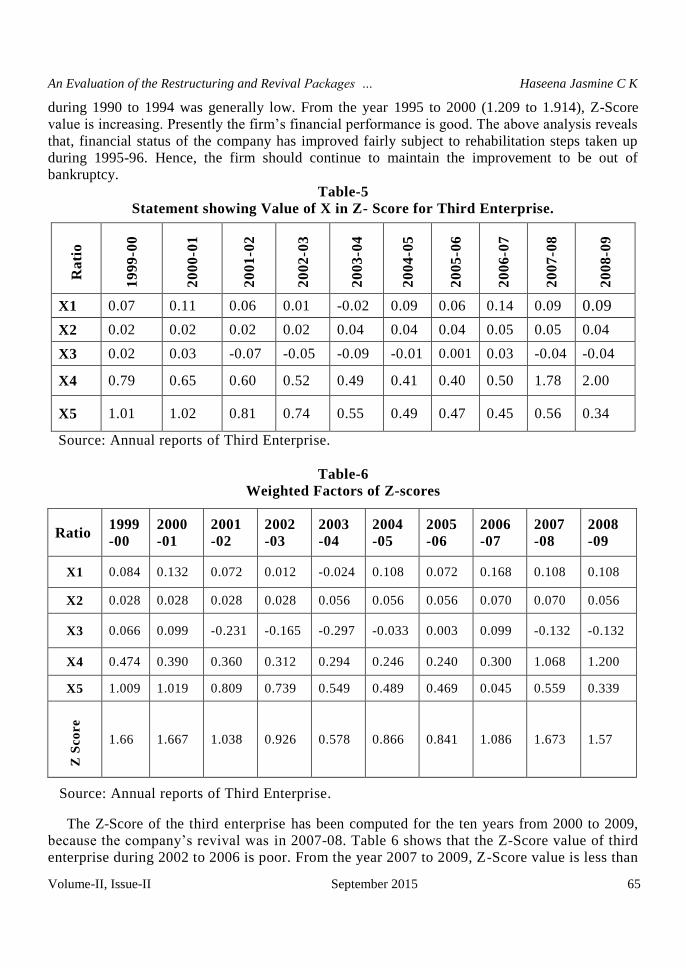
Table-5
Statement showing Value of X in Z- Score for Third Enterprise.
Ra
tio
19
99
-00
20
00
-01
20
01
-02
20
02
-03
20
03
-04
20
04
-05
20
05
-06
20
06
-07
20
07
-08
20
08
-09
X1 0.07 0.11 0.06 0.01 -0.02 0.09 0.06 0.14 0.09 0.09
X2 0.02 0.02 0.02 0.02 0.04 0.04 0.04 0.05 0.05 0.04
X3 0.02 0.03 -0.07 -0.05 -0.09 -0.01 0.001 0.03 -0.04 -0.04
X4 0.79 0.65 0.60 0.52 0.49 0.41 0.40 0.50 1.78 2.00
X5 1.01 1.02 0.81 0.74 0.55 0.49 0.47 0.45 0.56 0.34
Source: Annual reports of Third Enterprise.
Table-6
Weighted Factors of Z-scores
Ratio 1999
-00
2000
-01
2001
-02
2002
-03
2003
-04
2004
-05
2005
-06
2006
-07
2007
-08
2008
-09
X1 0.084 0.132 0.072 0.012 -0.024 0.108 0.072 0.168 0.108 0.108
X2 0.028 0.028 0.028 0.028 0.056 0.056 0.056 0.070 0.070 0.056
X3 0.066 0.099 -0.231 -0.165 -0.297 -0.033 0.003 0.099 -0.132 -0.132
X4 0.474 0.390 0.360 0.312 0.294 0.246 0.240 0.300 1.068 1.200
X5 1.009 1.019 0.809 0.739 0.549 0.489 0.469 0.045 0.559 0.339
Z S
co
re
1.66 1.667 1.038 0.926 0.578 0.866 0.841 1.086 1.673 1.57
Source: Annual reports of Third Enterprise.
The Z-Score of the third enterprise has been computed for the ten years from 2000 to 2009,
because the company‟s revival was in 2007-08. Table 6 shows that the Z-Score value of third
enterprise during 2002 to 2006 is poor. From the year 2007 to 2009, Z-Score value is less than
An Evaluation of the Restructuring and Revival Packages … Haseena Jasmine C K
Volume-II, Issue-II September 2015 66
1.86. That is this company is confirmed to be sick. But the above analysis indicates that,
financial status of the company has improved fairly after rehabilitation during 2007-08.
Hence, the firm must take certain measures to improve its financial status.
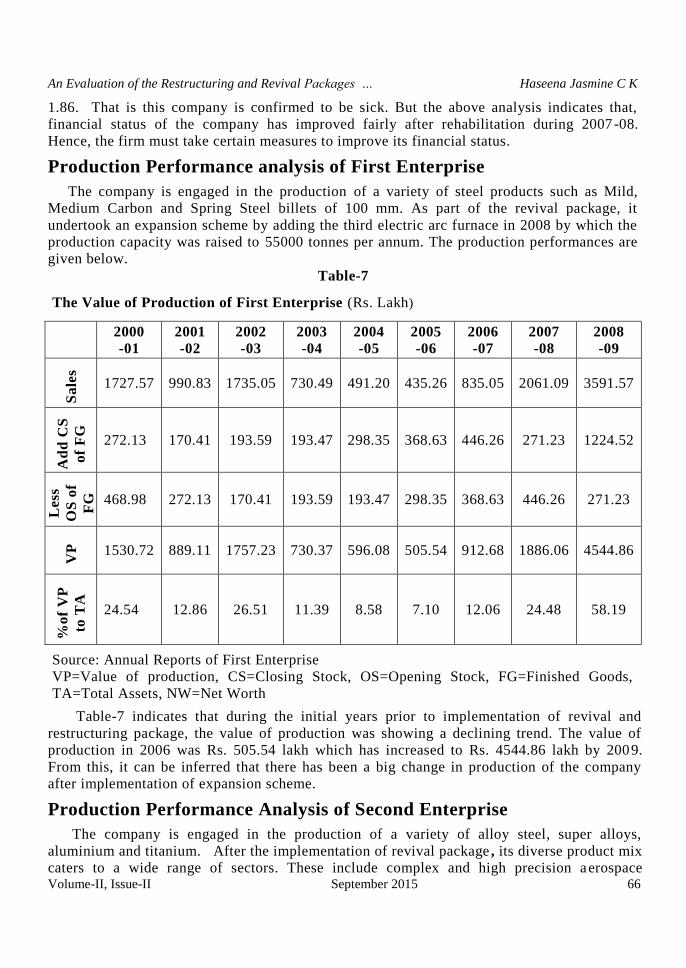
Production Performance analysis of First Enterprise
The company is engaged in the production of a variety of steel products such as Mild,
Medium Carbon and Spring Steel billets of 100 mm. As part of the revival package, it
undertook an expansion scheme by adding the third electric arc furnace in 2008 by which the
production capacity was raised to 55000 tonnes per annum. The production performances are
given below.
Table-7
The Value of Production of First Enterprise (Rs. Lakh)
2000
-01
2001
-02
2002
-03
2003
-04
2004
-05
2005
-06
2006
-07
2007
-08
2008
-09
Sa
les
1727.57 990.83 1735.05 730.49 491.20 435.26 835.05 2061.09 3591.57
Ad
d C
S
of
FG
272.13 170.41 193.59 193.47 298.35 368.63 446.26 271.23 1224.52
Less
OS
of
FG
468.98 272.13 170.41 193.59 193.47 298.35 368.63 446.26 271.23
VP
1530.72 889.11 1757.23 730.37 596.08 505.54 912.68 1886.06 4544.86
%o
f V
P
to T
A
24.54 12.86 26.51 11.39 8.58 7.10 12.06 24.48 58.19
Source: Annual Reports of First Enterprise
VP=Value of production, CS=Closing Stock, OS=Opening Stock, FG=Finished Goods,
TA=Total Assets, NW=Net Worth
Table-7 indicates that during the initial years prior to implementation of revival and
restructuring package, the value of production was showing a declining trend. The value of
production in 2006 was Rs. 505.54 lakh which has increased to Rs. 4544.86 lakh by 2009.
From this, it can be inferred that there has been a big change in production of the company
after implementation of expansion scheme.
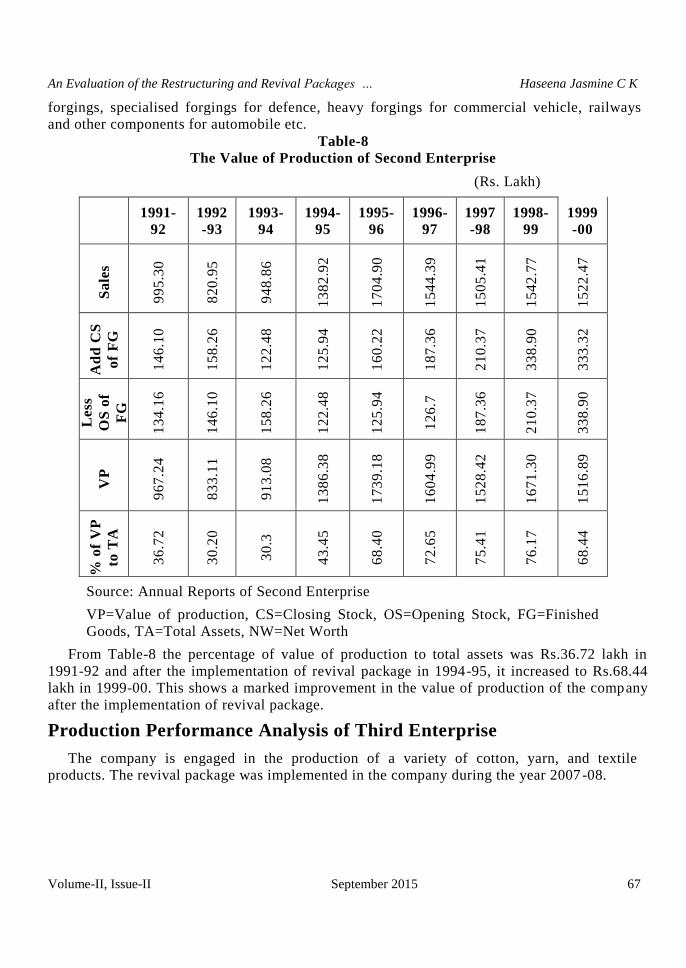
Production Performance Analysis of Second Enterprise
The company is engaged in the production of a variety of alloy steel, super alloys,
aluminium and titanium. After the implementation of revival package , its diverse product mix
caters to a wide range of sectors. These include complex and high precision aerospace
An Evaluation of the Restructuring and Revival Packages … Haseena Jasmine C K
Volume-II, Issue-II September 2015 67
forgings, specialised forgings for defence, heavy forgings for commercial vehicle, railways
and other components for automobile etc.
Table-8
The Value of Production of Second Enterprise
From Table-8 the percentage of value of production to total assets was Rs.36.72 lakh in
1991-92 and after the implementation of revival package in 1994-95, it increased to Rs.68.44
lakh in 1999-00. This shows a marked improvement in the value of production of the company
after the implementation of revival package.
Production Performance Analysis of Third Enterprise
The company is engaged in the production of a variety of cotton, yarn, and textile
products. The revival package was implemented in the company during the year 2007-08.
(Rs. Lakh)
1991-
92
1992
-93
1993-
94
1994-
95
1995-
96
1996-
97
1997
-98
1998-
99
1999
-00
Sa
les
99
5.3
0
82
0.9
5
94
8.8
6
13
82
.92
17
04
.90
15
44
.39
15
05
.41
15
42
.77
15
22
.47
Ad
d C
S
of
FG
14
6.1
0
15
8.2
6
12
2.4
8
12
5.9
4
16
0.2
2
18
7.3
6
21
0.3
7
33
8.9
0
33
3.3
2
Less
OS
of
FG
13
4.1
6
14
6.1
0
15
8.2
6
12
2.4
8
12
5.9
4
12
6.7
18
7.3
6
21
0.3
7
33
8.9
0
VP
96
7.2
4
83
3.1
1
91
3.0
8
13
86
.38
17
39
.18
16
04
.99
15
28
.42
16
71
.30
15
16
.89
% o
f V
P
to T
A
36
.72
30
.20
30
.3
43
.45
68
.40
72
.65
75
.41
76
.17
68
.44
Source: Annual Reports of Second Enterprise
VP=Value of production, CS=Closing Stock, OS=Opening Stock, FG=Finished
Goods, TA=Total Assets, NW=Net Worth
An Evaluation of the Restructuring and Revival Packages … Haseena Jasmine C K
Volume-II, Issue-II September 2015 68
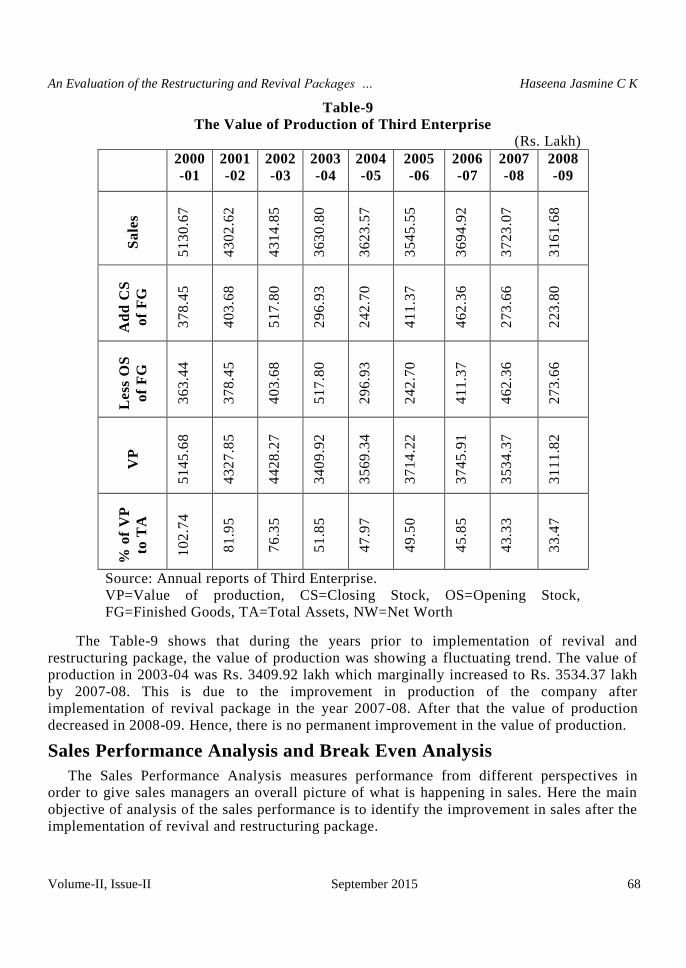
Table-9
The Value of Production of Third Enterprise
(Rs. Lakh)
2000
-01
2001
-02
2002
-03
2003
-04
2004
-05
2005
-06
2006
-07
2007
-08
2008
-09
Sa
les
51
30
.67
43
02
.62
43
14
.85
36
30
.80
36
23
.57
35
45
.55
36
94
.92
37
23
.07
31
61
.68
Ad
d C
S
of
FG
37
8.4
5
40
3.6
8
51
7.8
0
29
6.9
3
24
2.7
0
41
1.3
7
46
2.3
6
27
3.6
6
22
3.8
0
Less
OS
of
FG
36
3.4
4
37
8.4
5
40
3.6
8
51
7.8
0
29
6.9
3
24
2.7
0
41
1.3
7
46
2.3
6
27
3.6
6
VP
51
45
.68
43
27
.85
44
28
.27
34
09
.92
35
69
.34
37
14
.22
37
45
.91
35
34
.37
31
11
.82
% o
f V
P
to T
A
10
2.7
4
81
.95
76
.35
51
.85
47
.97
49
.50
45
.85
43
.33
33
.47
Source: Annual reports of Third Enterprise.
VP=Value of production, CS=Closing Stock, OS=Opening Stock,
FG=Finished Goods, TA=Total Assets, NW=Net Worth
The Table-9 shows that during the years prior to implementation of revival and
restructuring package, the value of production was showing a fluctuating trend. The value of
production in 2003-04 was Rs. 3409.92 lakh which marginally increased to Rs. 3534.37 lakh
by 2007-08. This is due to the improvement in production of the company after
implementation of revival package in the year 2007-08. After that the value of production
decreased in 2008-09. Hence, there is no permanent improvement in the value of production.
Sales Performance Analysis and Break Even Analysis
The Sales Performance Analysis measures performance from different perspectives in
order to give sales managers an overall picture of what is happening in sales. Here the main
objective of analysis of the sales performance is to identify the improvement in sales after the
implementation of revival and restructuring package.
An Evaluation of the Restructuring and Revival Packages … Haseena Jasmine C K
Volume-II, Issue-II September 2015 69
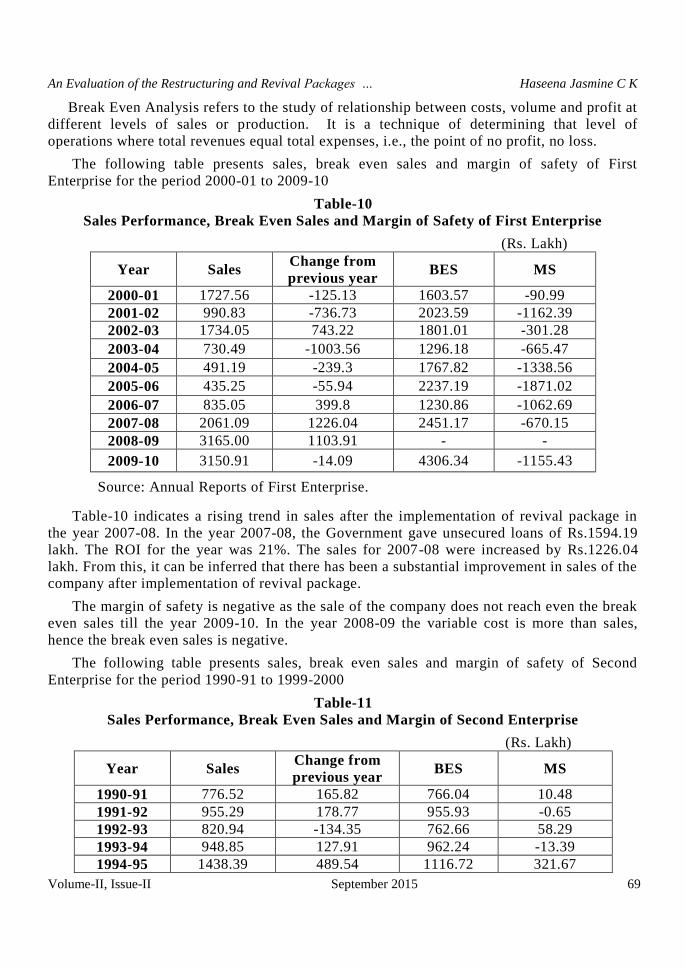
Break Even Analysis refers to the study of relationship between costs, volume and profit at
different levels of sales or production. It is a technique of determining that level of
operations where total revenues equal total expenses, i.e., the point of no profit, no loss.
The following table presents sales, break even sales and margin of safety of First
Enterprise for the period 2000-01 to 2009-10
Table-10
Sales Performance, Break Even Sales and Margin of Safety of First Enterprise
(Rs. Lakh)
Year Sales Change from
previous year BES MS
2000-01 1727.56 -125.13 1603.57 -90.99
2001-02 990.83 -736.73 2023.59 -1162.39
2002-03 1734.05 743.22 1801.01 -301.28
2003-04 730.49 -1003.56 1296.18 -665.47
2004-05 491.19 -239.3 1767.82 -1338.56
2005-06 435.25 -55.94 2237.19 -1871.02
2006-07 835.05 399.8 1230.86 -1062.69
2007-08 2061.09 1226.04 2451.17 -670.15
2008-09 3165.00 1103.91 - -
2009-10 3150.91 -14.09 4306.34 -1155.43
Source: Annual Reports of First Enterprise.
Table-10 indicates a rising trend in sales after the implementation of revival package in
the year 2007-08. In the year 2007-08, the Government gave unsecured loans of Rs.1594.19
lakh. The ROI for the year was 21%. The sales for 2007-08 were increased by Rs.1226.04
lakh. From this, it can be inferred that there has been a substantial improvement in sales of the
company after implementation of revival package.
The margin of safety is negative as the sale of the company does not reach even the break
even sales till the year 2009-10. In the year 2008-09 the variable cost is more than sales,
hence the break even sales is negative.
The following table presents sales, break even sales and margin of safety of Second
Enterprise for the period 1990-91 to 1999-2000
Table-11
Sales Performance, Break Even Sales and Margin of Second Enterprise
(Rs. Lakh)
Year Sales Change from
previous year BES MS
1990-91 776.52 165.82 766.04 10.48
1991-92 955.29 178.77 955.93 -0.65
1992-93 820.94 -134.35 762.66 58.29
1993-94 948.85 127.91 962.24 -13.39
1994-95 1438.39 489.54 1116.72 321.67
An Evaluation of the Restructuring and Revival Packages … Haseena Jasmine C K
Volume-II, Issue-II September 2015 70
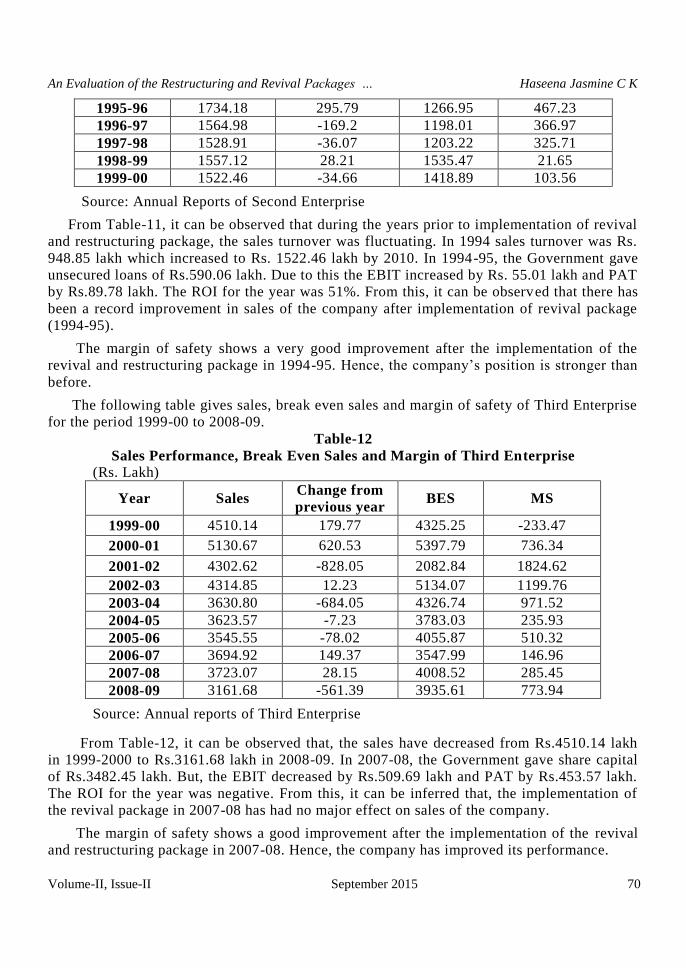
1995-96 1734.18 295.79 1266.95 467.23
1996-97 1564.98 -169.2 1198.01 366.97
1997-98 1528.91 -36.07 1203.22 325.71
1998-99 1557.12 28.21 1535.47 21.65
1999-00 1522.46 -34.66 1418.89 103.56
Source: Annual Reports of Second Enterprise
From Table-11, it can be observed that during the years prior to implementation of revival
and restructuring package, the sales turnover was fluctuating. In 1994 sales turnover was Rs.
948.85 lakh which increased to Rs. 1522.46 lakh by 2010. In 1994-95, the Government gave
unsecured loans of Rs.590.06 lakh. Due to this the EBIT increased by Rs. 55.01 lakh and PAT
by Rs.89.78 lakh. The ROI for the year was 51%. From this, it can be observed that there has
been a record improvement in sales of the company after implementation of revival package
(1994-95).
The margin of safety shows a very good improvement after the implementation of the
revival and restructuring package in 1994-95. Hence, the company‟s position is stronger than
before.
The following table gives sales, break even sales and margin of safety of Third Enterprise
for the period 1999-00 to 2008-09.
Table-12
Sales Performance, Break Even Sales and Margin of Third Enterprise
(Rs. Lakh)
Year Sales Change from
previous year BES MS
1999-00 4510.14 179.77 4325.25 -233.47
2000-01 5130.67 620.53 5397.79 736.34
2001-02 4302.62 -828.05 2082.84 1824.62
2002-03 4314.85 12.23 5134.07 1199.76
2003-04 3630.80 -684.05 4326.74 971.52
2004-05 3623.57 -7.23 3783.03 235.93
2005-06 3545.55 -78.02 4055.87 510.32
2006-07 3694.92 149.37 3547.99 146.96
2007-08 3723.07 28.15 4008.52 285.45
2008-09 3161.68 -561.39 3935.61 773.94
Source: Annual reports of Third Enterprise
From Table-12, it can be observed that, the sales have decreased from Rs.4510.14 lakh
in 1999-2000 to Rs.3161.68 lakh in 2008-09. In 2007-08, the Government gave share capital
of Rs.3482.45 lakh. But, the EBIT decreased by Rs.509.69 lakh and PAT by Rs.453.57 lakh.
The ROI for the year was negative. From this, it can be inferred that, the implementation of
the revival package in 2007-08 has had no major effect on sales of the company.
The margin of safety shows a good improvement after the implementation of the revival
and restructuring package in 2007-08. Hence, the company has improved its performance.

An Evaluation of the Restructuring and Revival Packages … Haseena Jasmine C K
Volume-II, Issue-II September 2015 71
Suggestions
To increase the effectiveness of the revival package a few suggestions are made on the bases
of forgoing study.
The state has to review its policy on revival or restructuring of public enterprises.
A detailed study is required to set the state‟s policy on revival or restructuring.
The analysis of financial performance shows improvement in financial health of the
companies under the study except Third Enterprise. How much of that is due to fresh
capital infusion, how much due to debt write off etc. have not been analysed due to
non-availability of data. Along with finance, appropriate management talent must also
be made available to these companies so that the revival is long-standing in nature.
Conclusion
The financial analysis of the selected firms reveals a mixed result after the
implementation of the revival and restructuring programme. In First Enterprise, all the above
analyse shows that there is improvement in the performance of the company after the
implementation of revival package in 2007-08. In Second Enterprise, it has been able to write
off its losses with the help of the revival package. In 2010 it started a new unit of the
company. Now the company is earning profits and it is hoped that it can stand on its own in
future. In Third Enterprise, It has not been able to control its losses through the
implementation of revival and restructuring package.
In short most of the units have improved their performance after implementation of the
revival package. The financial analysis of the selected public sector enterprises shows a
creeping improvement after the implementation of the revival programme.
Reference
1) V Navaneetha Kannan, “Financial Status of Co-operative Sugar Mill: A Micro
Study”, Southern Economist, March 15, 2009, pp 15-17.
2) Annual Reports of selected public sector enterprises.
3) A Review of Public Sector Enterprises in Kerala, 2009-10, Bureau of Public
Enterprises, Government of Kerala.
4) Economic Review, Kerala State Planning Board, Government of Kerala, Chapter 8,
2010.
5) Industrial and Commercial Policy, July 2007, Government of Kerala.
6) Kerala PSUs Reaching New Heights, Department of Industries and Commerce,
Government of Kerala (2008-2009)
7) National Survey on State Level Public Enterprises (2006-07), Department of Public
Enterprises, Ministry of Heavy Industries and Public Enterprises, Government of
Kerala.

An Evaluation of the Restructuring and Revival Packages … Haseena Jasmine C K
Volume-II, Issue-II September 2015 72
8) Public Enterprises survey 2004-05, vol. 10, Government of Kerala.
9) Synergising PSUs, Annual Review Meet 2008, Department of Industries and
Commerce, Government of Kerala.
10) http//.industriesministerkerala.gov.in/achievementknowledgefiles/49PSUs
11) http/dpe.nic.in/survey01/vol1/chap19…1
12) http://en.wikipedia.org/wiki/Public_sector_undertakings_in_Kerala
13) http://www.bpe.kerala.gov.in/pages/performance%20HIGHLIIGHTS.pdf
14) http://www.kerala.gov.in/docs/policies/industry.pdf
15) http://www.keralaindustry.org/industrial_commercial_Policy_2007.pdf
16) www.dic.kerala/web/pdffiles/indupolicy
17) www.hindubusinessline.com (various editions)
18) www.minister.industry.kerala.gov.in/index.php?...id
19) www.riab.org/soekerala-docs/resurgence.