Embed Size (px)
Citation preview

Graduate Theses, Dissertations, and Problem Reports
2012
An Evaluation of the Occurrence of Micronuclei and other Nuclear An Evaluation of the Occurrence of Micronuclei and other Nuclear
Abnormalities in Fishes from the Great Lakes Basin, United States Abnormalities in Fishes from the Great Lakes Basin, United States
Ryan Patrick Braham West Virginia University
Follow this and additional works at: https://researchrepository.wvu.edu/etd
Recommended Citation Recommended Citation Braham, Ryan Patrick, "An Evaluation of the Occurrence of Micronuclei and other Nuclear Abnormalities in Fishes from the Great Lakes Basin, United States" (2012). Graduate Theses, Dissertations, and Problem Reports. 460. https://researchrepository.wvu.edu/etd/460
This Thesis is protected by copyright and/or related rights. It has been brought to you by the The Research Repository @ WVU with permission from the rights-holder(s). You are free to use this Thesis in any way that is permitted by the copyright and related rights legislation that applies to your use. For other uses you must obtain permission from the rights-holder(s) directly, unless additional rights are indicated by a Creative Commons license in the record and/ or on the work itself. This Thesis has been accepted for inclusion in WVU Graduate Theses, Dissertations, and Problem Reports collection by an authorized administrator of The Research Repository @ WVU. For more information, please contact [email protected].

An Evaluation of the Occurrence of Micronuclei and other Nuclear Abnormalities in Fishes
from the Great Lakes Basin, United States
Ryan Patrick Braham
Thesis submitted to the Davis College of Agriculture,
Natural Resources and Design at West Virginia University
in partial fulfillment
of the requirements for the degree of
Master of Science
in
Wildlife and Fisheries Resources
Patricia M. Mazik, Ph.D., Chair
Vicki S. Blazer, Ph.D.
Kyle J. Hartman, Ph.D.
Michael P. Strager, Ph.D.
Division of Forestry and Natural Resources
Morgantown, West Virginia
2012
Keywords: Micronucleus Assay, Great Lakes, Area of Concern, Largemouth Bass, Smallmouth
Bass, White Sucker, Brown Bullhead

Abstract
An Evaluation of the Occurrence of Micronuclei and other Nuclear Abnormalities in Fishes
from the Great Lakes Basin, United States
Ryan Patrick Braham
Biological markers (biomarkers) sensitive to genotoxic and mutagenic contamination in fishes
are widely used to identify contamination in the aquatic environment. The “fish tumors or other
deformities” biological use impairment (BUI) occurs at 18 of the 30 areas of concern (AOC)
located in the Great Lakes basin within the United States. As each AOC evaluates this specific
BUI for possible delisting, biomarkers sensitive to both genotoxic and mutagenic chemicals can
be integrated as a possible criterion for delisting. The micronucleus assay identifies genotoxic
contamination by observing the presence of a micronucleus (MN), along with a primary nucleus
within the cellular body. Nuclear abnormalities (NA) such as notching, lobes, blebbing, and bi-
nucleation are observed from the nuclear membrane and are indicators for mutagenic
contamination. The micronucleus assay was incorporated to assess genotoxic and mutagenic
contamination among sites, species, and season from fish collected from 8 AOC’s, as well as 1
non-AOC site during the spring and fall, 2011. Micronuclei and/or NA were observed at all sites.
Micronuclei were observed at differing occurrence rates among species. Brown bullhead
(Ameiurus nebulosus) expressed MN at a lower rate when compared to either largemouth bass
(Micropterus salmoides) or smallmouth bass (Micropterus dolomieu). White sucker (Catostomus
commersoni) express MN at a lower rate when compared to smallmouth bass. Nuclear
abnormalities rates exactly followed these trends. Brown bullhead tended to express MN and NA
at a lower rate during the fall as compared to individuals collected in the spring. Largemouth

bass tended to express MN and NA at a higher rate during the spring. Moving forward, this
apparent site and species effect should be considered when evaluating genotoxic and mutagenic
contamination.

i
Acknowledgments
I would like to thank the Great Lakes Restoration Initiative for funding this project. I
would like to thank my committee for their guidance and direction throughout this project. I
would like to thank the U.S. Fish and Wildlife Service, the Minnesota Department of Natural
Resources, the Wisconsin Department of Natural Resources, and the New York State
Department of Environmental Conservation for the coordination and logistical support during
sampling. I would like to thank Luke Iwanowicz, Cassidy Hahn, Heather Walsh, and Adam
Sperry for their assistance in field. I would like to thank Kathy Spring and Darlene Bowling for
their help in preparing and staining my slides at the lab. I would like to thank Nicole Dawson and
Kyra Wood for their help preparing and ageing otoliths. I would finally like thank my wife
Missy. Without her support, this thesis would have never happened.

ii
Table of Contents
Chapter 1: Literature Review .......................................................................................................... 1
Background Information ............................................................................................................. 1
Site Information ........................................................................................................................... 7
Objectives .................................................................................................................................. 13
Literature Cited ......................................................................................................................... 14
Tables and Figures .................................................................................................................... 24
Table 1. Summary of chemicals shown to induce micronuclei in fishes. ........................................... 24
Figure 1. Locations of field sampling sites ......................................................................................... 27
Chapter 2: An Evaluation of the Occurrence of Micronuclei and Nuclear Abnormalities in Fishes
from the Great Lakes Basin, United States ................................................................................... 28
Introduction ............................................................................................................................... 28
Methods ..................................................................................................................................... 33
Site Information .................................................................................................................................. 33
Field Collection ................................................................................................................................... 34
Preparation and Evaluation of Micronuclei and Nuclear Abnormalities ............................................ 34
Age Determination .............................................................................................................................. 35
Spatial Analysis .................................................................................................................................. 36
Chemical Analysis .............................................................................................................................. 38
Statistical Analysis .............................................................................................................................. 39
Results ....................................................................................................................................... 39
Micronucleus Assay ............................................................................................................................ 39
Age Analysis ....................................................................................................................................... 42
Spatial Analysis .................................................................................................................................. 44
Discussion ................................................................................................................................. 46
Micronucleus and Nuclear Abnormality ............................................................................................. 46
Age ...................................................................................................................................................... 47
Spatial and Chemical Site Comparison ............................................................................................... 48
Limitations and Future Research ........................................................................................................ 52
Literature Cited ......................................................................................................................... 54
Tables and Figures .................................................................................................................... 59
Figure 1. Locations of field sampling sites. ........................................................................................ 59
Figure 2. Images of erythrocyte abnormalities. .................................................................................. 60
Figure 3. Percent of individuals expressing micronuclei for fish collected in the spring, 2011. ........ 61

iii
Figure 4. Percent of individuals expressing nuclear abnormalities for fish collected in the spring,
2011..................................................................................................................................................... 62
Figure 5. Frequency of occurrence of micronuclei for fish collected in the spring, 2011. ................. 63
Figure 6. Frequency of occurrence of nuclear abnormalities for fish collected in the spring, 2011. .. 64
Figure 7. Percent of individuals expressing nuclear abnormalities for fish collected in the fall, 2011.
............................................................................................................................................................ 65
Figure 8. Percent of individuals expressing nuclear abnormalities for fish collected in the fall, 2011.
............................................................................................................................................................ 66
Figure 9. Frequency of occurrence of micronuclei for fish collected in the fall, 2011. ...................... 67
Figure 10. Frequency of occurrence of nuclear abnormalities for fish collected in the fall, 2011...... 68
Table 1. Fish collection summary for the spring and fall, 2011.......................................................... 71
Table 2. Spring 2011 ageing summary. .............................................................................................. 72
Table 3. Fall 2011 ageing summary. ................................................................................................... 73
Table 4. Land cover spatial summary. ................................................................................................ 74
Table 5. Discharge point spatial summary. ......................................................................................... 76
Table 6. Atrazine, Chlorpyrifos, 4-Nonylphenol, Benzo[a]pyrene, Bisphenol A, and 17-β Estradiol
water chemical summary data for 2011. ............................................................................................. 78
Table 7. Atrazine, Chlorpyrifos, 4-Nonylphenol, Benzo[a]pyrene, Bisphenol A, and 17-β Estradiol
sediment chemical summary data for 2011. ........................................................................................ 79

1
Chapter 1: Literature Review
Background Information
There is a comprehensive list of chemicals that act as environmental stressors. Many of
these chemicals are discharged into the environment largely due to human activity and are
detrimental to fish. These chemicals are often grouped into their respective families such as
polychlorinated biphenyls (PCBs), polycyclic aromatic hydrocarbons (PAHs), pesticides,
hormones, and various heavy metals. Many of these chemical families have disruptive effects on
systems of the body that can be detected using biological markers (biomarkers). These
biomarkers incorporate histological, molecular and genetic endpoints that indicate a disruption of
normal function and/or process (Al-Sabti and Metcalfe 1995; Myers and Fournie 2002; Larkin et
al. 2003; Au 2004; Bolognesi and Hayashi 2011). Many of these chemicals have been reported
nationwide, and interestingly, within the Great Lakes basin (Kolpin et al. 2002; Klečka et al.
2010). Areas of Concern (AOC) are defined as “geographic areas that fail to meet the general or
specific objectives of the agreement where such failure has caused or is likely to cause
impairment of beneficial use of the area’s ability to support aquatic life” (International Joint
Commission, 1989). While the specific source and concentrations of these environmental
contaminants are varied, they all have been shown to detrimentally act upon the internal systems
of teleost fishes.
Researchers have had mixed results attempting to correlate specific biomarkers to
individual contaminants. Vethaak and Jol (1996) had difficulty correlating observed liver
neoplasms in flounder (Platichthys flesus) with specific contaminant variables. Fish were
collected in a long term (>5 year) monitoring study off the eastern coast of the Netherlands that
attempted to correlate histological anomalies observed in flounder to a suite of environmental

2
metrics including sediment (focusing primarily on PCB’s, PAH’s, cadmium (Cd), and lead (Pb)),
salinity, temperature, season, and fishing pressure. Skin and liver lesions, along with liver
neoplasia were observed in individuals, but did not correlate strongly with the contaminants
observed in the sediment and instead appeared to correlate most strongly with relative salinity at
the sample site. This may suggest that an interaction among individual contaminants and/or
environmental variables may drive the expression of these impairments and not a single
contaminant or environmental variable acting alone. In the Sado estuary of Western Portugal,
Costa et al. (2009) were able to correlate industrial sediment principally contaminated with Cd,
chromium (Cr), copper (Cu), nickel (Ni), Pb, zinc (Zn), arsenic (As), PAH’s, PCB’s, and DDT
(plus its metabolites) to liver and gill histological biomarkers in juvenile Senegalese sole (Solea
senegalensis). The fish were exposed for 28 days to one of three sediment samples taken directly
from the estuary with varying levels of contamination (one fairly uncontaminated and two
moderately to severely contaminated). Impairments in the gill and liver were positively
correlated with contaminants in respective sediment samples. To better explain these complex
interactions, Ankley et al. (2009) introduced a conceptual framework approach in the context of
endocrine disrupting chemicals and the hypothalamic-pituitary-gonadal (HPG) axis. This model
incorporates the known (or hypothesized) modes of action of 12 chemicals on the fathead
minnow (Pimephales promelas) and zebrafish (Danio rerio) into a phased system that identifies
disruption within the HPG axis, and then moves forward with population modeling,
metabalomic, and proteomic tests to better investigate population responses to chemicals, and to
better identify the molecular pathways which are being disrupted by the specific chemicals. This
framework may provide better insight as to the possible variations both among species and
among sites within a watershed.

3
Researchers have had varied success correlating age and gender to various histological
biomarkers. Orocutaneous and hepatic tumors were investigated in brown bullhead (Ameiurus
nebulosus) in the Great lakes region (Blazer et al. 2009a, b). Fish were collected at 8 Areas of
Concern (AOC) located around Lake Erie. Orocutaneous and liver tumors, as well as barbel
abnormalities were observed at all of the 8 AOC’s that were sampled. A gross difference was
observed in the occurrence for both orocutaneous and hepatic tumors as a function of age and
gender, however neither was found to be significantly different (α=0.05). Rafferty et al. (2009)
provide a historical context to toxicological studies using brown bullhead as the target species
and evaluating liver neoplasia as a function of PAH concentration present in the environment.
Age and gender were also evaluated and appear to be positively correlated with this specific
impairment. Age alone has repeatedly been suggested to have a positive effect on tumor
development (Baumann et al. 1990; Maccubbin and Ersing 1991; Pinkney et al. 2001). Female
fish are generally suggested to have a higher incidence of occurrence of impairments as
compared with male fish (Baumann et al. 1990). Age and gender can be pertinent variables for
use in explaining the observed variation of selected biomarkers.
Specific and non-specific biomarkers can both be used to evaluate the detrimental
effects of contaminants on fish. Specific biomarkers can be correlated to a single contaminant,
such as embryonic defects correlated to organic contamination. Non-specific biomarkers are not
specific to a single contaminant, but rather to a broad family of chemicals. Two such families of
chemicals are labeled genotoxic, and mutagenic. The two frequently used non-specific
biomarkers evaluating for the presence of genotoxic contaminants are the comet assay (or single-
cell gel assay) and micronucleus assay. The comet assay quantifies DNA damage at the single
cell level (Singh et al. 1988). The fundament principle of the assay is to evaluate single- and

4
double-strand DNA breaks among individual cells. If a break exists, the nucleus will be pulled
apart along an electrical gradient developing a ‘tail’. The severity of damage can be scored by
quantifying the overall damage on an individual basis using the ‘tail’ length as a metric. This has
been recently used in the Great Lakes basin to evaluate DNA damage in brown bullhead (Xuan
et al. 2006). The induction of MN and other NA’s within nucleated cells is the second commonly
used biomarker for genotoxic and mutagenic contamination. Micronuclei are considered to be
indicators of genotoxic contamination and form during telophase when either whole or
fragmented chromosomes become encapsulated in a nuclear envelope and assume the physical
properties of an interphase nucleus which is dramatically reduced in size (Fenech 2000; Polard et
al. 2011). The fragmented chromosomes are the result of either clastogenicity (chromosomal
breaking) or aneugenicity (mitotic spindle dysfunction). The exact pathway leading to the
induction of NA (such as lobed, notched, binucleated and blebbed nuclei) are less understood,
but are believed to be similar to MN induction. Nuclear abnormalities are believed to be
indicators of mutagenic contamination. The sensitivity of the micronucleus assay to both
genotoxic and mutagenic contamination makes it an ideal test for environmental stress among
wild fish populations.
There are three nucleated cells commonly used to assess genotoxic and mutagenic
contamination in the aquatic environment with the micronucleus assay: hepatic, gill epithelial,
and erythrocyte. The hepatic micronucleus assay was developed as a biomarker of disruption
locally occurring in the liver (Williams and Metcalfe 1992). It has been used successfully in the
field to identify contaminated areas (Rao et al. 1997; Arcand-Hoy and Metcalfe 2000); however,
the primary limitation of using liver cells is their relatively low mitotic index as compared to
other cells (Schultz et al. 1993). Hayashi et al. (1998) successfully observed MN induced in the

5
gill epithelial cells and peripheral erythrocytes of various species resulting from exposure to
contaminated areas in Japan. The frequency of MN among epithelial cells was higher than those
observed in peripheral erythrocytes suggesting that the epithelial cells are more sensitive to the
contaminants present in the waters examined. Peripheral erythrocytes have a relatively high
metabolism and short life span (Hunter and Hunter 1957; Fischer et al. 1998; Summarized in
Soldatov 2005). The short life span and relatively short preparation time make peripheral
erythrocytes an ideal candidate as a short term indicator of genotoxic and mutagenic
contamination and why we have chosen to use them for our evaluation.
The MN assay has been used successfully to evaluate chemicals generally attributed to
industrial and agricultural sources. Nepomuceno et al. (1997) observed a positive dose-
dependent relationship between the percent occurrence of MN among peripheral erythrocytes
and differing concentrations of mercury (Hg) in a lab study using common carp (Cyprinus
carpio). Using a 10-fold increase starting at 2 mg Hg/l, statistically significant (0.05 α-level)
differences were observed at 20 and 200 mg Hg/l as compared to control individuals. A similar
dose-dependent increase in MN presence in peripheral erythrocyte and gill epithelial cells was
observed and described using Nile tilapia (Oreochromis niloticus) by Ergne et al. (2007). Fish
were exposed for varying lengths of time to water collected from the Berdan River of western
Turkey with the objective of evaluating the genotoxic contamination resulting from likely heavy
metal exposure. The researchers observed mixed temporal results in MN expression; however a
positive correlation was established along the downstream gradient. This downstream increase
was also reported for many of the water quality parameters attributed to industrial and/or
municipal waste. Çavaş (2008) exposed goldfish (Carassius auratus) to varying concentrations
of the industrial chemicals mercury chloride and lead acetate. They were able to observe a

6
positive dose-dependent correlation for both contaminants using peripheral erythrocytes. They
also evaluated nuclear budding and observed the same positive dose-dependent correlation as
with the MN, suggesting that NA may possess similar utility to classical MN assays when
evaluating genotoxic substances. A positive dose-dependent correlation was observed in MN
occurrence rates of Channa punctatus exposed to the insecticide Malathion® [S-(1,2-
dicarboethoxyethyl) O, O-di- methyl phosphorodithioate] (Kumar et al. 2010). Çavaş (2011)
observed a similar dose-dependent relationship among goldfish exposed to the herbicides
atrazine (pure) and Gesaprim® (containing 500mg/mL atrazine plus other chemical additives).
Additional chemical-specific MN induction summaries are provided by Al-Sabti and Metcalfe
(1995), Bolognesi and Hayashi (2011), and seen in Table 1. When used to either investigate
specific contaminants or as an instream biomarker, the MN assay has been used successfully in
the laboratory setting as an indicator of genotoxic and mutagenic contamination.
Researchers have had mixed results when correlating seasonality, age, and species to MN
occurrence rates. Wirzinger et al. (2007) observed length-, sex-, and season-dependent results
when evaluating three-spined sticklebacks (Gasterosteus aculeatus L.) exposed to sewage
treatment effluent from northern Germany. Males and younger individuals, as well as individuals
captured in mid to late summer, expressed MN at a higher percentage rate than females and older
individuals captured in the spring. Rao et al. (1997) observed a positive correlation between MN
expression and age in brown bullhead MN exposed to pulp mill effluent in lake Ontario, Canada.
Rodriguez-Cea et al. (2003) observed species-dependent results when exposing brown trout
(Salmo trutta), European eel (Anguilla anguilla), and European minnow (Phoxinus phoxinus) to
two pharmaceuticals and Cd. The brown trout was the most sensitive followed by the European
minnow and European eel. Salvagni et al. (2010) evaluated individuals of 4 species (common
7
carp, suckermouthed catfish (Hypostomus punctatus), silver catfish (Rhamdia quelen) and Nile
tilapia from 10 sampling locations along the Lambedor River in Brazil. In this basin, the specific
pesticides Roundup® (Glyphosate), Karate
® (Lambda Cyhalothrin), Herbimix
® (Atrazine and
Simazine) and Priori Xtra® (Azoxystrobin) are believed to be primarily responsible for
environmental contamination. Micronuclei were observed at all sites; however MN did occur at
differing frequencies among species collected within sites. Interspecies specific biological and
physical parameters must be accounted for when evaluating MN occurrence rates as a function of
environmental contamination.
Site Information
Sampling sites were selected throughout the Great Lakes basin, United States and located
on eight AOC’s (identified by IJC 1989). All AOCs were evaluated for the presence of genotoxic
and mutagenic contamination. The AOC’s were the Ashtabula River and Maumee River located
in Ohio, the Detroit River in Michigan, the Lower Fox River/Green Bay and Milwaukee Estuary
in Wisconsin, the Niagara River and Rochester Embayment in New York, and the Saint Louis
River in Minnesota (Figure 1). Each AOC had initiated cleanup and remediation projects related
to the contaminants identified at each site.
The Ashtabula River AOC basin encompasses parts of the states of Ohio and
Pennsylvania. The AOC was originally listed primarily for unregulated discharges and the
mismanagement of heavy metals (such as Hg, Cd, Zn, Pb), organic compounds (such as PCB’s
and PAH’s) and low-level radionuclides (Tatem et al. 1990; USEPA 2008a). In 2005,
remediation began with a target removal of approximately 458,733 cubic meters (600,000 cubic
yards) of sediment containing an estimated 11,440 kilograms (25,000 pounds) of contaminants
consisting chiefly of PCB’s (USEPA 2005). In October 2007, the project was completed with the

8
estimated removal of approximately 382,277 cubic meters (500,000 cubic yards) of sediment
including approximately 11,440 kilograms (25,000 pounds) of contaminants including PCB’s,
heavy metals and low level radionuclides between the Turning Basin at the mouth of Fields
Brook and the 5th Street Bridge (USEPA 2008a, b).
The Detroit River flows 52 kilometers from Lake St. Clair in the north to Lake Erie in the
south and forms the international boundary between the United States and Canada. The Detroit
River AOC is listed primarily from industrial and municipal discharges such as combined sewer
overflows (CSOs) and nonpoint sources from industrial areas (Esman 2008). Specific
contaminants include (but are not limited to) oils, heavy metals, PCBs, and PAH’s (Heidtke et al.
2006; Lake Erie Areas of Concern Summit 2006; Esman 2008). There have been a variety of
remediation activities at the site. In 2003, the Detroit Water and Sewerage Department
completed a project involving the disinfection of the outfall basin from a CSO located at the
mouth of Connors Creek which involved dredging and shoreline habitat restoration (Esman
2008). In 2005, the removal of approximately 88,383 cubic meters (115,600 cubic yards) of
sediment containing approximately 216,817 kilograms (478,000 pounds) of contaminants such as
PCB’s, heavy metals and oil/grease from the Black Lagoon area (subsequently renamed Ellias
Park) was completed (Esman 2008; USEPA and MIDEQ 2009).
The Fox River is located in northeast Wisconsin and drains into the southern tip of Green
Bay. The basin has a high prevalence of agriculture, as well as having the highest concentration
of pulp and paper mills in the world (WDNR 1988). The Lower Fox River and Green Bay AOC
is listed in part due to the input of toxic chemicals such as PCB’s, PAH’s, pesticides and
ammonia, as well as approximately 90.7 million kilograms (200 million pounds) annually of
suspended sediment (WDNR 1988). A variety of impairments remain a concern within the basin.

9
Nutrient loading, toxic substances, exotic species and wetland degradation are specifically listed
as possible causative agents of impairment (WDNR 1993). The basin has undergone a series of
efforts designed to reduce the detrimental effects of the above mentioned agents of impairment.
WDNR (1993) notes that the expansion of the 1.0 ppm discharge limit for phosphorous to
smaller facilities should result in a 12% reduction in point source phosphorous inputs.
Approximately 1000 kilograms of PCB’s have been removed from impacted sites located within
the AOC (Foth and Van Dyke 2000; Steuer 2000; Fort James Corporation et al. 2001).
According to a report by WDNR (2011), sediment remediation activities have reduced the total
PCB concentration to approximately 94% of historic levels. The same report identified that the
total amount of walleye (Sander vitreus) whose PCB concentration exceeded 0.05ppm decreased
by 74% when compared with pre-2010 measurement.
The Genesee River begins in northwest Pennsylvania and flows through northwest New
York before ultimately draining into the southwestern shore of Lake Ontario. The Rochester
Embayment AOC (containing the lower Genesee River) is impacted by a variety of
contaminants. The legacy contaminants are primarily PCB’s, mirex, dioxins, and phosphorous
likely due to historic industrial and agricultural activities, as well as failing or inadequate
sewerage systems (NYSDEC 2003). The 2005 TMDL estimate for the contribution of PCB’s by
the Genesee River to Lake Ontario was 0.66-1.86 kg/yr (LimnoTech 2011). The city of
Rochester also accounted for an average daily load of 8.0 g/day PCB’s based on measurements
from WWTP facilities (LimnoTech 2011). PAH’s have been found in sediment samples from the
Genesee River mainstem (Elliott 2002). Knight Creek, a small tributary within the Rochester
Embayment, shows a decreasing trend in overall health from 1991-2000 based on water quality
and community level evaluation of macroinvertebrates (Abele et al. 2001). The health of Knight

10
Creek appears to be related to flow events (specifically non-point source pollution), however the
authors were unable to positively correlate any specific source to this hypothesis. Noll and
Magee (2007) evaluated the Larkin and Northrup Creek watersheds, which are small tributaries
of the Rochester Embayment. These watersheds also appear to show a decreasing trend in overall
health. When evaluated with water quality metrics, this trend appears to be correlated with
phosphorous, which also was correlated spatially with an increase in developed land cover types
from 1992-2001. The source of the phosphorous loading is suggested to be from sewerage
facilities located within the basin, as well as non-point source runoff from active development
sites. Future proposed remediation activities will include the former Raeco Products Site State
Superfund which has been identified to contain a suite of contaminants including PCB, VOC’s,
SVOC’s, pesticides, and heavy metals (NYSDEC 2010).
The Maumee River AOC basin is located in northwestern Ohio and northeastern Indiana.
The drainage was identified as the largest source of suspended sediment and phosphorus to Lake
Erie, possibly due to non-point source agricultural runoff (TMACOG 1990). A variety of heavy
metals including Cr, Cu, Pb, Ni, Zn, manganese (Mn), and As were identified as likely resulting
from industrial activity (TMACOG 1990). PCB’s PAH’s, phthalates, and nitrate were also
identified at levels high enough to warrant concern (TMACOG 1990). Recommendations
targeting restoration were made that addressed each of the BUI’s in 1991 and amended/updated
in 1997 and 2006 (TMACOG 1991, 1997, 2006). The Maumee RAP (2002) summarizes of all
activities that were identified during the 1990’s such as agricultural runoff, landfills, and
WWTP’s.
The Milwaukee River is located in southeast Wisconsin and drains into the western shore
of Lake Michigan. The Milwaukee Estuary AOC (collecting the Milwaukee River) was

11
originally listed as a result of industrial discharges of chemicals such as PCBs, PAHs and heavy
metals to the river, as well as municipal sewer discharges and habitat manipulation due to the
dredging of shipping channels (USEPA 2011b). Restoration efforts began in the Milwaukee
estuary in the mid 1970’s. From 1975-1988, approximately 938,032 meters3 of contaminated
sediment were dredged and removed from the area currently included in the AOC (WDNR
1991). Kerr and Cruickshank (2003) detected varying concentrations of semi-volatile organic
(SVOC) compounds and PCB’s in sediment collected from the Kinnickinnic River. The Cedar
Creek superfund alternative site is located in Cedarburg, Wisconsin and contains the Mercury
Marine Plant-2 and the Amcast facility. The site had been found to contain varying
concentrations of PCB’s, PAH’s, heavy metals, volatile organic compounds (VOC) and
inorganic compounds in sediment and groundwater (BBL 2007). The site is currently being
evaluated by the U.S. EPA for cleanup (USEPA 2011c).
The Niagara River AOC is located in western New York. The AOC was originally listed
as a result of municipal and industrial discharges of chemicals such as PCBs, dioxins, pesticides,
PAHs and heavy metals to the river (USEPA 2011a). Remediation efforts for the AOC have
occurred since the early 1970’s. The MOEE (1995a, b) report summarizes historic actions
designed to remediate or mitigate for impacted areas of the basin. The MOEE (1994) report
indicates an 83% and 62% reduction in loadings of the 18 chemicals of emerging concern for
municipalities and industrial dischargers, respectively, from 1986 to 1992. Extensive remediation
efforts starting in 1989 have targeted both point and non-point source pollution sites for the
clean-up of 26 identified priority hazardous waste sites targeting the 18 priority toxic chemical
loadings (referred to as chemicals of emerging concern above) to the Niagara River (USEPA and
NYSDEC 2010).

12
The Saint Louis River begins in northeastern Minnesota and flows south-southeast
ultimately draining north into the western point of Lake Superior at the border if Minnesota and
Wisconsin. The legacy contaminants found within the Saint Louis River AOC are primarily
PAH’s, PCB’s, dioxin, heavy metals, and organic compounds (MPCA and WIDNR 1992;
Schubauer-Berigan and Crane 1997). The extensive history of industrial and municipal
discharges is thought to be the possible cause of the observed contamination (MPCA and
WIDNR 1992). MPCA and WIDNR (1995) identified ‘hot spots’ of contamination within the
AOC and also outlined a series of remediation projects generally targeting contaminated
sediment. Highly detailed reports have been produced for sites located in and around the AOC
outlining the exact scope of the contamination and recommendations for remediation (Crane et
al. 1997; Crane 1999; MPCA 1999, 2001; Bay West Inc 2005; Streitz and Johnson 2005).
Resulting from contamination research, the Duluth Tar site and the U.S. Steel Superfund site are
currently being remediated (MPCA 2004, 2010; Aether DBS 2011). All BUI’s for the St. Louis
River have been evaluated by both the states of Wisconsin and Minnesota and both have
presented avenues for delisting (SEH and ECT 2007; MPCA 2009).
In summary, the micronucleus assay is sensitive to genotoxic and/or mutagenic
contaminants (F. Ali et al. 2008). There is, however some question as to the utility of applying
the results across taxa (Grisolia and Cordeiro 2000). Interestingly, recent research observed a
seasonal change in histological and immune function biomarkers (Iwanowicz et al. 2012). As a
result of the differing contaminants recorded at each site, we would expect to observe a
difference in MN and NA expression rates among the ten sites we evaluated. We would also
expect to observe a difference in the expression of our endpoints among the more pelagic-
oriented, higher order taxa and the lower-order, more benthic-oriented taxa collected at each site.

13
This would result from the higher body burden of chemicals in higher order taxa as observed by
Iwanowicz et al. (2012). Finally, we would expect to observe a difference in the expression of
our endpoints among the spring and fall sampling seasons. The results of these data are presented
in the following chapter and should provide for a greater understanding of the biologically
appreciable genotoxic and mutagenic contamination present at the specific sites within the Great
Lakes basin.
Objectives
The specific objectives of this project are to: 1. Evaluate micronuclei (MN) and nuclear
abnormality (NA) occurrence rates among 10 sites throughout the Great Lakes basin within each
of the 4 possible species sampled; 2. Evaluate MN and NA occurrence rates among 4 possible
species sampled within each site; 3. Evaluate MN and NA occurrence rates among 2 sampling
seasons within sites and within species; 4. Evaluate the frequency of occurrence of MN and NA
as a function of age to determine is age is an important covariate explaining MN and NA
expression; and 5. Examine the land use/land cover, point source discharge sites and water and
sediment chemistry data for any possible trends that may exist among MN and/or NA occurrence
rates.

14
Literature Cited
Abele, L. E., R. W. Bode, M. A. Novak, and D. L. Heitzman. 2001. Knight Creek Biological
Assessment. New York State Department of Environmental Conservation, Albany, New
York. May, 2001.
Aether DBS. 2011. Saint Louis River, Interlake, Duluth Tar Site. Aether DBS, Naperville,
Illinois. Available: http://www.aetherdbs.com/index.php/contaminated-sediments-clean-
up-in-duluth-mn. (December, 2011).
Al-Sabti, K. and C. D. Metcalfe. 1995. Fish Micronuclei for Assessing Genotoxicity in Water.
Mutation Research 343:121-135.
Ali, D., N. S. Nagpure, S. Kumar, R. Kumar, and B. Kushwaha. 2008. Genotoxicity assessment
of acute exposure of chlorpyrifos to freshwater fish Channa punctatus (Bloch) using
micronucleus assay and alkaline single-cell gel electrophoresis. Chemosphere 71:1823-
1831.
Ali, F. K., A. M. El-Shehawi, and M. A. Seehy. 2008. Micronucleus test in fish genome : A
sensitive monitor for aquatic pollution. African Journal of Biotechnology. 7:606-612.
Arcand-Hoy, L. D. and C. D. Metcalfe. 2000. Hepatic Micronuclei in Brown Bullheads
(Ameiurus nebulosus) as a Biomarker for Exposure to Genotoxic Chemicals. Journal of
Great Lakes Research 26:408-415.
Ankley, G. T., D. C. Bencic, M. S. Green, T. W. Collette, R. B. Conolly, N. D. Denslow, S. W.
Edwards, D. R. Ekman, N. Garcia-Reyero, D. H. Miller, K. M. Jensen, J. M. Lazorchak,
D. Martinović, E. J. Perkins, E. F. Orlando, D. L. Villeneuve, R. Wang, and K. H.
Watanabe. 2009. Endocrine disrupting chemicals in fish: Developing exposure indicators
and predictive models of effects based on mechanism of action. Aquatic Toxicology
92:168-178.
Au, D. W. T. 2004. The application of histo-cytopathological biomarkers in marine pollution
monitoring: a review. Marine Pollution Bulletin 48:817-834.
Baumann P.C., J.C. Harshbarger, and K.J. Hartman. 1990. Relationship between liver tumors
and age in brown bullhead populations from two Lake Erie tributaries. The Science of the
Total Environment 94:71–87.
Bay West, Incorporated. 2005. Minnesota Slip Focused Feasibility Study. Bay West,
Incorporated, St. Paul, Minnesota. Final Report Prepared for Minnesota Pollution Control
Agency, St. Paul, Minnesota. November, 2005. BW#J040375, Document #81203.
Blasland, Bouck, and Lee (BBL). 2007. Remedial Investigation Report: Mercury Marine-Plant 2,
Cedarburg, Wisconsin. October, 2007.

15
Blazer, V. S., S. D. Rafferty, P. C. Baumman, S. B. Smith, and E. C. Obert. 2009a. Assessment
of the “fish tumors or other deformities” beneficial use impairment in brown bullhead
(Ameiurus nebulosus): I. Orocutaneous tumors. Journal of Great Lakes Research 35:517-
526.
Blazer, V. S., S. D. Rafferty, P. C. Baumman, S. B. Smith, and E. C. Obert. 2009b. Assessment
of the “fish tumors or other deformities” beneficial use impairment in brown bullhead
(Ameiurus nebulosus): II. Liver neoplasia. Journal of Great Lakes Research 35:527-537.
Bolognesi, C., E. Perrone, P. Roggieri, D. M. Pampanin, and A. Sciutto. 2006. Assessment of
micronuclei induction in peripheral erythrocytes of fish exposed to xenobiotics under
controlled conditions. Aquatic Toxicology 78:93-98.
Bolognesi, C. and M. Hayashi. 2011. Micronucleus assay in aquatic animals. Mutagenesis
26:205-213.
Candioti, J. V., S. Soloneski, and M. L. Larramendy. 2010. Genotoxic and cytotoxic effects of
the formulated insecticide Aficida® on Cnesterodon decemmaculatus (Jenyns, 1842)
(Pisces: Poeciliidae). Mutation Research 703:180-186.
Çavaş, T. 2008. In vivo genotoxicity of mercury chloride and lead acetate: Micronucleus test on
acridine orange stained fish cells. Food and Chemical Toxicology 46:352-358.
Çavaş, T. 2011. In vivo genotoxicity evaluation of atrazine and atrazine-based herbicide on fish
Carassius auratus using the micronucleus test and the comet assay. Food and Chemical
Toxicology 49:1431-1435.
Çavaş, T., and S. Könen. 2007. Detection of cytogenetic and DNA damage in peripheral
erythrocytes of goldfish (Carassius auratus) exposed to a glyphosate formulation using
the micronucleus test and the comet assay. Mutagenesis 22:263-268.
Costa, P. M., and M. H. Costa. 2007. Genotoxicity assessment in fish peripheral blood: a method
for a more efficient analysis of micronuclei. Journal of Fish Biology 71:148-151.
Costa, P. M., M. S. Diniz, S. Caeiro, J. Lobo, M. Martins, A. M. Ferreira, M. Caetano, C. Vale,
T. Á. Delvalls, and H. M. Costa. 2009. Histological biomarkers in liver and gills of
juvenile Solea senegalensis exposed to contaminated estuarine sediments: A weighted
indices approach. Aquatic Toxicology 92:202-212.
Crane, J. L., M. Schubauer-Berigan, and K. Schmude. 1997. Sediment Assessment of Hotspot
Areas in the Duluth/Superior Harbor. Minnesota Pollution Control Agency,
Environmental Outcomes Division, St. Paul, MN, and University of Wisconsin, Lake
Superior Research Institute, Superior, Wisconsin. Final Report Submitted to U.S.
Environmental Protection Agency, Great Lakes National Program Office, Chicago,
Illinois. December, 1995. EPA-905-R97-020.

16
Crane, J. L. 1999. EPA Assessment of Contaminated Sediments in Slip C Duluth Harbor ,
Minnesota. Minnesota Pollution Control Agency, Environmental Outcomes Division, St.
Paul, Minnesota. Final report Prepared for U. S. Environmental Protection Agency, Great
Lakes National Program Office, Chicago, Illinois. September, 1999. EPA-905-R-99-007.
Elliott, R. 2002. Monroe County Water Quality Management Agency Annual Report 2001.
Monroe County Water Quality Management Agency. October, 2002.
Ergene, S., T. Çavaş, A. Çelik, K. Nurcan, and C. Aymak. 2007. Evaluation of river water
genotoxicity using the piscine micronucleus Test. Environmental and Molecular
Mutagenesis 48:421-429.
Esman, L. A. 2008. The Michigan Department of Environmental Quality Biennial Remedial
Action Plan Update for the Detroit River Area of Concern. Water Bureau Aquatic
Nuisance Control & Remedial Action Unit, Michigan Department of Environmental
Quality, Lansing, Michigan. January, 2008.
Fenech, M. 2000. The in vitro micronucleus technique. Mutation Research 455:81-95.
Fischer, U., M. Ototake, and T. Nakanishi. 1998. Life Span of Circulating Blood Cells in
Ginbuna Crucian Carp (Carassius auratus Langsdorfi). Fish and Shellfish Immunology
8:339-349.
Fort James Corporation, Foth and Van Dyke, and Hart Crowser, Inc., 2001. Final Report, 2000:
Sediment Management Unit 56/57 Project, Lower Fox River, Green Bay Wisconsin.
Prepared for the United States Environmental Protection Agency and Wisconsin
Department of Natural Resources. January, 2001. Scope ID: 00F011.
Foth and Van Dyke. 2000. Summary Report of the Fox River Deposit N: Final Project Report.
Green Bay, Wisconsin. Final Report Submitted to the Wisconsin Department of Natural
Resources. March, 2000. Scope ID: 97W027 Division Project No. 97746.
Fry, J., G. Xian, S. Jin, J. Dewitz, C. Homer, L. Yang, C. Barnes, N. Herold, and J. Wickham.
2011. Completion of the 2006 National Land Cover Database for the Conterminous
United States. Photogrammetric Engineering & Remote Sensing 77:858-864.
Grisolia, C. K., and C. M. T. Cordeiro. 2000. Variability in micronucleus induction with
different mutagens applied to several species of fish. Genetics and Molecular Biology.
23:235-239.
Hayashi, M., T. Ueda, K. Uyeno, K. Wada, N. Kinae, K. Saotome, N. Tanaka, A. Takai, Y. F.
Sasaki, N. Asano, T. Sofuni, and Y. Ojima. 1998. Development of genotoxicity assay
systems that use aquatic organisms. Mutation Research 399:125–133.
17
Heidtke, T., J. H. Hartig, M. A. Zarull, M.A., and B. Yu. 2006. PCB levels and trends within the
Detroit River–Western Lake Erie Basin: a historical perspective of ecosystem
monitoring. Environmental Monitoring and Assessment 112:23–33.
Hunter, A. S., and F. R. Hunter. 1957. A Comparative Study of Erythrocyte Metabolism. Journal
of Cellular and Comparative Physiology 49:479-502.
International Joint Commission. 1987. Revised Great Lakes Water Quality Agreement of 1978,
as Amended by Protocol, Signed November 18, 1987. Windsor, ON: International Joint
Commission.
Iwanowicz, L. R., V. S. Blazer, N. P. Hitt, S. D. McCormick, D. S. DuVault, and C. A. Ottinger.
2012. Histologic, Immunologic and Endocrine Biomarkers Indicate Contaminant Effects
in Fishes of the Ashtabula River. Ecotoxicology 21:165-182.
Kerr, I. and M. Cruickshank. 2003. Sediment Sampling From the Kinnickinnic River,
Milwaukee, Wisconsin: Final Report. Altech Environmental Services, Inc., Southfield,
Michigan. Final Report Submitted to U. S. Army Corps of Engineers. March, 2003.
DACW35-01-D-0006.
Klečka, G., C. Persoon, and R. Currie. 2010. Chemicals of Emerging Concern in the Great Lakes
Basin: An Analysis of Environmental Exposures. Edited by David M. Whitacre. Reviews
of Environmental Contamination and Toxicology 207:1-93.
Kolpin, D. W., E. T. Furlong, M. T. Meyer, E. M. Thurman, S. D. Zaugg, L. B. Barber, and H. T.
Buxton HT. 2002. Pharmaceuticals, hormones, and other organic wastewater
contaminants in U.S. streams, 1999– 2000: A national reconnaissance. Environmental
Science and Technology 36:1202– 1211.
Kohlpoth, M., B. Rusche, and M. Nüsse. 1999. Flow cytometric measurement of micronuclei
induced in a permanent fish cell line as a possible screening test for the genotoxicity of
industrial waste waters. Mutagenesis 14:397-402.
Kumar, R., N. S. Nagpure, B. Kushwaha, S. K. Srivastava, and W. S. Lakra. 2010. Investigation
of the genotoxicity of malathion to freshwater teleost fish Channa punctatus (Bloch)
using the micronucleus test and comet assay. Archives of Environmental Contamination
and Toxicology 58:123-130.
Lake Erie Areas of Concern Summit. 2006. Fact Sheets on Lake Erie Areas of Concern. Great
Lakes Commission, Ann Arbor, Michigan. Available:
http://www.glc.org/aocsummits/lakeerie/pdf/AOC_webpages_OnlineVersion2.pdf.
(August, 2011).
Larkin, P., Knoebl, I., and N. D. Denslow. 2003. Differential gene expression analysis in fish
exposed to endocrine disrupting compounds. Comparative Biochemistry and Physiology
Part B 136:149-161.

18
LimnoTech. 2011. DRAFT TMDL Support Document for PCBs in Lake Ontario. Ann Arbor,
Michigan. Draft Report Prepared for the U. S. Environmental Protection Agency. July,
2011. EP-C-08-001.
Liney, K. E., J. A. Hagger, C. R. Tyler, M. H. Depledge, T. S. Galloway, and S. Jobling. 2006.
Health Effects in Fish of Long-Term Exposure to Effluents from Wastewater Treatment
Works. Environmental Health Perspectives 114:81-89.
Maccubbin A. E., and N. Ersing. 1991. Tumors in fish from the Detroit River. Hydrobiologia
219:301–306.
Maumee RAP. 2002. Maumee Activities and accomplishments of the in the Maumee Area of
Concern, 1991-2001. Maumee River Remedial Action Plan, Bowling Green, Ohio. April,
2002.
Mekkawy, I. A., U. M. Mahmoud, and A. El-Din H. Sayed. 2011. Effects of 4-nonylphenol on
blood cells of the African catfish Clarias gariepinus (Burchell, 1822). Tissue and Cell
43:223-229.
Minissi, S., E. Ciccotti, and M. Rizzoni. 1996. Micronucleus test in erythrocytes of Barbus
plebejus (Teleostei, Pisces) from two natural environments: a bioassay for the in situ
detection of mutagens in freshwater. Mutation Research 367:245-251.
MOEE. 1994. Update Report: Reduction of Toxic Chemicals From Ontario Point Sources
Discharging To The Niagara River 1992. Ontario Ministry of the Environment and
Energy, Toronto, Ontario. May, 1994. ISBN 0-7778-2795-6.
MOEE. 1995a. Stage 1 Update, Environmental Conditions and Problems Definition. Ontario
Ministry of the Environment and Energy, Toronto, Ontario. March, 1995. ISBN 0-7778-
3896-6.
MOEE. 1995b. Stage 2 Report/Recommended Plan – The Cleanup Connection. Ontario Ministry
of the Environment and Energy, Toronto, Ontario. April, 1995. ISBN 0-7778-3897-4.
MPCA and WIDNR. 1992. 1992 Saint Louis River Remedial Action Plan: Stage One. Minnesota
Pollution Control Agency, St. Paul, MN, and Wisconsin Department of Natural
Resources, Madison, Wisconsin. April, 1992.
MPCA and WIDNR. 1995. 1995 Saint Louis River Remedial Action Plan: Progress Report.
Minnesota Pollution Control Agency, St. Paul, MN, and Wisconsin Department of
Natural Resources, Madison, Wisconsin. April, 1995.
MPCA. 1999. Lake Superior/Duluth-Superior Harbor Toxics Loading Study. Minnesota
Pollution Control Agency, Environmental Outcomes Division, Groundwater and Toxics
Monitoring, St. Paul, MN. Final Report Submitted to U. S. Environmental Protection
Agency, Region 5, Chicago, Illinois. September, 1999. Grant# X995402-01.
19
MPCA. 2001. Analysis of Sediment Cores to Assess Chlorinated Bornanes and Chlorinated
Bornenes in the St . Louis River: Final Report. Minnesota Pollution Control Agency, St.
Paul, MN. Final Report Submitted to U. S. Environmental Protection Agency, Great
Lakes National Program Office, Chicago, Illinois. September, 2001. GL985919-01-0.
MPCA. 2004. Record of Decision for the Sediment Operable Unit Saint Louis
River/Interlake/Duluth Tar Site, Duluth, Minnesota Under the Minnesota Environmental
Response and Liability Act, Minn. Stat. §§ 115B.01-115B.24. Minnesota Pollution
Control Agency, St. Paul, MN. August, 2004.
MPCA. 2009. St. Louis River Area of Concern Delisting Targets: December 2008. Minnesota
Pollution Control Agency, St. Paul, MN. February, 2009. wq-iw1-25. Available:
http://www.pca.state.mn.us/index.php/view-document.html?gid=7183. (December,
2011).
MPCA. 2010. St. Louis River-U.S. Steel Superfund Site: Operable Unit (OU) Summary.
Minnesota Pollution Control Agency, St. Paul, MN. September, 2010. Available:
http://www.pca.state.mn.us/index.php/waste/waste-and-cleanup/cleanup-programs-and-
topics/topics/remediation-sites/st.-louis-river-u.s.-steel-superfund-site/st.-louis-river-u.s.-
steel-superfund-site-operable-unit-ou-summary.html. (December, 2011).
Muranli, F. D. G., and U. Güner. 2011. Induction of micronuclei and nuclear abnormalities in
erythrocytes of mosquito fish (Gambusia affinis) following exposure to the pyrethroid
insecticide lambda-cyhalothrin. Mutation Research 726:104-108.
Myers, M. and J. Fournie. 2002. Histopathological Biomarkers as Integrators of Anthropogenic
and Environmental Stressors. Pages 221-287 in S. M. Adams editor. Biological Indicators
of Aquatic Ecosystem Stress. American Fisheries Society, Bethesda, Maryland.
Nepomuceno, J. C., I. Ferrari, M. A. Spanó, and A. J. Centeno. 1997. Detection of micronuclei in
peripheral erythrocytes of Cyprinus carpio exposed to metallic mercury. Environmental
and Molecular Mutagenesis 30:293-297.
Noll, M. R. And E. Magee. 2007. Stressed Stream Analysis of the Larkin and Northrup Creek
Watersheds, Monroe County, New York: Draft Report. State University of New York
College at Brockport. Draft Report Submitted to The Stormwater Coalition of Monroe
County.
NYSDEC. 2003. The 2001 Genesee River Basin Waterbody Inventory and Priority Waterbodies
List. New York State Department of Environmental Conservation, Albany, New York.
March, 2003.
NYSDEC. 2010. Record of Decision Former Raeco Products Site State Superfund Project
Rochester (C), Monroe County, New York Site Number 828107. New York State
Department of Environmental Conservation, Albany, New York. March, 2010.

20
NYSDEC. 2011. Environmental Site Remediation Database. New York State Department of
Environmental Conservation, Albany, New York. Available:
http://www.dec.ny.gov/cfmx/extapps/derexternal/index.cfm?pageid=3. (October, 2011).
Pantaleão, Sde M., A. V. Alcântara, Jdo. P. H. Alves, and M. A. Spanó. 2006. The Piscine
Micronucleus Test to Assess the Impact of Pollution on the Japaratuba River in Brazil.
Environmental and Molecular Mutagenesis 47:219-224.
Pinkney A. E., J. C. Harshbarger, E. B. May, and M. J. Melancon. 2001. Tumor prevalence and
biomarkers of exposure in brown bullheads (Ameiurus nebulosus) from the tidal Potomac
River, USA, watershed. Environmental Toxicology and Chemistry 20:1196–1205.
Polard, T, S. Jean, G. Merlina, C. Laplanche, E. Pinelli, and L. Gauthier. 2011. Giemsa versus
acridine orange staining in the fish micronucleus assay and validation for use in water
quality monitoring. Ecotoxicology and Environmental Safety 74:144-149.
Rafferty, S. D., V. S. Blazer, A. E. Pinkney, J. L. Grazio, E. C. Obert, and L. Boughton. 2009. A
historical perspective on the “fish tumors or other deformities” beneficial use impairment
at Great Lakes Areas of Concern. Journal of Great Lakes Research 35:496-506.
Rao, S. S., T. Neheli, J. H. Carey, and V. W. Carins. 1997. Fish hepatic micronuclei as an
indication of exposure to genotoxic environmental contaminants. Environmental
Toxicology and Water Quality 12:217-222.
Ramírez, O. A., and F. P. García. 2005. Genotoxic damage in zebra fish (Danio rerio) by arsenic
in waters from Zimapán, Hidalgo, Mexico. Mutagenesis 20:291-295.
Rodriguez-Cea, A., F. Ayllon, and E. Garcia-Vazquez. 2003. Micronucleus test in freshwater
fish species: an evaluation of its sensitivity for application in field surveys.
Ecotoxicology and Environmental Safety 56:442–448.
Rowan, M. W. 2007. Use of blood parameters as biomarkers in brown bullheads (Ameiurus
nebulosus) from Lake Erie tributaries and Cape Cod ponds. Doctoral dissertation. Ohio
State University, Colombus.
Salvagni, J. R., Z. Ternus, and A. M. Fuentefria. 2010. Assessment of the genotoxic impact of
pesticides on farming communities in the countryside of Santa Catarina State, Brazil.
Genetics and Molecular Biology 34: 122-126.
Sánchez-Galán, S., A. R. Linde, J. I. Izquierdo, and E. García-Vázquez. 1998. Micronuclei and
fluctuating asymmetry in brown trout (Salmo trutta): complementary methods to
biomonitor freshwater ecosystems. Mutation Research 412:219-225.
Schubauer-Berigan, M. and J. L. Crane. 1997. Survey of Sediment Quality in the
Duluth/Superior Harbor: 1993 Sample Results. Minnesota Pollution Control Agency, St.
21
Paul, Minnesota. Prepared for U. S. Environmental Protection Agency, Great Lakes
National Program Office, Chicago, Illinois. March, 1997. EPA-905-R97-005.
Schultz, R. J., L. A. E. Kaplan, and M. E. Schultz. 1993. Heat induced liver cell proliferation in
the livebearing fish Poeciliopsis. Environmental Biology of Fishes 36:83-91.
SEH and ECT. 2007. Wisconsin Proposed Targets for St. Louis River Area of Concern's
Beneficial Use Impairments. Short Elliott Hendrickson Inc., Chippewa Falls, Wisconsin
and Environmental Consulting & Technology, Inc., Ann Arbor, Michigan. Final Report
Submitted to Wisconsin Department of Natural Resources, Madison, Wisconsin. October,
2007. Available: http://www.scribd.com/doc/33244829/Wisconsin-Proposed-Targets-for-
St-Louis-River-Area-of-Concern-s-Beneficial-Use-Impairments#page=7. (December,
2011).
Singh, N. P., M. T. McCoy, R. R. Tice, and E. L. Schneider. 1988. A simple technique for
quantitation of low levels of DNA damage in individual cells. Experimental Cell
Research 175:184–191.
Smith, I. R. 1990. Erythrocytic Micronuclei in Wild Fish from Lakes Superior and Ontario that
have Pollution-Associated Neoplasia. Journal of Great Lakes Research 16:139-142.
Soldatov, A. A. 2005. Peculiarities of Organization and Functioning of the Fish Red Blood
System. Journal of Evolutionary Biochemistry and Physiology 41:272-281.
Steuer, J. J. 2000. A Mass-Balance Approach for Assessing PCB Movement During Remediation
of a PCB-Contaminated Deposit on the Fox River, Wisconsin. U.S. Geological Survey,
Water Resources Investigations Report 00-4245, U.S. Department of the Interior, U. S.
Geological Survey. December 2000. Available:
http://pubs.usgs.gov/wri/2000/4245/report.pdf. (October, 2011)
Streitz, A., and S. Johnson. 2005. Detailed Investigation of the Minnesota Slip. Minnesota
Pollution Control Agency, Remediation Division, Superfund and Emergency Response,
Duluth, Minnesota. June, 2005. MPCA Technical Document, tdr-g1-01.
Takai, A., N. Kagawa, and K. Fujikawa. 2004. Dose- and time-dependent responses for
micronucleus induction by X-rays and fast neutrons in gill cells of medaka (Oryzias
latipes). Environmental and Molecular Mutagenesis 44:108–112.
Tatem, H. E., D. L. Brandon, C. R. Lee, J. W. Simmers, and J. G. Skogerboe. 1990. Information
Summary, Area of Concern: Ashtabula River, Ohio. Miscellaneous Paper EL-90-22, US
Army Engineer Waterways Experiment Station, Vicksburg, MS.
TMACOG. 1990. Maumee River Remedial Action Plan, Stage I Investigation Report. The
Metropolitan Area Council of Governments, Toledo, OH. October, 1990.

22
TMACOG. 1991. Maumee River Basin Area Of Concern Remedial Action Plan, Volume 4,
Recommendations for Implementation. The Metropolitan Area Council of Governments,
Toledo, OH. July, 1991.
TMACOG. 1997. Maumee Remedial Action Plan Strategic Plan 1997. The Metropolitan Area
Council of Governments, Toledo, OH. July, 1997.
TMACOG. 2006. Maumee Area of Concern Maumee Area of Concern Stage 2 Watershed
Restoration Plan, Volume 1, Draft. The Metropolitan Area Council of Governments,
Toledo, OH. January, 2006.
USEPA. 2005. Great Lakes Legacy Act Partnership Spurs Ashtabula River Cleanup. U.S.
Environmental Protection Agency, Region 5, Chicago, Illinois. December, 2005.
USEPA. 2008a. Ashtabula River Remedial Action Plan Annual Report. U.S. Environmental
Protection Agency, Region 5, Westlake, Ohio.
USEPA. 2008b. Great Lakes Legacy Act Success Stories, Ashtabula River Cleanup. U.S.
Environmental Protection Agency, Region 5, Chicago, Illinois. May, 2008
USEPA. 2010. Facility Registry System State CSV Download File Descriptions: Version 1.1.
U.S. Environmental Protection Agency, Office of Environmental Information, Office of
Information Collection. April, 2010.
USEPA. 2011a. Great Lakes Areas of Concern: Niagara River Area of Concern. U.S.
Environmental Protection Agency. Available: http://epa.gov/glnpo/aoc/niagara.html
(October, 2011).
USEPA. 2011b. Great Lakes Areas of Concern: Milwaukee Estuary Area of Concern. U.S.
Environmental Protection Agency. Available: http://epa.gov/glnpo/aoc/milwaukee.html
(December, 2011).
USEPA. 2011c. Region 5 Cleanup Sites: Cedar Creek. U.S. Environmental Protection Agency,
Region 5, Chicago, Illinois. Available:
http://www.epa.gov/region5/cleanup/cedarcreek/index.htm#techdocs (December, 2011).
USEPA and MIDEQ. 2009. Remediation of the Black Lagoon Trenton, Michigan Great Lakes
Legacy Program. U. S. Environmental Protection Agency, Region 5, Chicago, Illinois,
and Michigan Department of Environmental Quality, Lansing, Michigan. January, 2008.
USEPA and NYSDEC. 2010. Status Update for: Reduction of Toxics Loadings to the Niagara
River from Hazardous Waste Sites in the United States. U. S. Environmental Protection
Agency, Region 2, New York, New York and New York State Department of
Environmental Conservation, Albany, New York. December, 2010.

23
Vethaak, A. D., and J. G. Jol. 1996. Diseases of flounder Platichthys flesus in Dutch coastal and
estuarine waters, with particular reference to environmental stress factors. I.
Epizootiology of gross lesions. Diseases of Aquatic Organisms 26:81-97.
WDNR. 1988. Lower Green Bay Remedial Action Plan for the Lower Fox River and Lower
Green Bay Area of Concern. Wisconsin Department of Natural Resources, Madison,
Wisconsin. February, 1988. PUBL-WR-175-87 REV 88
WDNR. 1991. Milwaukee Estuary Remedial Action Plan. Wisconsin Water Quality
Management Program, Wisconsin Department of Natural Resources, Madison,
Wisconsin. March, 1991. PUBL-WR-276-91.
WDNR. 1993. Remedial Action Plan Update for the Lower Fox River and Lower Green Bay
Area of Concern. Wisconsin Department of Natural Resources, Madison, Wisconsin.
September, 1993.
WDNR. 2011. Lower Fox River Operable Unit 1 Post-Remediation Executive Summary.
Wisconsin Department of Natural Resources, Madison, Wisconsin. March, 2011.
Williams, R. C. and C. D. Metcalfe. 1992. Development of an in vivo hepatic micronucleus
assay with rainbow trout. Aquatic Toxicology 23:193–202.
Wirzinger, G., L. Weltje, J. Gercken, and H. Sordyl. 2007. Genotoxic damage in field-collected
three-spined sticklebacks (Gasterosteus aculeatus L.): a suitable biomonitoring tool?
Mutation Research 628:19-30.
Xuan, Y., J. Meier, L. Chang, M. Rowan, and P. C. Baumann. 2006. DNA Damage and External
Lesions in Brown Bullheads (Ameirus nebulosus) from Contaminated Habitats.
Environmental Toxicology and Chemistry 25:3035-3038.

24
Tables and Figures
Table 1. Summary of chemicals shown to induce micronuclei in fishes. These chemicals are an
extension of the chemical lists provided by both Al-Sabti and Metcalfe (1995), and Bolognesi
and Hayashi (2011).
Chemical
Family Chemical Name Species Cell Sampled Reference
Heavy Metal Cadmium (Cd) Sparus aurata Peripheral
erythrocytes
Costa and Costa
2007
Cadmium (Cd)
Salmo trutta,
Anguilla anguilla,
and Phoxinus
phoxinus
Peripheral
erythrocytes
Rodriguez-Cea et al.
2003
Lead (II) acetate
Carassius auratus
auratus
Peripheral
erythrocytes, Gill
Cells, Fin cells
Çavaş 2008
Mercury (Hg
0) Cyprinus carpio
Peripheral
erythrocytes
Nepomuceno et al.
1997
Mercury (II) chloride
Carassius auratus
auratus
Peripheral
erythrocytes, Gill
Cells, Fin cells
Çavaş 2008
Potassium dichromate (PCr2)
Oncorhynchus
mykiss
Gonadal Cell line
(RTG-2) Kohlpoth et al. 1999
PAH Benzo[a]pyrene Oncorhynchus
mykiss
Gonadal Cell line
(RTG-2) Kohlpoth et al. 1999
Pesticides Atrazine (C8H14ClN5 – PESTANAL
®
45330 98% purity) Carassius auratus
Peripheral
erythrocytes Çavaş 2011
Chlorpyrifos (O,O-diethyl O-3,5,6-
trichloro-2-pyridylphosphorothioate) Channa punctatus
Peripheral
erythrocytes and
Gill Cells
D. Ali et al. 2008
Gesaprim® containing 500 mg/mL
Atrazine Carassius auratus
Peripheral
erythrocytes Çavaş 2011
Glyphosate (Roundup® containing
isopropylammonium salt of
glyphosate at 480 g/l as the active
ingredient (equivalent to 360 g
glyphosate per liter))
Carassius auratus Peripheral
erythrocytes
Çavaş and Könen
2007
Lambda-cyhalothrin (alpha-cyano-3-
phenoxy-benzyl(Z)-(1S,3S)-3-(2-
chloro-3,3,3- trifluoroprop-1-enyl)-2-
2-dimethylcyclopanecarboxylate)
Gambusia affini Peripheral
erythrocytes
Muranli and Güner
2011
Malathion [S-(1,2-dicarboethoxyethyl)
O, O-dimethyl phosphorodithioate] Channa punctatus
Peripheral
erythrocytes Kumar et al. 2010
Pirimicarb (2-dimethylamino-5,6-
dimethylpyrimidin-4-
yldimethylcarbamate)
Cnesterodon
decemmaculatus
Peripheral
erythrocytes Candioti et al. 2010
Pharmaceuticals 1,4-butane sultone (1,4-BS) Oncorhynchus
mykiss
Gonadal Cell line
(RTG-2) Kohlpoth et al. 1999

25
Chemical
Family Chemical Name Species Cell Sampled Reference
5-fluorouracil (5-FU)
Tilapia rendalli,
Oreochromis
niloticus and
Cyprinus carpio
Peripheral
erythrocytes
Grisolia and
Cordeiro 2000
Pharmaceuticals
(ctd.) Bleomycin
Tilapia rendalli,
Oreochromis
niloticus and
Cyprinus carpio
Peripheral
erythrocytes
Grisolia and
Cordeiro 2000
Colchicine
Salmo trutta,
Anguilla anguilla,
and Phoxinus
phoxinus
Peripheral
erythrocytes
Rodriguez-Cea et al.
2003
Mitomycin C
Tilapia rendalli,
Oreochromis
niloticus and
Cyprinus carpio
Peripheral
erythrocytes
Grisolia and
Cordeiro 2000
Phenol Bisphenol A Scophthalmus
maximus
Peripheral
erythrocytes
Bolognesi et al.
2006
Nonylphenol Clarias gariepinus
Peripheral
erythrocytes
Mekkawy et al.
2011
Pulp Mill
Effluent Pulp Mill Effluent Extract
Oncorhynchus
mykiss
Hepatic cells
Rao et al. 1997
Wastewater Wastewater Treatment Plant Effluent Rutilus rutilus
Peripheral
erythrocytes and
Gill cells
Liney et al. 2006
Wild Sites Agricultural Contamination Suspected Carassius
carassius
Peripheral
erythrocytes Polard et al. 2011
Agricultural Contamination Suspected
Cyprinus carpio,
Hypostomus
punctatus,
Rhamdia quelen
and Oreochromis
niloticus
Peripheral
erythrocytes Salvagni et al. 2010
Industrial Contamination Suspected
Astyanax
bimaculatus and
Hoplias
malabaricus
Peripheral
erythrocytes Pantaleão et al. 2006
Industrial Contamination Suspected
Ameiurus
nebulosus Hepatic cells Rao et al. 1997
Industrial Contamination Suspected
Ameiurus
nebulosus
Peripheral
erythrocytes Rowan 2007
Industrial Contamination Suspected
Ameiurus
nebulosus
Peripheral
erythrocytes Yang 2004
Industrial Contamination Suspected
(Heavy Metals)
Oreochromis
niloticus Gill cells Ergne et al. 2007
Industrial Contamination Suspected
(Heavy Metals)
Oreochromis
niloticus
Peripheral
erythrocytes Ergne et al. 2007
Urban and Industrial Runoff
Suspected Barbus plebejus
Peripheral
erythrocytes Minissi et al. 1996
Various Causative Agents Suspected
Salmo trutta,
Anguilla anguilla,
and Phoxinus
phoxinus
Peripheral
erythrocytes
Rodriguez-Cea et al.
2003

26
Chemical
Family Chemical Name Species Cell Sampled Reference
Wild Sites
(ctd.) Various Causative Agents Suspected Salmo trutta
Peripheral
erythrocytes
Sánchez-Galán et al.
1998
Various Causative Agents Suspected
Ameiurus
nebulosus, and
Catostomus
commersoni
Peripherial
erythrocytes Smith 1990
Wastewater Contamination Suspected
Gasterosteus
aculeatus
Peripheral
erythrocytes
Wirzinger et al.
2007
Wild Well Site (Arsenic (As)
suspected) Danio rerio Gill cells
Ramírez and García
2005
X-rays X-rays Oryzias latipes Gill cells Takai et al. 2004

27
Figure 1. Locations of field sampling sites. Sites are identified from west to east as the: Saint
Louis River, Fox River, Milwaukee River, Swan Creek, Duck/Otter Creek, Detroit River,
Ashtabula River, Conneaut Creek, Niagara River, and Genesee River. The Great Lakes drainage
basin is colored in light gray.

28
Chapter 2: An Evaluation of the Occurrence of Micronuclei and Nuclear Abnormalities in
Fishes from the Great Lakes Basin, United States
Introduction
A variety of chemicals have been reported to cause disruptive effects on biological
systems that can be detected using histological, molecular and genetic endpoints (Al-Sabti and
Metcalfe 1995; Myers and Fournie 2002; Larkin et al. 2003; Au 2004; Bolognesi and Hayashi
2011). Many of these chemicals have been reported nationwide, and interestingly, within the
Great Lakes basin (Kolpin et al. 2002; Klečka et al. 2010). Areas of Concern (AOC) are defined
as “geographic areas that fail to meet the general or specific objectives of the agreement where
such failure has caused or is likely to cause impairment of beneficial use of the area’s ability to
support aquatic life” (International Joint Commission, 1987). The biological use impairment
(BUI) is defined as “a change in the chemical, physical, or biological integrity of the Great Lakes
system sufficient to cause any of the 14 use impairments (International Joint Commission, 1987)
and BUI number 4 is titled “fish tumors or other deformities”. This BUI has been assessed using
a variety of biological markers (biomarkers) of disruption with brown bullhead (Ameiurus
nebulosus) at numerous sites within the Great Lakes basin (Baumann et al. 1990; ; Maccubbin
and Ersing 1991; Blazer et al. 2009a, b; Lauren et al. 2010). A thorough historical review of the
“fish tumors or other deformities” BUI is provided by Rafferty et al. (2009). The compilation of
these data is used to evaluate each AOC and BUI for possible delisting.
The micronucleus assay is an established biomarker for assessing exposure to genotoxic
and mutagenic contaminants (Carrasco et al. 1990; Al-Sabti and Metcalfe 1995). A genotoxic
chemical is defined as causing damage specifically to genetic material (DNA). A mutagenic
chemical is defined as causing changes (generally in genetic material) which can increase the

29
frequency of mutations in an organism. The assay specifically evaluates individual cells for the
presence of micronuclei (MN), or nuclear abnormalities (NA) such as binucleated cells, as well
as lobed, notched or blebbed nuclear membranes. Micronuclei and NA form during the
proliferative phase of the cell cycle. A micronucleus forms during telophase of cell division
when either whole or fragmented chromosomes becomes encapsulated in a nuclear envelope and
assumes the physical properties of an interphase nucleus which is dramatically reduced in size
(Fenech 2000; Polard et al. 2011). This can occur due to either clastogenicity (chromosomal
breaking) or aneugenicity (mitotic spindle dysfunction) resulting from exposure to a genotoxic
contaminant. The exact pathways leading to the induction of NA are less understood, but are
considered to be similar to MN induction. These broadly labeled NA are believed to be
indicators of mutagenic contamination. A variety of chemicals have been linked to MN induction
such as polychlorinated biphenyls (PCB’s), polycyclic aromatic hydrocarbons (PAH’s), heavy
metals and pesticides (Al-Sabti and Metcalfe 1995; Bolognesi and Hayashi 2011). Responses to
genotoxic and mutagenic chemicals is generally fast (<48 hours post-exposure). The sensitivity
of the micronucleus assay to both genotoxic and mutagenic chemicals makes it an ideal
biomarker for exposure to a broad range of chemicals.
The micronucleus assay can be used with a variety of cells within the body. Gill
epithelial cells, hepatic cells, and circulating erythrocytes are among the more commonly used
cell lines. The hepatic MN assay was developed as a biomarker for disruption occurring
specifically within liver tissue (Williams and Metcalfe 1992). The primary limitation of using
hepatic cells is their relatively lower mitotic index as compared to other cells (Schultz et al.
1993). Hayashi et al. (1998) successfully observed MN induced in the gill epithelial cells and
peripheral erythrocytes of various species resulting from exposure to contaminated areas in

30
Japan. The frequency of MN among gill epithelial cells was higher than those observed in
peripheral erythrocytes suggesting that the epithelial cells are more sensitive to the contaminants
present in the waters examined. However, the primary limitation to the use of gill epithelial cells
when conducting the MN assay is that it is a lethal assessment. Peripheral erythrocytes have a
short life span (approximately 50-250 days) and are continually dividing for approximately the
first 7 days following the initiation of erythropoesis (Hunter and Hunter 1957; Fischer et al.
1998; summarized in Soldatov 2005). The continuous division, short life span, and non-lethality
of collection make peripheral erythrocytes an ideal indicator of recent exposure to genotoxic
and/or mutagenic contamination.
Researchers have had mixed results attempting to correlate multiple biomarkers among
sites within the Great Lakes basin (Smith 1990; Folmar et al. 1995). Seasonality has also been
incorporated as a covariate when evaluating multiple biomarkers among sites within the basin
(Iwanowicz et al. 2012). The justification of these correlations is simply that the effects of many
contaminants can be observed with multiple biomarkers (such as the molecular and
histopathological biomarkers mentioned above). Such is the case with chemicals that express
genotoxic and/or mutagenic properties specifically among peripheral erythrocytes and hepatic
tissue. When conducting wild fish assessments, researchers have examined both hepatic tissue
and peripheral erythrocytes to assess the possible genotoxicity and mutagenic contaminants
present (Smith 1990; Gravato and Santos 2002; Viganó et al. 2002). Based on the use of both
biomarkers in wild fish assessments within the literature and with similar causative chemical
contaminants, the MN assay may be used to not only identify genotoxic and mutagenic
contamination, but also to identify possible contamination by chemicals with known affects
within hepatic tissue.

31
Researchers have had varying success correlating seasonality, age, and species to MN
occurrence rates. Wirzinger et al. (2007) observed length-, sex-, and season-dependant results
when evaluating fish exposed to sewage treatment effluent. Males, as well as individuals
captured in mid to late summer, expressed MN at a higher percentage rate than females and
individuals captured in the spring. Rao et al. (1997) observed a positive correlation between MN
expression and age in brown bullhead MN exposed to pulp mill effluent in Lake Ontario,
Canada. Rodriguez-Cea et al. (2003) observed species-dependent results when exposing brown
trout (Salmo trutta), European eel (Anguilla anguilla), and European minnow (Phoxinus
phoxinus) to two pharmaceuticals and cadmium (Cd). The brown trout was the most sensitive
followed by the European minnow and European eel. Salvagni et al. (2010) evaluated
individuals of 4 species (common carp, suckermouthed catfish Hypostomus punctatus, silver
catfish Rhamdia quelen and Nile tilapia Oreochromis niloticus) from 10 sampling locations
along the Lambedor River in Brazil. In this basin, pesticides are believed to be the primary
chemical responsible for the contamination. Micronuclei were observed at all sites; however MN
did occur at differing frequencies among species collected within sites. Interspecies specific
biological and physical parameters must be accounted for when evaluating MN occurrence rates
as a function of environmental contamination.
The MN assay has been used successfully to evaluate chemicals generally attributed to
industrial and agricultural sources. Nepomuceno et al. (1997) observed a positive dose-
dependent relationship between the percent occurrence of MN among peripheral erythrocytes
and differing concentrations of mercury (Hg) in a lab study using common carp (Cyprinus
carpio). Using a 10-fold increase starting at 2 mg Hg/l, statistically significant (0.05 α-level)
differences were observed at 20 and 200 mg Hg/l as compared to control individuals. A similar

32
dose-dependent increase in MN presence in peripheral erythrocyte and gill epithelial cells were
observed and described using Nile tilapia by Ergne et al. (2007). Fish were exposed for varying
lengths of time to water collected from the Berdan River of western Turkey with the objective of
evaluating the genotoxic contamination resulting from heavy metal exposure. The researchers
observed mixed temporal results in MN expression; however a positive correlation was
established along the downstream gradient. This downstream increase was also reported for
many of the water quality parameters attributed to industrial and/or municipal waste. Çavaş
(2008) exposed goldfish (Carassius auratus) to varying concentrations of the industrial
chemicals mercury chloride and lead acetate. They were able to observe a positive dose-
dependent correlation for both contaminants using peripheral erythrocytes. They also evaluated
nuclear budding and observed the same positive dose-dependent correlation as with the MN,
suggesting that NA may possess similar utility to classical MN assays when evaluating genotoxic
substances. Kumar et al. (2010) observed a positive dose-dependent correlation in MN
occurrence rates of Channa punctatus exposed to the insecticide Malathion® [S-(1,2-
dicarboethoxyethyl) O, O-di- methyl phosphorodithioate]. Çavaş (2011) observed a similar dose-
dependent relationship among goldfish exposed to the herbicides atrazine (pure) and Gesaprim®
(containing 500mg/mL atrazine plus other chemical additives). When used to either investigate
specific contaminants or as an instream biomarker, the MN assay has been used successfully in
the laboratory setting as an indicator of genotoxic and mutagenic contamination.
The specific objectives of this thesis were to: 1) Evaluate MN and NA occurrence rates
among 10 sites throughout the Great Lakes basin within each of the 4 possible species sampled;
2) Evaluate MN and NA occurrence rates among 4 possible species sampled within each site; 3)
Evaluate MN and NA occurrence rates among 2 sampling seasons within sites and within
33
species; 4) Evaluate the frequency of occurrence of MN and NA as a function of age to
determine is age is an important covariate explaining MN and NA expression; and 5) Examine
the land use/land cover, point source discharge sites and water and sediment chemistry data for
any possible trends that may exist among MN and/or NA occurrence rates.
Methods
Site Information
All fish were collected from one of eight AOC (2 sites were sampled within the Maumee
River AOC), and one non-AOC site located throughout the Great Lakes Basin in the spring and
fall of 2011 (Figure 1). The specific sites are the lower Genesee River sampled in Rochester,
New York (Rochester Embayment AOC), the Niagara River sampled upstream of Niagara Falls,
New York (Niagara River AOC), the lower Ashtabula River located in Ashtabula, Ohio
(Ashtabula River AOC), Swan creek and Duck/Otter creeks sampled in Toledo, Ohio (Maumee
River AOC), the lower Detroit River sampled south of Detroit, Michigan (Detroit River AOC),
the lower Milwaukee River sampled in Milwaukee, Wisconsin (Milwaukee Estuary), the lower
Fox River sampled in Green Bay, Wisconsin (Lower Fox River/Green Bay AOC), and the lower
Saint Louis River sampled in Duluth, Minnesota (Saint Louis River AOC). Conneaut Creek was
sampled in Conneaut, Ohio and is not listed as an AOC. Conneaut Creek has been used
historically as a reference site, specifically when comparing data from the Ashtabula River (Ohio
EPA 2006). For the purposes of this study however, we did not treat Conneaut Creek as a
reference site as it was not our primary objective to compare AOC’s to a minimally impacted
reference site. Our focus was to examine fish from around the Great Lakes basin for exposure to
genotoxic and mutagenic chemicals.

34
Field Collection
At each site, we focused our collection on 2 species; one higher order, pelagic-oriented
species and one lower order, benthic-oriented species. Based on the species variability among
sites, we chose candidate two species to represent each of the two trophic levels at each site. We
collected either largemouth bass (Micropterus salmoides) or smallmouth bass (Micropterus
dolomieu) as the higher order species. The diets of these species make them ideal indicators of
contamination due to the biomagnification of chemicals as they move up the food chain (Spacie
et al. 1995). We collected either brown bullhead or white sucker (Catostomus commersoni) to
represent the more benthic-oriented species. This life history of both these species results in the
long-term exposure with the benthos (Scott and Crossman 1973). This makes both species ideal
indicators of contamination within the sediment. Approximately twenty fish (preferably 10 males
and 10 females) from each of two species were collected at each site using the collection gears of
electrofishing, minnow traps and/or fyke nets as defined by Murphy and Willis (1996). The
spring sampling occurred from April 12 until June 21, 2011 during the prespawn to spawning
period. The fall sampling occurred on October 4-5, 2011 during the post-spawn period (Table 1).
All fish were anesthetized in a bucket containing 100mg/L tricaine methanesulfonate (MS-222).
Peripheral blood was extracted from the caudal vein using a heparinized syringe and smeared
onto a slide for subsequent micronucleus assays. Otoliths were removed for age determination
analysis.
Preparation and Evaluation of Micronuclei and Nuclear Abnormalities
Blood smears were prepared for all individuals collected by methods described by
Belpaeme et al. (1996). Briefly, peripheral blood was collected from the caudal vein into a
heparinized syringe. One drop was them smeared onto a pre-cleaned glass slide using a spreader
35
slide at an angle and allowed to dry. The smear was fixed with absolute methanol for 10 minutes.
Slides were stained with Giemsa solution (Fluka Analytical, Saint Louis, MO, 1:12:2 (w/w/w) in
glycerol/methanol 5:24 (v/v)) for 45 minutes, followed by two, 45 minute distilled water baths.
Stained slides were cover-slipped and evaluated under light microscopy at 600x magnification. A
minimum of 200 erythrocytes were scored at 5 stratified random locations on each slide such that
a minimum of 1000 erythrocytes were evaluated for abnormalities. The abnormalities were
scored by methods defined by Carrasco et al. (1990). Briefly, a micronucleus is defined as a
round cytoplasmic intrusion having a diameter one-tenth to one-third that of the primary nucleus.
Notched nuclei are defined as clear slits that extends well into the nuclear envelope. Lobed
nuclei are large evaginations of the nuclear envelope that have no clear shape or definition.
Blebbed nuclei are small evaginations of the nuclear envelope that can appear as small tears or
larger structures that resemble a micronucleus, however are attached by a small threadlike stalk.
A binucleated nucleus contains two nuclei that are relatively similar in size and not attached by a
stalk. These abnormalities are represented in Figure 2.
Age Determination
The sagittal otoliths were removed from all bass species collected. Removal begins by
first removing all gill filaments, gill arches, and the soft tissue from the soft pallet on the roof of
the mouth. A lateral cut was then made with bone shears across the anterior section of the
elongated cartilaginous structure located at the base of the brain cavity exposing the pair of
sagittal otoliths embedded within the saccule, each in a membranous capsule generally in the
anterior area of the skull. The lapillus otoliths were removed from all brown bullhead and white
sucker collected. The lapillus otoliths are removed using similar methods described above. First,
all gill filaments were removed along with the gill arches, and the soft tissue from the soft pallet

36
on the roof of the mouth. A lateral cut was then made with bone shears across the center of the
elongated cartilaginous structure located at the base of the brain cavity exposing the pair of
lapillus otoliths from its respective membranous case generally in the posterior area of the skull.
Following extraction, all otoliths were placed in a labeled coin envelope for subsequent
processing and analysis.
Sagittal otoliths were prepared by methods modified from Christensen 1964. Briefly, the
whole otolith was cracked transversely using a scalpel. One side of the cracked otolith was
burned with an alcohol burner (95% ethanol), cooled immediately in distilled water, and read
using a stereoscope. Lapillus otoliths are prepared by methods modified from Koch and Quist
(2007). Whole lapillus otoliths are prepared using a multiple-stage process. First, plastic 2.0-mL
flat-top microcentrifuge tubes (Fisher Scientific, Pittsburgh, PA) have their caps filled with
modeling clay and their tapered ends removed to create a cylinder. Singular lapilli are then
placed into the clay such that the “thumb” of the otoliths is embedded into the clay. The vial is
then filled using the Epoxicure brand of resin and hardener (Buehler Inc., Lake Bluff, IL) and
allowed to harden. The plastic case is then removed and the otoliths sectioned at approximately
0.64 mm thickness using an Isomet low speed saw (Buehler Inc. Lake Bluff, IL). Sections are
then read under transmitted light using a stereoscope by two readers. All age data was collected
in a ‘double blind’ study meaning that both reader’s age estimates were independent of
biological data.
Spatial Analysis
A variety of data from numerous sources was required to spatially evaluate each
sampling site. Hydrologic data was downloaded from the United States Geological Survey’s
National Hydrography Dataset (http://ned.usgs.gov). Elevation data was downloaded from the

37
United States Geological Survey’s National Elevation Dataset at 1 arc-second (approximately 30
meter grid cell) resolution (http://ned.usgs.gov). The 2006 National Land Cover Dataset was
downloaded from the interagency Multi-Resolution Land Characteristics Consortium (MRLC) at
approximately 30 meter grid cell resolution (www.mrlc.gov). Drainage basin and land cover
vector data for Canada was obtained from the Natural Resources Canada using the GeoGratis
portal (http://www.nrcan.gc.ca). State industrial facility information was downloaded from the
United States Environmental Protection Agencies Geospatial Data Download Service
(http://www.epa.gov/enviro/html/frs_demo/geospatial_data/geo_data_state_combined.html).
These data included all of the industrial sites (Classified under the Standard Industrial
Classification (SIC) or the North American Industry Classification System (NAICS) codes).
From these sites, sewerage and landfill facilities were identified. Combined animal feedlot
operation (CAFO, defined as an agricultural operation in which animals are kept and raised in
confined situations per EPA guidelines. http://www.epa.gov/region7/water/cafo/index.htm) were
requested for and provided by each state. Combined sewer overflow (CSO, defined as sewers
that consolidate rainwater runoff, domestic sewage, and industrial wastewater in the same pipe.
http://cfpub.epa.gov/npdes/home.cfm?program_id=5) sites were requested for and provided by
each state.
Basin areas were identified and extracted for the entire Ashtabula, Conneaut, Fox,
Genesee, Maumee, Milwaukee, and Saint Louis River systems. The Detroit and Niagara Rivers
drain Lake Saint Clair and Lake Erie, respectively. For these sites, spatial data are reported only
for the streams that flow directly into the reach on river-right and –left. The raw elevation data
was used to generate flow direction and flow accumulation grids for the full basin areas at
approximately the 1:100,000 scale. Sampling points were recorded and plotted with sampling

38
watersheds created specific for each site. For each sampling watershed, the 2006 NLCD was
reclassified from the classification defined by Fry et al. (2011) into the broad groupings of
‘Developed’ (combined Open Space, Developed - Low Intensity, Developed - Medium Intensity,
and Developed - High Intensity land cover types), ‘Forested’ (combined Deciduous Forest,
Coniferous Forest, and Mixed Forest land cover types), ‘Agriculture’ (combined Pasture/Hay,
and Cultivated Crops land cover types), and ‘Wetlands’ (combined Woody Wetlands, and
Emergent Herbaceous Wetland land cover types). It is important to note that the ‘Open Water’
land cover type has been omitted from these reclassified land cover/land use categories as the
focus was constrained to site-specific basin area land use cover types. For each site, land cover
was evaluated for the entire basin area, as well as the basin area within 1.5 km upstream from the
sampling location. This was performed to examine both the immediate and cumulative potential
for the input of chemicals into the watershed. The land cover for both the Detroit and Niagara
River sites are estimated as land cover data for the Canadian side is assumed to be 100%
agricultural based on the vector dataset used. The 2006 NLCD is available at a much smaller
scale as compared with this dataset. Facility information was identified for each site specific
watershed. Combined animal feedlot operation and CSO sites were identified for all of the site
watersheds (CAFO and CSO data were excluded from the Detroit and Niagara River sites as
these data were not available for Canada).
Chemical Analysis
The USGS Minnesota Water Science Center collected, processed and analyzed water
column and sediment chemistry at many of the same sites and similar times as when the
biological samples were collected during the spring 2011. These chemical results data are

39
published in Lee et al. (In Prep.). A qualitative comparison was conducted examining both the
MN and NA occurrence rates with the water and sediment chemistry data.
Statistical Analysis
The mean MN and NA occurrence rates were compared among sites using an ANOVA.
If a significant result was observed among sites, a Tukey’s honest significant test was performed
to determine which sites were driving the observed differences. The mean MN and NA
occurrence rates were examined during the spring and fall sampling season among species using
an ANOVA. The percentage of individuals expressing MN and NA as a function of age were
evaluated using species-specific linear models. For all applicable tests, significance was
determined at the α = 0.05 level. All statistical analysis was performed using the R statistical
package (R Core Development Team 2012).
Results
Micronucleus Assay
A summary of MN and NA results are summarized in Figures 3 through 10. Micronuclei
and NA were expressed at differing rates within species among sites. At sites in which brown
bullhead were collected during the spring, 35% of the individuals captured in the Genesee River
expressed MN. The Ashtabula, Detroit and Niagara Rivers all expressed MN at a frequency of
approximately 10%, while the Conneaut Creek and combined Duck/Otter Creek sites expressed
MN at 0%. The highest frequency of occurrence of MN (presented as the mean number of
micronuclei observed per 1000 erythrocytes, ‰) was observed in the Genesee River, followed
by the Niagara River. The Detroit and Ashtabula River sites expressed MN at a relatively lower
rate. No site was statistically significantly different, however the Genesee River trended to have
40
a higher MN occurrence rate as compared to the Ashtabula, Conneaut, Detroit, Duck/Otter, and
Niagara sites. Micronuclei were not observed at the Ashtabula River or Conneaut Creek during
the fall sampling.
During the spring sampling season, the highest frequency of occurrence of NA was
observed at the Ashtabula and Detroit Rivers (75% and 50%, respectively). Conneaut Creek and
the Duck/Otter Creek sites expressed NA at 21% and 28%, respectively. The Genesee River
expressed NA at 13%, while no NA was observed at the Niagara River. The highest frequency of
occurrence of NA (‰) was observed in the Detroit and Ashtabula River sites. Nuclear
abnormalities were observed at relatively lower rates at the Genesee, Duck/Otter, and the
Conneaut Creek sites. Nuclear abnormalities were not observed at the Niagara River site.
Nuclear abnormalities were observed at significantly higher rate at the Ashtabula River as
compared to the remaining sites. During the fall sampling season, NA were expressed in 47% of
the brown bullheads collected at the Ashtabula River as compared to 17% of the bullheads
collected at Conneaut Creek. There was a significantly higher occurrence rate observed at the
Ashtabula River as compared to Conneaut Creek.
Among sites where largemouth bass were collected during the spring sampling season, all
sites expressed MN and NA. The Ashtabula and Genesee Rivers expressed MN at approximately
the same frequency (~58%), while the Detroit expressed MN at 45%. The Genesee, Detroit, and
Ashtabula River all expressed MN at approximately the same occurrence rate (~0.9‰). There
was no significant difference in the mean MN occurrence rates among any of the spring sites.
During the fall sampling season, the Ashtabula River expressed MN at a higher frequency as
compared to Conneaut Creek (58% and 11%, respectively). The Ashtabula River also expressed
MN at a significantly higher occurrence rate than Conneaut Creek. The Genesee, Detroit, and
41
Ashtabula River all expressed NA at 100%, as well as at a relatively high occurrence rate
(>30.0‰). There was no significant difference in the mean NA occurrence rates among any of
the spring sites. During the fall sampling season, the Ashtabula River and Conneaut Creek sites
both expressed NA at a relatively high frequency (100% and 84%, respectively). The Ashtabula
River expressed MN at a significantly higher occurrence rate as compared to Conneaut Creek.
Among sites where smallmouth bass were collected, all sites expressed MN and NA. The
Saint Louis and Milwaukee River sites expressed MN at a higher frequency as compared to the
Fox River and the Duck/Otter Creek sites. The Saint Louis and Milwaukee River sites also
expressed MN at a significantly higher occurrence rate as compared to the Fox and Duck/Otter
Creek sites. The Saint Louis, Milwaukee and Duck/Otter Creek sites ass expressed NA at 100%
frequency of occurrence. Forty seven percent of the smallmouth bass collected at the Fox River
expressed NA. The Saint Louis, Milwaukee and Duck/Otter Creek sites expressed NA at a
relatively higher occurrence rate than the Fox River site. The Milwaukee and Duck/Otter sites
expressed NA at a significantly higher rate than the Milwaukee and Saint Louis River sites.
Among sites where white sucker were collected, all sites expressed MN and NA. The
Saint Louis River site had a higher frequency of individuals expressing MN as compared to the
Swan and Milwaukee River sites. The Saint Louis River site also expressed MN at a relatively
higher occurrence rate as compared to the Swan and Milwaukee River sites. There was no
statistically significant difference for mean MN occurrence rates among any of the sites. The
Swan Creek site had a higher frequency of individuals expressing NA as compared to the Saint
Louis and Milwaukee River sites. The Swan Creek site also trended to express NA at a relatively
higher rate than the Saint Louis and Milwaukee River sites; however this trend was not
significant.

42
Micronuclei and NA were differentially expressed among species. For the 3 spring sites
in which brown bullhead and largemouth bass were collected, MN frequency of occurrence rates
were 0.189‰ for brown bullhead and 0.963‰ for largemouth bass. Nuclear abnormality
occurrence rates were 1.594‰ for brown bullhead and 32.724‰ for largemouth bass. For the 2
spring sites in which white sucker and smallmouth bass were collected, MN occurrence rates
were 0.264‰ for white sucker and 3.430‰ for smallmouth bass. Occurrence rates for NA were
0.589‰ for white sucker and 23.923‰ for smallmouth bass. For the 1 spring site in which
brown bullhead and smallmouth bass were collected, MN occurrence rates were 0.000‰ for
brown bullhead and 0.598‰ for smallmouth bass. Nuclear abnormality occurrence rates were
0.532‰ for brown bullhead and 16.077‰ for smallmouth bass. For the 2 fall sites where brown
bullhead and largemouth bass were collected, MN occurrence rates were 0.000‰ for brown
bullhead and 0.576‰ for largemouth bass. Occurrence rates for NA were 0.807‰ for brown
bullhead and 13.706‰ for largemouth bass.
A seasonal comparison was able to be examined for both brown bullheads and
largemouth bass. Brown bullheads were collected at both the Ashtabula River and Conneaut
Creek during the spring and fall of 2011. Largemouth bass only were collected at the Ashtabula
River during both the spring and fall sampling seasons. There was no significant difference in the
mean MN occurrence rate for the 2 sampling seasons. There was however, a significant decrease
in the number of NA observed in the fall sampling as compared to the spring sampling season.
Age Analysis
Age analysis was conducted on a total of 549 individuals collected during the spring and
fall of 2011. Ages are reported in Tables 2 and 3. There was no trend observed among different
sexes collected within species and sites. For sites where brown bullhead were collected, females’

43
ages ranged from 5-7 years ( = 6.62; = 0.21) while males ages ranged from 6-8 ( = 6.68;
= 0.20). The overall age of brown bullhead collected at the Genesee, Ashtabula, Conneaut,
and Niagara River sites was >6 years old. Individuals collected at the Detroit River and
Duck/Otter Creek sites were between 5 and 6 years old. There was no correlation between age
and MN or NA frequency of occurrence (Figures 2 and 3).
Among sites where largemouth bass were collected, females ranged from 5-6 years ( =
6.10; = 0.20), while males ranged from 5-7 years ( = 5.96; = 0.20). There was no
appreciable difference in age among sites. A significant positive correlation was observed for the
frequency of occurrence of MN as a function of age. No trend was observed for NA frequency as
a function of age.
Among sites where smallmouth bass were collected, females ranged from 3-6 years ( =
6.05; = 0.20), while males ranged from 3-9 years ( = 5.76; = 0.28). The age structure
among smallmouth bass collected at the Milwaukee and Saint Louis River sites was similar.
Individuals collected at the Duck/Otter Creek site were considerably younger than those
collected at the other two sites. A positive trend was observed in the frequency of occurrence of
MN as a function of age. This trend was not significant. No trend was observed for NA
frequency as a function of age.
Among sites in which white sucker were collected, females ranged from 6-10 years ( =
8.08; = 0.21), while males ranged from 5-11 years ( = 8.70; = 0.26). Individuals
collected at the Saint Louis and Swan Creek sites ranged from 6.5-9 years while fish collected at
the Milwaukee River were approximately 11 years old. There was a significantly negative
44
correlation in the frequency of occurrence of NA as a function of age. No trend was observed for
MN frequency as a function of age.
Spatial Analysis
Due to the higher likelihood of genotoxic and/or mutagenic chemicals to be introduced
from developed or agricultural land cover classifications, we focused our analysis of these two
land cover types. The following data are summarized from Tables 4 and 5. The combined
developed land use types account for approximately 90% of the total land cover in the combined
Duck/Otter Creek site watersheds. It accounts for over 60% of the total land cover for the Detroit
River site watershed. Approximately 25% of the Swan Creek and Milwaukee River site
watersheds can be categorized as developed. The respective remaining sites have approximately
5-10% of their site watersheds’ land cover defined as developed. When we examine only the
basin area within 1.5 km upstream of our respective sampling sites, the overall percent of land
cover classified as developed generally increases. For example, greater than 70% of the basin
area within 1.5 km of the Ashtabula, Duck/Otter, Milwaukee, Saint Louis and Swan Creek sites
are classified as developed. Greater than 20% of the Conneaut, Fox, and Genesee sites are
classified as developed within 1.5 km upstream of the sampling site. The combined agriculture
use types account for approximately 40-60% of the Ashtabula, Fox, Genesee, Milwaukee,
Niagara, and Swan Creek site watersheds. Approximately 36% of the Conneaut Creek site
watershed is defined as agriculture. Approximately 10% and 5% of the Saint Louis River and
pooled Duck and Otter Creek site watersheds, respectively, are defined as agriculture. When we
constrain our analysis extent to only include the basin area within 1.5 km upstream of our
sampling location, we generally observe a reduction in the percent of the basin area that can be
classified as agricultural. The exceptions are the Duck/Otter and Fox River sites which are

45
observed to have an increase. Greater than 65% of the Fox River within 1.5km of the sampling
location can be classified as agricultural. Between 10% and 15% of the basin area within 1.5 km
of the sampling sites for the Duck/Otter and Genesee River sites are classified as agricultural.
Less than 5% of the remaining sites’ respective basin areas within 1.5km of the sampling sites
are classified as agricultural.
The majority of industrial sites occur within the Fox, Genesee, Milwaukee, and Saint
Louis River site watersheds. The combined sewerage and land fill sites account for
approximately 1-5% of the total industrial sites for nearly all of the respective site watersheds.
Conneaut Creek is the exception with approximately 11% of the total industrial sites defined as
sewerage facilities. Combined animal feedlot operations were only observed within the Genesee,
Fox River, and Milwaukee River site watersheds (88, 39, and 7, respectively). No CAFO’s were
observed in the respective remaining site watersheds. The majority of CSO’s were observed in
the Milwaukee River and Swan Creek watersheds (70 and 21, respectively). Seven CSO’s were
observed in the Genesee River site watershed; while a relatively low number were observed in
the pooled Duck and Otter Creek and Saint Louis River site watersheds (2 and 1, respectively).
There were no CSO’s observed in the Ashtabula, Conneaut Creek, or Fox River site watersheds.
We observed a proportional reduction in the number of industrial discharge, CAFO, and CSO
sites that were observed within 1.5km of the sampling locations based on the reduction in overall
basin area.
Chemical Analysis
Lee et al. (In Prep.) conducted an intensive chemical analysis in both the water column
and sediment at seven of the sites in which biological samples were collected (Tables 6 and 7).
Six of the chemicals sampled have been shown in the literature to induce MN and/or NA

46
expression. These chemicals are Atrazine, Chlorpyrifos, 4-Nonylphenol, Benzo[a]pyrene,
Bisphenol A, and 17β-Estradiol (Çavaş 2011; Ali et al. 2008; Mekkawy et al. 2011; Metcalfe
1988; Bolognesi et al. 2006; and Teles et al. 2006, respectively). For these 6 chemicals, all were
detected in either the water column and/or sediment at all sites (Tables 6 and 7).
Discussion
Micronucleus and Nuclear Abnormality
Micronuclei and/or NA were observed at all the sites we sampled. Most sites did not
express any relative difference in MN and NA expression among species. Among sites where
variability was observed, the species are likely responding to the differing concentrations of
genotoxic and/or mutagenic chemicals present at each site. For example, the Genesee and
Niagara River sites had a relatively high rate on MN expression, but a relatively low rate of NA
expression. This would suggest that the brown bullheads at these sites are responding to a more-
genotoxic rather than mutagenic chemical signal. The same may be true for white suckers
collected at the Saint Louis River site. The higher relative frequency of occurrence of NA among
smallmouth bass at the combined Duck and Otter sites, as well as among white suckers at the
Swan creek site would suggest that these species are responding to a more mutagenic signal at
these sites.
In general, the pelagic-oriented species expressed MN and NA at a higher rate than the
benthic-oriented species collected within the same site. The differential expression among the
four species is likely due to the diverse life histories and physiology among trophic levels
(Mehrle and Mayer 1985). For example, Iwanowicz et al. (2012) observed a higher body burden
of total PCB’s among largemouth bass as compared to brown bullhead. This likely results from

47
the bioaccumulation of residues by higher trophic levels as summarized by Spacie and Hamelink
(1985). This may explain the higher occurrence rates of both MN and NA among the bass
species sampled. Bass are also generally considered to be more active than the benthic-oriented
species. This would suggest that they have a higher daily demand of resources to sustain this life
style. This may enhance the exposure to chemicals from diet. Brown bullhead and white sucker
have relatively small home ranges (Doherty et al. 2004; Sakaris et al. 2005). This would suggest
that (save for the spawning run by white suckers) they both would have a relatively lower
metabolism as compared to the more active bass species. This may also result in lower
proliferative rates among erythrocytes for bullheads and suckers which would lead to a reduced
possibility of induction of abnormalities.
We were able to observe an appreciable seasonal reduction in MN occurrence rates
among brown bullhead and NA occurrence rates among largemouth bass sampled at the
Ashtabula River site during the spring and fall of 2011. For both brown bullhead and largemouth
bass, the MN and NA occurrence rates were generally lower in the fall as compared to the
spring. Similar seasonal results were observed in numerous biomarkers examined by Iwanowicz
et al. (2012). The increase in MN and NA frequency during the spring sampling may be linked to
overall discharge as spring flows are generally higher than fall flows in the Great Lakes drainage.
This may introduce a higher volume of chemicals into the system from the surrounding
landscape. Further research is recommended to increase the sample size of both species before
any far reaching conclusion pertaining to a seasonality affect can be made.
Age
When comparing the percent of individuals at age who expressed MN for fish collected
during the spring, a positive trend was observed among both bass species as age increased

48
(Figure 11a). Among sites where largemouth bass were collected, this trend weakly holds as the
age and MN occurrence rates were as follows: Genesee > Milwaukee > Swan. This trend can be
observed in smallmouth bass as well. Individuals collected at the Duck/Otter Creek site
expressed MN at the smallest frequency and are also younger than the Saint Louis, Fox, and
Milwaukee River sites by almost 2 years. No appreciable trend is observed for brown bullhead or
white sucker (Figure 11b). This was interesting to note as Rao et al. (1997) observed a positive
correlation among MN expression and age in brown bullheads collected from Lake Ontario.
There was no significant trend when NA rate was evaluated as a function of age (Figure 12a, b).
During the fall sampling, a weak positive trend was observed for the percent of largemouth bass
who expressed MN as a function of age, however no trend was observed for brown bullhead. As
there was no significant difference in the mean age among the two sites, age was not considered
a factor in explaining the higher MN expression rates at the Ashtabula River as compared to
Conneaut Creek. No trend was observed in either species when NA were evaluated as a function
of age for the fall. While these trends are interesting, it is noteworthy that little variation was
present within sites. This may confound the analysis as the trends (or lack thereof) may be more
indicative of the overall spread of the data among sites rather than a species-age affect. We
suggest increasing the sample size with a larger age distribution within each site prior to any far
reaching conclusions can be made about a possible age-affect on MN/NA induction.
Spatial and Chemical Site Comparison
In sites where brown bullheads were collected, the Genesee River expressed MN at a
significantly higher rate than the Ashtabula, Conneaut, Detroit, Duck/Otter and Niagara sites.
The Ashtabula and Detroit Rivers expressed NA at significantly higher rates than the Conneaut,
Duck/Otter, Genesee, and Niagara sites. The Genesee River is a fairly large river as compared to
49
the Ashtabula River, Conneaut Creek, and combined Duck and Otter sites. Interestingly, the land
covers are fairly diverse when examined at the basin-wide scale (Table 4). When we examine
only the area within 1.5 km of the sampling sites (as well as the Detroit and Niagara watersheds),
the sites become generally dominated by a combination of developed and agricultural land cover
types. There is an order of magnitude difference in the total number of industrial discharge,
CAFO and CSO sites in the Genesee River as compared to the other 3 sites (Table 5). This
difference is likely correlated to overall basin area. In sites where chemical analysis was
conducted, the chemicals detected are fairly similar as well (no chemical analysis was conducted
on the Conneaut, Duck/Otter or Niagara River sites). There was no observable trend among the 6
chemicals and MN frequency of occurrence rates. Interestingly, a positive trend was observed
among all 6 chemicals and NA frequency of occurrence rates. This trend was strongest for
Atrazine, 4-Nonylphenol and Bisphenol A. No trend was observed among the percent of
individuals expressing MN or NA among the chemicals evaluated.
Largemouth bass generally expressed MN and NA at similar rates across sites. The
Genesee River expressed MN and NA at higher rates than the Ashtabula and Detroit Rivers;
however this trend was not statistically significant. As discussed above, the land use within the
basin areas is similar for the Ashtabula, Detroit and Genesee; and the higher number of industrial
discharge, CAFO and CSO sites is likely due to the larger basin area (Tables 4 and 5). For the 6
chemicals sampled by Lee et al. (In Prep.) that have been shown in the literature to induce MN
discussed above, all are present in either the sediment and/or water (Tables 6 and 7). No clear
trend is observed with majority of the chemicals’ concentration and MN/NA frequency of
occurrence or the MN/NA percent occurrence rates. Interestingly, an inverse relationship was

50
observed for 17β-Estradiol concentration in the sediment and both the frequency of occurrence
and percent of individuals expressing MN and NA.
Smallmouth bass expressed MN at a higher rate at the Milwaukee and Saint Louis Rivers
as compared to the Duck/Otter and Fox River sites. Nuclear abnormality occurrence rates
followed this similar trend with the exception of the Fox site expressing NA at significantly
lower rate than the other three. The Fox River has the largest drainage area as compared to the
Duck/Otter, Milwaukee, and Saint Louis River sites. Approximately 50% of the Fox River basin
area is classified as either agricultural or industrial compared to 15%, 75% and 95% for the Saint
Louis, Milwaukee and Duck/Otter sites, respectively. When we shift our focus to the basin area
1.5 km upstream of the sampling location, the observed trends in MN and NA occurrence rates
follow the percent of the basin area within 1.5 km of the sampling sites that are classified as
developed. It is interesting to note that while the majority of the Fox River basin area within 1.5
km of the sampling site is classified as agricultural, the area is still dominated by a combination
of agricultural and developed land cover types similar to that observed in the other sites. There
are a comparable number of industrial discharge, CAFO, and CSO sites between the Fox,
Milwaukee, and Saint Louis River drainages (Table 5). When comparing the Lee et al. (In Prep.)
chemical data to the MN and NA frequency of occurrence results, there are no observable trends
among the sites for the detectable levels of Atrazine, Chlorpyrifos, and 4-Nonylphenol in the
water column and sediment (again noting that no chemical analysis was conducted at the
Duck/Otter Creek site; Tables 6 and 7). The observed levels of Benzo[a]pyrene and Bisphenol A
follow the trend for MN expression of the Milwaukee > Saint Louis > Fox (Tables 6 and 7). This
trend breaks down slightly for NA frequency of occurrence rates as the Saint Louis River
expressed NA at a slightly higher rate than the Milwaukee (however the relatively low sample

51
size and large standard error at the Saint Louis River suggests that the overall trend may hold if
more fish are analyzed). A weakly positive trend can be observed with the percent of individuals
expressing MN and NA with the concentrations of Atrazine and 4-nonylphenol. No trend is
observed with the remaining 3 chemicals. And inverse trend is observes for the concentration of
17β-Estradiol in the sediment and both the frequency of occurrence and percent of individuals
expressing MN and NA.
White suckers expressed MN at comparable rates among all sites in which they were
collected; however Swan Creek expressed NA at a much higher rate as compared to the
Milwaukee and Fox Rivers. The spatial summaries for Swan Creek and the Milwaukee River are
quite similar (Table 4). The Saint Louis River, however, has a much lower percent of the basin
area land use that can be considered developed or agriculture (Table 4). The total number of
industrial sites does not follow this trend. The Saint Louis and Milwaukee have comparable
numbers of industrial discharge sites (Table 5). The Saint Louis River has the highest reported
numbers of both sewerage and landfill sites. Interestingly, the Milwaukee has the highest number
of CAFO and CSO sites, followed by Swan Creek (as there were no CAFO’s and only 1 CSO
reported in the Saint Louis River). The basin areas within 1.5 km of the sampling sites are
dominated by developed land cover which is possibly the cause of the similar MN expression
rates. All 5 of the chemicals reported in the literature to induce MN and NA that were also
reported by Lee et al. (In Prep.) to be present at the 3 sites (Tables 6 and 7). The overall trend
observed for MN occurrence rates holds for Atrazine, Chlorpyrifos, and 4-Nonylphenol with the
Saint Louis River > Swan Creek > Milwaukee. This trend breaks down for Benzo[a]pyrene,
Bisphenol A, and 17β-Estradiol. A positive trend can be observed for NA occurrence rates to the
reported levels of Benzo[a]pyrene. Interestingly, this is an inverse trend when examining the

52
sediment concentration of 17β-Estradiol. No appreciable trend is observed with the
concentrations of any of the chemicals and the percent occurrence rates of either MN or NA.
Limitations and Future Research
Overall, our research highlights the presence of genotoxic and/or mutagenic
contamination at each of our 10 sites as indicated by MN and NA occurrence rates, respectively.
These data are emphasized by the chemicals observed at each site by Lee et al. (In Prep.). One
limitation of our study is that we constrained our analysis to only the 6 chemicals sampled by
Lee et al. (In Prep.) which have been shown in the literature to induce MN expression. Within
the literature, the effects of these chemicals are evaluated with single-chemical exposures. Based
on the complex interactions between chemicals present in the environment, there is a need for
conclusive analysis on the genotoxic and/or mutagenic potential of chemicals in mixtures. A
second limitation of our study was the inconsistent species abundance and sex ratio at each site
which lead to sub-optimal sample sizes. Accepting these two limitations, we feel as though
valuable information was obtained regarding species, site, and seasonal differences in MN and
NA occurrence rates. Bass generally express MN and NA at a higher frequency and occurrence
as compared to brown bullheads and white suckers. This difference is likely results from the
variable life history among these species leading to variable exposure to genotoxic and
mutagenic chemicals. Future research should exploit this difference to yield greater knowledge
about chemical affects when evaluating a site for potential contamination. Individuals collected
in the spring generally expressed MN and NA at a higher rate than those collected in the fall.
Future research should take into account this seasonal difference as a possible explanatory
variable if differences are observed among sites. We observed a positive trend in MN frequency

53
as a function of age. Future research should take into account this trend when performing site
comparisons among bass species as a possible explanation of observed differences.
The expansive sample-site basin area, combined with the overall number of possible
sources for contamination (point, as well as non-point source pollution) confound any advanced
spatial modeling pertaining to the identification of possible “hot-spots” for MN and/or NA
expression. Overall, however, the level of impairment measured in MN and NA occurrence rates
was generally correlated with the relative percent of the basin area that is classified as either
agricultural or industrial. These data are highlighted when we constrain our analysis to within 1.5
km of the sampling location. Future research should be directed at examining various points
within a drainage basin and along the continuum with the specific objective of identifying the
possible deferential expression of specific biomarkers within a watershed. Based on the chemical
data, a weakly positive trend was observed with the presence of known genotoxic and/or
mutagenic contaminants as a function of MN and NA presence or absence at specific sites. We
suggest future research to continue to investigative the chemical profile (both suspended and in
the sediment) as a function of various biomarkers with the objective of correlating specific
chemicals to a biomarker for disruption

54
Literature Cited
Al-Sabti, K. and C. D. Metcalfe. 1995. Fish Micronuclei for Assessing Genotoxicity in Water.
Mutation Research 343:121-135.
Ali, D., N. S. Nagpure, S. Kumar, R. Kumar, and B. Kushwaha. 2008. Genotoxicity assessment
of acute exposure of chlorpyrifos to freshwater fish Channa punctatus (Bloch) using
micronucleus assay and alkaline single-cell gel electrophoresis. Chemosphere 71:1823-
1831.
Au, D. W. T. 2004. The application of histo-cytopathological biomarkers in marine pollution
monitoring: a review. Marine Pollution Bulletin 48:817-834.
Baumann P.C., J.C. Harshbarger, and K.J. Hartman. 1990. Relationship between liver tumors
and age in brown bullhead populations from two Lake Erie tributaries. The Science of the
Total Environment 94:71–87.
Belpaeme, K., K. Delbeke, L. Zhu, and M. Kirsch-Volders. 1996. Cytogenetic studies of PCB77
on brown trout (Salmo trutta fario) using the micronucleus test and the alkaline comet
assay. Mutagenesis 11:485-492.
Blazer, V. S., S. D. Rafferty, P. C. Baumman, S. B. Smith, and E. C. Obert. 2009a. Assessment
of the “fish tumors or other deformities” beneficial use impairment in brown bullhead
(Ameiurus nebulosus): I. Orocutaneous tumors. Journal of Great Lakes Research 35:517-
526.
Blazer, V. S., S. D. Rafferty, P. C. Baumman, S. B. Smith, and E. C. Obert. 2009b. Assessment
of the “fish tumors or other deformities” beneficial use impairment in brown bullhead
(Ameiurus nebulosus): II. Liver neoplasia. Journal of Great Lakes Research 35:527-537.
Bolognesi, C., and M. Hayashi. 2011. Micronucleus Assay in Aquatic Animals. Mutagenesis
26:205-213.
Carrasco, K. R., K. L. Tilbury, and M. S. Myers. 1990. Assessment of the Piscine Micronuceus
Test as an in situ Biological Indicator of Chemical Contaminants Effects. Canadian
Journal of Fisheries and Aquatic Sciences 47:2123-2136.
Çavaş, T. 2008. In vivo genotoxicity of mercury chloride and lead acetate: Micronucleus test on
acridine orange stained fish cells. Food and Chemical Toxicology 46:352-358.
Çavaş, T. 2011. In vivo genotoxicity evaluation of atrazine and atrazine-based herbicide on fish
Carassius auratus using the micronucleus test and the comet assay. Food and Chemical
Toxicology 49:1431-1435.

55
Christensen, J. M. 1964. Burning of otoliths, a technique for age determination of soles and other
fish. ICES Journal of Marine Sciences 29:73-81
Doherty, C. A., R. A. Currey, and K. R. Munkittrick. 2004. Adult white sucker show limited
mobility near point source discharges in a large Canadian river. In D.L. Borton, T.J. Hall,
R.P. Fisher and J.F. Thomas (eds.), Pulp and Paper Mill Effluent Environmental Fate and
Effects. DEStech Publications, Lancaster, PA. pp. 123-132.
Ergene, S., T. Çavaş, A. Çelik, K. Nurcan, and C. Aymak. 2007. Evaluation of river water
genotoxicity using the piscine micronucleus Test. Environmental and Molecular
Mutagenesis 48:421-429.
Fenech, M. 2000. The in vitro micronucleus technique. Mutation Research 455:81-95.
Fischer, U., M. Ototake, and T. Nakanishi. 1998. Life Span of Circulating Blood Cells in
Ginbuna Crucian Carp (Carassius auratus Langsdorfi). Fish and Shellfish Immunology
8:339-349.
Folmar, L.C., J. Harshbarger, P. C. Baumann, G. Gardner, and S. Bonomelli. 1995. Pathological
and Serum Chemistry Profiles of Brown Bullheads ( Ameiurus nebulosus ) from the
Black River and Old Woman Creek , Ohio. Bulliten of Environmental Contamination and
Toxicology 54:50-59.
Fry, J., G. Xian, S. Jin, J. Dewitz, C. Homer, L. Yang, C. Barnes, N. Herold, and J. Wickham.
2011. Completion of the 2006 National Land Cover Database for the Conterminous
United States. Photogrammetric Engineering & Remote Sensing 77:858-864.
Gravato, C., and M. A. Stanos. 2002. Juvenile Sea Bass Liver Biotransformation and
Erythrocytic Genotoxic Responses to Pulp Mill Contaminants. Ecotoxicology and
Environmental Safety 53:104-112.
Hayashi, M., T. Ueda, K. Uyeno, K. Wada, N. Kinae, K. Saotome, N. Tanaka, A. Takai, Y. F.
Sasaki, N. Asano, T. Sofuni, and Y. Ojima. 1998. Development of genotoxicity assay
systems that use aquatic organisms. Mutation Research 399:125–133.
Hunter, A. S., and F. R. Hunter. 1957. A Comparative Study of Erythrocyte Metabolism. Journal
of Cellular and Comparative Physiology 49:479-502.
International Joint Commission. 1987. Revised Great Lakes Water Quality Agreement of 1978,
as Amended by Protocol, Signed November 18, 1987. Windsor, ON: International Joint
Commission.
Iwanowicz, L. R., V. S. Blazer, N. P. Hitt, S. D. McCormick, D. S. DuVault, and C. A. Ottinger.
2012. Histologic, Immunologic and Endocrine Biomarkers Indicate Contaminant Effects
in Fishes of the Ashtabula River. Ecotoxicology 21:165-182.

56
Klecka, G., C. Persoon, and R. Currie. 2010. Chemicals of Emerging Concern in the Great Lakes
Basin: An Analysis of Environmental Exposures. Edited by David M. Whitacre. Reviews
of Environmental Contamination and Toxicology 207:1-93.
Koch, J. D., and M. C. Quist. 2007. A technique for preparing fin rays and spines for age and
growth analysis. North American Journal of Fisheries Management 27:782-784.
Kolpin, D. W., E. T. Furlong, M. T. Meyer, E. M. Thurman, S. D. Zaugg, L. B. Barber, and H. T.
Buxton HT. 2002. Pharmaceuticals, hormones, and other organic wastewater
contaminants in U.S. streams, 1999– 2000: A national reconnaissance. Environmental
Science and Technology 36:1202– 1211.
Kumar, R., N. S. Nagpure, B. Kushwaha, S. K. Srivastava, and W. S. Lakra. 2010. Investigation
of the genotoxicity of malathion to freshwater teleost fish Channa punctatus (Bloch)
using the micronucleus test and comet assay. Archives of Environmental Contamination
and Toxicology 58:123-130.
Lauren, D. J., D. Hinton, M. Law, M. Sorensen, J. Lyndall, V. Magar, and M. Nielsen. 2010.
Long-Term Trends in liver Neoplasms in Brown Bullhead in the Buffalo RIver, New
York, USA. Environmental Toxicology and Chemistry 29:1748-1754
Larkin, P., Knoebl, I., and N. D. Denslow. 2003. Differential gene expression analysis in fish
exposed to endocrine disrupting compounds. Comparative Biochemistry and Physiology
Part B 136:149-161.
Lee, K. E., Langer, S. K., Menheer, M. A., Foreman, W. T., Furlong, E. T., and Smith, S. G., In
Prep., Chemicals of emerging concern in water and bottom sediment in Great Lakes areas
of concern, 2010 to 2011—Collection methods, analytical methods, quality assurance,
and data: U.S. Geological Survey Data Series 723, 26 p.
Maccubbin A. E., and N. Ersing. 1991. Tumors in fish from the Detroit River. Hydrobiologia
219:301–306.
Mehrle, P. M. and F. L. Mayer. 1985. Biochemistry/Physiology. Pages 264-282 in G. M. Rand
and S. R. Petrocelli editors. Fundamentals of Aquatic Toxicology, Methods and
Applications. Hemisphere Publishing, New York.
Mekkawy, I. A., U. M. Mahmoud, and A. El-Din H. Sayed. 2011. Effects of 4-nonylphenol on
blood cells of the African catfish Clarias gariepinus (Burchell, 1822). Tissue and Cell
43:223-229.
Metcalfe, C. D. 1988. Induction of Micronuclei and Nuclear Abnormalities in the Erythrocytes
of Mudminnows ( Umbra limi ) and Brown Bullheads ( Ictalurus nebulosus ). Bulliten of
Environmental Contamination and Toxicology 40:489-495.
Murphy, B. R., and D. W. Willis, editors. 1996. Fisheries techniques, 2nd edition. American

57
Myers, M. and J. Fournie. 2002. Histopathological Biomarkers as Integrators of Anthropogenic
and Environmental Stressors. Pages 221-287 in S. M. Adams editor. Biological Indicators
of Aquatic Ecosystem Stress. American Fisheries Society, Bethesda, Maryland.
Nepomuceno, J. C., I. Ferrari, M. A. Spanó, and A. J. Centeno. 1997. Detection of micronuclei in
peripheral erythrocytes of Cyprinus carpio exposed to metallic mercury. Environmental
and Molecular Mutagenesis 30:293-297.
NYSDEC. 2011. Environmental Site Remediation Database. New York State Department of
Environmental Conservation, Albany, New York. Available:
http://www.dec.ny.gov/cfmx/extapps/derexternal/index.cfm?pageid=3. (October, 2011).
Ohio EPA, 2006. Biological Study of the Lower Ashtabula River and Conneaut Creek. Ohio
Environmental Protection Agency, Division of Surface Water. Columbus, Ohio,
November 7, 2006. DSW/EAS 2006-6-3.
Polard, T, S. Jean, G. Merlina, C. Laplanche, E. Pinelli, and L. Gauthier. 2011. Giemsa versus
acridine orange staining in the fish micronucleus assay and validation for use in water
quality monitoring. Ecotoxicology and Environmental Safety 74:144-149.
R Development Core Team. 2012. R: A language and environment for statistical computing. R
Foundation for Statistical Computing, Vienna, Austria. ISBN 3-900051-07-0, URL
http://www.R-project.org/.
Rafferty, S. D., V. S. Blazer, A. E. Pinkney, J. L. Grazio, E. C. Obert, and L. Boughton. 2009. A
historical perspective on the “fish tumors or other deformities” beneficial use impairment
at Great Lakes Areas of Concern. Journal of Great Lakes Research 35:496-506.
Rao, S. S., T. Neheli, J. H. Carey, and V. W. Carins. 1997. Fish hepatic micronuclei as an
indication of exposure to genotoxic environmental contaminants. Environmental
Toxicology and Water Quality 12:217-222.
Rodriguez-Cea, A., F. Ayllon, and E. Garcia-Vazquez. 2003. Micronucleus test in freshwater
fish species: an evaluation of its sensitivity for application in field surveys.
Ecotoxicology and Environmental Safety 56:442–448.
Sakaris, P. C., R. V. Jesien, and A. E. Pinkney. 2005. Brown bullhead as an indicator species:
seasonal movement patterns and home ranges within the Anacostia River, Washington,
DC. Transactions of the American Fisheries Society 134:1262-1270.
Salvagni, J. R., Z. Ternus, and A. M. Fuentefria. 2010. Assessment of the genotoxic impact of
pesticides on farming communities in the countryside of Santa Catarina State, Brazil.
Genetics and Molecular Biology 34: 122-126.
Scott, W. B., and E. J. Crossman. 1973. Freshwater fishes of Canada. Fisheries Research Board
of Canada Bulletin 184. University of Toronto Press. Toronto, Ontario.

58
Schultz, R. J., L. A. E. Kaplan, and M. E. Schultz. 1993. Heat induced liver cell proliferation in
the livebearing fish Poeciliopsis. Environmental Biology of Fishes 36:83-91.
Smith, I. R. 1990. Erythrocytic Micronuclei in Wild Fish from Lakes Superior and Ontario that
have Pollution-Associated Neoplasia. Journal of Great Lakes Research 16:139-142.
Soldatov, A. A. 2005. Peculiarities of Organization and Functioning of the Fish Red Blood
System. Journal of Evolutionary Biochemistry and Physiology 41:272-281.
Spacie, A., L. S. McCarty, and G. M. Rand. 1995. Bioaccumulation and bioavailability in
multiphase systems. Pages 493-522 in G. M. Rand editor. Fundamentals of aquatic
toxicology, effects, environmental fate, and risk assessment, second edition. Taylor and
Francis. Philadelphia, Pennsylvania.
Teles, M, M. Pacheco, and M. A. Santos. 2006. Biotransformation, stress and genotoxic effects
of 17beta-estradiol in juvenile sea bass (Dicentrarchus labrax L.). Environment
International 32:470-477.
USEPA. 2010. Facility Registry System State CSV Download File Descriptions: Version 1.1.
U.S. Environmental Protection Agency, Office of Environmental Information, Office of
Information Collection. April, 2010.
Viganó, L., A. Camoirano, A. Izzotti, F. D. Agostini, S. Polesello, C. Francisci, and S. De Flora.
2002. Mutagenicity of sediments along the Po River and genotoxicity biomarkers in fish
from polluted areas. Mutation Research 515:125-134.
Williams, R. C. and C. D. Metcalfe. 1992. Development of an in vivo hepatic micronucleus
assay with rainbow trout. Aquatic Toxicology 23:193–202.
Wirzinger, G., L. Weltje, J. Gercken, and H. Sordyl. 2007. Genotoxic damage in field-collected
three-spined sticklebacks (Gasterosteus aculeatus L.): a suitable biomonitoring tool?
Mutation Research 628:19-30.

59
Tables and Figures
Figure 1. Locations of field sampling sites. Sites are identified from west to east as the: Saint
Louis River, Fox River, Milwaukee River, Swan Creek, Duck/Otter Creek, Detroit River,
Ashtabula River, Conneaut Creek, Niagara River, and Genesee River. The Great Lakes drainage
basin is colored in light gray.

60
Figure 2. Images of erythrocyte abnormalities. Box A. represents a “micronucleus” (Note the
“lobed” nucleus at the bottom of the pane). Box B. represents a “notched” nucleus. Box C.
represents a “lobed” nucleus (Note the “notched” nucleus at the bottom of the pane). Box D.
represents a “blebbed” nucleus. Box E. represents a “binucleated” cell. All pictures were taken at
600x magnification.
A B C
D E

61
Figure 3. Percent of individuals expressing micronuclei for fish collected in the spring, 2011.
Species codes are as follows: BBH = brown bullhead, LMB = largemouth bass, SMB =
smallmouth bass, and WHS = white sucker.
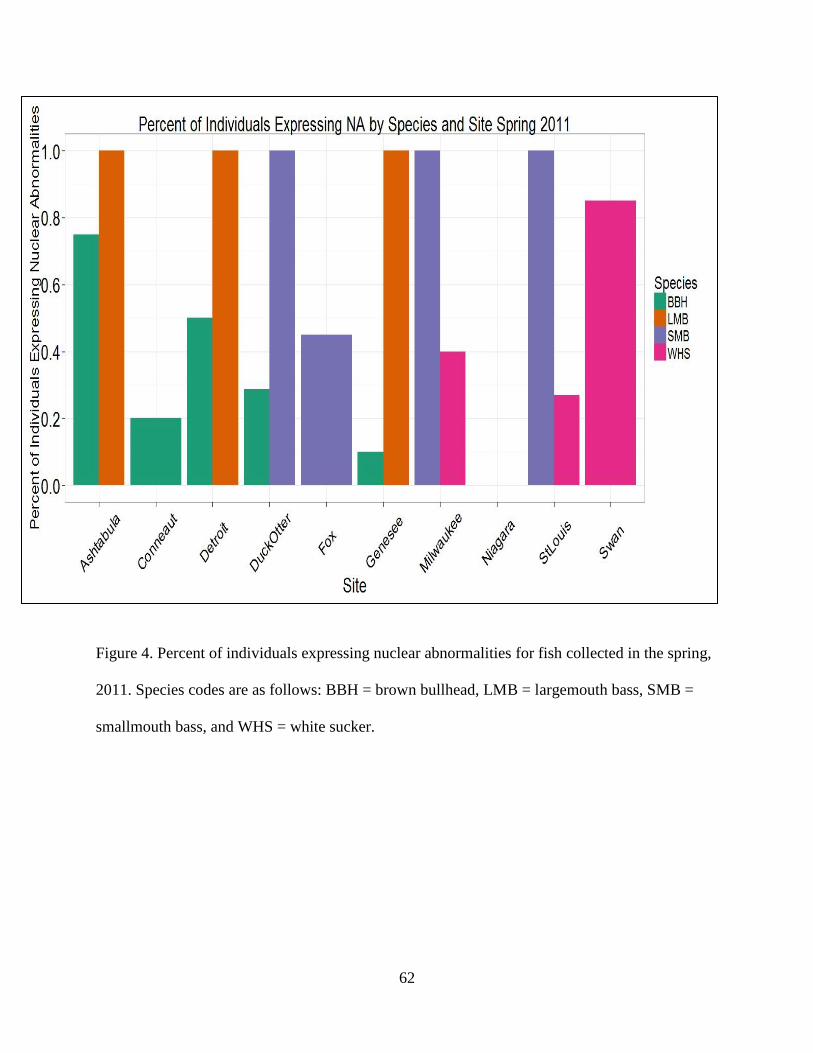
62
Figure 4. Percent of individuals expressing nuclear abnormalities for fish collected in the spring,
2011. Species codes are as follows: BBH = brown bullhead, LMB = largemouth bass, SMB =
smallmouth bass, and WHS = white sucker.

63
Figure 5. Frequency of occurrence of micronuclei for fish collected in the spring, 2011.
Micronuclei are reported as the number of micronucleated cells per 1000 erythrocytes (‰).
Species codes are as follows: BBH = brown bullhead, LMB = largemouth bass, SMB =
smallmouth bass, and WHS = white sucker.

64
Figure 6. Frequency of occurrence of nuclear abnormalities for fish collected in the spring, 2011.
Micronuclei are reported as the number of micronucleated cells per 1000 erythrocytes (‰).
Species codes are as follows: BBH = brown bullhead, LMB = largemouth bass, SMB =
smallmouth bass, and WHS = white sucker.

65
Figure 7. Percent of individuals expressing nuclear abnormalities for fish collected in the fall,
2011. Species codes are as follows: BBH = brown bullhead, LMB = largemouth bass, SMB =
smallmouth bass, and WHS = white sucker.

66
Figure 8. Percent of individuals expressing nuclear abnormalities for fish collected in the fall,
2011. Species codes are as follows: BBH = brown bullhead, LMB = largemouth bass, SMB =
smallmouth bass, and WHS = white sucker.

67
Figure 9. Frequency of occurrence of micronuclei for fish collected in the fall, 2011. Micronuclei
are reported as the number of micronucleated cells per 1000 erythrocytes (‰). Species codes are
as follows: BBH = brown bullhead, LMB = largemouth bass, SMB = smallmouth bass, and
WHS = white sucker.

68
Figure 10. Frequency of occurrence of nuclear abnormalities for fish collected in the fall, 2011.
Micronuclei are reported as the number of micronucleated cells per 1000 erythrocytes (‰).
Species codes are as follows: BBH = brown bullhead, LMB = largemouth bass, SMB =
smallmouth bass, and WHS = white sucker.

69
Figure 11. Percent micronuclei expression by age and species for the spring, 2011. Species codes
are as follows: BBH = brown bullhead, LMB = largemouth bass, SMB = smallmouth bass, and
WHS = white sucker.
B
A

70
Figure 12. Percent nuclear abnormality expression by age and species for the spring, 2011.
Species codes are as follows: BBH = brown bullhead, LMB = largemouth bass, SMB =
smallmouth bass, and WHS = white sucker.
B
A

71
Table 1. Fish collection summary for the spring and fall, 2011. Species codes are as follows:
BBH = brown bullhead, LMB = largemouth bass, SMB = smallmouth bass, and WHS = white
sucker.
SiteID Area Of Concern Name Stream Name Bass
Species
Sampled
Benthic-
Obligate
Species
Sampled
Spring
2011
Fall
2011
GL01 Rochester Embayment Genesee River LMB BBH Y N
GL02 Saint Louis River Saint Louis River SMB WHS N N
GL03 Maumee River Swan Creek NA WHS Y N
GL04 Detroit River Trenton Channel (Detroit River) LMB BBH Y N
GL05 Lower Fox River/Green Bay Fox River SMB NA Y N
GL06 Milwaukee Estuary Milwaukee River SMB WHS Y N
GL07 Ashtabula River Ashtabula River LMB BBH Y Y
GL08 NA Conneaut Creek LMB BBH Y Y
GL09 Maumee River Duck/Otter Creeks SMB BBH Y N
GL10 Niagara River Niagara River NA BBH Y N

72
Table 2. Spring 2011 ageing summary. Mean age by species and site for individuals collected
during the spring 2011 sampling. Species codes are as follows: BBH = brown bullhead, LMB =
largemouth bass, SMB = smallmouth bass, and WHS = white sucker.
Site Species Sex n Mean Age (±SE)
Ashtabula BBH F 8 7.13 (0.48)
BBH M 12 8.08 (0.57)
LMB F 8 6.00 (0.71)
LMB M 12 6.42 (0.38)
Conneaut BBH F 9 7.44 (0.93)
BBH M 10 6.60 (0.60)
LMB F 9 6.56 (0.84)
LMB M 10 5.30 (0.33)
Detroit BBH F 14 5.71 (0.47)
BBH M 6 5.17 (0.17)
LMB F 12 5.00 (0.37)
LMB M 8 5.75 (0.45)
Duck/Otter BBH F 1 5.00 (**)
BBH M 6 5.00 (0.45)
SMB F 5 3.00 (0.00)
SMB M 9 3.78 (0.22)
Fox SMB F 19 5.89 (0.27)
Genesee BBH F 10 7.40 (0.65)
BBH M 7 8.29 (1.27)
LMB F 9 6.44 (0.60)
LMB M 10 6.10 (0.50)
Milwaukee SMB F 10 6.20 (0.42)
SMB M 9 5.56 (0.47)
WHS F 11 10.73 (0.43)
WHS M 6 11.67 (1.26)
Niagara BBH F 18 6.50 (0.29)
BBH M 31 6.26 (0.28)
Saint Louis WHS F 9 7.67 (0.80)
WHS M 38 8.24 (0.43)
SMB F 3 6.67 (2.33)
SMB M 3 9.67 (1.67)
Swan LMB M 1 7.00 (**)
WHS F 10 6.70 (0.70)
WHS M 10 7.20 (0.76)
** Denotes individuals whose SE cannot be calculated due to small sample size.

73
Table 3. Fall 2011 ageing summary. Mean age by species and site for individuals collected
during the fall 2011 sampling. Species codes are as follows: BBH = brown bullhead, LMB =
largemouth bass, SMB = smallmouth bass, and WHS = white sucker.
Site Species Sex n Mean Age (±SE)
Ashtabula BBH F 7 6.86 (0.80)
BBH M 10 6.50 (0.64)
LMB F 10 5.70 (0.50)
LMB M 10 5.30 (0.47)
Conneaut BBH F 10 6.60 (0.45)
BBH M 10 6.80 (0.29)
LMB F 9 6.56 (0.84)
LMB M 10 5.30 (0.33)

74
Table 4. Land cover spatial summary. Data are presented for both the full basin area, as well as
the basin area that drains 1.6 km upstream of the sampling site. Summaries are based on the 2006
National Land Cover Dataset (Fry et al. 2011).
Site Basin Area
(Km2)
Developeda Agriculture
b Forested
c Wetland
d
Ashtabula 337.80 11.73% 41.13% 42.91% 4.23%
Ashtabula
1.6 km
Upstream
11.70 72.58% 2.35% 20.76% 4.31%
Conneaut 471.12 8.45% 36.27% 50.39% 4.89%
Conneaut
1.6 km
Upstream
2.13 44.16% 4.74% 40.05% 11.05%
Detroit
(Estimated) 2197.88 64.30% 28.12% 5.41% 2.18%
Duck/Otter 27.09 90.45% 5.69% 0.57% 3.29%
Duck/Otter
1.6 km
Upstream
5.16 80.34% 15.24% 0.02% 4.40%
Fox 16232.02 8.29% 45.84% 26.62% 19.25%
Fox 1.6 km
Upstream 375.67 21.50% 67.57% 7.37% 3.57%
Genesee 6390.56 6.87% 50.63% 39.01% 3.50%
Genesee 1.6
km
Upstream
3.78 50.08% 12.90% 25.34% 11.69%
Milwaukee 2147.13 26.49% 48.21% 12.54% 12.76%
Milwaukee
1.6 km
Upstream
11.24 100.00% 0.00% 0.00% 0.00%
Niagara
(Estimated) 2263.77 14.84% 64.56% 14.95% 5.66%
Saint Louis 9334.43 3.97% 10.53% 37.79% 47.71%
Saint Louis
1.6 km
Upstream
4.50 92.46% 1.85% 5.53% 0.15%
Swan 467.70 23.62% 56.06% 19.54% 0.78%
Swan 1.6
km
Upstream
8.74 99.57% 0.00% 0.00% 0.43%
a Defined as sum of Developed, Open Space, Developed, Low Intensity, Developed, Medium
Intensity, Developed, High Intensity land cover types.

75
b Defined as sum of Pasture/Hay, and Cultivated Crops land cover types.
c Defined as sum of Deciduous Forest, Coniferous Forest, and Mixed Forest land cover types.
d Defined as sum of Woody Wetlands, and Emergent Herbaceous Wetland land cover types.

76
Table 5. Discharge point spatial summary. Summaries are based on the USEPA Facility Registry
System dataset (USEPA 2010).
Site Total Industrial
Dischargee Sites
Total
Seweragef
Sites
Total Land
Fillsg
Total
CAFOh
Total
CSOi
Ashtabula 79 1 1 0 0
Ashtabula 1.6 km
Upstream
32 1 1 0 0
Conneaut 72 8 0 0 0
Conneaut 1.6 km
Upstream
0 0 0 0 0
Detroit NA NA NA NA NA
Duck/Otter 59 1 3 0 2
Duck/Otter 1.6 km
Upstream
17 0 0 0 0
Fox 1790 72 56 39 0
Fox 1.6 km
Upstream 144 2 4 6 0
Genesee 1427 52 27 88 7
Genesee 1.6
km Upstream
1 0 0 0 0
Milwaukee 1805 15 1 7 70
Milwaukee 1.6 km
Upstream
128 2 0 0 32
Niagara NA NA NA NA NA
Saint Louis 1311 25 23 0 1
Saint Louis 1.6 km
Upstream
45 0 0 0 0
Swan 187 7 1 0 21
Swan 1.6 km
Upstream 42 0 0 0 4
e Defined as having a Standard Industrial Code (SIC) or North American Industry Classification
System (NAICS) code.

77
f Defined as ‘Sewage Treatment Facility’ (NAICS ‘Code_Description’ field name) or ‘Sewerage
Systems’ (SIC ‘Code_Description’ field name).
g Defined as ‘Solid Waste Landfill’ (NAICS ‘Code_Description’ field name) or ‘Refuse System’
(SIC ‘Code_Description’ field name).
h Defined as Confined Animal Feedlot Operation. Data provided by the Indiana Department of
Environmental Management, Ohio Environmental Protection Agency, Michigan Department of
Environmental Quality, Minnesota Pollution Control Agency, New York State Department of
Environmental Conservation, Pennsylvania Department of Environmental Protection, and the
Wisconsin Department of Natural Resources.
I Defined as Combined Sewer Overflow. Data provided by the Indiana Department of
Environmental Management, Ohio Environmental Protection Agency, Michigan Department of
Environmental Quality, Minnesota Pollution Control Agency, New York State Department of
Environmental Conservation, Pennsylvania Department of Environmental Protection, and the
Wisconsin Department of Natural Resources.

78
Table 6. Atrazine, Chlorpyrifos, 4-Nonylphenol, Benzo[a]pyrene, Bisphenol A, and 17-β
Estradiol water chemical summary data for 2011. These data are reproduced in part from Lee et
al. (In Prep.). < denotes less than. E denotes estimated concentration less than laboratory
reporting level.
Site
Atra
zine, w
ater,
un
filtered, reco
vera
ble,
micro
gra
ms p
er liter
Ch
lorp
yrifo
s, water,
un
filtered, reco
vera
ble,
micro
gra
ms p
er liter
4-N
on
ylp
hen
ol (su
m o
f
all iso
mers), w
ater,
un
filtered, reco
vera
ble,
micro
gra
ms p
er liter
Ben
zo[a
]py
rene, w
ater,
un
filtered, reco
vera
ble,
micro
gra
ms p
er liter
Bisp
hen
ol A
, water,
un
filtered, reco
vera
ble,
micro
gra
ms p
er liter
17-b
eta-E
strad
iol, w
ater,
un
filtered, reco
vera
ble,
na
no
gra
ms p
er liter
Ashtabula River (GLRI site1) at
Ashtabula, Ohio 0.0205 <.32 <1.6 0.0094 <.04 <.8
Detroit River (Site 10) Above
Trenton WWTP, Mich. 0.0312 <.32 E.2080 0.0288 0.0902 <.8
Fox River At Oil Tank Depot At
Green Bay, Wisc. 0.0525 <.32 <1.6 0.0148 0.02 <.8
Swan Creek (Site 5) near mouth at
Toledo, OH 0.0828 <.32 <1.6 0.0183 0.0273 <.8
Milwaukee River At St. Paul Ave
At Milwaukee, Wisc. 0.0766 <.32 E.1210 0.0433 0.0762 <.8
Genesee R. Abv. Rattlesnake Pt in
Rochester, NY Site 1 0.0222 <.32 <1.6 <.02 <.04 <.8
St. Louis Bay (Site 1) Near
WLSSD, WWTP, Duluth, Minn <.16 <.32 E.1390 <.02 0.046 <.8

79
Table 7. Atrazine, Chlorpyrifos, 4-Nonylphenol, Benzo[a]pyrene, Bisphenol A, and 17-β
Estradiol sediment chemical summary data for 2011. These data are reproduced in part from Lee
et al. (In Prep.). < denotes less than. E denotes estimated concentration less than laboratory
reporting level.
Site
Atra
zine, so
lids, reco
vera
ble
,
dry
weig
ht, m
icrogra
ms p
er
kilo
gra
m
Ch
lorp
yrifo
s, solid
s,
recovera
ble, d
ry w
eigh
t,
micro
gra
ms p
er k
ilogra
m
4-N
on
ylp
hen
ol (su
m o
f all
isom
ers), solid
s, recovera
ble
,
dry
weig
ht, m
icrogra
ms p
er
kilo
gra
m
Ben
zo[a
]py
rene, so
lids,
recovera
ble, d
ry w
eigh
t,
micro
gra
ms p
er k
ilogra
m
Bisp
hen
ol A
, solid
s,
recovera
ble, d
ry w
eigh
t,
micro
gra
ms p
er k
ilogra
m
17
-beta
-Estra
dio
l, solid
s,
recovera
ble, d
ry w
eigh
t,
micro
gra
ms p
er k
ilogra
m
Ashtabula River (GLRI site1) at
Ashtabula, OH
<295.0000 <147.5000 E269.0000 327 <11.0500 <.2210
Detroit River (Site 4) Near Trenton, MI <104.0000 <52.0000 E379.0000 E3750.000 15.357 0.374
Fox River at Mouth (Site 5), in Green
Bay, WI <327.0000 <163.5000 <2452.500 83.2 19.419 <1.692
Swan Creek (QW Site 11) near Toledo,
OH <108.0000 <54.0000 E663.0000 E2040.000 16.621 0.309
Milwaukee River at WI Ave Bridge,
Milwaukee, WI <115 <57.5 E1200 E1900 88.221 <.503
Genesee R. Abv. Rattlesnake Pt in
Rochester, NY Site 1 <90.0000 <45.0000 E83.8000 E31.2000 <5.6000 <.1120
St. Louis Bay (Site 1) Near WLSSD,
WWTP, Duluth, Minn <179.0000 <89.5000 E2710.000 E601.0000 E47.459 0.438


![Evaluation of physical and mechanical properties of -tri ...scientiairanica.sharif.edu/article_4142_06671d7f7c6dd6c04beabbce… · after healing occurrence [6]. This property imparts](https://img.dokumen.tips/doc/110x75/5fa33372a58826582330d56b/evaluation-of-physical-and-mechanical-properties-of-tri-after-healing-occurrence.jpg)