Embed Size (px)
Citation preview
An Evaluation of Prevailing Wage in Minnesota:
Implementation, Comparability and Outcomes
Lisa M. Jordan, Ph.D. Lead Researcher
Associate Professor and Director, Business and Organizational Leadership
Brevard College
Additional Contributors:
Robert Bruno, Ph.D. Associate Professor University of Illinois
Phil Schrader
Research Assistant University of Minnesota
Tony Sindone, Ph.D.
Indiana University – South Bend
A study funded by the Quality Construction Coalition
October, 2006
1
ABSTRACT This study addresses the four questions posed by the Minnesota Office of the Legislative Auditor regarding the Minnesota Prevailing Wage Act. 1) The survey method that the Department of Labor and Industry currently uses to gather data for determining prevailing wage rates is both valid and reliable. The state makes reasonable efforts to survey all appropriate parties and to ensure that the data is trustworthy. Potential improvements could include clarification of occupational definitions, proactive review of data collected, and increasing response rates through incentives or simplifying processes. 2) Minnesota’s modal method of determining prevailing wage rates is appropriate. A survey of state legislation shows that the majority of states with prevailing wage laws and the federal government apply some form of modal method. Given the segmented nature of the construction industry, the mode is the best measure of prevailing rate because it controls for the lack of homogeneous data. In other words, the mode provides the best measure of area standards considering the nature of the data available. 3) The enforcement of prevailing wage in Minnesota appears to be constrained as it is in many states by a lack of resources. A more effective approach could include more systematic auditing and creating a private right of action. 4) The preponderance of available studies shows that prevailing wage laws do not have a statistically significant impact on the total cost of public construction projects. In other words, prevailing wage does not appear to have any significant impact on the costs of public construction projects. Additionally, an analysis of Minnesota suggests that repealing or weakening the prevailing wage statute would cost the state between $37.8 and $178 million in tax revenues depending on which estimate of wage reduction one uses, and would result in weakening of apprenticeship training programs, an increase in injury rates, a weakening of the position of women and people of color in the construction industry, an increase in project cost overruns, and a reduction in construction employee wages.
2

SUMMARY RESPONSE TO LEGISLATIVE AUDITOR
It is in the public interest that public buildings and other public works be constructed and maintained by the best means and highest quality of labor reasonably available and that persons working on public works be compensated according to the real value of the services they perform.1
Minnesota’s prevailing wage statute provides that contractors must pay construction workers based on area standards when a project is funded by the state. In 1998, a Minnesota Department of Labor and Industry report concluded that:
The evidence…finds that not only is the prevailing wage legislation doing what it was intended to do, but absent such a provision, the effects are harmful to the industry and local economy.2
Our report concurs with this conclusion of the 1998 report, but is intended to provide support for the work of the Minnesota Office of the Legislative Auditor by addressing the specific questions posed.
Based on our review of the literature, as well as our own research, we find the following:
I. The Department of Labor and Industry uses reasonable methods to survey contractors about wages and benefits.
Section Five of the report discusses in detail the reliability and validity of the survey instrument used by the Department. Validity addresses whether or not the survey answers the question intended. Reliability is the degree to which the measurements are consistent and do not contain error. We find that the survey process established by the applicable regulations is structured in such a way as to maximize both of these factors. The state takes reasonable steps to survey all appropriate parties and to ensure that the data is trustworthy. As with all data collection, there may be non-sampling errors, or errors created by either a lack of responses or the reporting of false information. The state currently minimizes the latter both within the collection process and by authorizing a hearing on prevailing wage determinations.
We suggest some minor changes in the process including: clarification of occupational definitions and expectations, proactive review of data collected, and increasing response rates through incentives or simplifying response procedures.
1 Minn. Stat. § 177.41. 2 MN Dep’t of Labor and Industry, Overview of Recent Studies on Prevailing Wage, 13 (1998).
3

II. The Department of Labor and Industry uses appropriate methods to set prevailing wage rates.
The Department of Labor and Industry currently uses the mode as the method of determining the prevailing rate. In order to assess the reasonableness of this method, we considered two factors. First, we analyzed whether the mode is a method that is typically used by other states, and secondly, whether the mode is a good measure of prevailing rate.
Section Four of this report provides summaries of the data we collected on state determinations of prevailing rate. Based on this information, we found the mode to be consistent with the approaches used in a majority of other states.
Section Five offers a detailed analysis of the strengths and weaknesses of a variety of measures for determining prevailing rate, and provides a description of the different measures of central tendency. We find that given the segmented nature of the construction industry, the mode is the best measure of prevailing rate because it controls for the lack of homogeneous data. In other words, given the nature of the data available, the mode provides us with the best measure of area standards.
III. While every state is unique, the Department’s methods are comparable to the way the majority of states determine and administer prevailing rates.
Through our review of state statutes and conversations with state officials, we found that currently the majority of states conduct their own surveys and use some sort of modal rate in order to determine the prevailing rate. Sixteen states have designated the modal rate as the prevailing wage by rule or law, nine states use collectively bargained rates to determine prevailing wage, and five states use federal Davis-Bacon rates either as the primary or secondary prevailing wage determination. Two states let the contracting agency determine the prevailing rate, and one state uses the median. Thus, Minnesota’s method of determining prevailing wage is well within the norm.
IV. The enforcement of prevailing wage in Minnesota is constrained as it is in many states by a lack of resources and proactive auditing.
As in many areas related to the construction industry in general and prevailing wage in particular, there is scant literature that systematically reviews the enforcement of prevailing wage. Moreover, based on our review of the enforcement procedures used, we found that many states had no formal process. Of those that did have procedures few enforced them, and when prevailing wage is enforced it is usually at the request of unions or unionized contractors. Enforcement could be improved in Minnesota by more systematic auditing and creating a private right of action.
4
V. While findings are mixed, most econometric analysis suggests that prevailing wage has no significant impact on total construction project costs.
Section Three provides a discussion of the available literature that considers the relationship between prevailing wage and total costs of construction. Some of the literature discussed is overly simplistic and fails to control for the range of variables that impact costs. Specifically, these studies fail to allow for factor substitution and assume that labor is homogeneous.
Other studies use regression analysis in an attempt to control for the factors other than prevailing wage that might impact total cost. The results of such studies are mixed. Based on our analysis of the available data, the preponderance of the data suggests that prevailing wage has little or no impact on total costs of construction. Data does suggest that when such a program is first introduced there may be a period of adjustment in order to maintain efficiency.
Section Three also offers a discussion of the variety of other impacts a change in prevailing wage might have on the state including:
• A weakening of apprenticeship programs, • A weakening of the position of women and people of color in the
construction industry, • An increase in injury rates, • An increase in project cost over-runs, • A reduction in construction employee wages, and • A reduction in state tax revenues.
VI. An analysis of Minnesota suggests that repealing or weakening the prevailing wage statute would reduce income in the state between $382 million and $1.8 billion annually; thus, costing the state between $37.8 and $178 million in tax revenues depending on which estimate of wage reduction one uses to assess the effects of law changes.
5

SECTION ONE:
INTRODUCTION AND OVERVIEW
Prevailing wage laws have been passed at both the federal and state level3 and are
intended to require construction contractors working on government-funded projects to
pay their workers based on area standards. These laws were passed to maintain
community standards, to promote economic stability and skill development, and to
maintain quality on government projects. While prevailing wage laws share these
common goals, the federal law, known as the Davis-Bacon Act4, and the state statutes,
sometimes called “Little Davis-Bacon” laws, vary widely in the way they are
implemented. Much of this variation has to do with state-specific economic issues and
limitations on data collection. Other variation relates to political realities in the states.
Much of the prevailing wage debate focuses on the costs and benefits to states of
prevailing wage laws. Critics of prevailing wage focus on the increased labor costs
associated with the enforcement of prevailing wage. Advocates acknowledge that labor
costs may be higher where there are prevailing wage regulations, but point out that
project costs are not significantly different due to the higher efficiency of the workforce.
Advocates also argue that prevailing wage laws encourage training, promote higher levels
of safety on the job site, reduce cost over-runs and the costs of future maintenance, and
generate a number of other positive outcomes.
In June of 2006, the Minnesota Office of the Legislative Auditor announced that it
would “examine in detail the methods used by the Department of Labor and Industry to
3 See Section Four, infra, for a list of states with prevailing wage laws. 4 29 U.S.C. §§ 3141-3148.
6

set prevailing wage rates and consider the advantages and disadvantages of alternative
methods.”5 Specifically, the issues the Auditor’s office is evaluating include:
1. Does the Department of Labor and Industry use reasonable methods to survey contractors about wages and benefits?
2. Does the Department of Labor and Industry use appropriate methods to set prevailing wage rates? How do the department’s methods compare with those used by the federal government and other states?
3. How well do state agencies and other governmental units enforce prevailing wage laws?
4. What evidence do existing studies provide about the impact of prevailing wage laws on government costs and revenues and the broader economy?6
This report is intended to provide support for the work of the Legislative Auditor.
This report includes:
• A summary of the history and intent behind the development of prevailing wage laws both at the federal and state levels.
• A review of the literature on the costs and benefits of prevailing wage laws to the state.
• An analysis of how a change in the prevailing wage rate may impact the state of Minnesota.
• A summary of the coverage of and methods used to determine prevailing wage in the 31 states that currently have “Little Davis-Bacon” Acts (along with an Appendix with each state’s regulations).
• A detailed analysis of the procedures and method of determining Minnesota’s prevailing wage.
• A brief discussion of enforcement with an eye toward the standards used in other states.
• Finally, a section that considers economic and other impacts of any potential changes in the prevailing rate.
5 Minnesota Office of the Legislative Auditor, “Prevailing Wages: Evaluation Description,” June 2006. 6 Ibid.
7

SECTION TWO:
HISTORY OF PREVAILING WAGE LEGISLATION Introduction
The history of prevailing wage is useful to understand the intent of the law.
Minnesota passed its Prevailing Wage Act,7 or “Little Davis-Bacon” law, more than
eighty-two years after the initial state prevailing wage law was enacted.8 The state was
the last to embrace the prevailing wage concept. By the late 1970’s forty-two states and
the District of Columbia had adopted a prevailing wage law.
Minnesota’s prevailing wage law represents the apex of America’s development
of a regulatory system addressing worker wages, health and safety, and working hours.
The history of prevailing wage is woven through the record of America’s efforts to
establish wage and hour standards. As the Great Depression challenged the capacity of
the American economy to provide prosperity for all citizens, Republican and Democratic
Party leaders embraced the idea that rather than government “using its massive economic
clout to drive down contract prices and wages whenever it can”9 it would “get out of the
business of cutting the wages of it citizens.”10 It is this still largely held rationale that
initially underscored the bi-partisan Congressional intent of the 1931 construction
industry-oriented Davis-Bacon Act. While the 1931 law and its numerous state versions
have been periodically attacked, the history of paying prevailing wages on eligible
publicly financed construction projects remains a cornerstone of American economic
policy.
7 Minn. Stat. §§ 177.41-177.44. 8 A.J. Thieblot, Jr., The Davis Bacon-Act, (Philadelphia: University of Pennsylvania Press) 1975: 17. 9 Robert S. Goldfarb and John F. Morrall III, “The Davis-Bacon Act: An Appraisal of Recent Studies,” Industrial and Labor Relations Review 34.2 (January, 1981): 193. 10 Peter Philips, “Kentucky’s Prevailing Wage Law: Its History, Purpose and Effect,” (1999) p. 22.
8

State Prevailing Wage Laws: Kansas Goes First
In 1891 Kansas adopted the nation’s first state prevailing wage measure providing
“that not less than the current rate of per diem wages in the locality where the work is
performed shall be paid to laborers, workmen, mechanics and other persons so employed
by or on behalf of the state of Kansas.”11
Once Kansas had acted an alliance of unions, Republicans, Democrats and the
state’s Labor Party passed a wage law in New York (1894). By the third decade of the
Twentieth Century, six additional states had laws governing hours of work and wages on
state and municipal public construction (Oklahoma, 1909; Idaho, 1911; Arizona, 1912;
New Jersey, 1913; Massachusetts, 1914; Nebraska, 1923). Although these state laws
were drafted in somewhat vague terms, they set the stage for a federal prevailing wage
law.12 As the battle over increased government regulation of working hours and pay for
construction workers shifted back to the nation’s capital, proponents and opponents
equally understood the implications: adoption of a national prevailing wage law would
undoubtedly lead to a trend of similar laws in the states.
The Federal Davis-Bacon Act (1931)
Republican Congressman Robert L. Bacon made the first attempt to pass a federal
law in 1927. He claimed that a federal building project in his home state of New York
had been awarded to an Alabama contractor who, because of the low wages paid in
Alabama, brought hundreds of its workers to the work site and still under-bid the higher-
paying local firms. Bacon, a former banker, argued that the enormous potential
11 Hamid Azari-Rad, The Economics of Prevailing Wage Laws, (eds. Hamid Azari-Rad, Peter Philips and Mark J. Prus) (Ashgate: Burlington VT) 2005, pp. 12-13. 12 Peter Philips, et. al, “Losing Ground: Lessons from the Repeal of Nine Little Davis Bacon Acts,” Working Paper, 1995, pp. 2-3.
9

purchasing power of the federal government should not be used to fund projects that
depress a local economy.13 He viewed his measure as a modest attempt to create a
standard floor for wages and benefits on publicly financed construction work: “The least
the federal Government can do is comply with local standards of wages and labor
prevailing in the locality where the building construction is to take place.”14 Despite
attaining a fair degree of bi-partisan support for the bill, hearings on the measure dragged
on for four years. In 1930, Bacon obtained critical support from Republican
Pennsylvania Senator James Davis who had previously served as a U.S. Secretary of
Labor under three Republican administrations.15
The need for this legislation became apparent as the Depression deepened.
President Herbert Hoover had already committed a half billion dollars to public works
programs to stimulate local economies. In many communities, however, the Hoover plan
was thwarted because local officials awarded the contracts to the lowest bidders who very
often chose to “import lower paid workers rather than employing local workers.”16 The
White House was engulfed with citizen complaints following several such incidents, and
Hoover decided to find an efficient way to utilize federal contracts to lift the country’s
staggering economy. At a news conference two days before Christmas, Hoover assured
the reporters that it “is the policy of the government both as to existing contracts and
13 Ibid., pp. 4-5. 14 United States House of Representatives, Hearing before the Committee on Labor on HR 17069, 69th Congress, 2nd Session, p. 2, February 18, 1927. 15 Peter Philips, “Kansas and Prevailing Wage Legislation,” prepared for the Kansas Senate Labor and Industries Committee, February 20, 1998, p. 9. 16 MN Dep’t of Labor and Industry, supra note 2, at i.
10

those to be let that contractors shall keep up wages and pay not less than the prevailing
wage in various districts.”17
In 1931, Robert Bacon’s original version of the Act, now known as the Davis-
Bacon Act, was passed and signed by President Hoover. The law required contractors on
federally funded construction projects to pay the wage rate prevailing in the community
in which the work was performed.18 In 1935, Congress gave the Secretary of Labor the
power to determine the prevailing wage rate.19 Nonetheless, the definition of
“prevailing” and the method by which it should be calculated have been the subject of
debate ever since. The method of calculating the prevailing wage for a locality is not
written into the Davis-Bacon law. Consequently, administrative changes have resulted in
differing federal approaches to calculating prevailing wage.20
The Trend of Adopting Little Davis-Bacon Acts
Following the passage of the Davis-Bacon Act, state governments began to pass
similar legislation applicable to state-funded construction projects. In less than ten years
after the 1931 enactment of Davis-Bacon, seventeen states adopted their own “Little
Davis-Bacon” laws.21 In the 1950s, both federal and state prevailing wage
determinations increasingly reflected local and national trends of including health and
welfare and pension benefits in the total compensation package for construction workers.
In 1964, President Lyndon Johnson signed a new law, H.R. 6041, which “provide[d] that
wage determinations shall, in addition to cash wages, take account of prevailing benefits
17 Herbert Hoover, “The President’s News Conference,” December 23, 1930 (quoted in John Woolley and Gerhard Peters, The American Presidency Project [online], Santa Barbara, CA: University of California (hosted), available at (http://www.presidency.ucsb.edu)). 18 46 Stat. 1494, Ch. 411 (Mar. 3, 1931). 19 49 Stat. 1011, Ch. 825 (Aug. 30, 1935) (amending 40 U.S.C. § 3142). 20 Philips, supra note 12, at 5. 21 Philips, supra note 15, at 16.
11

such as medical and hospital care, pensions and workmen’s compensation,
unemployment insurance, vacations, holidays, and other such factors.”22 By the late
1960’s legislatures in states such as Kentucky were breaking down the prevailing wage as
the sum of the basic hourly rate plus a supplemental hourly contribution to a plan for
“medical, pension, death or injury benefits.”23 Kentucky’s language and the amendments
in other state prevailing laws closely paralleled the Davis-Bacon Act.
In February 1971, the trend of enacting prevailing wage legislation at the state
level got a boost from an unlikely source. In the midst of increasing inflationary
pressures caused by Vietnam War spending and a shortage in skilled trade labor in urban
centers like Chicago and New York, President Richard Nixon temporarily suspended the
Davis-Bacon Act.24 President Nixon argued that the “operation of this law at a time
when construction wages and prices are skyrocketing only gives federal endorsement and
encouragement to severe inflationary pressures.”25
President Nixon’s declaration also cast executive authority over the states’
separate public building wage rate provisions. The President’s order “call[ed] upon states
and other governmental bodies with similar statutes to take similar action.”26 President
Nixon’s call fell on mostly unenthusiastic ears. Ohio Governor John Gilligan ridiculed
the federal suspension as “misdirected, ineffective, and carelessly drafted without any full
22 Lyndon B. Johnson, “Remarks Upon Signing Bill Broadening the Prevailing Wage Section of the Davis-Bacon Act, ” July 2, 1964 (quoted in John Woolley and Gerhard Peters, The American Presidency Project [online], Santa Barbara, CA: University of California (hosted), available at (http://www.presidency.ucsb.edu)). 23 Kentucky State Legislature, Regular Session, 1968, New Laws Page 509, Senate Bill No. 123. 24 See Marc Linder, Wars of Attrition: Vietnam, the Business Roundtable, and the Decline of Construction Unions (Iowa City: Fanpihua Press, 1999). 25 Richard Nixon, “Statement on Suspending Davis-Bacon Act Provisions for Federal Construction Projects,” February 23, 1971 (John Woolley and Gerhard Peters, The American Presidency Project [online], Santa Barbara, CA: University of California (hosted), available at (http://www.presidency.ucsb.edu)). 26 Ibid.
12

consideration of what is really meant.” He also added emphatically that “we are not
going to suspend the provisions of that law in the state of Ohio.”27 New York’s labor
commissioner Louis Levine joined Gilligan in insisting that state law would not be pre-
empted by the federal suspension. After facing hostile state executives, and informed by
legal counsel that the absence of a federal prevailing law did not invalidate the state
statutes, President Nixon relented and reinstated Davis-Bacon 28 days after its
suspension.28
In response to the president’s suspension of federal prevailing wage provisions, a
number of jurisdictions that had relied on the national act decided they needed to pass
their own laws.29 By 1979, 41 states, including Minnesota (1973), had adopted some
form of a prevailing wage law. As the political tides turned in the 1980s, opponents
increasingly raised the traditional arguments against prevailing wage laws: that they
reduced worker productivity, raised the cost of public construction, violated the right of
employers and workers to freely contract, and prevented minority contractors and
workers from finding employment. The debates over the effects of prevailing wage were
familiar, but they were now being argued in a different national political context.
In 1979, Florida became the first state to repeal its prevailing wage law. In 1981,
Utah Senator Orin Hatch raised a challenge to the federal act by holding hearings on
Davis-Bacon’s continuing relevance. While the federal law was not repealed, the
Department of Labor did adjust Davis-Bacon regulations to reduce the applicability of
collectively bargained rates in determining prevailing wage. From 1979 to 1995, eleven
27 Ibid. 28 William G. Whittaker, Congressional Research Service, “The Davis-Bacon Act: Suspension,” 109th Congress, 1st Sess., at 11 (1993). 29 Ibid., at 1-19.
13

states repealed their prevailing wage laws (Florida, Alabama, Arizona, Colorado, Idaho,
Utah, New Hampshire, Kansas, Louisiana, and Oklahoma).30 Eight other states have
never adopted prevailing wage laws (Georgia, Iowa, Mississippi, North Carolina, North
Dakota, South Carolina, South Dakota and Virginia).31
History of Minnesota’s Prevailing Wage Law
On March 7, 1973, Minnesota State Representative Charles Samuelson introduced
House File 134 at a subcommittee session of the Labor Management Relations
Committee. His opening remarks succinctly explained the bill’s genealogy: “House File
134 is patterned after the federal prevailing wage – the so-called Davis-Bacon Act of the
federal government.”32
The need for a state prevailing wage law arose out of the contradiction apparent in
enforcing the Davis-Bacon Act for federally funded construction work in Minnesota, but
permitting the same contractors to work without a wage provision when only state or
local funds were allocated. Representative Samuelson stated that the legislation would
stop the practice of hiring out-of-state workers for a much lower rate by establishing a
“prevailing wage rate for all construction - highway and building construction – in the
state of Minnesota that’s done by the state of Minnesota… What this bill really attempts
to do is to provide a fair bidding, if you would, to projects – state projects within the state
of Minnesota.”33
30 Oklahoma’s law was invalidated by a court decision in 1995. See City of Oklahoma City v. The State of Oklahoma ex rel. Oklahoma Department of Labor, 918 P.2d 26 (Okla. 1995). See also Philips, supra note 15, Table 1 p. 12. 31 Philips, supra note 15, Table 1 at 12. 32 MN Dep’t of Labor and Industry, supra note 2, at iii. 33 Ibid.
14

After passage of the Minnesota Prevailing Wage Act,34 administrative rules were
promulgated in 1977 that defined the classes of labor (i.e., laborers, heavy equipment
operators, truck drivers, and special crafts) covered under the measure. Procedures for
determining the rates for classes were also established. The rules were first amended in
1980 to include, in part, definitions of key terms (i.e. highway/heavy, commercial, project
similar, and residential construction) and to set “time frames for determining wage
rates… [as well as] the applicable wage rates for apprentices.”35 Four years later the
rules were adjusted again. This time the method for collecting data (use of surveys) on
wage rates was defined and “collectively bargained agreements were recognized as a
means of upgrading the rate pending the next survey if the prevailing rate last surveyed
was a collectively bargained rate.”36
Further adjustments to the law’s administrative enforcement machinery continued
in 1988 and 1994. In addition to the ongoing reassessment and refinement of the
applicable regulations, an Advisory Committee was created in 1995 to assist in
administering the Act. The Committee was composed of representatives of union and
non-union contractors, as well as union and government representatives. Following two
years of contested rule-making hearings, new procedures were approved modifying how
the prevailing wage rate would be determined.37
The history of Minnesota’s prevailing wage regulations is much like that of other
states; it is unique to its historical circumstances. Although similar in intent to the federal
Davis-Bacon Act, state laws including Minnesota’s vary widely in means of
34 Minn. Stat. § 177.41-177.44. 35 History of the Prevailing Wage Law, State of Minnesota, Department of Labor and Industry, Labor Standards Division, p. 8. 36 Ibid. 37 Ibid.
15

implementation, including data collection, determination of prevailing wage, coverage,
and enforcement. This is often a result of the political realities in which the legislation
was passed and the negotiated nature of administrative rule-making.
This report attempts to offer both a broad summary of the impact of prevailing
wage and a specific analysis of the Minnesota law, its implementation, and its impact.
16

SECTION THREE:
THE DEBATE SURROUNDING PREVAILING WAGE: IDEOLOGICAL POSITIONING AND EMPIRICAL REALITIES
As indicated in the history section, debates around prevailing wage laws have
gone on as long as the laws have existed. Discussions tend to fall into four categories:
• The broadest asks the fundamental question of whether or not it is appropriate for the government to become involved in regulating the construction market.
• The second examines the costs and benefits to the state of that
involvement.
• The third considers the impact of the laws on the labor market for construction workers.
• The fourth develops the labor market analysis and considers such
questions as the impact of prevailing wage requirements on women and people of color, apprenticeship programs, and health care and pensions.
Not all these questions can be covered in the same depth in a report of this length,
but we attempt to offer at least a summary of the literature available in each area and a
more extensive analysis in those areas that appear to be of primary concern to the
Legislative Auditor.
Generally, supporters of prevailing wage laws argue that they encourage the
development of the economy along a high-skill path and that high skill levels lead to
more productive and cost-effective production. As a result of this, workers can get paid
higher wages while not significantly increasing the cost of public construction. Moreover,
“Little Davis-Bacon Acts” increase the likelihood that public construction projects will
be built by local contractors, thus keeping the money in the state. As a result, the money
spent on public construction projects will have a higher multiplier and more significantly
17

boost local economies and thus the tax base. Proponents also argue that by taking wages
out of competition, you force contractors to compete on the basis of efficiency. Those
contractors will in turn hire the most skilled workers available, thereby reducing the
likelihood of cost over-runs and poor quality and increasing the level of safety and
professionalism on the job.
On the other hand, opponents of prevailing wage legislation argue that such
statutes unnecessarily increase costs and believe that unregulated markets are both more
efficient and fair. Opponents of prevailing wage also argue that the way “prevailing” rate
is determined is biased and unfair. They argue that the nature and extent of surveys is
inappropriate and that fraud often exists in the process. Generally, underlying their
arguments are two assumptions: first, that construction labor is basically homogeneous
and, second, that taxpayers would be better off without prevailing wage regulations.
Industrial Structure, Governmental Bidding, and Efficient Outcomes
In this section of the report, we look first at the characteristics of construction that
call for government involvement and then look more specifically at public construction.
We contend that given the nature of the construction industry in general, and public
contracts in particular, regulation of the market is necessary to insure the most efficient
outcomes.
The role of government intervention is a philosophical question that predates
prevailing wage and ultimately goes to the heart of a fundamental economic debate.
Many who follow a laissez faire understanding of the teachings of Adam Smith believe
that government should be involved in market transactions only in very rare situations.
Other economists believe that because the market is imperfect, it is often not only
18

appropriate but necessary for regulations to be established to support the smooth and
efficient operation of the market.
This debate is clear in the discussion around prevailing wage regulations. On its
website, the Associated Builders and Contractors (“ABC”), a trade organization
comprised largely of non-union contractors, states,
In the 21st Century, especially in the new competitive global economy, it is essential to allow the free market system to determine wages. ABC strongly supports legislation and regulatory efforts designed to limit the negative affects [sic] of the Davis-Bacon Act. ABC will continue to be vigilant, working to prevent any expansion of the Davis-Bacon Act.38
The ABC argues that any involvement of the government will serve to artificially
inflate wage rates and to increase costs to the governmental agency contracting the
project, thus leading to inefficient outcomes in the market.
On the other hand, if one visits the website of the Building and Construction
Trades Department of the AFL-CIO, a union organization, or one of its state affiliates, a
very different picture of prevailing wage is painted.39 Prevailing wage not only increases
living standards, but also leads to higher quality construction, more efficient outcomes
and net benefits for the contracting organizations. Such views are shared by a variety of
unionized contractor organizations such as the Sheet Metal and Air Conditioning
Contractors National Association (SMACNA). For example, in a letter addressed to
United States Senators concerning the reinstitution of prevailing wages in the Gulf Coast
region after Hurricane Katrina, SMACNA states,
SMACNA and our thousands of contractor corporations greatly appreciate that S. 1749/H.R. 3763 recognizes the importance and merit in prevailing
38 Web site of the Associated Builders and Contractors, http://www.abc.org/wmspage.cfm?parm1=2140, accessed August, 2006. 39 See, e.g., Web site of the Minnesota Building and Construction Trades Council, http://www.minnesotabuildingtrades.org/prevailing.html, accessed September, 2006.
19

wages as part of any quality based public procurement policy. Without prevailing wage statutes, the no bid or low bid contractor selection system will erode the wage and fringe benefit standards common in localities across the nation. Hiring firms that do not provide training, health care and wages that prevail in an area only shifts large costs to the already overburdened state and local governments.40
In order to more clearly understand the argument offered by those that support
prevailing wage regulations as a way to correct market failures, one must consider the
structure of the construction industry, the labor market for construction workers, and the
way in which government contracts are bid.
The construction market is exceptionally diverse, ranging from small home
remodeling projects to large highway and building construction projects.41 While the
work of construction tends to be fairly labor intensive, large projects also require
substantial capital investment. As a result, construction firms range in size, level of
expertise, and level of attachment between employers and employees.42 Because of the
segmented nature of the construction market the range of experience and skill within
occupational categories varies widely.43
Moreover, one finds a variety of internal labor markets because of the segmented
nature of the construction market and thus its labor market.44 There is often a weak
attachment between employee and employer because construction workers often move
between employers.45 Thus, while much of construction work is highly skilled, single
40 Web site of Sheet Metal and Air Conditioning Contractors National Association, http://www.smacna.org/pdf/legislative/sample_letter.doc, accessed August 27, 2006. 41 Gerald Finkel, “The American Construction Industry,” in The Economics of Prevailing Wage Laws, eds. Hamid Azari-Rad, Peter Philips, and Mark J. Prus (Ashgate: Burlington VT) 2005, p. 37. 42 Ibid. at 39. 43 See generally Paul Osterman, “An Empirical Study of Labor Market Segmentation,” 28 Industrial and Labor Relations Rev. 508-23 (1975). 44 Finkel, supra note 41, at 37. 45 See generally Richard B. Freeman, “The Effect of Unionism on Worker Attachment to Firms,” NBER Working Paper No. W0400 (July 1980).
20

employers may have little incentive to invest in the training of a worker who is likely to
move on to other employers after a short time. In other words, although construction
firms need highly skilled workers, no single employer has an incentive to invest in the
long-term training of a particular employee because employees often move from
employer to employer. This is what we mean by a market failure.
As a result, multi-employer and joint (union-management) apprenticeship
programs, typically certified by either the federal Bureau of Apprenticeship Training
(BAT) or a State Apprenticeship Commission (SAC) have emerged. In Minnesota, the
Division of Labor Standards and Apprenticeship of the Department of Labor and Industry
oversees apprenticeship.46 This oversight insures the quality of apprenticeship programs
and is an example of government involvement in the construction labor market that has
been deemed necessary by the state in order to insure a consistent supply of skilled labor
and thereby correct a market failure.47 Moreover, as discussed later in this section, the
best performing apprenticeship programs exist where prevailing wage laws are the
strongest.
Similarly, the government has acted to enhance quality in construction by
adopting a lowest responsible bidder requirement. Both Minnesota and the federal
government have guidelines for bidding on projects because public contracts must be
awarded to the lowest responsible bidder.48 The state seeks to protect the quality of
construction even as it awards the contract to the low bidder by clarifying its specific
expectations on public projects; prevailing wage is one such specification. Supporters
46 Minn. Stat. § 178.03. 47 Ibid., Subd. 3. 48 Minn. Stat. § 16C.28 (mandating that contracts be awarded to the lowest responsible bidder, “taking into consideration conformity with the specifications, terms of delivery, the purpose for which the contract is intended, the status and capability of the vendor, and other considerations imposed in the call for bids”).
21

contend that bid specifications such as prevailing wage are necessary in order to assure
that the government receives a good quality product for its investment.49 Thus, paying
prevailing wage is considered to be one example of what it means to be a “responsible”
bidder that assures quality work on a public project.
Charles Groshens, Labor Investigator Supervisor for the Minnesota Department of
Transportation, in discussing this issue said,
At home, I never choose the lowest contract bid. I’m concerned about not only price but quality. At the State, we don’t have that choice so we are careful to specify precisely what we want. The bid request specifies the kind of mud we want on the walls and if they don’t use it, we make them pay. He went on to say that he believes prevailing rate to be the best way to specify the
quality of labor on the job. “We could get cheaper labor, but we would have to be
rebuilding the project in a couple of years.”50
Does Prevailing Wage Increase Quality and Productivity?
Mr. Groshens’ sentiments reflect the stated policy of Minnesota’s prevailing wage
statute that, “it is in the public interest that public buildings and other public works be
constructed and maintained by the best means and highest quality of labor reasonably
available….”51 Mr. Groshens’ anecdotal discussion of prevailing wage also mirrors
traditional economic analysis concerning marginal productivity and efficiency wages.
Efficiency wage theory focuses on the effect of wages on incentives and worker
productivity and suggests that higher than market clearing wages enhance worker
49 See, e.g., Jolie M. Siegel, “Comment: Project Labor Agreements and Competitive Bidding Statutes,” 3 U. Pa. J. Lab. & Emp. L. 295, 310 (2001) (discussing New York’s procurement law and noting that its purposes include “facilitat[ing] the acquisition or construction of high quality goods at the lowest possible cost.”). 50 Charles Groshens, telephone interview with Lisa Jordan, August 15, 2006. 51 Minn. Stat. § 177.41.
22

productivity and increase profits.52 Conversely, if employers pay lower wages they are
likely to get those who do a lower quality of work and have lower productivity. Thus,
establishing a wage rate that is “prevailing” in the market enables the government to
attract workers of at least “prevailing” productivity and training to public projects.
Moreover, paying a wage premium may reduce labor turnover costs, attract a higher
quality work force, reduce shirking and absenteeism by raising the cost to workers of
being fired, and increase worker effort from improved morale.53
Empirical evidence supports this idea. For example, in a 1984 study Allen found
that unionized labor in the construction industry is between 44 and 52 percent more
productive than non-union labor when other variables such as firm size, geographical
differences, education, and age were controlled for.54 While he found that the
productivity differential may be declining over time, he also found that unionized
workforces clearly have economies of scale on large projects such as office buildings
leading to at least 30% greater productivity, though those advantages are not as large on
schools and hospitals (only 0-20%).55 In an analysis of value added per employee in
construction, Walter found that construction productivity was 25% higher in states with
52 For further explanation of efficiency wages and analysis, see George Akerlof, “Gift Exchange and Efficiency-Wage Theory: Four Views,” 74 American Economic Review 79-83 (1984); Alan Krueger and Lawrence Summers, “Efficiency Wages and the Inter-Industry Wage Structure,” 56 Econometrica 259-294 (1988); Kevin Murphy and Robert Topel, “Efficiency Wages Reconsidered: Theory and Evidence,” in Y. Weiss and G. Fishelson. Eds. Advances in the Theory and Measurement of Unemployment, New York: St. Martin’s Press, 1990, pp. 204-240. 53 See Akerlof, supra note 52, at 79. 54 Steven G. Allen, “Unionized Construction Workers Are More Productive,” Quarterly Journal of Economics 99.2 (May, 1984): 251. This study, which assumed that wages for unionized workers were higher than those of their non-union counterparts, provided the clearest analysis of the influence of wages on worker productivity. See also Mark B. Stewart, “Union Wage Differentials, Product Market Influences and the Division of Rents,” Economic Journal, 100.403 (Dec., 1990): 1122-1137. 55 Steven G. Allen, “Can Union Labor Ever Cost Less?” Quarterly Journal of Economics 102.2 (1987): 347-73.
23

prevailing wage than in states without it.56 Finally, Freeman and Medoff found a
productivity advantage for unionized labor when labor-management relationships are
good.57
It is possible that these productivity differences may be due to substitutions of
capital for labor as labor costs rise. However, it is also likely that where prevailing wage
laws exist, employers recruit more highly skilled employees to work on those projects in
order to assure that each worker’s marginal productivity is high enough to meet the
increased marginal cost.
Some recent work by Duncan, Philips, and Prus supports this hypothesis. In their
study of school construction efficiency in British Columbia they used a stochastic frontier
regression to assess the efficiency of the use of inputs in producing outputs. They found
that for the first 17 months after the “fair wage” law went into effect, construction project
outcomes where indeed less efficient. However, after 17 months, any efficiency problems
were resolved. They concluded,
This finding suggests that the wage policy did not alter input utilization of covered projects…. Non-union contractors may have shifted crew mixes toward the use of more productive workers. Or fair wages may have been used as efficiency wages to encourage the productivity needed to offset higher wage rates…regardless of the specific adjustments, we do not find any statistically significant evidence that this legislation was associated with the kind of productivity changes that would decrease output or increase costs.58
Moreover, the research of Philips, et al., shows that prevailing wage improves the
quality of construction. He found that after Utah repealed its prevailing wage law, the
56 Mike Walter, “The Economic Impact of Prevailing Wage Requirements in Minnesota,” Industrial Relations Center of the University of Minnesota, January 1992, p. 10. 57 For a more detailed discussion, see Richard B. Freeman and James L. Medoff, What Do Unions Do? New York: Basic Books Inc., 1984, pp. 162-180. 58 Kevin Duncan, Peter Philips and Mark Prus, “Prevailing wage legislation and public school construction efficiency: a stochastic frontier approach,” 24 Construction Management and Economics 631 (2006).
24

amount of cost over-runs on state road construction tripled in the following decade.59
Belman and Voos note that a variety of researchers have found that low-wage workers in
construction are typically less skilled and thus may not generate savings on projects.60
Of course, not all analysts agree that paying higher wages promotes higher quality
and productivity. For example, Ohio utilized user surveys to assess quality changes after
suspending prevailing wage for school construction. Ohio reported that users saw no
difference in the quality of construction. However, the Ohio study notes that user
analysis of quality may not be a good measure.61 The Kentucky Legislative Research
Commission also found no conclusive evidence that higher wages ensure higher quality
and productivity.62
While higher wages alone may or may not ensure a more productive and skilled
workforce, the state provides an incentive for the contractor to hire the most skilled
workers available by setting wage standards. Given the bidding process in public
construction, it is clearly in the interest of the state and taxpayers to specify the quality of
labor by requiring prevailing wage.
Prevailing Wage and Project Cost
Most discussions of prevailing wage laws, whether in Minnesota or across the
nation, begin with the question of how the law affects construction costs and thus state
budgets. Not surprisingly there are arguments on both sides and outcomes vary
59 Philips et al., supra note 12, at 31. 60 Dale Belman and Paula Voos, “Prevailing Wage Laws in Construction: The Costs of Repeal to Wisconsin,” the Institute for Wisconsin’s Future, October, 1995, p. 12. We know of no empirical research that specifically assesses the relationship between overall quality and prevailing wage. 61 Ohio Legislative Service Commission, “The Effects of the Exemption of School Construction Projects from Ohio’s Prevailing Wage Law,” Staff Research Report No. 149, May 20, 2002, p. 27. 62 Ginny Wilson, Mike Clark, Greg Hager, Cindy Upton, Betty Davis, Barry Boardman and Tom Hewlett, “An Analysis of Kentucky’s Prevailing Wage Laws and Procedures,” Research Report No. 304, Legislative Research Commission, December 2001, p. 52.
25

depending on how empirical studies are specified (what data and variables are used). The
majority of the academic literature finds that while prevailing wage regulations do
increase wages (or the lack of prevailing wage drives wages down), total project costs are
not significantly increased when prevailing wage regulations are in place.
Opponents of prevailing wage, including legislators, employers, and scholars,
have argued that although prevailing wage laws were designed to stabilize local
economies, the laws artificially inflate incomes and place an unnecessary burden upon
contractors and state budgets. Simply put, opponents claim that repealing the law or
changing the way prevailing wage is calculated will result in a significant savings for the
state.
The crux of this argument is that wage rates in states with prevailing wage
requirements are inflated above wage rates in states without prevailing wage laws.
Similarly, wages will be higher in states with stronger prevailing wage laws than in states
with weaker laws.63 Thus, a change from a strong law to a weak law or to no prevailing
wage requirement will result in a drop in wages, thereby reducing the considerable cost
of labor associated with large construction projects. This reduction in labor costs means
cheaper state-funded construction projects and a cost savings when compared to projects
requiring prevailing wages. Within this line of reasoning, if Minnesota changed the
method of calculating prevailing wages from the current modal method to the mean or
weighted average method, construction projects would supposedly cost less and state
budgets would benefit.
63 A.J. Thieblot, “State Prevailing Wage Laws: An Assessment at the Start of 1995,” Associated Builders and Contractors, Inc., Rosslyn, VA., 1995.
26

On the other hand, proponents of prevailing wage laws argue that such an analysis
is simplistic and ignores a range of other factors that ultimately impact total project costs,
state budgets, and the broader economy.64 In their analysis, they consider factors such as
the quality of construction (including the incidence of cost overruns and delays), the
impact on state revenues, the impact on the availability of training, and the cost of
worker’s compensation claims.
A growing body of literature attempts to compare total project costs between
prevailing wage and non-prevailing wage projects. Any such comparison is difficult
because there is a wide range of variables to consider. Results of these studies vary
widely. While some estimate that prevailing wage has no significant impact on total
costs; others estimate that prevailing wage increases cost by up to 35%. The challenge is
to assess which studies most accurately account for the range of variables that may
impact cost and, thus, isolate the impact of prevailing wage.
Studies of the impact of prevailing wage on total costs are generally conducted in
one of three ways:
• The most basic analysis estimates the impact of eliminating prevailing wage laws (or changing the way that prevailing rate is calculated) on labor costs. In these studies, lower wages are simply substituted for higher wages holding all other variables constant.
• Other studies attempt to compare public construction project costs/bids
during a suspension of prevailing wage with costs when the regulations are in force.
64 A non-exhaustive list of these studies includes: Belman and Voos, supra note 60; Minnesota Taxpayers Association, “Prevailing Wage Rates in Minnesota,” February 2005; Jeff Vincent, “Prevailing Wage Reform: Fact vs. Fiction: A Response to Arguments Against Indiana’s Prevailing Wage Law,” March 1987; Michael Kelsay, L. Randall Wray and Kelly Pinkham, “The Adverse Economic Impact from Repeal of the Prevailing Wage Law in Missouri,” January 2004; Peter Philips, “Kentucky’s Prevailing Wage Law: Its History, Purpose and Effect,” October 1999; Walter, supra note 56; Michael Reich, “Prevailing Wage Laws and the California Economy,” February, 1996; Peter Philips, “Delaware’s Prevailing Wage Law: Its History, Purpose and Effect,” May, 1998.
27

• The final approach uses regression analysis to try to control for the impact of a variety of variables while isolating the impact of prevailing wage on total construction costs.
While we will not summarize all the studies in detail here, we will provide
specific examples of each type of analysis and references to other similar studies.
Studies That Assume Lower Wages While Holding All Other Variables Constant
In the first approach, a lower estimate of labor costs is created assuming that
prevailing wage regulations are weakened or repealed. For example, the researcher may
determine what s/he believes would be the wage absent the law. These estimates are then
used to calculate project costs holding all other variables constant. The results of this very
basic type of analysis are generally consistent. Given that these studies assume all other
factors remain constant—including quality of labor, capital/labor ratio, and quality of
construction—they find that the elimination or weakening of prevailing wage will tend to
reduce labor costs per worker hour and thus the total cost of construction. According to a
review by Duncan and Prus, these kinds of studies typically find that Davis-Bacon
increases project costs by 1.5 to 3 percent, though some studies found no increase in total
costs.65
Two such studies have been conducted in Minnesota. The first was completed by
Mike Walter at the University of Minnesota. At the time of his study, the Minnesota
Chapter of the ABC had argued that repealing prevailing wage would save the state
between 10% and 30%. Walter set out to test this hypothesis. First, he compared average
non-union contractor wages with prevailing rate and found them to be 31.7% to 46.3%
65 For a list of studies using this methodology see: Duncan, Kevin and Mark J. Prus, “Prevailing Wage Laws and Construction Costs: Evidence form British Columbia’s Skills Development and Fair Wage Policy,” in The Economics of Prevailing Wage Laws, eds. Hamid Azari-Rad, Peter Philips and Mark J. Prus (Ashgate: Burlington VT) 2005: 126.
28

less. He assumed that on-site labor costs were 27.3% of total costs, basing this
assumption on the 1987 Census of Construction. He also assumed no change in
productivity as wages declined. Given those assumptions, he found a potential maximum
savings of 10.2%.66 Walter then conducted what he called “a more accurate assessment of
the market rate of wages in construction.”67 Using data derived from the Minnesota
Department of Jobs and Training in the last half of 1990 and the first half of 1991, he
found that average hourly wages and benefits for construction workers in Minnesota was
$19.56. He found the weighted average for 17 construction classifications was between
$16.18 and $25.11. He concluded, “The potential savings of repealing the prevailing
wage statute then translate to roughly 6.6% of labor costs…or 1.8% of total costs.”68
The second study was conducted by the Minnesota Taxpayers Association in
2005. This study sought to analyze whether any potential savings would be generated by
changing the method of calculating prevailing wage from the modal method to the federal
Davis-Bacon method69 or the median method utilized by the Minnesota Department of
Employment and Economic Development (“DEED”). The Association collected 2004
data from the Departments of Education and Transportation along with data from the
2002 legislative bonding bill. Based on this data, they found that total project costs
subject to the state’s prevailing wage law totaled $1,707,269,000.70 They then calculated
66 Walter, supra note 56, at 7. 67 Ibid, p. 8. 68 Ibid, p. 9. 69 The federal Davis-Bacon method is outlined in 29 C.F.R. § 1.2(a)(1), which provides that the prevailing wage is the rate paid to a majority of workers in a classification (the mode), or, if no rate is paid to over 50% of the workers, the weighted average of wages paid to employees in the classification. 70 It is unclear from the report whether this is in 2002 or 2004 dollars. For the sake of this analysis, I will assume 2002 dollars. If this is not correct, I will have simply over-estimated the savings.
29

the cost of these projects using the Davis-Bacon rates71 and the median DEED survey
rate. They assumed that up to 45% of total construction costs were labor costs subject to
prevailing wage.72
The authors seemed surprised to find that if the Davis-Bacon rates are used, total
project costs would actually increase somewhere between $3,091,000 and $8,427,000.73
In discussing the potential substitution of Davis-Bacon rates, they concluded that not only
would switching likely cost the state additional money in terms of survey costs, but “that,
while the state would save 1.2% to 1.5% on transportation projects by making the switch,
Minnesota would assume 1.3% to 2.0% higher costs for building projects.”74
Not surprisingly, the Taxpayers Association study found that a switch to the
DEED median would save the state a significant amount of money. As discussed more
fully below, the DEED rate surveys are flawed because they include data on apprentices
and helpers, and include data on anyone that can be called, for example, a carpenter.
Thus, while the current method of prevailing wage calculation excludes apprentices and
helpers, and is likely to capture only journeymen carpenters in the construction industry,
the DEED rate includes both those skilled and unskilled, experienced and not, and those
working in traditional construction jobs, and those who may not be.75 In their analysis,
they did adjust DEED rates to include fringe benefits (22%).
71 This methodology for calculating savings does not allow for input substitution and declining productivity as less skilled workers take the jobs. Based on other empirical analysis, such a methodology significantly overstates any potential savings. 72 Minnesota Taxpayer’s Association, “Prevailing Wage Rates in Minnesota,” February, 2005 www.mnabc.com/pdfs/prevwage.pdf, accessed August 20, 2006, p.6. 73 Ibid., p.11. 74 Ibid. 75 Such problems in the DEED rate make the methodology used in this analysis even weaker because at the lower median rate, based on previous research, skill levels on the job site are likely to fall significantly. Thus, estimated cost savings are likely significantly overstated.
30

Based on the assumptions they made, the Taxpayers Association found that
projects could have been constructed for from 7.4% to 10% less or the state could have
saved between $126,495,000 and $171,120,000. 76 However, given that they grossly
overestimated labor costs as a percentage of total construction costs, their estimates
should likely be cut in half. In order to achieve the 10% savings they suggest, labor costs
would have to drop by 50% and the quality and quantity of labor used would have to
remain constant.
Both the Walter and Taxpayers studies failed to account for the wide range of
variables that impact total cost and assumed labor to be homogeneous, which is clearly
not the case in an industry as segmented as construction.
Studies Evaluating the Impact of Changes in the Law
In the second set of studies the authors take advantage of changes in the law to
estimate the impact of prevailing wage on total construction costs.
In 1975, Thieblot used a one-month suspension of the federal prevailing wage
law to study the potential cost savings of elimination of Davis-Bacon. Thieblot compared
bids on projects that were bid both before and during the suspension and found that
Davis-Bacon increased costs by less than one percent.77 In 1980, two researchers from
the conservative American Enterprise Institute reworked Thieblot’s study attempting to
adjust for inflation and “information changes.” They found that, given the data provided
by the suspension of prevailing rate, we might expect a repeal of Davis-Bacon to save
four to seven percent in total project costs.78
76 See Minnesota Taxpayers Association, supra note 64, at 15. 77 Thieblot, supra note 8. 78 For a discussion of that analysis, see Ohio Legislative Service Commission, supra note 61, at 13.
31

Studies Using Regression Analysis In the third set of studies, researchers use regression analysis to control for the
range of variables that impact total costs by allowing them to isolate the impact of any
given variable. Of course, the variables used in the analysis will impact the outcomes. If
the regression equation is not specified appropriately, then a single variable may serve as
a proxy for others that have been excluded.
Fraundorf, et. al were the first to use regression analysis to try to determine the
impact of prevailing wage on total project costs. Their study examined 215 new non-
residential construction projects in rural areas built in 1977 and 1978 and attempted to
control for the type of project, region and types of building materials. They found that on
federally funded construction projects, total costs were 26.1% percent higher than private
construction projects. They concluded that their results, “clearly show that Davis Bacon
increased costs ….substantially.”79
The results of the study and their conclusions are questionable because the total
cost differential found was greater than the differential between prevailing wage and non-
prevailing wage. Prus and others have commented that the study failed to control for
factors other than prevailing wage that might explain why public sector projects are
generally more expensive than those in the private sector. Given the way the estimation
was specified, it is possible that the prevailing wage variable is serving as a proxy for a
range of other variables that might explain the differences between public and private
construction.
79 Martha Fraundorf, John Farrell, and Robert Mason, “The Effect of the Davis-Bacon Act on Construction Costs in Rural Areas,” The Review of Economics and Statistics 66.1 (Feb. 1984): 143.
32

In his 1996 study, Prus first sought to reproduce the Fraundorf study using data
collected from the F.W. Dodge Corporation. Using a methodology very similar to the
earlier study, he found that, “public projects in states having prevailing wage laws are
27.6% more expensive than private structures.”80 However, as Prus points out, the
methodology Fraundorf and Prus used is incapable of distinguishing between increases in
costs due to prevailing wage and increases due to other differences between public and
private construction.
Prus also reviewed cost differentials on public and private projects in states where
no prevailing wage law exists. He found that publicly financed projects were 31% more
expensive than private projects. This finding raised the question: why are publicly
financed projects more expensive even when no prevailing wage law exists?
Prus offered some ideas but did not test any of them empirically. He did,
however, run a final regression to try to assess the impact of prevailing wage on public
construction costs. In this model he included an interaction variable to control for
prevailing wage. The coefficient on the variable was positive but not statistically
significant. In other words, prevailing wage does not appear to have any significant
impact on the costs of public construction projects. One must look for other explanations
as to why public projects in all states (those with prevailing wage and those without) tend
to be 25.9% higher than comparable private projects.
Prus noted that, “This result lends support to the notion that the public may be
more exacting than the private sector. It also suggests that it is inappropriate to assume
that the higher costs of public projects are attributable to the presence of prevailing wage
80 Mark J. Prus, “The Effect of State Prevailing Wage Laws on Total Construction Costs,” 1996, p. 8, available at www.smacna.org/legislative/effects_davisbacon.pdf.
33

laws.”81 He concluded that, “reforming or repealing these laws will not lead to the kinds
of substantial savings promised by proponents of repeal.”82
In reviewing the Prus study, Kentucky researchers pointed to several variables
that they believe Prus should have included in his study, including type of project.83
However, proxies for these variables are included in the Prus study. The inclusion of
more of these variables would likely strengthen rather than weaken Prus’ fundamental
finding that it is something other than prevailing rate that creates the substantial cost
difference between publicly and privately financed projects.
Only one study that uses regression analysis explicitly considered prevailing wage
in Minnesota. Researchers at the University of Missouri – Kansas City examined twelve
states from the North Central States Region, including Minnesota. Using Dodge Report
Data, they offered both descriptive and econometric analysis of cost differentials. Like
Prus, they found that there is a significant cost difference between public and private
construction whether or not the state has a prevailing wage law. In other words, their
research affirmed the finding that public projects are more expensive than private ones.
However, they also found that if prevailing wage is isolated as an independent variable, it
is not found to be significant in increasing the cost of projects where it exists. Or as they
state, “We conclude that a properly specified model shows that a prevailing wage law
does not have a significant impact on construction costs.”84
81 Ibid., p. 8. 82 Ibid., p. 12. 83 Wilson, et al., supra note 62, at 121. 84 Kelsay, et al., supra note 64, at 27.
34

Studies of Costs on School Construction Projects
Many of the available studies focus on school construction. Such analysis is
interesting because those studies narrow the number of differences in construction
projects by focusing on one sector. Research methodologies and outcomes vary, but
school construction studies generally follow the same broad categories outlined above.
Several of the studies fail to use reliable methodologies, as do some of the studies
described above. The Ohio Legislative Service Commission tried to estimate the savings
created by the suspension of prevailing wage on state school construction projects.85
They sent a survey to contractors asking them a series of questions, including what their
bid price would have been had prevailing wage been in effect.86 While they noted that
this type of data must be used with caution because there is an incentive for non-union
employers to overestimate any savings, the Commission found that statewide savings
ranged from 5 to 9 percent.87
A couple of the available studies simply compared prevailing rates and “market”
rates (however they calculated that) and then determined a savings rate on total
construction costs. For example, Keller and Hartman used Pennsylvania school
construction data in order to estimate the impact of prevailing wage on total construction
costs and, thus, taxes. Using a prevailing rate/private sector wage differential of on
average 16%, they found that prevailing wage increases construction costs 2.25%.88
In a similar study conducted by the Quality Surveyors Society of British
Columbia, the authors concluded that prevailing wages, or what they call in Canada “fair
85 Ohio Legislative Service Commission, supra note 61, at 17. 86 Ibid., p. 18. 87 Ibid., pp. 18-19. 88 Edward C. Keller and William T. Hartman, “Prevailing Wage Rates: The Effects on School Construction Costs, Levels of Taxation, and State Reimbursements,” 27 Journal of Education Finance 713-728 (2001).
35

wage policies,” increase costs. That study was based on 109 provincial construction
projects used rates from the published fair wage schedule and compared them to non-
union rates. Like the Pennsylvania study, their methodology assumed both a
homogeneous labor pool and that labor usage would not change as wages increased.
Based on this analysis, they found no evidence of an increase in costs to taxpayers.89
A number of other studies have compared school construction costs across states
or districts to assess the impact of prevailing wage on total costs. The first of these
compared construction costs per square foot across nine southwestern and intermountain
states, some of which have prevailing wage laws and some of which do not. Using data
on initial bid prices from the F.W. Dodge Corporation, Philips found that for elementary
schools there is a 5% cost savings in states that have prevailing wage laws.90
In a 2001 study that also used Dodge data, but that utilized ordinary least squares
multiple regression analysis, Philips found no statistically significant increase in
construction costs due to prevailing wage in comparing Kentucky, Ohio, and Michigan.
This study is interesting because in the period under consideration the schools in each
state were covered for part of the time by a prevailing wage law and not covered for part
of the time.91
A third study compared school costs across the mid-Atlantic region using Dodge
data. This study used a linear regression model to control variables such as regional
differences, specific nature of construction, and other variables that might affect total
89 Duncan and Prus, supra note 65, at 141-42. 90 Peter Philips, “Square Foot Construction Costs for Newly Constructed State and Local Schools, Offices and Warehouses in Nine Southwestern and Intermountain States 1992-1994,” Prepared for the Legislative Education Study Committee of the New Mexico State Legislature, September 6, 1996. 91 Peter Philips, “A Comparison of Public School Construction Costs in Three Midwestern States that have Changed Their Prevailing Wage Laws in the 1990’s,” February, 2001.
36

costs. Prus found no statistically significant increase in construction costs associated
with prevailing wage.92
In the most substantive study of this type, Azari-Rad, et al., estimated the impact
of state prevailing wage laws on school construction costs. They used state dummy
variables to control for state differentials in cost, and year and unemployment rate
variables to control for economic adjustments. As in the earlier work of Prus (1996), the
authors found a significant cost difference between private and public construction. Like
Prus, they found that the public/private differential exists whether or not the state has a
prevailing wage law. Thus, ultimately they found no statistically significant difference in
the cost of public schools in prevailing versus non-prevailing wage states.93
In another analysis of the impact of prevailing wage on school construction costs,
Azari-Rad, et al., found a 1.8% increase in costs in schools covered by prevailing wage.
However, that result is not statistically significant, and they concluded that the
elimination of prevailing wage regulation in jurisdiction(s) in which they exist will not
yield measurable savings on school construction costs.”94
A number of studies used a data base that allows for consideration of the impact
of the implementation of British Columbia’s Fair Wage Policy. This data is valuable
because it covers schools in a limited geographic area, thereby reducing the number of
variations among projects. This data was first used by Bilginsoy and Philips to estimate
the impact of “fair wage” policies on total cost. Final unit costs did rise 16% after 92 Mark Prus, “Prevailing Wage Laws and School Construction Costs: An Analysis of Public School Construction in Maryland and the Mid Atlantic States,” Prepared for the Prince George’s County Council, Maryland, January 1999. 93 Hamid Azari-Rad, Peter Philips, and Mark J. Prus, “State Prevailing Wage Laws and School Construction Costs,” Industrial Relations 42.3 (2003): 445-457. 94 Hamid Azari-Rad, Peter Philips, and Mark Prus, “Making Hay When it Rains: The Effect Prevailing Wage Regulations, Scale Economics, Seasonal, Cyclical, and Local Business Patterns Have on School Construction Costs,” Journal of Education Finance 27.4 (Spring 2002): 1011.
37

implementation of the policy. However, when factors such as business cycle, number of
competitors, type of school, and time trend were controlled for, “fair wage” policies were
found to have no statistically significant impact on total costs.95
Duncan, et al., have performed several studies using this same data base. Each
examined the question of “fair wage” from a slightly different perspective. In each case,
they found no significant impact of prevailing wage on total costs. Duncan and Prus
considered the public/private cost differential before and after the implementation of the
fair wage policy. By focusing on the differential, many of the exogenous variables that
might impact project cost were controlled for. They used econometric modeling and
controlled for a variety of variables, including project size, type of construction, whether
or not there was a garage and type of heating. They found that the cost differential
remained 40 to 43 percent. In other words, the fair wage policy does not significantly
impact the cost differential between public and private school projects.96 This study is
particularly interesting because it allows us to consider a change in a single area which
controls for regional variation.
In another study, Duncan, Philips and Prus used data from Canada and a
stochastic frontier regression in order to estimate any impact on construction efficiency.
Stochastic frontier regression was designed as a way to measure the efficiency of
producers relative to their production function. In other words, it measures whether the
producer is efficiently using inputs in order to create the output.
Interestingly, in one study they found that public schools are smaller per unit of
cost than private schools, but that differential did not change after the introduction of the
95 Cihan Bilginsoy and Peter Philips, “Prevailing Wage Regulation and School Construction Costs: Evidence From British Columbia,” Journal of Education Finance 25.3 (Winter 2000): 415-431. 96 Duncan and Prus, supra note 65, at 134-35.
38

fair wage policy.97 In a second study, they found a statistically significant short term
negative impact on efficiency after the fair wage policy took effect. However, that
impact disappeared when the policy was expanded. In fact, after 17 months technical
efficiency on covered school projects was greater than non-covered projects. 98 This
seems to support the idea that contractors adjust to changes in wage rates either by
substituting capital for labor or by hiring more productive labor.
We could find no study that utilized regression analysis that found that either
prevailing wage or fair wage policy increased total costs on school construction projects.
However, a study by Dunn, Quigley, and Rosenthal that considered the impact of
prevailing wage on the cost of low-income housing in California found that prevailing
wage had a significant impact on total construction costs.99 They found that the expansion
of prevailing wage to cover low-income housing led to a 9 to 37% increase in housing
construction costs. These results are curious. Given that they assume that labor share of
total construction is in the range of 44%, the prevailing wage/market wage differential
would have to be more than 60% to explain the high end of their estimate. The 9 to 11%
cost reduction seems more probable. A range of questions regarding this study remain.
The law the study analyzes took effect at the end of 2001, but the data used considers
projects built between 1997 and 2002. Thus, before the imposition of the law, it is unclear
which projects, if any, were covered. It is possible that this study factored in other costs
also imposed on this type of project either by federal or state guidelines. It is also
97 Duncan, et al., supra note 58, at 631. 98 Kevin Duncan, Peter Philips and Mark Prus, “Are There Technical Inefficiency Effects of Prevailing Wage Laws? Results from a Stochastic Frontier Estimate of Construction Output,” Working paper available from Kevin Duncan, Hasen School of Business, Colorado State University-Pueblo, Co. 81001. 99 Sarah Dunn, John M. Quigley and Larry A Rosenthal. “The Effects of Prevailing Wage Requirements on the Cost of Low-Income Housing,” Industrial and Labor Relations 59.1 (October, 2005): 141-157.
39

possible that, if we replicated this study now, we would find the same pattern that
Duncan, Philips and Prus find in British Columbia of first decreased and then increased
efficiencies.
Furthermore, it could be the case that low income housing construction is
materially different from school construction such that efficiencies cannot be realized. In
a separate study of low income housing in California (but replicating the analysis of the
first), Newman, Blosser and Haycock came to very similar results estimating that
prevailing wage would likely increase the cost of low income housing construction by
11%.100 Their study raises some of the same questions as the first.
Summary: No Statistically Significant Impact on Total Project Costs
As mentioned earlier, any examination of total construction costs is difficult do
because of the complexity of the analysis, the variety of variables that must be
considered, and the lack of good data. However, the preponderance of the evidence seems
to suggest that prevailing wage has no significant impact on total project cost. Of course,
this is not a unanimous finding.
These studies do leave open the important question of why public projects are
more expensive, whether covered by prevailing wage or not. Clearly, more research is
needed in this area, but the majority of evidence suggests that prevailing wage does not
significantly increase total public construction costs.
If it is true that prevailing wage has no significant impact on total cost, then
weakening or repealing prevailing wage laws clearly will not reduce total costs on state
projects and may actually increase them. In analyzing the cost impact of prevailing
100 Matthew Newman, Shawn Blosser and Hilary Haycock, “Impact of Prevailing Wage Rate Requirements on the Costs of Affordable Housing In California,” Prepared for the California Institute for County Government, June 9, 2004, p. 76.
40
wage, we must also consider other factors in determining whether there are long term
savings to be had from changes in prevailing wage laws.
Other Impacts of Prevailing Wage
While the first question considered in discussing prevailing wage is often, “What
is the impact on project costs?”, it should not be the last question asked. In order to do a
full analysis of the impact of changing or repealing prevailing wage, we must also
consider any impact a change in prevailing wage might have on:
• Construction Worker Wages
• Health Insurance Coverage and Pensions
• Training and Apprenticeship Programs
• Workplace Injuries
• Cost overruns
• Employment of Women and People of Color in the Construction Trades
• State Tax Revenues
While it is beyond the scope of this research to do a complete analysis of each of
these areas, we will present the basic findings as they currently exist in the recent
available research.
Construction Worker Compensation
A number of studies have estimated the impact of prevailing wage on construction
wages and benefits. Most agree that prevailing wage regulations lead to higher levels of
total compensation. Much of the analysis that has been done has examined the impact of
changing or repealing prevailing wage on the level of wages and benefits in a
community.
For example, Philips, et al., conducted a study of nine states that repealed their
“Little Davis-Bacon” laws. Using multivariate regression analysis techniques and data
41

from the 1990 U.S. Census of the Population, the study examined the effect of prevailing
wage legislation on construction worker income while controlling for differences
between individual workers, employment settings, and regions. Prior to repeal, the states
showed an average construction worker income of $24,317. By 1991, when all nine of
the states had repealed their laws, that figure had dropped to $22,482, a difference of
$1,835 or 7.5% (all figures were calculated in 1991 dollars).101 The study also
considered the impact of a shift from a strong to an average or weak law method of
determining prevailing rate (as defined by Theiblot102) and found a likely 8% drop in
construction worker wages.103 Philips, et al., found that this impact spills over to
construction workers on private projects as well.
Kessler and Katz also estimated the impact of state prevailing wage law repeal.
Using Current Population Survey data from 1970-1993, they compared the wages of
construction workers with the wages of other blue collar workers in both prevailing and
non-prevailing wage states. They found that the repeal of prevailing wage has a
significantly negative impact on wage rates of 2 to 4% in construction and that unionized
workers are likely to suffer a significantly larger decline in wages.104
Petersen estimated the impact of prevailing wage on construction worker total
compensation. Using state-level data from 1982-1992, he found that prevailing wage
laws have a significant positive impact on total compensation; in other words, both wages
101 See Michael Reich, “Prevailing Wage Laws in the California Economy,” Institute of Industrial Relations, University of California. February, 1996 (citing Peter Philips, “Results of a Multivariate Regression Analysis of Construction Worker Incomes with a Focus on the Implementation of Prevailing Wage Policies,” Working Paper, Economics Department, University of Utah, 1996). 102 Thieblot, supra note 63. 103 See generally, Philips et al., supra note 12. 104 Daniel P. Kessler and Lawrence Katz, “Prevailing Wage Laws and Construction Labor Markets,” Industrial & Labor Relations Review 54.2 (Jan. 2001): 259-274.
42

and benefits are increased by prevailing wage. He also found that when prevailing wage
laws were repealed there was a significant negative impact on total compensation.105
Petersen and Godtland expanded on this earlier work using data from the 1980s
and 1990s collected from four national databases: Form 5500, the Census of Construction
Industries, the Current Employment Statistics, and the Current Population Survey. In this
study, they assessed the impact of prevailing wage both on overall construction wages
and the share of benefits in compensation packages. Using both a basic cross-tabulation
and a regression analysis that controlled for unionization rate, construction spending, and
percentage of construction spending that was public, they found that prevailing wage has
a significant positive impact on both the level of construction wages and the share of the
compensation package that is benefits. In fact, they found that after repeal, the level of
wages and benefits goes back to a point that exists if there was never a prevailing wage
law at all. This represents an approximately 20% drop in total compensation, including a
61% drop in the share of compensation that represents benefits.106
Perhaps one of the most interesting of the findings from the Petersen and
Godtland study is that the compensation of construction workers in states that have
repealed their laws does not decline immediately when compared to states that have
prevailing wage laws. Rather, the most significant impacts are shown five years after
prevailing wage laws are repealed. Total benefits start to decline three years after
105 Jeffrey S. Petersen, “Health Care and Pension Benefits for Construction Workers: The Role of Prevailing Wage Laws,” Industrial Relations, vol. 39 no. 2 (April 2000): 246-264. 106 Jeffrey S. Petersen and Erin M. Godtland, “Benefits vs. Wages; How Prevailing Wage Laws Affect the Mix and Magnitude of Compensation to Construction Workers,” in the Economics of Prevailing Wage edited by Hamid Azai-Rad, Peter Philips and Mark Prus (Burlington, VT: Ashgate, 2005), p.194.
43

repeal.107 Thus, it appears that any study of the impact of repealing prevailing wage on
aggregate construction worker wages must allow for this lag effect.
This lag effect may explain some of the findings in the Ohio study. Researchers
found no general impact on construction worker wages when Ohio excluded school
projects from coverage under its prevailing wage law, even though wages on school
projects were lower.108 Other research suggests that this may have been due to either the
limited nature of the change in Ohio, the strong economic growth at the time, or an
insufficient time lag between the rule change and the study.
In sum, studies consistently show that prevailing wage statutes increase
construction worker income, including on private projects. While some argue that this
may raise construction costs in the state, it also provides an incentive for workers to
develop construction skills and thus may actually reduce costs in the long run.
Health Insurance and Other Benefits
In their study of the impact of prevailing wage repeal on wages and benefits,
Petersen and Godtland found that prevailing wage laws increase total compensation by
12% and total benefits, as a percentage of compensation, by 61%. Generally, prevailing
wage laws tend to increase the portion of total compensation dedicated to benefits and to
increase significantly the amount of money designated for pensions.109 Moreover, they
found that while the provision of health care benefits dropped 18% in states that never
had prevailing wage laws, in states that repealed their prevailing wage laws the provision
of health care benefits dropped by a stunning 79%.110
107 Ibid., p. 201. 108 Ohio Legislative Service Commission, supra note 61. 109 Petersen and Godtland, supra note 106, at 201. 110 Ibid., at 195.
44

This is most immediately a problem for those employees who have lost their
benefits. However, the socialization of costs is likely to also become a problem for the
community. As Waddoups points out, construction is an industry with a typically low
incidence of employer-based health care due to the nature of the employment relationship
in construction and the often weak attachment between employee and employer. In the
unionized sector, this problem is resolved through the collective bargaining process and
jointly managed health and welfare programs. However, prevailing wage also helps
resolve this problem by taking wages and benefits out of competition and providing
incentives for non-union employers to invest in health insurance.111
Construction workers will continue to need health care even if their employers do
not provide insurance coverage. When the uninsured visit a hospital, that cost must in
some way be covered. Hospitals may increase the prices they charge the insured or if the
hospital is public, it may require increased tax support.112 Thus, costs that were
internalized when prevailing wage was in place become socialized after the repeal of the
law.
Training and Apprenticeship Programs
At their best, apprenticeship programs are intended to produce highly skilled
workers by combining on-the-job training with related classroom instruction. In the
construction industry, the apprenticeship process and its credibility are particularly
important because while a high level of skill is needed, there is a relatively weak
attachment between employer and employee. A single employer has limited incentive to
111 C. Jeffrey Waddoups, “Health Care Subsidies in Construction: Does the Public Sector Subsidize Low Wage Contractors?” in The Economics of Prevailing Wage Laws, eds. Hamid Azari-Rad, Peter Philips and Mark J. Prus (Ashgate: Burlington VT) 2005, p. 198. 112 Ibid., p. 211.
45

train short term employees who will only move on to other employers, resulting in a
market imperfection. Generally, the skills an apprentice gains are “general skills” or
skills that can be moved easily from one project to another. Effective apprenticeship
programs lead to a similarly skilled labor force. This reduces information and search
costs in an industry characterized by a constant flow of workers among projects and
employers.
There are currently about 37,000 registered apprenticeship programs in the United
States.113 These programs are operated by both private and public sponsors, including
employers, employer associations and joint labor/management organizations. The
majority of apprentices are in joint programs (or those co-sponsored by unions and
management), and an overwhelming majority of those who reach journey-level are in
these programs. There are more non-joint programs (or employer only programs), but
these programs tend to be relatively small and have low completion rates.
In his work on the relationship between prevailing wage and apprenticeship
training, Bilginsoy found:
Apprenticeship rates in strong prevailing wage law states are 13 percent higher than in average law states; 61 percent higher than in weak law states; and 82 percent higher than in no-law states. Second, apprenticeship cancellation rates are inversely related to the strength of the prevailing wage law.114
113 Frank Bennici, “The Status of Registered Apprenticeship: An Analysis Using Data from the Registered Apprenticeship Information System,” Prepared for the U.S. Department of Labor’s Office of Apprenticeship Training, Employer and Labor Services, April, 2004, p. 4. 114 Cihan Bilginsoy, “Apprenticeship Training and Prevailing Wage Laws,” Working Paper, February 1996.
46

Moreover, his research finds that completion rates were substantially higher in states with
prevailing wage laws (52% vs. 28%)115 and that it took less time for apprentices to
complete the program in states with a strong prevailing wage law.
The reasons for the relationship between prevailing wage and apprenticeship
training are less clear. Perhaps Thieblot is correct that prevailing wage benefits unionized
workforces,116 and joint-programs are the most effective and efficient in training
apprentices. It may also be the case that more employees are drawn to the industry
because prevailing wage increases wage rates. The relationship may also be driven by
some combination of these two factors.
Indeed, joint programs are more effective and efficient -- joint union-management
programs consistently have much higher rates of enrollment and completion. In his
review of national data, Bilginsoy found the while nationally the average non-joint
program had a completion rate of only 25 percent, joint programs had completion rates of
41 percent.117
A study by the General Accounting Office (“GAO”) came to a very similar
conclusion. They found that while only 30 percent of apprentices in non-joint programs
complete their apprenticeship, fully 47 percent of those in joint programs do. State-based
studies tell a similar story. Those in joint programs are much more likely to finish their
programs.118
While their data for Minnesota was incomplete, the GAO found that 77% of 115 Cihan Bilginsoy, “Wage Regulation and Training: The Impact of State Prevailing Wage Laws on Apprenticeship,” Working Paper No. 2003-08 (May 2003) University of Utah, p. 13. 116 A. J. Thieblot, “Prevailing Wage Laws and Market Recovery Strategies of Construction Unions,” Journal of Labor Research 18.1 (Winter 1997): 31-46. 117 Cihan Bilginsoy, “Apprenticeship Training In the US Construction Industry,” Working Paper, September 1998, p. 13. 118 Government Accounting Office, “Registered Apprenticeship Programs,” Report No. GAO-05-886, August, 2005, p. 17.
47

electrician apprentices in joint programs completed their programs (significantly better
than the national average). In contrast, only 25% of those in non-joint programs
completed. For carpenters, a fairly typical 20% of those in joint programs completed
training while none of those in non-joint programs finished their apprenticeships. For
plumbers, 59% completed their apprenticeships compared to 20% in non-joint
programs.119 Those three programs represent over half of those in apprenticeship
programs.120 The empirical data is clear on this point: there is a strong correlation
nationally between joint employer-union sponsored programs, higher wages, and higher
apprenticeship completion rates. Thus, if Thieblot is correct about the relationship
between prevailing wage laws and unionized workforces, then weakening prevailing
wage121 is also likely to weaken Minnesota’s apprenticeship system.
Further, as any economics text would remind us, a drop in the wages of
construction workers is likely to lead to a shortage of apprentices, depending on the price
elasticity of supply of workers or the responsiveness of worker supply to a change in
wages. Just as we considered the increase in demand for construction workers as a result
of a decrease in wages, supply theory teaches us that labor supply will fall as wages
decline. This is a problem given that the industry is already suffering from high attrition
rates and difficulty attracting new employees.122 Unless the supply of apprentices is
perfectly inelastic (or the wage does not impact whether or not one wants to be an
119 Ibid., p. 30. 120 These numbers are lower than those actually reported by the joint programs. In Minnesota, the completion rate for plumbers in joint programs is report to be nearly 95 percent and for electricians, completion rates are report to be nearly 95%. Of course, it is typical to have higher completion rates in the licensed trades. But in the non-licensed crafts, our completion rates seem to exceed national averages. For example the joint carpenters apprenticeship program reports a better than 50% completion rate. 121 An outcome he advocates. 122 Bilginsoy, supra note 117, at 22.
48
apprentice), the reduction in wage rates will decrease the number of those who want to be
apprentices.123
There are no good studies in the United States that tell us what apprentices do if
they quit their apprenticeships, and little data is available on point. Doubtless, apprentices
consider expected financial returns in making such a decision. An apprentice may leave
to take another job. It may be that s/he is dissatisfied with the training s/he is receiving, or
it may be that those in joint programs have a stronger incentive to complete training
because it is a prerequisite to the economic benefits of union membership. In either case,
if apprenticeship programs are weakened, we will likely reduce the quality of our
construction workforce over time. If the state’s goal is to increase the number of highly
skilled workers, the evidence suggests that prevailing wage creates a set of market
incentives that do just that. Higher wages lead to a larger and more skilled pool of
apprentices, and joint programs lead to higher completion rates.
Employment of Women and People of Color
A frequent allegation by opponents of prevailing wage is that it discriminates
against women and people of color.124 On the other hand, proponents see no
discriminatory intent or impact of Davis-Bacon and none for the “Little Davis-Bacon”
123 For a more detailed discussion of the relationship between prevailing wage, unions and apprenticeship programs, see Bilginsoy, supra note 115; Peter Philips, “Delaware’s Prevailing Wage Law: Its History, Purpose and Effect,” May, 1998. 124 For more on this issue see: A.J. Thieblot, “Prevailing Wage Laws and Black Employment in the Construction Industry,” Journal of Labor Research 20.1 (Winter 1999): 155-159; A.J. Thieblot, “Race and Prevailing Wage Laws in the Construction Industry: Reply to Azari-Rad and Philips,” Journal of Labor Research 24.1 (Winter 2003): 169-177; United States Senate Republican Policy Committee, “A Bad Law in Need of Repeal: The History and Economics of Davis-Bacon,” (September 18, 2002).
49

Acts. In fact, proponents argue prevailing wage laws actually have positive impacts for
women and people of color.125
It is true that some empirical research shows that in states that have stronger
prevailing wage laws there are fewer people of color in the trades. However, if one
controls for the share of minorities in a particular state’s labor force, there is no evidence
that prevailing wage reduces the number of minority workers in construction
employment.126
We know of no evidence that looks specifically at the impact of prevailing wage
on female employment in the construction trades. However, Berik and Bilginsoy found
that women fare better in jointly sponsored apprenticeship programs and are more likely
to complete programs.127 In any case, the evidence regarding women in the construction
trades is dismal. Only 1.8% of those in non-joint programs are women, while joint
programs do slightly better at 4.5%.128
We know of no empirical research that specifically considers the impact of wage
rate changes on the apprenticeship completion rates of women in the trades, but there is
significant anecdotal evidence. Often, when a woman enters the trades, she is older and
more likely to have a family that she is supporting. A significant barrier to entry and
completion is often reported to be wage rates. If a weakening of prevailing wage laws
125 For more on this issue see: Hamid Azari-Rad and Peter Philips, “Thoughtless Think Tanks: Sound Bite Thinking about the History and Intent of Prevailing Wage Laws,” in The Economics of Prevailing Wage Laws, eds. Hamid Azari-Rad, Peter Philips and Mark J. Prus (Ashgate: Burlington VT) 2005, p. 64-100; Dale Belman, “Prevailing Wage Laws, Unions, and Minority Employment in Construction” in The Economics of Prevailing Wage Laws, eds. Hamid Azari-Rad, Peter Philips and Mark J. Prus (Ashgate: Burlington VT) 2005, p. 101-119. 126 Belman, supra note 125, at 104, 116, 117. 127 Gunseli Berik and Cihan Bilginsoy, “Still a Wedge in the Door: Women Training for the Construction Trades in the U.S.,” Working Paper Presented at the Eastern Economic Association Conference, March 2005: 2005-05. 128 Cihan Bilginsoy, “The Hazards of Training: Attrition and Retention in Construction Industry Apprenticeship Programs,” Industrial and Labor Relations Review 57.3 (2003): 54-67.
50

reduces wages as the literature indicates, weakening prevailing wage is likely to reduce
the number of women entering the trades.129
Workplace Injuries
In 2005, the private construction industry had more fatalities than any other
industry. Of the 5,702 workers that died from workplace injuries, 1,186 were in the
construction industry.130 Given the incidence of both fatal and non-fatal injuries in the
industry, it is not surprising that researchers examine the impact of any policy change on
work-related injuries. In 1991, OSHA published its list of “100 Most Frequently Cited
Construction Standards.” Along with a discussion of physical surrounding and safety
equipment, OSHA points to the importance of on-going training as a key to workplace
safety.131
Proponents argue that prevailing wage helps reduce injury rates for a variety of
reasons. First, prevailing wage encourages formal training by supporting apprenticeship
programs. Moreover, because prevailing wage increases the provision of benefits,
particularly pensions, labor becomes a quasi-fixed input in production. In other words,
prevailing wage encourages employee retention by increasing benefits, and better trained
and more seasoned employees are less likely to be injured. It may also be that contractors
that work on prevailing wage projects and states that have prevailing wage laws focus
more on regulation of workplace standards.132
129 For more information about women in the trades see: Susan Eisenberg, We’ll Call You: If We Need You, Ithica: Cornell University Press. 1998; Brigid O’Farrell and Suzanne Moore, “Unions, Hard Hats and Women Workers” in Women and Unions, ed. Dorothy Sue Cobble, New York: ILR Press. 1993, pp. 69-92. 130 Bureau of Labor Statistics, “Census of Fatal Occupational Injuries Summary, 2005” http://www.bls.gov/news.release/cfoi.nr0.htm August 10, 2006. 131 OSHA. “100 Most Frequently Cited Construction Standards.” http://www.osha.gov/Publications/100most/100most.html. 132 Hamid Azari-Rad, “Prevailing Wage Laws and Injury Rates in Construction,” in The Economics of Prevailing Wage Laws, eds. Hamid Azari-Rad, Peter Philips and Mark J. Prus (Ashgate: Burlington VT)
51

While we found few studies that directly addressed this issue, those we did find
were in consensus that state prevailing wage laws reduce the incidence of workplace
injuries. In their study of Utah’s repeal of prevailing wage, Philips, et al., found that when
the law was repealed injury rates went up 14% overall, serious injury rates went up 15%,
and the number of lost days increased 12%. They also compared states that had
prevailing wage with those that did not and found that non-prevailing wage states had a
statistically significant 5 to 9% higher injury rate.133
Philips looked at injury rates when Kentucky suspended the coverage of schools
under its prevailing wage law. In that case, he found a statistically significant 11%
increase in serious injuries and a 16% increase in lost days per serious injury.134 In the
most recent study to look at the relationship between prevailing wage and injury rates,
Azari-Rad found that the presence of prevailing wage has a negative and statistically
significant impact on injury rates. He found that the presence of prevailing wage reduces
the injury rate by 8.25% while reducing the incidence of the most serious injuries by just
over 10%.135
Cost Overruns
Philips, et al., found that cost overruns increased as a proportion of the accepted
bid after the repeal of prevailing wage laws. For example, after Utah repealed its
prevailing wage law in 1981, cost overruns increased by 5.3% (to 7.3% of the original
2005, p.181-182; Philips, et al., supra note 12; Peter Philips, “Delaware’s Prevailing Wage Law: Its History, Purpose and Effect,” (May, 1998); Peter Philips, “Kansas and Prevailing Wage Legislation,” Prepared for the Sheet Metal and Air Conditioning Contractors’ National Association, 1998, available at <http://www.smacna.org/kansas_prevailing_wage.pdf>. Peter Philips, “Kentucky’s Prevailing Wage Law: Its History, Purpose, and Effect,” Oct. 1999. 133 Philips, et al., supra note 12, at 62. 134 Peter Philips, “Kentucky’s Prevailing Wage law: Its History, Purpose, and Effect,” Oct. 1999, p. 85. 135 Hamid Azari-Rad, “Prevailing Wage Laws and Injury Rates in Construction,” in The Economics of Prevailing Wage Laws, eds. Hamid Azari-Rad, Peter Philips and Mark J. Prus (Ashgate: Burlington VT) 2005, p. 182-183.
52

bid).136 According to Philips, the increase in cost overruns is likely due to two factors: the
use of less skilled labor and competitive pressures that drive down bids.
Why is such an outcome likely? Research presented earlier concludes that a
weakening or repealing of prevailing wage will bring with it a drop in construction
worker wages across the state. In any profession, an across-the-board drop in wages will
make work in that industry less attractive. In the case of falling construction worker
incomes, two trends will leave the construction labor pool sapped of highly skilled
workmanship. First, highly skilled workers will likely leave the locality in search of
wages that compensate their skills, or they will leave the industry altogether. Second,
potentially skilled workers will be discouraged from entering the construction field
because they can become skilled and well paid in another industry.
As the average skill of construction workers declines, project costs will increase.
Workers not as familiar with certain jobs as their higher-skilled counterparts will require
a longer period of time to become accustomed to the job and particular project. Less-
skilled workers will also be more prone to on-the-job accidents and pose a higher safety
risk than more skilled workers. The costs associated with these trends are generally not
figured into the bid for a project, so they represent cost overruns.137
State Tax Revenues
Over the past ten years, a series of studies have been done that consider the
impact of altering prevailing wage on state budgets.138 While none of these studies is
136 See generally Philips, et al., supra note 12. 137 Philips, et al., supra note 12, at 14. 138 See, e.g., Michael Greenberg, et al., “Evaluating the Economic Effects of a New State-Funded School Building Program: the Prevailing Wage Issue,” 28 Evaluation and Program Planning 33, 33-45 (2005). The authors found that their econometric and input-ouput models suggest that compliance with the state prevailing wage law in a $10 billion school construction program in New Jersey will generate over $1.3 billion in state tax revenues.
53

perfect, each gives us at least a first look at the impact that weakening or repealing
prevailing wage might have on state budgets.
Philips, et al., conducted research on the repeal of nine “Little Davis-Bacon Acts,”
and estimated that given the decline in income created by the repeal in prevailing wage,
the state could expect to lose up to $8.2 million in revenues.139
In California, when the state Department of Industrial Relations proposed to
change the computation of prevailing wages from a mode to a weighted average, the state
argued that the change would reduce labor costs by 20%. The state calculated that this
would translate into an annual savings of $200 million. Reich, in his analysis of the
state’s estimates, pointed out simple math errors nearly wipe out all of the state’s
estimated savings.
Reich also estimated the impact of the change on the state’s budget. Based on the
state’s estimate of a 20% reduction in wages, Reich found that California was likely to
lose $418 million in income tax revenue. If there was a drop in wages of 8% (Philips’
estimate), the state would lose $169 million in tax receipts. Reich pointed out that due to
the price elasticity of demand for construction workers, a drop in wages would likely
result in slightly more employment and thus the net loss in income tax revenue might be
as low as $150 million. Reich concluded that the state was likely to lose a similar amount
in sales tax revenues. Thus, Reich estimated that the net effect of a change in the state’s
prevailing wage law would be a loss to the state treasury of at least $300 million.140
139 Philips, et al., supra note 12, at 17. 140 Michael Reich, “Prevailing Wage Laws in the California Economy,” Institute of Industrial Relations, University of California. February, 1996.
54

Belman and Voos conducted a similar study in Wisconsin in which they estimated that
the state would lose $23 million in tax revenue if the state law was repealed.141
Most recently, in response to claims that repealing the state prevailing wage law
would bolster state and local budgets, the University of Missouri – Kansas City
Department of Economics conducted an extensive study of the impact of such a change.
Using data available from the U.S. Census Bureau and Bureau of Economic Analysis, the
authors of the study concluded:
• The repeal of the prevailing wage law would cost the residents of Missouri between $294.4 million and $356.0 million annually in lost income.
• The repeal of the prevailing wage law would cost the State of Missouri between $5.7 million and $6.9 million in lost sales tax collections annually.
• The repeal of the prevailing wage law would cost the State of Missouri between $17.7 and $21.4 million annually in lost income tax revenue.
• The total economic loss due to repeal of the prevailing wage law in Missouri in 2004 would be a loss of income and revenue between $317.8 million and $384.2 million annually.142
Conclusion
It has been our intention here to summarize the literature related to prevailing
wage in support of the work of the Legislative Auditor. This review is not exhaustive and
does not capture the level of detail of each of the studies. Many of the articles and books
cited herein provide a more detailed analysis of each topic. Our hope was to make clear
that the issue of prevailing wage is a complicated one and to point to some of the likely
impacts if the law is weakened or repealed. Moreover, the nature of the construction
industry in general and bidding on state projects in particular make a regulation such as
prevailing wage particularly important.
141 Belman and Voos, supra note 60, at 13. 142 Kelsay, et al., supra note 64, at 3.
55

We believe that the preponderance of the evidence supports the idea that
prevailing wage is not only good for employees working on prevailing wage projects, but
also for the industry and community as a whole. Based on our review of the literature we
find that the likely outcome of a weakening or repeal of prevailing wage would be to:
• Lower wages for all construction workers.
• Shift the burden of health care and other benefits from the contractor to the state.
• Weaken the state’s thriving apprenticeship program and adversely affect female and minority employees in the process.
• Increase occupational injuries and thus worker’s compensation claims.
• Decrease the state’s tax base.
Prevailing wage encourages contractors to invest in training employees and to
operate in the most efficient manner possible. Contractors thus compete on efficiencies
rather than low wages.
56
SECTION FOUR:
STATE COMPARISONS OF IMPLEMENTATION AND ENFORCEMENT
In this section, we provide a comparison of the prevailing wage laws of different
states. We provide data on prevailing wage coverage, method of determination, and
enforcement. We gathered this data through a dual process. For each state we collected
the applicable regulations and contacted at least one official in each to confirm the
process. In the summary table below we list the official contacted and provide cites to
regulatory material used in our analysis.143
Currently, thirty-one144 states have prevailing wage laws that guarantee that
workers on state-funded construction projects will be paid wages that are “prevailing” for
their classification of work. The term “prevailing” is open to interpretation and there are
significant variations in how states have chosen to set rates. The states may be roughly
divided into four categories:
• States adopting Federal Davis-Bacon rates;
• States using collectively bargained rates;
• States calculating rates (through various methods) based on information obtained in their own investigations;
• States authorizing the public body awarding the contract to set rates.
While these categories will be used to present a large amount of material in an
accessible way, the state laws do not all fit within these tidy categories. Prevailing wage
regulations can be, and have been, adapted to meet different circumstances in different
143 The summary table at the end of this section contains information for each state arranged in alphabetical order. 144 We do not include Vermont in our count; Vermont does require prevailing wages on projects funded by the capital construction act, but does not have a prevailing wage statute per se, and is typically not counted.
57

states. As a result, each law and the rules that accompany it are unique, and broad
classifications threaten to obscure important differences.
For example, Connecticut and Rhode Island adopt federal Davis-Bacon rates, but
these are often found to be the collectively bargained rates. Thus, it might be equally
fitting to classify these as states that adopt collectively bargained rates. California, on the
other hand, generally adopts collectively bargained rates, but, ultimately, the state
regulations call for a mode. Furthermore, some states, like Hawaii, empower their
departments of labor to set rates by considering a variety of sources of information,
without stipulating which rate ought to be selected. The following summary will attempt
to note these gray areas as well as the variations within each category.
Federal Prevailing Wage Determinations
The United States Department of Labor sets federal Davis-Bacon wage rates
using information gathered through surveys completed by surveying contractors, labor
organizations, and other interested parties.145 The Department of Labor may also set
rates using data provided by agencies on wage rates paid on construction projects in a
given locality.146 If wage data shows that a majority of workers in a particular
classification are paid the same rate, then that rate is considered prevailing.147 If a single
rate does not represent a majority, then an average is calculated, weighted by the number
of workers in that category at each rate.148 While the federal offices can issue wage
determinations on a project-by-project basis, they also establish general wage
145 29 CFR § 1.3(a). 146 Ibid. 147 29 CFR § 1.2(a)(1). 148 Ibid.
58

determinations that can cover all projects in a particular geographic region.149 The
federal wage determinations are updated periodically, but not necessarily annually.150
These aspects of the federal system—i.e. that some localities are not covered by a general
federal determination and the determinations are not updated with strict regularity—may
explain why some states calculate their own rates using the federal formula.
States Adopting Federal Prevailing Wage Determinations
Connecticut and Rhode Island use federal prevailing wage rates.151 Kentucky also
adopts federal rates, but only in 39 of its 120 counties.152 Montana adopts federal rates
for highway and heavy construction, but calculates its own rates for building
construction.153 The state sets the remainder of the rates through surveys.154 Under
published regulations, Hawaii’s Director of Labor can either adopt federal rates or
conduct surveys to calculate rates.155
States Using Collectively Bargained Rates
Alaska, Hawaii, Massachusetts, Michigan, New Jersey, New York, Ohio,
Pennsylvania, and West Virginia all base their prevailing wage determinations on
collective bargaining agreements.156 As noted above, the fact that these states can be
categorized together should not be taken to mean that their policies are uniform.
149 29 CFR § 1.5(a) (authorizing the publication of general wage determinations); 29 CFR § 1.6(a)(1) (setting forth parameters for the use of project wage determinations). 150 29 CFR 1.6(c)(1) (noting that “[p]roject and general wage determinations may be modified from time to time to keep them current”). See also 48 CFR § 22.404-1. 151 Conn. Gen. Stat. § 31-53(d) (providing that the Commissioner of Labor may also conduct a hearing to determine prevailing wage rates); R.I. Gen. Laws § 37-13-8. 152 October 5, 2005 telephone interview with Ms. Jan Haynes of the Kentucky Department of Labor. 153 Mont. Code Anno. § 18-2-401. 154 Admin. R. M. 24.17.121. 155 HRS § 104-2(b)(2) (providing that a prevailing wage determination may not be less than the federal prevailing wage determination for that job classification). 156 ALM GL ch. 149, § 26; MCL § 408.554; N.J. Stat. § 34:11-56.26; NY CLS Labor § 220(5); ORC Ann. 4115.05; 34 Pa. Code § 9.105; W. Va. Code § 21-5A-5 (permitting the state department of labor to consider collective bargaining rates when setting prevailing wage rates); October 5, 2006 telephone interview with
59

For example, according to a legislative audit report, Alaska formerly had a dual
system in which rates in regions with high union density were tied to collective
bargaining agreements and an average rate was used in other localities.157 In 1992, the
state switched to using only collectively bargained rates in the interest of administrative
efficiency.158 As an illustration, if two collective bargaining agreements cover a
particular trade in a specific county, then the contract that covers the most workers will
be used. If a particular classification of workers is not covered by an agreement, then a
survey can be conducted and a mode selected from the results.
Michigan also sets rates using collective bargaining agreements, but when a
particular classification is not covered in a given locality, the rate for the “same or most
similar employment in the nearest and most similar neighboring locality” may be used.159
Nevada bridges the gap between states which calculate rates and those which
adopt collectively bargained rates. While the Nevada Administrative Code outlines a
procedure for calculating rates based upon data collected by the labor commissioner, it
also permits the prevailing wage to be tied to collectively bargained rates, if those are the
rates revealed by the survey.160 Thus, changes in the collectively bargained rate will
result in changes to the prevailing rate, if those are the same.
Sandra Sylva, Hawaii Department of Labor and Industrial Relations: Labor Market Information Section. But see Hardy County Bd. of Educ. v. West Virginia Div. of Labor, 191 W. Va. 251, 445 S.E.2d 192 (1994) (noting that the state’s department of labor does not have to base prevailing wage rates on the wage rates contained in an existing collective bargaining agreement); HRS § 104-2(b)(1)(B) (setting forth modal calculations for prevailing rate determinations). 157 See Alaska Division of Legislative Audit #07-4546-97, available at http://www.legaudit.state.ak.us/pages/digests/1997/4546.dig.htm. The Auditor’s report makes it clear that wage determinations are made based upon existing collective bargaining agreements notwithstanding an administrative regulation specifying that the modal method should be used. 158 Ibid. 159 MCL § 408.554. 160 Nev. Admin. Code § 338.010.
60

States Making Independent Prevailing Wage Determinations
Eighteen states (Arkansas, California, Delaware, Indiana, Kentucky, Maryland,
Maine, Minnesota, Missouri, Montana, Nebraska, Nevada, New Mexico, Oregon,
Tennessee, Washington, Wisconsin, and Wyoming) use some method for calculating
prevailing wages independent of collective bargaining agreements and federally set
rates.161 Of these, all but Indiana and Kentucky base their rates on data collected from
surveys. In Indiana, for each project subject to its prevailing wage law, a committee of
five members (one from labor, one from the executive branch, one from the awarding
agency, and two taxpayers) holds a public hearing, evaluates evidence presented at that
hearing, and sets the rates to be used on the project in question.162 Indiana statutes do not
specify what rate is to be selected by the committee, but the Indiana Court of Appeals has
defined it as the arithmetic mode.163
Kentucky has a similar procedure.164 Eighty-nine of Kentucky’s 120 counties are
divided into twenty localities (the remaining thirty-nine counties, as noted above, adopt
federal Davis-Bacon rates).165 In each of these twenty localities, hearings are held
(typically semi-annually) to set the prevailing rates.166 As in Indiana, wage data is
161 Arkansas Dep’t Labor, Prevailing Wage Division: Rules and Regulations, ch. 2, § 2.100; Cal Lab Code § 1773; Delaware Code 29 §§ 6960 (a); Indiana Code § 5-16-7; KRS § 337.520; Md. STATE FINANCE AND PROCUREMENT Code Ann. § 17-208; 26 M.R.S. § 1304; Minn. R. § 5200.1060; Missouri Dep’t of Labor, “Missouri Prevailing Wage Law,” http://www.dolir.mo.gov/ls/brochures/13-AI.pdf; Mont. Code Anno. § 18-2-401; R.R.S. Neb. § 73-104; Nev. Admin. Code § 338.010; New Mexico Admin. Code § 11.1.2.11; ORS § 279C.815; Tenn. Code Ann. § 12-4-405; Rev. Code Wash. (RCW) § 39.12.010; Wis. Stat. § 103.49; Wyoming Dep’t of Labor Rules and Regulations, ch. 6, § 7. 162 Indiana Code § 5-16-7-1. 163 See Union Township School Corp. v. State ex rel. Joyce, 706 N.E.2d 183, 190 (Ind. Ct. App. 1998). 164 KRS § 337.505. 165 KRS § 337.010(3)(c) (discussing the designation of localities and noting that Dep’t of Transportation contacts may be awarded in “localities” determined by that department). 166 KRS § 337.522 (describing the hearing procedure the department may follow “for the purpose of making initial determinations or current revisions of a prevailing wage schedule”).
61

gathered at the meeting and a mode is determined.167 In Kentucky, however, the mode
must represent a majority of the reported wages.168 If the data fails to meet that criterion,
then a weighted average is selected.169
Of the states which use survey data to determine rates, the majority seek a mode,
but with varying requirements. Minnesota and Missouri adopt the most commonly
reported wage for a particular classification. In Minnesota, the higher of two wages will
be selected in the event that there are two modal wages.170 For example, if survey results
for Hennepin county show that six carpenters are paid $22.10 per hour and six are paid
$23.67 per hour, then $23.67 is chosen. California uses modal rates, but these nearly
always correspond to collectively bargained rates.171
Although many other states seek a mode, their regulations specify a minimum
percentage which the mode rate must represent in order to be accepted as prevailing, just
as the federal Davis-Bacon Act does. Arkansas, Delaware, Montana, Oregon, and
Washington all require that the mode represent a majority of the reported wages for a
given classification in a given locality.172 If it does not, then these states set the
prevailing rate equal to an average of the reported rates (typically weighted by either the
number of workers receiving each rate or the number of hours reported at each rate).173
New Mexico and Wyoming officials look first for a mode that represents a majority of
the reported rates, but failing that they will accept a mode that represents 30% before
167 KRS § 337.520(3) (requiring that the department of labor consider, inter alia, wage rates paid on current and past state construction projects). 168 KRS § 337.505(1). 169 Ibid. 170 Minn. R. § 5200.1060, Subp. 2. 171 Cal. Lab. Code § 1773.9. 172 Arkansas Dep’t Labor, Prevailing Wage Division: Rules and Regulations, ch. 2, § 2.100; Delaware Code 29 § 6960 (a); Mont. Code Anno. § 18-2-401(13)(ii); ORS § 279C.800(3); Rev. Code Wash. (RCW) § 39.12.010(1). 173 Ibid.
62

utilizing an average.174 Maryland is similar except that its secondary requirement is 40%
rather than 30%.175 Wisconsin also seeks a majority mode, but when that criterion is not
met, the prevailing wage is equal to the average of the highest 51% of the wages in the
classification.176
Of the 31 states with prevailing wage laws only two do not use a modal
calculation or collectively bargained rate. Tennessee sets its rates equal to the average of
the reported wages,177 and Maine is unique in selecting the median.178
States with a Decentralized Process
Texas has a decentralized process of establishing rates, leaving it up to the public
agency awarding the contract to set the prevailing rates.179 As a result, prevailing wages
are set in a variety of ways, depending on the locality. Illinois permits either the
awarding agency or the Director of Labor to set rates, though the administrative
regulations do not specify how.180
Survey Process
Most states that compile survey data do not place any obligation on contractors to
respond. Both Minnesota and federal surveys are voluntary. In Maine, however, the
director may require a contractor to provide wage data and fine him or her $50 for failing
to do so.181 Maine’s prevailing wage survey response rate was 85% in 2003.182 In
174 New Mexico Admin. Code § 11.1.2.11(b)(2)(B); Wyoming Dep’t of Labor Rules and Regulations, ch. 6, § 7(c). 175 Md. STATE FINANCE AND PROCUREMENT Code Ann. § 17-208(c); Nev. Admin. Code § 338.010(b)(1). 176 Wis. Stat. § 103.49(d)(2). 177 Tenn. Code Ann. § 12-4-405. 178 26 M.R.S. § 1304(9). 179 Tex. Gov’'t Code § 2258.022. 180 820 ILCS 130 § 7. 181 26 M.R.S. § 1308. 182 Maine Dep’t of Labor: Labor Standards, “Report on Maine Construction Wage Rates 2003/2004,” at 4.
63

Wisconsin, there is no direct penalty for not providing wage data, but contractors who
ignore the request lose their right to protest the wages that are set.183 Punitive measures
are not the only way to increase response rates. Tennessee has successfully increased
response rates from contractors in highway construction from 10% to 50% in two years
by switching to a more convenient online survey form.184
While a high level of participation from contractors is ideal, their response rate is
not necessarily indicative of the amount of data upon which rates are set. A single
contractor might report work from multiple jobs, and labor unions can report wages on
behalf of contractors. Minnesota sent out 16,000 surveys last year but obtained 24,000
responses.185 Missouri surveyed 2,200 contractors, 600 city clerks, and all public school
superintendents and received 7,889 wage reports.186
Types of Construction Covered
Minnesota sets wages for two types of construction: commercial and
highway/heavy.187 This is a common division, though some states subdivide further
and/or include additional types of construction. For example, Wisconsin sets rates for five
categories of construction work.188 In 2002, Maine modified its classification system by
dividing building construction into two categories (residential and commercial) and by
183 DWD § 290.015. 184 July, 2006 Telephone interview with Ms. Kelly Jo Dyer, Tennessee Department of Labor and Workforce Development: Labor Standards Division. 185 September, 2006 telephone interview with Michelle Shafer, Labor Investigator, Minnesota Department of Labor and Industry: Prevailing wage unit. 186 Missouri Dep’t of Labor and Industrial Relations, “Labor News,” released June 29, 2006, available at http://www.dolir.mo.gov/Newsreleases/releases/prevwagerate06.htm. 187 Minn. Stat. § 177.44; Minn. R. § 5200.1010, Subp. 2 and 3. 188 Wis. Admin. Code § DWD 290.035. Wisconsin’s categories are: a) airport pavement or state highway construction; b) building or heavy construction; c) local street or miscellaneous paving construction; d) residential or agricultural construction; and e) sewer, water, or tunnel construction. Ibid.
64

adding “earthwork” projects, like athletic fields, to the highway classification.189 Simply
splitting highway and heavy construction into two separate categories, as in Delaware, is
a more common difference.190 Overall, the four categories (building, heavy, highway, and
residential) used for Federal Davis-Bacon rates represent the basic distinctions that the
states customize to meet their own needs.
These categories enable the states to match the rates to the work being done. For
example, Wisconsin and Maine need to set rates for residential construction while
Minnesota does not.191 Minnesota’s choice to have one rate for an entire highway project
no doubt simplifies matters on projects that run through multiple counties.192
Geographic Divisions
Typically states issue prevailing wage schedules on a county-by-county basis.
Given the nature of the work, highway construction is sometimes covered on a regional
basis, or, as in Tennessee, a statewide scope. Minnesota sets commercial construction
rates by county and has ten zones for highway/heavy.193 As noted above, the United
States Department of Labor can issue wage determinations on a project-by-project basis,
but also issues general wage determinations that can cover all work in a geographic
area.194 Counties are often the basis for these area determinations.195 However, the same
determination frequently will be applied to a group of counties, and sometimes counties
are subdivided or larger cities receive separate decisions. The state of Washington sets
189 12-170 C.M.R. 13 § 3. See also “Report on Maine Construction Wage Rates 2003/2004,” available from the Maine Bureau of Labor Standards (207-624-6487). 190 29 Del. C. § 6960, et seq. 191 Wis. Admin. Code § DWD 290.035, 12-170 C.M.R. 13 § 3. 192 Minn. Stat. § 177.44, Subd. 4. 193 Minn. R. § 5200.1030-1035. 194 29 CFR § 4.54 (for the purpose of setting Davis-Bacon wage rates, the term “locality” has an “elastic and variable meaning” but that it is “ordinarily limited geographically to a particular county or cluster of counties”). 195 Ibid.
65

rates for each county, but bases the rates on data from the largest city in each.196 Other
states, like Montana, are divided into prevailing wage regions, which are larger than
counties.197 In Kentucky, prevailing rate is determined by state senate districts.198
Again, note that each state tends to set its own type of measurements in a way that
reflects its political and economic realities.
Coverage
State laws differ in many ways with respect to the sizes and types of projects
covered. Many state laws specify a threshold contract amount, above which prevailing
wage rates apply. Minnesota’s threshold is $2,500 for projects that require only one trade
and $25,000 for projects that require more than one.199 The federal government’s
threshold is $2,000 for all projects.200 Eight states (Illinois, Massachusetts, Michigan,
Missouri, New York, Texas, Washington, and Wyoming) have no threshold amounts.
Others, like Connecticut and Maryland, have much higher thresholds ($400,000 and
$500,000, respectively).201 Several states have lower thresholds for remodeling work.202
Finally, Ohio’s threshold is adjusted upward every two years to account for inflation.203
Also some states exclude various types of construction. Arkansas, for example,
excludes maintenance work; work done for, or by, any drainage, improvement, or levee
196 Rev. Code Wash. § 39.12.010(2). 197 Mont. Code Anno. § 18-2-411. 198 KRS § 337.010. 199 Minn. Stat. §177.43 Subd. 7. 200 29 U.S.C. § 3142. 201 Conn. Gen. Stat. § 31-53(g); Md. STATE FINANCE AND PROCUREMENT Code Ann. § 17-202(b). 202 Md. STATE FINANCE AND PROCUREMENT Code Ann. § 17-202(b) (setting the threshold remodeling work at $100,000). 203 ORC Ann. 4115.034.
66

district; highway, street, bridge or road work; and primary and secondary schools.204
Ohio also excludes school construction.205
Allowable Ranges for Prevailing Wage Adjustments
Two states, New Mexico and Tennessee, have restrictions on the amount that
prevailing wage rates can change from one determination to the next. New Mexico does
not allow rates to drop by more than 3%, and the maximum change in Tennessee is
6%.206 Neither Minnesota nor the federal government has such regulations.
Enforcement
Few studies look at the issue of enforcement. Most state statutory schemes have
some kind of provision authorizing government enforcement of prevailing wage.
However, some have no public enforcement provisions. In those jurisdictions
enforcement through private litigation appears to be the only avenue to redress violations
of the law. Even in those states in which the prevailing wage statute does contain public
enforcement provisions, it is not clear what resources are available to implement those
provisions.
During 1985 and 1986, the Foundation for Fair Contracting, a California based
organization set up to monitor prevailing wage compliance, conducted a study of 387
cases. They discovered violations in the majority of the cases reviewed. Cases referred to
the state were investigated, but due to the workload of investigators, the process was a
long one. This seems to be a common problem in enforcement of the statutes. Many
states have little proactive enforcement and primarily respond to complaints.
204 A.C.A. § 22-9-303. 205 ORC Ann. 4115.04. 206 July, 2006 telephone interview with Annette Reynolds, New Mexico Department of Labor: Public Works Construction Projects; Tenn. Code Ann. § 12-4-405(4).
67

The summary table below describes the penalties that can be levied against
contractors who fail to comply with prevailing wage requirements. However, these
penalties are not representative of the level of enforcement in the state, and that data is
often difficult to find. In preparing this report, we were only able to get a general idea of
how department officials in the various states enforce the respective prevailing wage
statutes.
In Minnesota, the Department of Labor and Industry has a Prevailing Wage Unit
that is principally responsible for setting rates and investigating prevailing wage
violations.207 Minnesota's prevailing wage law applies misdemeanor criminal sanctions
to violating contractors and to an officer or employee of the state who executes a contract
for a project without complying with prevailing wage.208 Prosecution under this criminal
provision is left to the discretion of County Attorneys, who are often already burdened
with other types of crime. The Minnesota prevailing wage law does not specifically
authorize a private right of action in court for enforcement purposes. Contracting
agencies can attempt to redress prevailing wage violations by withholding payments, but
it is not clear how often this occurs. Given the discretionary and decentralized nature of
this enforcement process, it is difficult to discern the extent to which prevailing wage
violations occur and are punished in the State of Minnesota.
Other states, like New York, adopt a more proactive stance. According to Mike
Gaudio, of the Bureau of Public Work, in addition to investigating complaints New York
has a “strike force” team that is responsible for monitoring compliance.209 The state of
207 Minn. Stat. § 177.43, Subd. 4-6. 208 Minn. Stat. § 177.43, Subd. 5. 209 July, 2006 telephone interview with Michael Gaudio, Senior Public Work Wage Investigator, New York State Department of Labor.
68

Tennessee has created a right of action for the department of labor and employees of
contractors who violate the prevailing wage law.210 The state of Rhode Island has created
a private right of action so that employees or organizations representing employees may
sue companies that violate prevailing wage laws.211 The state of Maine conducted 28
investigations in 2003, of which only five were complaint-driven.212 As a result of these
investigations, ten companies paid just over $27,000 in back wages.213
In many states, as in Minnesota, contracting agencies can simply withhold funds
from the prime contractor until compliance is achieved. This can be a powerful
mechanism (if noncompliance can first be discovered) because it encourages the prime
contractor to demand accurate reporting and compliance from the various subcontractors
doing work on the project.
Ultimately, however, it appears that state agencies do not have the resources to
comprehensively investigate each and every project. The burden therefore falls upon the
employees themselves to file claims if a private right of action exists.
The following is a tabular summary of the federal and state prevailing wage laws
and regulations. This data was gathered through a comprehensive review of the most
recent version of the relevant statutes and regulations, and focuses upon three aspects of
each law: 1) The method of determining the prevailing wage for a work classification; 2)
Limitations, if any, on the types of public works projects covered by the legislation; and
3) Methods of enforcement authorized by the statute.
210 Tenn. Code Ann. § 12-4-412. 211 R.I. Gen. Laws § 37-13-17 (a) (providing a private right of action for “any employee or former employee, or any organization representing such an employee or former employee”). 212 Maine Dep’t of Labor: Labor Standards, “Report on Maine Construction Wage Rates 2003/2004,” at 13-14. 213 Ibid.
69

SUMMARY OF STATE AND FEDERAL PREVAILING WAGE REGULATIONS
state method threshold Penalty Minnesota Mode $2,500 one trade;
$25,000 more than one
Enforced by the Department of Transportation and the Department of Labor and Industry. The statute provides that violations of Minn. Stat. § 177.43 can result in fines of up to $1,000 and/or up to 90 days imprisonment. Each day of violation is a separate offense. Violations of Minn. Stat. § 177.44 are a misdemeanor resulting in a fine of up to $300, imprisonment for up to 90 days, or both. Each day of violation is a separate offense. Repeat violators may be fined up to $700, and anyone who forces an employee by threat to accept less than the prevailing rate maybe be fined up to $1,000 and imprisoned for up to one year. Employees who knowingly permit employers to pay less than the required rate can be fined up to $40, imprisoned for up to 30 days, or both. §177.44 subd. 6.
Sources: Minnesota Stat. §§177.42 to 177.44; MN Department of Labor and Industry, Labor Standards, Michelle Shafer (651-284-5091), telephone interviews, September and October 2006; “A Guide to Minnesota’s Prevailing Wage Law,” brochure available at http://www.doli.state.mn.us/pdf/pvwage.pdf#search=%22a%20guide%20to%20mn%20prevailing%20wage%20law%22. method threshold Penalty Federal Davis- Bacon
Mode, if it represents a majority of the data, else average
$2,000 The Federal agency letting the contract may suspend payment or withhold funds. Violating contractors are prosecuted by the Attorney General and may be debarred for three years.
Sources: Federal Davis-Bacon Act, Title 29, Part 5; Davis Bacon Wage Determination Reference Manual available at http://www.gpo.gov/davisbacon/referencemat.html. state method threshold Penalty Alaska
Based on collective bargaining agreements214
$2,000 Misdemeanor; a fine not less than $100 and not more than $1,000, and/or imprisonment for not less than 10 days and not more than 90 days. Each day of violation constitutes a separate offense. §36.05.060.
Sources: Alaska Stat. §§ 36.05.010 to 36.05.110, Division of Labor Standards and Safety, Wage and Hour Section, Juneau, Nancy Dutton, Wage and Hour Technician (907-269-4930) telephone interview July, 2006; Alaska Division of Legislative Audit #07-4546-97, available at http://www.legaudit.state.ak.us/pages/digests/1997/4546.dig.htm.
214 But see 8 Alaska Admin. Code § 30.050, stating that the modal wage should be used if it represents a majority of the data, and that the average should be used if it does not.
70

state method Threshold Penalty Arkansas Mode, if it
represents a majority of the data, else average, and the Department is authorized to consider collective bargaining rates and federal Davis-Bacon determinations
$75,000
Fines not less than $50 and not more than $1,000. Separate violations for each employee per day. Fines may not exceed 10% of contract amount or 10% of unpaid wages due (whichever is greater). Workers may be fined $50 - $1,000 for submitting false wage claims.
Sources: Ark. Code Ann. §§22-9-301 to 22-9-315; phone conversation Don Cash; AR Department of Labor (501-682-4500), telephone interviews in July and September, 2006; Prevailing Wage Division Administrative Regulations available at http://www.ark.org/labor/pdf/prevailing_wage_regs.pdf#search=%22arkansas%20Prevailing%20Wage%20Division%20Administrative%20Regulations%22. state method threshold Penalty California Mode, usually set
by collective bargaining agreements.
$1,000 Awarding bodies may withhold contract payments to recover wages due and contractors may withhold payments from subcontractors responsible for violations (Cal. Lab. Code § 1729). Up to $100 fine for first offense, up to $300 for repeat offenders. Each day is a separate offense. Violating contractors may be debarred from public contracts.
California Labor Code §§ 1770 to 1781; Office of Labor Statistics; Earl Lazo, Prevailing Wage Unit (415-703-4774), telephone interviews in July and September, 2006. state method threshold Penalty Connecticut Adopts Federal
Davis-Bacon rates or conducts hearings to determine area wages.
$400,000 for new construction; $100,000 for remodeling.
Fines ranging from $2,500 to $5,000 and imprisonment if the offense involved filing a false certified payroll statement. Debarment (includes those contractors on the Federal Davis-Bacon debarment list).
A Guide to Prevailing Wage Laws in Connecticut (2004) Connecticut Department of Labor; Connecticut General Statutes §31-53.
71

state method threshold penalty/enforcement Delaware Mode, if it
represents a majority of the data, else average.
$100,000 for new construction; $15,000 for remodeling.
Enforced by the Department of Labor. Fines not less than $1,000 and no more than $5,000. Debarment up to 3 years. Employees may recover treble what is owed.
Sources: Delaware Code 29 §§ 6960 et seq. Delaware Prevailing Wage Regulations available from the Delaware Department of Labor; Fran Chudzik, Department of Labor: Division of Industrial Affairs (302-761-8200; telephone interview July, 2006. state Method threshold penalty/enforcement Hawaii Collective
bargaining agreements, unless there is not a rate, then published rate setting formula is used.
$2,000 The Department of Labor and the contracting agency share enforcement responsibilities. Violating contractors are fined 10% of back wages due or $25 (whichever is greater) for first offence; amount equal to back wages due or $100 for second offense; and double back wages due or $200 for third offense. Contractors can be debarred.
Sources: Frequently Asked Questions about Chapter 104 available at http://hawaii.gov/labor/wsd/pdf/forms/104FAQ.pdf; Sandra Sylva, Department of Labor and Industrial Relations: Labor Market Information Section (808-586-9017), Telephone Interview October 5, 2006. state Method threshold Penalty Illinois Set by either the
public body awarding the contract or the department of labor.
None Contractors may be debarred. Violating contractors are fined 20% of underpayments for first offense; 50% for second and subsequent violations. (Plus 2% - 5% of underpayments for each month in which they go unpaid.
Illinois Prevailing Wage Act (820 ILCS 130); 56 Ill. Admin Code 100. state Method threshold Penalty Indiana For each project,
a 5 member committee is formed to hold a public hearing and set the rate, interpreted as the mode
$150,000 Violating contractors are guilty of a Class B misdemeanor. Contract is forfeited upon second violation.
Sources: Indiana Code 5-16-7; Indiana’s Common Construction Wage .pdf available at http://www.in.gov/labor/pdfs/Common_Construction_Wage_072205.pdf; Ashton Eller, Indiana Department of Labor: Division of Wage & Hour and Child Labor (317-232-2655), telephone interview July, 2006. state Method threshold Penalty Kentucky Public hearings in
some regions, but Davis-Bacon rates are adopted in others
$250,000 Violating contractors are fined not less than $100 and not more than $1,000. Debarment for flagrant or repeated violations. Public officials may also be fined not less than $100 and not more than $1,000 for violations.
Sources: Kentucky Revised Statutes 337.505 to 337.990; An Analysis of Kentucky’s Prevailing Wage Laws and Procedures (2001) Legislative Research Commission: Research Report #304; Jan Peters-Haynes, Department of Labor: Office of Workplace Standards (502-564-3070), telephone interview, October 5, 2006.
72

state Method threshold Penalty Maine Median reported
wage
$50,000 Enforced by the Bureau of Labor Standards Fine of not less than $250.
Sources: Maine Revised Statutes, Title 26 §1304 – 1315; Maine Dep’t of Labor: Labor Standards, Report on Maine Construction Wage Rates 2003/2004, available at http://mainegov-images.informe.org/labor/labor_stats/publications/constructionwagerept/constructionwage03-04.pdf; Jorge Acero, Employment and Training Specialist, Maine Department of Labor: Bureau of Labor Standards (207-624-6487), telephone interview July, 2006. state Method Threshold Penalty Maryland Mode, if it
represents at least 40% , else average
$500,000 Violating contractors may be fined up to $20 per violation, and must make restitution. Persistently violating contractors may be debarred.
Sources: Maryland Code §§17-201 to 17-226; Tamela Ricci, Labor Investigator, Maryland Department of Labor, Licensing, and Regulation: Prevailing Wage Unit (410-767-2342), telephone interview July, 2006. state method Threshold Penalty Massachusetts Based on
collective bargaining agreements
None Enforced by the Attorney General. Contractors may be fined up to $10,000 or face imprisonment for up to 6 months for first offense, up to $25,000 or prison for up to one year for subsequent violations. These are double for willful violations. Up to 5-year debarment.
Sources: Massachusetts General Laws Chap. 149 §§26 to 27H; Mass. Division of Occupational Safety, Department of Labor, http://www.mass.gov/dos/pw/index.htm; Lisa Price, Deputy General Counsel, Department of Labor: Division of Occupational Safety (617-727-3492), telephone interview July, 2006. state method Threshold Penalty Michigan Based on
collective bargaining agreements
None Violating contractors are guilty of a misdemeanor. Repeat violators may be debarred.
Sources: Michigan Compiled Laws §§408.551 to 408.558; Georgia Harris (517-322-1825), An Overview of the Michigan Prevailing Wage Act available at http://www.michigan.gov/documents/Brochure_89314_7.166.pdf#search=%22overview%20of%20the%20michigan%20prevailing%20wage%20act%22; Debarment Policy for Violations of Act 166, available at http://www.michigan.gov/documents/PW_Debarment_LTR_and_Policy_92918_7.pdf; Georgia Harris, Program Manager, Michigan Department of Labor and Economic Growth: Wage and Hour Division (517-322-5272), telephone interview July, 2006. state method Threshold Penalty Missouri Mode None Violating contractors may be fined up to $500,
imprisoned for up to six months, or both. Contractors are debarred for one year following their first violation and for three years after repeat violations.
Missouri Revised Statutes §§ 290.210 to 290.340; Brenda Hentges, wage and hour supervisor, Missouri Department of Labor and Industrial Relations: Division of Labor Standards (573-526-7620), telephone interviews July and September, 2006; Missouri Prevailing Wage Law brochure available at http://www.dolir.mo.gov/ls/brochures/13-AI.pdf#search=%22missouri%20prevailing%20wage%20law%22.
73

state method threshold penalty Montana Mode, if it
represents a majority of the data, else average. Heavy/highway construction uses Davis-Bacon rates.
$25,000 Violating contractors are fined up to $1,000. Fines of up to $10,000 may be issued for violations due to gross negligence. Contractors who commit willful violations may be debarred for up to three years.
Sources: Montana Code §§18-2-401 to 18-2-432; Mike Hohn, Statistician, Department of Labor: Montana Research and Analysis Bureau (406-444-2430), telephone interview July, 2006. state method threshold penalty Nebraska Mode, provided it
is the wage rate paid by at least 50% of contractors in the same field
None, except $40,000 for public school districts
Persons violating the chapter are guilty of a class IV misdemeanor.
Sources: Nebraska Revised Statutes §§73-101 to 73-106; US Department of Labor, Omaha Nebraska (402-221-4682) state method threshold penalty Nevada Set by Labor
Commissioner. Either a mode/average calculation or a collectively bargained rate
$100,000 Investigated by the public body awarding the contract. Contractors are fined $20 – $50, per worker per day, up to $1,000 for a first time offense and up to $5,000 for subsequent failures to comply.
Sources: Nevada Revised Statutes §§338.010 to 338.645; Nevada Administrative Code 338.005 to 338.410; Carrie Foley, Assistant to Labor Commissioner, Office of the Labor Commissioner (702-486-2795), telephone interview July, 2006. state method Threshold penalty New Jersey Based on
collective bargaining agreements.
$2,000 Enforced by the Division of Wage and Hour Compliance Public Contracts Section which conducts routine investigations of worksites. Violating contractors may be fined not less than $100 and not more than $1,000 dollars, or imprisoned for 10 – 90 days, or both. Separate violations per day, per worker. In lieu of or in addition to that penalty the Commissioner of Labor may assess an administrative penalty of $2,500 to $5,000. Violating contractors also face three year debarment
Sources: N.J.S.A. §§34:11-56.25 to 34:11-56.47; New Jersey Prevailing Wage Act FAQ’s available at http://www.state.nj.us/labor/lsse/lspwfaq.html; Ashleigh Chamberlain, Department of Labor: Division of Wage and Hour Compliance (609-292-2259), telephone interview July, 2006.
74

state method Threshold penalty New Mexico Mode, if it
represents 30%, else average
$60,000 Violating contractors may lose the right to continue on the project and may also be debarred for three years. Each affected employee is entitled to wages owed plus $100 in liquidated damages for each calendar day in which the employer was in violation.
Sources: New Mexico Statutes §§13-4-11 to 13-4-17; Annette Reynolds, New Mexico Department of Labor: Public Works Construction Projects (505-827-6843), telephone interview July, 2006. state method threshold penalty New York Based on
collective bargaining agreements
None Enforced by the Commissioner of Labor. Employees are entitled to wages plus interest of up to 16%. Violating contractors may be fined up to $500 and/or receive thirty days in jail for a first offense, and may receive a $1,000 fine and contract forfeiture for a second offense. They may also be fined up to 25% of total wages and supplements due if they fail to timely provide to the contract officer evidence of prevailing wage compliance and also face debarment.
Sources: New York LAB §§220-220g; Frequently Asked Questions Regarding Public Work –Article 8, Section 220, Labor Law available at http://www.labor.state.ny.us/workerprotection/publicwork/PDFs/Article8FAQS.pdf; Mary McDonnell, Department of Labor: Bureau of Public Work (518-457-5589), telephone interview September, 2006. state method threshold penalty Ohio Based on
collective bargaining agreements
$69,853 for new construction, $20,955 for remodeling (biannual adjustment).
Enforced by the Director of Commerce. Violating contractors may be fined up to 75% of the difference owed to workers and face debarment of up to three years.
Sources: Ohio Rev. Code §§4115.03 to 4115.16, 4115.99; Ohio Legislature Members Only Newsletter, vol. 126 issue 2, Feb. 25, 2005; Joanna Jackson, Ohio Department of Commerce: Division of Labor and Worker Safety (614-466-2901), telephone interviews July and September, 2006. state method threshold penalty Oregon Mode, if it
represents a majority of the data, else average.
$50,000 Enforced by the Commissioner of the Bureau of Labor. Violating contractors may be fined up to $5,000 and face debarment for up to three years.
Oregon Revised Statutes §§279C.800 to 279C.870; Prevailing Wage Rate Coordinator (503-731-4709); Mike Kern, Administrative Specialist, Bureau of Labor and Industries: Wage and Hour Division (971-673-0839), telephone interview July, 2006
75
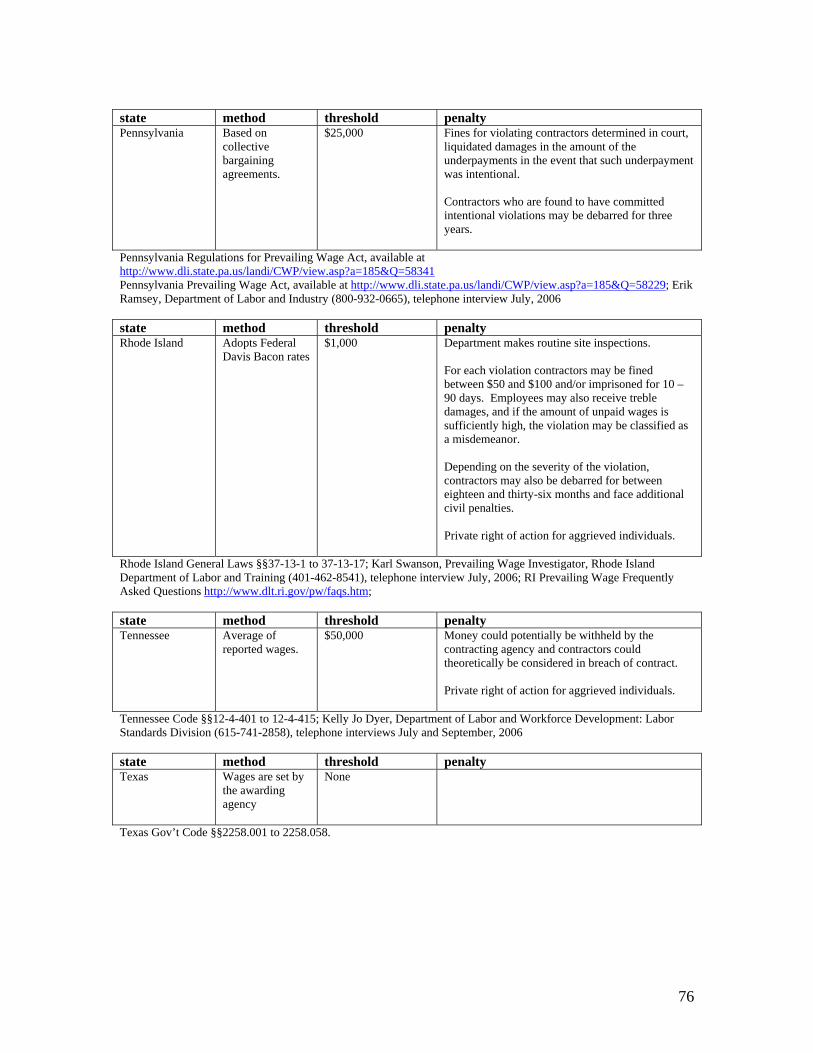
state method threshold penalty Pennsylvania Based on
collective bargaining agreements.
$25,000 Fines for violating contractors determined in court, liquidated damages in the amount of the underpayments in the event that such underpayment was intentional. Contractors who are found to have committed intentional violations may be debarred for three years.
Pennsylvania Regulations for Prevailing Wage Act, available at http://www.dli.state.pa.us/landi/CWP/view.asp?a=185&Q=58341Pennsylvania Prevailing Wage Act, available at http://www.dli.state.pa.us/landi/CWP/view.asp?a=185&Q=58229; Erik Ramsey, Department of Labor and Industry (800-932-0665), telephone interview July, 2006 state method threshold penalty Rhode Island Adopts Federal
Davis Bacon rates $1,000 Department makes routine site inspections.
For each violation contractors may be fined between $50 and $100 and/or imprisoned for 10 – 90 days. Employees may also receive treble damages, and if the amount of unpaid wages is sufficiently high, the violation may be classified as a misdemeanor. Depending on the severity of the violation, contractors may also be debarred for between eighteen and thirty-six months and face additional civil penalties. Private right of action for aggrieved individuals.
Rhode Island General Laws §§37-13-1 to 37-13-17; Karl Swanson, Prevailing Wage Investigator, Rhode Island Department of Labor and Training (401-462-8541), telephone interview July, 2006; RI Prevailing Wage Frequently Asked Questions http://www.dlt.ri.gov/pw/faqs.htm; state method threshold penalty Tennessee Average of
reported wages. $50,000 Money could potentially be withheld by the
contracting agency and contractors could theoretically be considered in breach of contract. Private right of action for aggrieved individuals.
Tennessee Code §§12-4-401 to 12-4-415; Kelly Jo Dyer, Department of Labor and Workforce Development: Labor Standards Division (615-741-2858), telephone interviews July and September, 2006 state method threshold penalty Texas Wages are set by
the awarding agency
None
Texas Gov’t Code §§2258.001 to 2258.058.
76
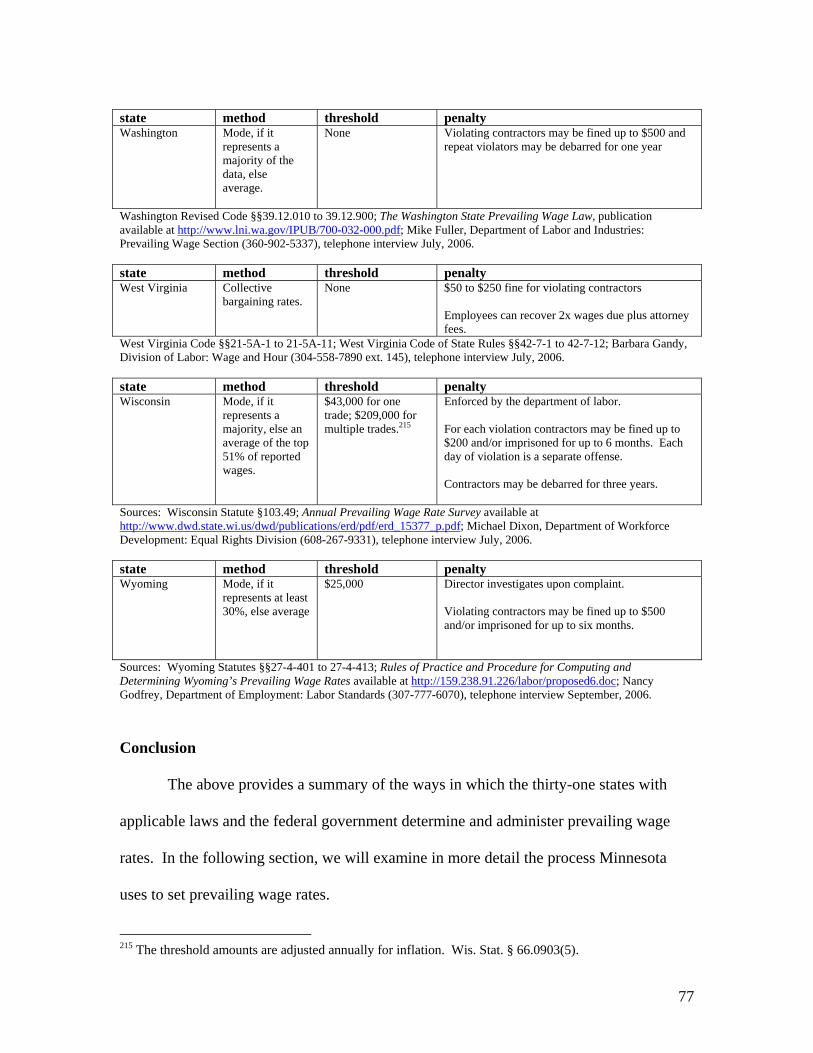
state method threshold penalty Washington Mode, if it
represents a majority of the data, else average.
None Violating contractors may be fined up to $500 and repeat violators may be debarred for one year
Washington Revised Code §§39.12.010 to 39.12.900; The Washington State Prevailing Wage Law, publication available at http://www.lni.wa.gov/IPUB/700-032-000.pdf; Mike Fuller, Department of Labor and Industries: Prevailing Wage Section (360-902-5337), telephone interview July, 2006. state method threshold penalty West Virginia Collective
bargaining rates. None $50 to $250 fine for violating contractors
Employees can recover 2x wages due plus attorney fees.
West Virginia Code §§21-5A-1 to 21-5A-11; West Virginia Code of State Rules §§42-7-1 to 42-7-12; Barbara Gandy, Division of Labor: Wage and Hour (304-558-7890 ext. 145), telephone interview July, 2006. state method threshold penalty Wisconsin Mode, if it
represents a majority, else an average of the top 51% of reported wages.
$43,000 for one trade; $209,000 for multiple trades.215
Enforced by the department of labor. For each violation contractors may be fined up to $200 and/or imprisoned for up to 6 months. Each day of violation is a separate offense. Contractors may be debarred for three years.
Sources: Wisconsin Statute §103.49; Annual Prevailing Wage Rate Survey available at http://www.dwd.state.wi.us/dwd/publications/erd/pdf/erd_15377_p.pdf; Michael Dixon, Department of Workforce Development: Equal Rights Division (608-267-9331), telephone interview July, 2006. state method threshold penalty Wyoming Mode, if it
represents at least 30%, else average
$25,000 Director investigates upon complaint. Violating contractors may be fined up to $500 and/or imprisoned for up to six months.
Sources: Wyoming Statutes §§27-4-401 to 27-4-413; Rules of Practice and Procedure for Computing and Determining Wyoming’s Prevailing Wage Rates available at http://159.238.91.226/labor/proposed6.doc; Nancy Godfrey, Department of Employment: Labor Standards (307-777-6070), telephone interview September, 2006. Conclusion The above provides a summary of the ways in which the thirty-one states with
applicable laws and the federal government determine and administer prevailing wage
rates. In the following section, we will examine in more detail the process Minnesota
uses to set prevailing wage rates.
215 The threshold amounts are adjusted annually for inflation. Wis. Stat. § 66.0903(5).
77

SECTION FIVE:
DOES THE MINNESOTA DEPARTMENT OF LABOR AND INDUSTRY USE APPROPRIATE METHODS TO SET PREVAILING WAGE RATES?
Generally, the methods used to determine the prevailing rate are a function of
historical context, state policy, and the data available. In Minnesota, the introductory
policy statement reads:
It is in the public interest that public buildings and other public works be constructed and maintained by the best means and highest quality of labor reasonably available and that persons working on public works be compensated according to the real value of the services they perform.216
It is clear from the work of Theiblot217 and the foregoing analysis that each of the 31
“Little Davis-Bacon Acts” and the federal Davis-Bacon Act has unique characteristics in
the way they determine the “prevailing” rate for an “area.” In this section, we assess the
specifics of the Minnesota approach and make some recommendations as to how the
process might be improved. The key question is: “Does the Department of Labor and
Industry use appropriate methods to set prevailing wage rates?”218
To address this question, we must examine both how the prevailing wage survey
is conducted and how the data is used to determine “prevailing rate.” While definitions of
“appropriate” may vary among interested parties, there are generally agreed upon
standards for empirical analysis by which to critically evaluate a study. The questions
researchers asked to assess the merits of a study are:
Is the survey instrument and process used to determine the prevailing rate valid?
216 Minn. Stat. § 177.41. 217 Thieblot, supra note 77. 218 State of Minnesota, Office of the Legislative Auditor, supra note 5.
78

Is the survey instrument and process used to determine the prevailing rate reliable?
Once we determine whether the process of data collection provides us with data that is
valid and reliable, we can then examine whether the mode is an appropriate measure for
determining the prevailing rate.
Validity and Reliability of Data
Validity is the extent to which “a procedure measures what it is intended to
measure.”219 If a process lacks validity then we cannot trust it to measure what we want it
to measure. In all survey work and statistical analysis there is a degree of human and
process error. The key is to try to develop a process that increases the validity of the
instrument being used. The goal of any survey should be to answer the question it is
intended to answer. In the case of the Department of Labor and Industry’s prevailing
wage survey, the question is basically, “what is the area standard?”
Reliability “is the degree to which measurements are consistent and do not
contain error.”220 In other words, it is the degree to which a survey result may be
replicated. If a process is reliable, we should come to the same result using the same
process. This standard for the appropriateness of a particular measurement goes more to
consistency than whether or not a particular outcome measures what we would like it to
measure.
Survey data is subject to a variety of potential errors. Some errors result from the
sample selected. In the case of the Minnesota prevailing wage survey, this type of
sampling error is minimized as the State attempts to survey all contractors and other
interested parties who have worked on qualifying projects in the past 12 months. 219 Gary Heiman, Research Methods in Psychology, Boston: Houghton Mifflin Company, 2002, p. 72. 220 Ibid.
79

Surveys can also suffer from non-sampling errors. These errors result from faulty
responses, a lack of responses, or processing errors. Again, the key in any survey research
is to try to create processes that are likely to reduce error.
If we examine the Department’s rules for making prevailing wage determinations,
it is clear that the State has created a process that can be easily replicated and that
provides valid data on which to base the prevailing rate of an area.221 The rules for
determining the prevailing rate in Minnesota are currently very clear, thereby decreasing
the likelihood of human and process error. Unlike some other states where the
determination of the prevailing rate is decentralized or left to the discretion of a state
commissioner,222 the law in Minnesota specifies a process that is concrete and based on
data. Thus, it is more likely that the “prevailing rate” is tied to wages actually paid. Such
a concrete process increases both the reliability and validity of the data.
The rules are specific concerning which types of projects will be included in
prevailing wage surveys, as well as the geographic scope of a given wage determination.
In Highway and Heavy Construction, prevailing wage determinations are based on work
performed within 10 defined “areas” of the state and cover projects where the estimated
total cost of the project is $25,000 or more.223 Commercial construction rates are to be
set at the county level and consider all projects where the total estimated cost is at least
$2,500.224
221 Minn. R. § 5200.1050. 222 Cf. 820 ILCS 130 § 7 (permitting either the awarding agency in Illinois or the Director of Labor to set rates, though the administrative regulations do not specify how); Tex. Gov't Code § 2258.022 (authorizing the contracting agency to determine the prevailing rate). 223 Minn. R. § 5200.1030. 224 Minn. R. § 5200.1035.
80

In both cases, new estimates are based on work done in the previous 12 months
and there must be at least two observations in order to set a rate.225 If there is insufficient
data because the two project criterion is not met, then there are specific guidelines to
determine rates. In the case of Highway and Heavy Construction, the most recent rate
will apply if there is insufficient data to issue a new wage determination.226 In the case of
Commercial Construction, the rate for the adjacent counties will be used if there is
insufficient data.227 If no rate for a specific class of work is then found, the rate will
remain as previously certified.228 From an analytical perspective, the specificity of the
process is what is important because it means that each survey can be replicated. As
stated above, this is crucial to ensure the reliability of the data.
The state takes other measures to ensure the reliability and validity of its data.
First, in developing the pool to be sampled the state tries to ensure a sample of the
whole—any public or private project completed in the previous 12 months that meets the
dollar minimums—thus making sure that all interested parties have the opportunity to
participate in the survey.229 The Department’s regulations require that it maintain mailing
lists of contractors, contractor associations, labor organizations and any other individual
that has requested to be notified when a survey is to be taken.230 Moreover, to ensure that
new contractors or other interested parties have not been overlooked, the Department is
mandated to contact county engineers, city engineers, city clerks, zoning officials and
others that might know of projects that might have been undertaken in the last 12
225 Minn. R. § 5200.1030, Subp. 2a; Minn. R. § 5200.1035, Subp. 2. 226 Minn. R. § 5200.1030, Subp. 2a. 227 Minn. R. § 5200.1035, Subp. 2. 228 Ibid. 229 Minn. R. § 5200.1050, Subp. 2. 230 Minn. R. § 5200.1050, Subp. 2b.
81

months.231 Such measures help ensure the validity of the data since the goal of the survey
is to determine the prevailing rate on all projects conducted in the previous 12 months.
What Minnesota does not do that could improve the reliability of the data is to
mandate that contractors return the surveys. As discussed in the previous section, some
states have made attempts to increase response rates. For example, in Wisconsin, if a
contractor does not submit a survey, he or she is then barred from appealing the certified
prevailing rate.232 In Maine, a contractor may be fined for not returning the wage
survey.233 In Tennessee, the state has introduced an on-line survey process to make
responding as easy as possible.234 The state official we spoke with reported a significant
increase in responses. Minnesota could consider one or more of these strategies to
increase response rates or could encourage return of surveys through economic incentives
such as a small tax break.
In order to ensure validity, the Department requires that individuals submit
prevailing wage data on forms that are approved by the Department and requires that all
forms be signed. By requiring that each form be signed verifying that the information is
“true and correct,” the Department is taking steps to ensure the validity of the data. The
form also contains a warning that if false data is willfully submitted, it may result in civil
or criminal prosecution. Moreover, any organization, person, or company that
purposefully submits false data will not be allowed to submit information for one to three
years and all information they have submitted will be excluded from wage
231 Minn. R. § 5200.1050, Subp. 2c. 232 DWD § 290.015. 233 26 M.R.S. § 1308. 234 Interview with Kelly Jo Dyer, Tennessee Labor Standards Division, 615-532-1347 (Sept. 2006).
82

determinations.235 A review of a random sampling of survey responses for accuracy
would further ensure the validity of the data.
The Department also attempts to ensure the validity of prevailing wage data by
permitting any individual, contractor organization, or labor organization 30 days to
petition for the reconsideration of a certified rate.236 An individual or organization
petitioning under this rule has the opportunity to present any data relevant to the request
for reconsideration.237 The Department is required to present all data supporting its
prevailing wage determination.238 Thereafter, the Department must decide whether to
modify or reaffirm its original determination.239 This review procedure permits the
introduction of additional data and allows for others to comment on the Department’s
process and further ensure its validity.
Such processes and procedures are important in any survey work because they
reduce the potential for erroneous data due to false reporting. As Thieblot has noted,
anytime self-reporting takes place, there is a chance that individuals, organizations, or
companies may choose to give false information.240 Due to the processes and controls
put in place by the Minnesota regulations, the likelihood of that sort of fraudulent or
misleading reporting is greatly diminished. Because the process for determining the
prevailing rate is so clearly specified, rates cannot be set in the arbitrary way Thieblot
fears.
235 Minn. R. § 5200.1050, Subp. 3a. 236 Minn. R. § 5200.1090. 237 Minn. R. § 5200.1090, Subp. 2. 238 Minn. R. § 5200.1090, Subp. 2. 239 Minn. R. § 5200.1090, Subp. 3. 240 A.J. Thieblot, “Fraud Prevalent in Prevailing Wage Surveys,” Government Union Review 10.1 (Winter, 1997): 1-29; A.J. Thieblot, “The Twenty-Percent Majority: Pro-Union Bias in Prevailing Rate Determinations,” Journal of Labor Research 26.1 (Winter 2005): 99-134.
83

How Minnesota defines “prevailing wage”
Other than the survey instrument itself, two other areas deserve attention in the
critical assessment of Minnesota’s prevailing wage determination. The first is: How does
Minnesota determine “prevailing rate?” The second is: How are particular classifications
defined?
As noted in Section Four, states determine what is “prevailing” by a variety of
criteria. Some, like New Jersey, New York and Ohio, use the collectively bargained
rate.241 The philosophy behind this approach is that the collectively bargained rate is set
by an agreement between contractors and union representatives in the area and represents
the most recent market conditions. Others, like Minnesota, Indiana, and Missouri, seek
the mode.242 The philosophy in these states is that the “prevailing rate” is the rate that is
paid to the greatest number of workers. Other states, like Arkansas, Delaware and New
Mexico, and the federal Davis-Bacon regulations, use the mode if it achieves some
designated criteria like thirty or fifty percent of the workforce and, if not, then a mean or
weighted average is used.243 Maine was the only state surveyed that used a median.244
Some states give broad discretion to an individual or agency to make prevailing rate
determinations.245
In Minnesota, once data is collected the rate certified as prevailing is the modal
rate or the rate paid to the greatest number of workers in a specific classification.247 The
241 N.J. Stat. § 34:11-56.26; NY CLS Labor § 220(5); ORC Ann. § 4115.05. 242 Minn. Stat. § 177.42, Subd. 6; Indiana Code § 5-16-7; Missouri Dep’t of Labor, “Missouri Prevailing Wage Law,” http://www.dolir.mo.gov/ls/brocuhres/13-AI.pdf. 243Arkansas Dep’t of Labor, Prevailing Wage Division: Rules and Regulations, Ch. 2, § 2.100; Delaware Code 29 §§ 6960(a); New Mexico Admin. Code § 11.1.2.11; 29 C.F.R. Sec. 1.2(a)(1). 244 26 M.R.S. § 1304. 245 Tex. Gov't Code § 2258.022; 820 ILCS 130 § 7. 247 Minn. Stat. § 177.42, Subd. 6.
84
“prevailing rate” is intended to reflect “area standards” and includes contributions for all
wages and fringe benefits.248
If a distribution is bimodal (two wage rates at which there is an equal number of
workers), the higher rate is used.249 In Minnesota, the certified rate is the collectively
bargained rate for approximately fifty percent of the existing wage determinations.250 If
the wage rate determined is the collectively bargained rate for that area or county, then
the most recent collectively bargained rate is used.251 Moreover, if the collectively
bargained rate changes during the 12 months after it is deemed to be the “prevailing” rate,
then the new rate is to be certified as the prevailing rate.252 Such a provision ensures that
the current “prevailing” rate is consistent with developments in Minnesota’s labor
market. There is no such provision when the certified rate is not the collectively
bargained rate. The Department may consider a cost of living adjustment so that the
prevailing rate does not lag behind inflation.
Measures of Central Tendency
The goal of Minnesota’s prevailing wage rate determination is to identify a typical
or predominant rate so as to assure a high quality of labor. In order to determine whether
the mode is an “appropriate” method for determining the prevailing rate, it is relevant to
consider the various measures of central tendency: mean, median, and mode.
248 Ibid. 249 Minn. R. § 5200.1060, Subp. 2(c). 250 Minnesota Department of Labor and Industry, Proposed Permanent Rules Governing Apprentice Wages: Statement of Need and Reasonableness, December 21, 2005, p. 15 (noting that "a bare majority" of the certified prevailing wage rates were collective bargaining rates). 251 Minn. R. § 5200.1060, Subp. 3. 252 Minn. R. § 5200.1060, Subp. 3-5.
85
The arithmetic mean (or the average, simple mean) is computed by summing all
numbers in an array of numbers (xi) and then dividing by the number of observations (n)
in the array.
Mean = = Σ Xi /n, the sum is over all i's.
The mean uses all of the observations, and each observation affects the mean. The mean
is sensitive to extreme values; i.e., extremely large or small data can cause the mean to be
skewed toward the extreme data; however, it is still the most widely used measure of
location.253 In some cases, the data in the sample or population should not be weighted
equally; rather, each value should be weighted according to its importance. In those states
that use the mean as the measure of central tendency to calculate prevailing rate, the
weighted mean is typically used.
The median is the middle value in an ordered array of observations. If there is an
even number of observations in the array, the median is the average of the two middle
numbers. If there is an odd number of data in the array, the median is the middle number.
The median is often used to summarize the distribution of an outcome. Generally, the
median provides a better measure of location than the mean when there are some
extremely large or small observations; i.e., when the data are skewed to the right or to the
left.254 For this reason, median income is used as the measure of location for U.S.
household income. The median is often used in cases in which we want to know the
middle. Note that if the median is less than the mean, the data set is skewed higher. If the
median is greater than the mean, the data set is skewed lower.
253 Dr. Hossein Arsham, Distinguished Research Professor of Statistics and Management Science at the University of Baltimore, “Revealing Facts from Figures,” http://ubmail.ubalt.edu/~harsham/Business-stat/opre504.htm, accessed October 3, 2006. 254 Ibid.
86

The mode is the most frequently occurring value in a set of observations.255 Why
use the mode? The classic example is the shirt/shoe manufacturer who wants to decide
what sizes to introduce and so chooses to produce the most commonly occurring ones.
The manufacturer is trying to determine what is a typical or predominant value.
Similarly, the mode is widely used for prevailing wage because it determines a typical or
predominant value.256
Almost all standard statistical analyses are based on the assumption that the
population is homogeneous. Thus, determining a central tendency is particularly difficult
when the data is heterogeneous. In other words, because not all carpenters’ skills are the
same, and they may vary widely, saying that the mean carpenter makes X amount does
not tell us anything about what a journeyman carpenter makes.
If wages in the construction industry were normally distributed it would not
matter if we used the mode, mean, or median. However, construction worker wages are
typically skewed lower, with many low-skill workers making low wages. The median and
mean are thus significantly pulled down by this “tail” of low-wage workers, and the
median and mean fail to represent an appropriate measure of journey worker wages. In
the construction industry, the median is nearly always less than the mean. For this reason,
only Maine uses the median. If the goal of prevailing wage laws is to ensure a high
quality of labor by requiring the rates that skilled journey workers make, using the
median is not consistent with that goal.
Aside from simply using the collectively bargained rate, the mode and the mean
are the most typically used methods for determining prevailing rate. Azari-Rad, et al., use
255 Ibid. 256 When data has two modes it is bimodal. Data with more than two modes is multimodal.
87
the example of plumbers to explain why the mode tends to be superior to the mean in
reflecting the journey worker rate given the nature of data available for determining the
prevailing rate:
Take plumbers as an example. Unionized plumbers, having gone through a five year apprenticeship program, having become trained in a variety of skills are lumped together with other plumbers whose skills consist of on the job experience at fixing sinks. Combining low-wage handy-men with high wage, skilled plumbers creates a wage distribution where the most commonly found wage (the mode) is a good deal higher than the average wage which is being pulled down by the wages of residential plumbers. This is particularly true in states where plumbers do not have to be individually licensed. Thus the divergence between two statistically accepted measures of central tendency of a distribution- the mean and the mode – ends up mattering in prevailing wage determinations in construction.257
Given the stated intention of the Minnesota statue “that public works be
constructed…by the highest quality of labor reasonably available,”258 the mode is an
appropriate measure of which rates are “prevailing.” Currently, the mode has been
determined to be the collectively bargained rate for a journey worker in about half of the
prevailing wage determinations in Minnesota.259 In the other counties, the prevailing rate
is the mode for that area. In either case, the prevailing rate reflects the market conditions
for a particular occupation in that industry in that area of the state and thus is a valid
measure of area standards.
Some groups have urged the use of median wage rates established by the
Minnesota Department of Employment and Economic Development (“DEED”) to replace
257 Hamid Azari-Rad, Peter Philips and Mark J. Prus, “Introduction: Prevailing Wage Regulations and Public Policy in the Construction Industry,” in The Economics of Prevailing Wage Laws, eds. Hamid Azari-Rad, Peter Philips and Mark J. Prus (Ashgate: Burlington VT) 2005, p. 15. 258 Minn. Stat. § 177.41. 259 Minnesota Department of Labor and Industry, Proposed Permanent Rules Governing Apprentice Wages: Statement of Need and Reasonableness, December 21, 2005, p. 15 (noting that “a bare majority” of the certified prevailing wage rates were collective bargaining rates).
88

the current mode method.260 Using the DEED median would be an inappropriate
measure of area standards for “quality” labor as intended by Minnesota’s law. For the
reasons explained above, a median is inapt as a measure of journey worker wages in the
construction industry.
In research conducted earlier in the year, Jordan, et al., found that the DEED
median rate for construction workers averaged approximately 40% less than the
prevailing rate.261 Of course, prevailing rates include benefits. If we assume that all
employers provide benefits (based on empirical evidence this is not a good assumption),
we can compare the base prevailing rate with the DEED rate --the difference remains on
average approximately 20%.
The DEED rate is not a good indicator of the market for construction workers for
a variety of reasons. First, the DEED rate is an occupational rate and does not control for
industry or the type of construction as the current system does. Not everyone classified
as a “carpenter” is in the construction industry. In states like Minnesota, where
construction workers are often laid off for a significant portion of the winter, there needs
to be what economists call a “compensating differential” to account for the seasonal
nature of the work. In other words, the construction worker’s wage must be higher to
compensate a construction worker both for having to work in poor weather and for
working only intermittently. In Minnesota, the typical laborer in the state only works
1,668 hours or approximately 42 weeks per year. The typical carpenter works 1473 hours
or about 37 weeks. A typical “normal” work year is 2,080 hours. A construction worker
therefore must make his or her money when s/he is actually able to be on the job. Current
260 See, e.g., Minnesota Taxpayers Association, supra note 64. 261 Lisa Jordan, et al., “Analysis of Proposed Change in Construction Trades Apprenticeship Wages,” February, 2006 (on file with author).
89

prevailing wage determinations account for this because they rely on data specific to the
construction industry.
Secondly, the DEED rate is based on very broad occupational classifications.
Accordingly, it includes data pertaining to workers lacking the skill specialization
necessary to competently complete most public construction. Consider, for example, how
the DEED rate is calculated for a carpenter. The DEED rate includes all those who might
consider themselves a carpenter: those in factories, those working at schools, those who
do other sorts of maintenance and, of course, construction. The problem is that these
categories are not comparable. DEED wage data is quite heterogeneous, and is thus
susceptible to outlier and skewing data. DEED has not chosen a method of determining
wage standards that accounts for that heterogeneity. Indeed, the median wage rate is the
least suitable for that purpose. In short, DEED’s method is ill-suited for determining the
prevailing wage in the construction industry.
Worker Classifications
No assessment of the method of determining Minnesota’s prevailing wage can be
complete without considering how the relevant worker or trade “classifications” are
defined. This is perhaps the least methodologically sound aspect of Minnesota’s
prevailing wage determinations. The Department’s job classifications are somewhat
susceptible to problems of content validity.262 In other words, how can we be assured that
the wages reported accurately reflect a particular set of skills? Minnesota Rule Section
5200.1100 identifies the job classification that must be used for reporting.263 In the
unionized context, the skills necessary for a carpenter or millwright are well understood
262 Heiman, supra note 219, at 78. 263 Minn. R. § 5200.1100.
90

due to the nature of union apprenticeship programs. In other contexts, such definitions
are not as clear.
The rules state: “Each class of labor shall be based upon the particular nature of
the work performed with consideration given to those trades, occupations, skills, or work
generally considered within the construction industry as constituting distinct classes of
labor.”264 The language continues, “In determining particular classes of labor, the
department shall consider work classifications contained in collective bargaining
agreements, apprenticeship agreements on file with the department, the ‘United States
Department of Labor Dictionary of Occupational Titles,’ and customs and usage
application to the construction industry.”265 The Department is clearly trying to create a
standard that incorporates norms of the construction industry. In fact, the rules explicitly
exclude reporting of the wages of “apprentices, helpers, supervisors, or trainees.”266 The
rules are plainly intended to capture the prevailing wage rates for journey workers in a
particular class.
The state leaves the “primary responsibility for classifying individual workers” to
the contractors.267 This may lead to problems with content validity due to the fact that
contractors may have different definitions of the skills necessary to be deemed a member
of a particular craft. For example, consider the classification of “carpenter.” In filling
out a prevailing wage survey, union contractors would, by definition, only include those
carpenters who are journey persons. In the non-union sector however, these designations
(when not part of the licensed trade) become more arbitrary. Someone who has been
264 Minn. R. § 5200.1040. 265 Minn. R. § 5200.1040(E). 266 Minn. R. § 5200.1040(G). 267 Minn. R. § 5200.1040(F).
91

working for 20 years as a carpenter and is skilled in all aspects of the craft could be
listed, but so could a student who happens to work on construction sites during summer
breaks doing framing.
The chance of this type of content validity problem is the reason that some states
choose to use collectively bargained wages as the prevailing rates. The bargaining
process controls for extraneous variables that states do not wish to include. Another
solution to the problem is to use the mode or the most frequently paid wage. By using the
mode, particularly in wage data when wages are not informally distributed, we can help
control for the potential problem of content validity because those extraneous variables
will not impact the prevailing rate. For example, if we have 20 observations and all but
one reported carpenter wage is $20 and the 20th reported hourly wage is $8.50 per hour,
the prevailing rate would be $20.00 under the mode but only $19.43 under the mean.
Thus, the mode identifies the typical or predominant wage by controlling for extraneous
variables.
As pointed out above, no measure of central tendency is perfect unless the
collection of the data and the resulting distributions are also perfect. A measure is
appropriate if it provides both reliable and valid results given the available data. Based
on our review and comparisons with other states, the regulations that guide the Minnesota
Department of Labor and Industry are appropriate both in terms of process and analysis.
92

SECTION SIX:
ESTIMATED IMPACTS IN MINNESOTA OF CHANGES IN PREVAILING WAGE
In Section Three, we reviewed a number of studies considering the relationship
between prevailing wage and total costs of construction. The most useful analyses of
prevailing wage and its impact upon project cost use regression analysis to control for the
factors other than prevailing wage that might impact total cost. The preponderance of the
data suggests that prevailing wage has little or no impact on total costs of construction,
although there is evidence of a short-term cost increase at the introduction of a prevailing
wage law.
In this section, we attempt to create a partial estimate of the impact on the state if
the prevailing wage statute is changed or repealed. This analysis is limited in scope and
only considers impacts on the income of construction employees in the state and the
resulting impact on state revenues.
Such an analysis may either overestimate or underestimate the costs of a change
in prevailing wage because it does not account for potentially relevant factors. For
example, a reduction in general construction wages in the state might have some impact
on the ability of consumers to buy other products. Moreover, this analysis does not
account for the costs to the state that a weakening of the law might have in terms of cost
overruns, increased injury rates, the socialization of costs, and weakened apprenticeship
training programs. Additionally, any analysis of prevailing wage is made more difficult
93

by a lack of data. For example, no state agency we contacted could tell us the value of
public projects covered by prevailing wage.268
Nonetheless, previous research gives us guidance and even offers insights on
Minnesota in particular.269 We have discussed the studies related to Minnesota’s
construction industry and the strengths and weaknesses of each, but for ease let us
summarize them here:
• Walter concluded: “The available evidence suggests that prevailing wage requirements do not imply significant construction cost increases, and that the proven benefits of such measures demand their adoption and full enforcement….” He did find a potential 1.8% savings if the prevailing wage law was repealed, though he suggested that it is likely an overestimate because it is not based on realistic assumptions. He also found that in order to conclude that there could be a 10% savings in total costs, one would have to make “highly unrealistic” assumptions.270
• The Minnesota Taxpayer Association found an estimated 1.33% to 1.96%
increase in total construction costs if the state moved from the mode to the Davis-Bacon standard. They found a 7.4% to 10% reduction in total project costs if the state moved to the DEED median. They concluded that the state could save $126 and $171 million by switching to the DEED rate.271
As noted earlier both of these studies fail to control for a variety of factors that
impact the total cost of construction and, as such, provide little valuable data. Only one
study that explicitly considers Minnesota controls for a range of variables that could
impact cost:
• Kelsay, et al., use Dodge data to compare states in the North Central States Region, which includes Minnesota – a region they believe has reasonably similar conditions. Using descriptive data, they find that “there is no statistically significant difference for mean cost of construction between
268 The Census of Construction does have a value for all projects paid for with state funds, but that does not necessarily tell us how much is covered by prevailing rate. 269 For a more detailed analysis of previous studies on the impact of prevailing wage on total costs, see Section three. 270 Walter, supra note 56, at 7-8. 271 Minnesota Taxpayers Association, supra note 64.
94

prevailing and non-prevailing wage states….”272 They also use regression analysis in order to isolate those variables that might lead to cost differentials. They conclude, “the presence of a prevailing wage law does not have a statistically significant impact on the total costs of construction projects in the twelve-state region.”273
While each of these provides an analysis of the impact of changing Minnesota’s
prevailing wage regulations on total construction costs in the state, none provides a
broader analysis of the potential impact such a change might have on construction
workers and ultimately state budgets. Walter does provide a descriptive summary of the
costs the state would likely incur, including increased injury rates, reduced benefits paid
to workers, and reduced tax revenues, but no empirical analysis is offered.
Following the methodology used by Kelsay et al. we will conduct a similar
analysis in order to address the questions:
• How might a change in Minnesota’s prevailing wage law impact construction employees in the state?
• How might a change in Minnesota’s prevailing wage law impact the state’s
budget?
In considering the first question, it is clear based on previous research that if the
prevailing wage statute is weakened or repealed, construction workers in Minnesota
would experience a loss in total compensation. As noted earlier, Petersen and Godtland
estimated that after states repealed their prevailing wage laws, total compensation to
construction workers dropped by 20% while wages decreased by 18% and average
benefits by 79%.274 Philips estimated an 8% drop if a state moves from a strong
prevailing wage law to a weak one (as the move from the mode to the DEED median
272 Kelsay, et al., supra note 64, at 33. 273 Ibid p. 39. 274 Petersen and Godtland, supra note 106, at 195.
95

would be).275 Kessler and Katz found a 2-4% decline in construction worker wages
following prevailing wage repeal over the long run.276
For this analysis we draw on research done by a variety of other authors:
• We will consider a range of estimates in evaluating the impact of a change in prevailing rates on construction worker wages. 277 Based on previous research construction worker wages would likely drop anywhere from 4% to 18%.278
• Any reduction in construction worker wages would have both direct and
indirect effects on the state budget. We draw on data gathered and analyzed by the Bureau of Economic Analysis in order to calculate the indirect impacts.
• We use 2003 employment and wage data available from the Minnesota
Department of Employment and Economic Development. Based on DEED estimates, in 2003 there were 131,854 workers earning a mean wage of $873 per week or $45,396 per year.279
Given these assumptions, we find the following impacts of weakening or
repealing Minnesota’s prevailing wage statute:
275 See Peter Philips, “Results of a Multivariate Regression Analysis of Construction Worker Incomes with a Focus on the Implementation of Prevailing Wage Policies,” Working Paper, Economics Department, University of Utah, 1996. Philips has made similar estimates of the wage loss resulting from the repeal of prevailing wage laws. See Reich, supra note 101; Philips, et. al, supra note 12, at 16-17 (finding a 7.5% wage loss for all construction workers); conversation with Peter Philips, October 2006. 276 Kessler and Katz, supra note 104, at 272-273. 277 We consider here the estimates suggested by Katz and Kessler, Philips, and Petersen and Godtland. While the Peterson and Godland study seems the most complete, we choose to consider three options in order to analyze a variety of potential scenarios. 278 We use the higher of the two estimates because, as the authors note, the rate of unionization in the industry will impact the overall loss to workers. Since Minnesota has a relatively high unionization rate, it is likely Minnesota construction workers would lose more than workers in states with lower unionization rates. See http://www.bls.gov/news.release/union2.nr0.htm for current unionization information. 279http://www.positivelyminnesota.com/lmi/tools/qcew/display.asp?geog=2701000000&AreaName=Minnesota&date=20050001&level=3&strCode=23&codeType=N&ownership=00&ownership=50&view_select=View+Selected+Data. Mean wages range from a high of $59,530 to a low of $23,370 according to www.bls.gov/oes/current/mean/oes_mn.htm#b47-0000.
96

Impact on the Wages of Minnesota Construction Workers
Estimated Impact on the Wages and Employment of Minnesota’s Construction
Workers (Based on 2003 data)
4% (Katz estimate)
8% (Philips estimate)
18% (Petersen estimate)
Old Annual Wage $45,396 $45,396 $45,396 Loss in Wage $1,816 $3,632 $8,171 New Annual Wage $43,580 $41,764 $37,225 Loss to Minnesota Workers
$239,446,864 $478,893,728 $1,077,379,034
Potential Employment Growth280
1,055 2,189 4,747
Net loss to Minnesota Workers
$193,469,964 $387,481,670 $900,671,959
Based on the range of estimates suggested in the research (4%, 8%, and 18%), if
the prevailing wage statute is repealed or weakened, annual construction wages would
fall, on average, between $1,816 and $8,171 per year. In other words, the average salary
would fall to between $37,225 and $43,580 per year. This drop in salary represents a
direct loss to construction employees in Minnesota of between $239 million and $1.1
billion dollars.
However, other employees in Minnesota may benefit, as the drop in wages might
lead to an increase in overall employment. Simple demand theory of labor suggests that
as a firm’s wage payments fall, employment will increase. This increase in employment
may also result from the decline in skill level we would expect to occur over time as
wage rates fall. Evidence from other states that have repealed their prevailing wage laws
has demonstrated a consequent slight increase in employment in the construction
280 Based on a price elasticity of demand for labor of .20. See Kelsay, et al., supra note 64, at 79 for references on this assumption.
97
industry. Following the lead of the Kelsay study, we assume that the price elasticity of
demand for labor is .20.281
Assuming that the growth in construction jobs does not occur at the expense of
another sector (which is doubtful since the current Minnesota unemployment rate is only
3.8%282), and that no workers leave the construction industry as a result of a drop in
wages, we can expect a slight growth in overall employment. Given the price elasticity
of demand of .20, we could expect an additional 1,055 to 4,747 workers, resulting in
additional new household income of between $46 and $176.7 million. Therefore, the net
loss to construction households in Minnesota would be between $193 and $901 million
dollars per year.
Direct Impact on State Tax Receipts
If Minnesota’s prevailing wage statute is weakened, we can expect a drop in the
aggregate income of construction workers. Such a drop in income will doubtless have an
impact on state income tax receipts, both directly and indirectly. Given the current
income tax rate of 7.05%,283 a construction worker in Minnesota would have paid an
average of $3,199 to the state in income taxes in 2003. This amounts to $422 million in
income taxes paid by construction workers. If prevailing wage is weakened actual taxes
collected would drop to between $2,624 and $3,072 per household. This amounts to
between $358.5 and $408 million (this number includes adjustment for the potential
281 See Kelsay, et al., supra note 64, at 79 for references on this assumption. 282 See Minnesota Dep’t of Employment and Economic Development, “Unemployment Statistics for the U.S. and MN, August 2006,” available at http://www.positivelyminnesota.com/lmi/tools/laus/display.asp?geog=0000,2701. 283 Minnesota Department of Revenue, “Individual Estimated Tax Payments for 2006,” available at http://www.taxes.state.mn.us/taxes/individ/instructions/m14_inst.pdf, Accessed August 31, 2001.
98
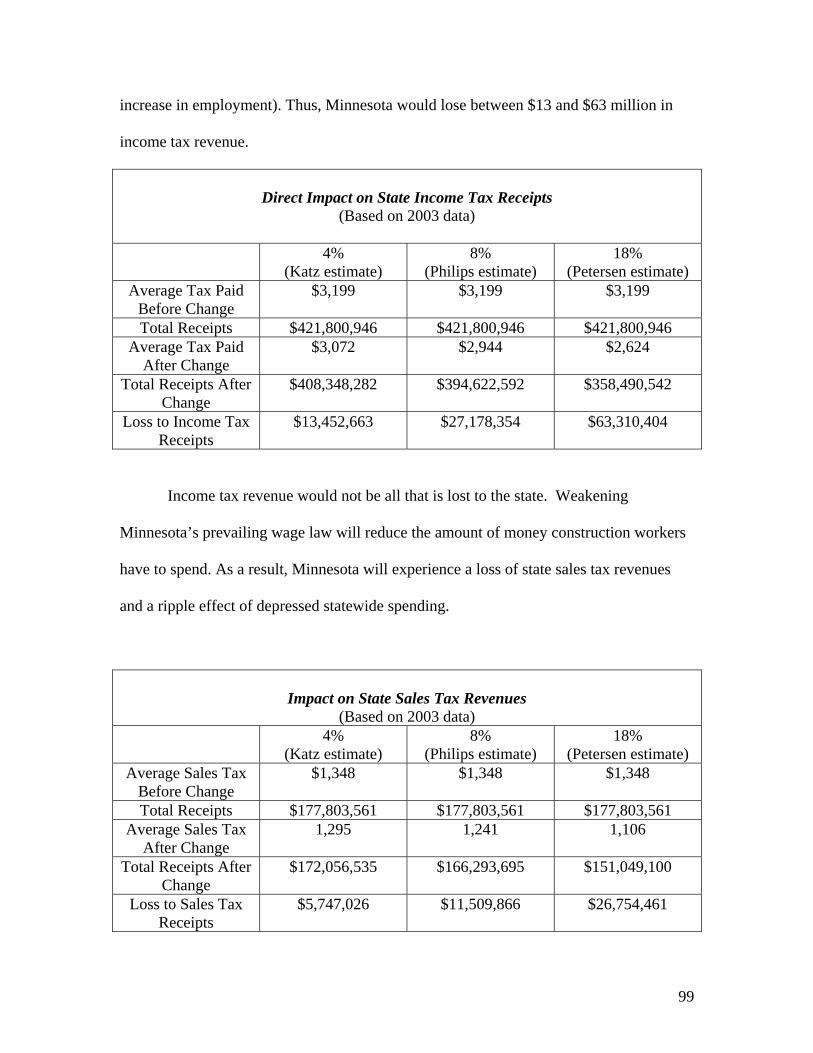
increase in employment). Thus, Minnesota would lose between $13 and $63 million in
income tax revenue.
Direct Impact on State Income Tax Receipts
(Based on 2003 data)
4% (Katz estimate)
8% (Philips estimate)
18% (Petersen estimate)
Average Tax Paid Before Change
$3,199 $3,199 $3,199
Total Receipts $421,800,946 $421,800,946 $421,800,946 Average Tax Paid
After Change $3,072 $2,944 $2,624
Total Receipts After Change
$408,348,282 $394,622,592 $358,490,542
Loss to Income Tax Receipts
$13,452,663 $27,178,354
$63,310,404
Income tax revenue would not be all that is lost to the state. Weakening
Minnesota’s prevailing wage law will reduce the amount of money construction workers
have to spend. As a result, Minnesota will experience a loss of state sales tax revenues
and a ripple effect of depressed statewide spending.
Impact on State Sales Tax Revenues
(Based on 2003 data) 4%
(Katz estimate) 8%
(Philips estimate) 18%
(Petersen estimate) Average Sales Tax
Before Change $1,348 $1,348 $1,348
Total Receipts $177,803,561 $177,803,561 $177,803,561 Average Sales Tax
After Change 1,295 1,241 1,106
Total Receipts After Change
$172,056,535 $166,293,695 $151,049,100
Loss to Sales Tax Receipts
$5,747,026 $11,509,866 $26,754,461
99

To predict the amount of sales tax revenues lost in the event of a legislative
change, we must first estimate the average amount a construction worker would spend on
sales taxable items. According to the Bureau of Labor Statistics, those who make
between $37,225 and $41,492 (the estimated wage rates) report a propensity to consume
between 92% and 100% of their income.284 This means the average construction worker
in Minnesota will tend to spend all or nearly all of his or her earnings. As wage rates fall,
construction workers will have less to spend. Consequently, the state will not collect as
much in sales tax revenues.
Estimates suggest that in Minnesota about 45.7% of what each construction
worker makes will be spent on items that are subject to state sales taxes. 285 Thus,
approximately 46% of every dollar a construction worker in Minnesota earns will be
spent on goods and services that are sales taxable. Using Minnesota’s general sales and
use tax rate of 6.5%, the sales tax revenues not collected would range from $5.7 to $27
million. Of course, this does not account for losses to additional sales taxes that are
charged by counties or municipalities.
Indirect Impacts on State Tax Receipts
As noted above, if construction workers have less money, they will spend less and
thereby impact the state. When a construction worker spends an extra dollar, that dollar
can then be spent by its recipient, and again by another recipient.
284 Bureau of Labor Statistics, “Consumer Expenditures in 2001,” Report 966 <http://www.bls.gov/cex/csxann01.pdf, Accessed August 31, 2006. 285 See generally Kelsay, et al., supra note 64.
100

Based on input-output analysis conducted by the Bureau of Economic Analysis,286
in Minnesota the earnings multiplier for the construction industry is 1.9729. In other
words, for every dollar lost or gained by a worker in the construction industry, incomes in
all households in the state decrease or increase by 1.9729. Thus, we must also consider
what happens to non-construction households if we are to assess total impacts on the
state.
Indirect Impacts on Minnesota Employees and the State Budget
(Based on 2003 Data) 4%
(Katz estimate) 8%
(Philips estimate) 18%
(Petersen estimate) Income Loss to
Non-Construction Households
$188,226,928 $376,980,917
$876,263,749
Income Tax Losses $13,269,998 $26,441,821
$61,776,594
Sales Tax Losses $5,591,281 $11,197,949
$26,029,415
Using the multiplier supplied by the Bureau of Economic Analysis, we can expect
a decline in non-construction household income of between $188 and $876 million. State
income tax receipts from non-construction households would then fall by between $13
and $26 million, and state sales tax receipts would decline by between $5.6 and $26
million.
Conclusion
If one considers both the direct and indirect impact of weakening or repealing
Minnesota’s prevailing wage law, income in the state will likely be cut between $382
286 See the Appendix to this section for a brief description of the input-output the BEA uses to calculate the RIMS II multiplier.
101

million and $1.8 billion. As a result, the state might expect a reduction in income taxes of
between $27 and $125 million and a reduction in sales tax income of at least $11 million.
Total Impact on Wages and State Tax Receipts
4%
(Katz estimate) 8%
(Philips estimate) 18%
(Petersen estimate) Income Loss to
Minnesota Households $381,696,892 $764,462,586
$1,776,935,708
Income Tax Loss $26,540,759 $53,620,175
$124,905,096
Sales Tax Loss $11,338,308 $22,707,815
$52,783,876
Estimated Total Revenue Loss
$37,879,067 $76,327,990
$177,688,972
Several of the available studies compare these types of economic losses to the
state to any potential savings due to repeal or weakening of prevailing wage laws.
However, as discussed in the literature review, we can find no convincing evidence of
significant savings in total cost when prevailing wage laws are repealed or weakened.
Thus, based on the foregoing analysis, we conclude that a change in prevailing wage in
Minnesota would likely lead to a decline in both construction employee income and state
revenues.
102

GENERAL CONCLUSIONS
The aim of this analysis has been to support the work of the Minnesota
Legislative Auditor’s Office. We have used the currently available research in order to
respond to the questions raised by the auditor.
We have reviewed as much of the data as possible in the time available and have
benefited from conversations with Peter Philips, Kevin Duncan, Mark Prus, Researchers
at the Minnesota Taxpayers Association, John Yunker, and Steven Allen. We would like
to thank each for their time and insights.
Research in the area of prevailing wage is difficult due to a lack of good data both
on the dollar value of prevailing wage projects and on worker productivity. Moreover,
much of the research that does exist does not focus on Minnesota. Therefore, it would be
advisable to conduct further research on the impact of prevailing wage on total
construction costs in Minnesota.
103

SECTION SIX APPENDIX
Taken from the Bureau of Economic Analysis website: http://bea.gov/bea/regional/rims/brfdesc.cfm; accessed September 21, 2006
Regional Multipliers from the Regional Input-Output Modeling System (RIMS II): A Brief Description
Overview
Effective planning for public- and private-sector projects and programs at the State and local levels requires a systematic analysis of the economic impacts of these projects and programs on affected regions. In turn, systematic analysis of economic impacts must account for the interindustry relationships within regions because these relationships largely determine how regional economies are likely to respond to project and program changes. Thus, regional input-output (I-O) multipliers, which account for interindustry relationships within regions, are useful tools for conducting regional economic impact analysis.
In the 1970's, the Bureau of Economic Analysis (BEA) developed a method for estimating regional I-O multipliers known as RIMS (Regional Industrial Multiplier System), which was based on the work of Garnick and Drake. /1/ In the 1980's, BEA completed an enhancement of RIMS, known as RIMS II (Regional Input-Output Modeling System), and published a handbook for RIMS II users. /2/ In 1992, BEA published a second edition of the handbook in which the multipliers were based on more recent data and improved methodology. In 1997, BEA published a third edition of the handbook that provides more detail on the use of the multipliers and the data sources and methods for estimating them.
RIMS II is based on an accounting framework called an I-O table. For each industry, an I-O table shows the industrial distribution of inputs purchased and outputs sold. A typical I-O table in RIMS II is derived mainly from two data sources: BEA's national I-O table (pdf) (html), which shows the input and output structure of nearly 500 U.S. industries, and BEA's regional economic accounts, which are used to adjust the national I-O table to show a region's industrial structure and trading patterns. /3/
Using RIMS II for impact analysis has several advantages. RIMS II multipliers can be estimated for any region composed of one or more counties and for any industry, or group of industries, in the national I-O table. The accessibility of the main data sources for RIMS II keeps the cost of estimating regional multipliers relatively low. Empirical tests show that estimates based on relatively expensive surveys and RIMS II-based estimates are similar in magnitude. /4/
BEA's RIMS multipliers can be a cost-effective way for analysts to estimate the economic impacts of changes in a regional economy. However, it is important to keep in mind that, like all economic impact models, RIMS provides approximate order-of-magnitude estimates of impacts. RIMS multipliers are best suited for estimating the impacts of small changes on a regional economy. For some applications, users may want to supplement RIMS estimates with information they gather from the region undergoing the potential change. Examples of case studies where it is appropriate to use RIMS multipliers appear in the RIMS II User Handbook.
To effectively use the multipliers for impact analysis, users must provide geographically and industrially detailed information on the initial changes in output, earnings, or employment that are associated with the project or program under study. The multipliers can then be used to estimate the total impact of the project or program on regional output, earnings, and employment.
RIMS II is widely used in both the public and private sector. In the public sector, for example, the Department of Defense uses RIMS II to estimate the regional impacts of military base closings. State transportation departments use RIMS II to estimate the regional impacts of airport construction and expansion. In the private-sector, analysts and consultants use RIMS II to estimate the regional impacts of a variety of projects, such as the development of shopping malls and sports stadiums.
RIMS II Methodology
RIMS II uses BEA's benchmark and annual I-O tables for the nation. Since a particular region may not contain all the industries found at the national level, some direct input requirements cannot besupplied by that region's industries. Input requirements that are not produced in a study region
104

are identified using BEA's regional economic accounts.
The RIMS II method for estimating regional I-O multipliers can be viewed as a three-step process. In the first step, the producer portion of the national I-O table is made region-specific by using six-digit NAICS location quotients (LQ's). The LQ's estimate the extent to which input requirements are supplied by firms within the region. RIMS II uses LQ's based on two types of data: BEA's personal income data (by place of residence) are used to calculate LQ's in the service industries; and BEA's wage-and-salary data (by place of work) are used to calculate LQ's in the nonservice industries.
In the second step, the household row and the household column from the national I-O table are made region-specific. The household row coefficients, which are derived from the value-added row of the national I-O table, are adjusted to reflect regional earnings leakages resulting from individuals working in the region but residing outside the region. The household column coefficients, which are based on the personal consumption expenditure column of the national I-O table, are adjusted to account for regional consumption leakages stemming from personal taxes and savings.
In the last step, the Leontief inversion approach is used to estimate multipliers. This inversion approach produces output, earnings, and employment multipliers, which can be used to trace the impacts of changes in final demand on directly and indirectly affected industries.
Accuracy of RIMS II
Empirical tests indicate that RIMS II yields multipliers that are not substantially different in magnitude from those generated by regional I-O models based on relatively expensive surveys. For example, a comparison of 224 industry-specific multipliers from survey-based tables for Texas, Washington, and West Virginia indicates that the RIMS II average multipliers overestimate the average multipliers from the survey-based tables by approximately 5 percent. For the majority of individual industry-specific multipliers, the difference between RIMS II and survey-based multipliers is less than 10 percent. In addition, RIMS II and survey multipliers show statistically similar distributions of affected industries.
Advantages of RIMS II
There are numerous advantages to using RIMS II. First, the accessibility of the main data sources makes it possible to estimate regional multipliers without conducting relatively expensive surveys. Second, the level of industrial detail used in RIMS II helps avoid aggregation errors, which often occur when industries are combined. Third, RIMS II multipliers can be compared across areas because they are based on a consistent set of estimating procedures nationwide. Fourth, RIMS II multipliers are updated to reflect the most recent local-area wage-and-salary and personal incomedata.
Applications of RIMS II
RIMS II multipliers can be used in a wide variety of impact studies. For example, the U.S. Nuclear Regulatory Commission has used RIMS II multipliers in environmental impact statements required for licensing nuclear electricity- generating facilities. The U.S. Department of Housing and Urban Development has used RIMS II multipliers to estimate the impacts of various types of urban redevelopment expenditures. In addition, BEA has provided RIMS II multipliers to numerous individuals and groups outside the Federal Government. RIMS II multipliers have been used to estimate the regional economic and industrial impacts of the following: opening or closing military bases, hypothetical nuclear reactor accidents, tourist expenditures, new energy facilities, energy conservation, offshore drilling, opening or closing manufacturing plants, shopping malls, new sports stadiums, and new airport or port facilities.
1. See Daniel H. Garnick, "Differential Regional Multiplier Models," Journal of Regional Science 10 (February 1970): 35-47; and Ronald L. Drake, "A Short-Cut to Estimates of Regional Input-Output Multipliers," International Regional Science Review 1 (Fall 1976): 1-17.
2. See U.S. Department of Commerce, Bureau of Economic Analysis, Regional Input-Output Modeling System (RIMS II): Estimation, Evaluation, and Application of a Disaggregated Regional Impact Model (Washington, DC: U.S. Government Printing Office, 1981). Available from the National Technical Information Service, 5285 Port Royal Road, Springfield, VA 22161; order no. PB-82-168-865; price $26.
105

3. See U.S. Department of Commerce, Bureau of Economic Analysis, The Detailed Input-Output Structure of the U.S. Economy, Volume II (Washington, DC: U.S. Government Printing Office, November 1994); and U.S. Department of Commerce, Bureau of EconomicAnalysis, State Personal Income, 1929-93 (Washington, DC: U.S. Government Printing Office, June 1995).
4. See U.S. Department of Commerce, Regional Input-Output Modeling System (RIMS II), chapter 5. Also see Sharon M. Brucker, Steven E. Hastings, and William R. Latham III, "The Variation of Estimated Impacts from Five Regional Input-Output Models," International Regional Science Review 13 (1990): 119-39.
106

Works Cited
Allen, Steven G. “Can Union Labor Ever Cost Less?” Quarterly Journal of Economics
102.2 (1987): 347-73.
Allen, Steven G. “Unionized Construction Workers Are More Productive.” Quarterly
Journal of Economics 99.2 (May, 1984) : 251.
Allen, Steven and David Reich. “Prevailing Wage Laws are Not Inflating.” Washington,
D.C. Center to Protect Workers’ Rights, (Dec. 1980).
Akerlof, George. “Gift Exchange and Efficiency-Wage Theory: Four Views.” American
Economic Review 74 (1984): 79-83.
Arsham, Dr. Hossein. Distinguished Research Professor of Statistics and Management
Science at the University of Baltimore, “Revealing Facts from Figures.”
http://ubmail.ubalt.edu/~harsham/Business-stat/opre504.htm, accessed October 3,
2006
Azari-Rad, Hamid. “Prevailing Wage Laws and Injury Rates in Construction,” in The
Economics of Prevailing Wage Laws, eds. Hamid Azari-Rad, Peter Philips and
Mark J. Prus. Ashgate: Burlington VT, 2005.
Azari-Rad, Hamid and Peter Philips. “Thoughtless Think Tanks: Sound Bite Thinking
About the History and Intent of Prevailing Wage Laws,” in The Economics of
Prevailing Wage Laws, eds. Hamid Azari-Rad, Peter Philips and Mark J. Prus.
Ashgate: Burlington VT, 2005.
Azari-Rad, Hamid and Peter Philips. “Race and Prevailing Wage Laws in the
Construction Industry: Comment on Thieblot.” Journal of Labor Research 24.1
(Winter 2003): 161-168.
107

Azari-Rad, Hamid, Anne Yeagle, and Peter Philips. “The Effects of the Repeal of Utah’s
Prevailing Wage Law on the Labor Market in Construction.” Restoring the
Promise of American Labor Law. Ithaca, NY: ILR Press, Cornell University,
(1994): 207-222.
Azari-Rad, Hamid, Peter Philips and Mark J. Prus. “Introduction: Prevailing Wage
Regulations and Public Policy in the Construction Industry,” in The Economics of
Prevailing Wage Laws, eds. Hamid Azari-Rad, Peter Philips and Mark J. Prus.
(Ashgate: Burlington VT) 2005.
Azari-Rad, Hamid, Peter Philips, and Mark Prus. “Making Hay When it Rains: The
Effect Prevailing Wage Regulations, Scale Economics, Seasonal, Cyclical, and
Local Business Patterns Have on School Construction Costs.” Journal of
Education Finance 27.4 (Spring 2002): 997-1012.
Azari-Rad, Hamid, Peter Philips, and Mark Prus. “State Prevailing Wage Laws and
School Construction Costs.” Industrial Relations 42.3 July 2003: 445-457.
Azari-Rad, Hamid, Peter Philips, and Mark Prus. The Economics of Prevailing Wage
Laws. Burlington, VT: Ashgate, 2005.
Belman, Dale. “Prevailing Wage Laws, Unions, and Minority Employment in
Construction,” in The Economics of Prevailing Wage Laws, eds. Hamid Azari-
Rad, Peter Philips and Mark J. Prus. Ashgate: Burlington VT, 2005.
Belman, Dale and Paula Voos. “Prevailing Wage Laws in Construction: The Costs of
Repeal to Wisconsin.” The Institute for Wisconsin’s Future, Oct. 1995.
Bennici, Frank. The Status of Registered Apprenticeship: An Analysis Using Data from
the Registered Apprenticeship Information System. Prepared for the U.S.
108

Department of Labor’s Office of Apprenticeship Training, Employer and Labor
Services. (April 2004).
Berik, Gunseli and Cihan Bilginsoy. “Still and Wedge in the Door: Women Training for
the Construction Trades in the U.S.” Working Paper No. 2005-05, University of
Utah, Department of Economics, 2005.
Bilginsoy, Cihan. “The Hazards of Training: Attrition and Retention in Construction
Industry Apprenticeship Programs.” Industrial and Labor Relations Review 57.3
(2003).
Bilginsoy, Cihan. “Wage Regulation and Training: The Impact of State Prevailing Wage
Laws on Apprenticeship.” Working Paper No. 2003-08, University of Utah, 2003.
Bilginsoy, Cihan. “Apprenticeship Training In the US Construction Industry.” Working
Paper September 1998.
Bilginsoy, Cihan. “Apprenticeship Training and Prevailing Wage Laws.” Working Paper.
February 1996.
Bilginsoy, Cihan and Peter Philips. “Prevailing Wage Regulation and School
Construction Costs: Evidence From British Columbia.” Journal of Education
Finance 25.3 (Winter 2000): 415-431.
Bloch, Farrell. “Minority Employment in the Construction Trades.” Journal of Labor
Research 24.2 (Spring 2003): 271-291.
Duncan, Kevin and Mark J. Prus. “Prevailing Wage Laws and Construction Costs:
Evidence form British Columbia’s Skills Development and Fair Wage Policy,” in
The Economics of Prevailing Wage Laws, eds. Hamid Azari-Rad, Peter Philips
and Mark J. Prus. Ashgate: Burlington VT, 2005.
109

Duncan, Kevin, Peter Philips and Mark Prus. “Prevailing wage legislation and public
school construction efficiency: a stochastic frontier approach.” 24 Construction
Management and Economics 625, 625-634 (June 2006).
Duncan, Kevin, Peter Philips and Mark Prus. “Are There Technical Inefficiency Effects
of Prevailing Wage Laws? Results from a Stochastic Frontier Estimate of
Construction Output.” Working paper available from Kevin Duncan, Hasen
School of Business, Colorado State University-Pueblo, Co. 81001.
Dunn, Sarah, John M. Quigley and Larry A Rosenthal. “The Effects of Prevailing Wage
Requirements on the Cost of Low-Income Housing.” Industrial and Labor
Relations 59.1 (October, 2005): 141-157.
Eisenberg , Susan. We’ll Call You: If We Need You. Ithaca: Cornell University Press.
1998.
Finkel, Gerald. “The American Construction Industry,” in The Economics of Prevailing
Wage Laws, eds. Hamid Azari-Rad, Peter Philips and Mark J. Prus. Ashgate:
Burlington VT, 2005.
Fraundorf, Martha, John Farrell, and Robert Mason. “The Effect of the Davis-Bacon Act
on Construction Costs in Rural Areas.” The Review of Economics and Statistics
66.1 (Feb. 1984): 142-146.
Freeman, Richard and James Medoff. What Do Unions Do? New York: Basic Books
Inc. 1984.
Freeman, Richard B. “The Effect of Unionism on Worker Attachment to Firms.” NBER
Working Paper No. W0400 (July 1980).
Gallaway, Lowell and Richard Vedder. “Prevailing Wages as Perceived by the Kentucky
110

Legislative Research Commission.” Government Union Review 23.3 2001-2002:
1-10.
Gamrat, Frank. “Prevailing Wages: Costly to State and Local Taxpayers.” Government
Union Review 20.2 2001-2002: 1-12.
General Accounting Office. “The Davis-Bacon Act Should Be Repealed.” Washington,
D.C.: GAO 1979.
Goldfarb, Robert S. and John F. Morrall III. “The Davis-Bacon Act – An Appraisal of
Recent Studies.” Industrial and Labor Relations Review 34.2 ( Jan, 1981): 191-
206.
Gould, John P. and George Biltling Mayer. “The Economics of the Davis-Bacon Act: An
Analysis of Prevailing Wage Laws,” Washington, D.C.: AEI for Public Policy
Research. 1980.
Greenberg, Michael, Nancy Mantell, Michael Lahr, Michael Frisch, Keith White and
David Kehler. “Evaluating the Economic Effects of a New State-Funded School
Building Program: the Prevailing Wage Issue.” Evaluation and Program
Planning 28.1 (2005): 33-45.
Heiman, Gary. Research Methods in Psychology. Boston: Houghton Mifflin Company,
2002.
Jordan, Lisa, et al. “Analysis of Proposed Change in Construction Trades Apprenticeship
Wages.” February, 2006 (on file with author).
Keller, Edward and William T. Hartman. “Prevailing Wage Rates: The Effects on School
Construction Costs, Levels of Taxation, and State Reimbursements.” Journal of
Education Finance Vol.27 (Fall 2001): 713-728.
111

Kelsay, Michael, L. Randall Wray, and Kelly Pinkham. “The Adverse Economic Impact
from Repeal of the Prevailing Wage Law in Missouri.” (January, 2004).
Kessler, Daniel P and Lawrence Katz. “Prevailing Wage Laws and Construction Labor
Markets.” Industrial & Labor Relations Review 54.2 (Jan. 2001): 259-274.
Krueger, Alan and Lawrence Summers. “Efficiency Wages and the Inter-Industry Wage
Structure.” 57 Econometrica 259, 259-294 (1998).
Linder, Marc. Wars of Attrition: Vietnam, the Business Roundtable, and the Decline of
Construction Unions (Iowa City: Fanpihua Press) 1999.
Minnesota Department of Labor and Industry, Labor Standards Division. “Overview of
Recent Studies on Prevailing Wage.” 1998.
Minnesota Taxpayers Association. “The Fiscal Implications of Prevailing Wage Law on
Minnesota School Districts,” Nov. 1997.
Minnesota Taxpayers Association. “The Fiscal Implications of Prevailing Wage Law on
Minnesota School Districts.” Nov. 1997.
Murphy, Kevin and Robert Topel. “Efficiency wages reconsidered: theory and evidence,”
in, Advances in the Theory and Measurement of Unemployment, Y. Weiss and G.
Fishelson, eds. New York: St. Martins Press, 1990: 204-240.
Newman, Matthew, Shawn Blosser, and Hilary Haycock. “Impact of Prevailing Wage
Rate Requirements on the Costs of Affordable Housing In California.” Prepared
for the California Institute for County Government, June 9, 2004.
O’Farrell, Brigid and Suzanne Moore. “Unions, Hard Hats and Women Workers,” in
Women and Unions, ed. Dorothy Sue Cobble. New York: ILR Press. 1993, pp
69-92.
112

Ohio Legislative Service Commission. “The Effects of the Exemption of School
Construction Projects from Ohio’s Prevailing Wage Law.” Staff Research Report
No. 149, May 20, 2002.
Osterman, Paul. “An Empirical Study of Labor Market Segmentation,” 28 Industrial and
Labor Relations Rev. 508, 508-23 (1975).
Petersen, Jeffrey S. “Health Care and Pension Benefits for Construction Workers: The
Role of Prevailing Wage Laws.” Industrial Relations 39.2 (Apr. 2000): 246-264.
Petersen, Jeffrey S., and Erin M. Godtland. “Benefits vs. Wages; How Prevailing Wage
Laws Affect the Mix and Magnitude of Compensation to Construction Workers,”
in The Economics of Prevailing Wage Laws, eds. Hamid Azari-Rad, Peter Philips
and Mark J. Prus. Ashgate: Burlington VT, 2005.
Philips, Peter, Garth Mangum, Norm Waitzman, and Anne Yeagle. “Losing Ground:
Lessons from the Repeal of Nine “Little Davis-Bacon Acts.” Working Paper,
Economics Department, University of Utah, 1995.
Philips, Peter. “A Comparison of Public School Construction Costs in Three Midwestern
States That Have Changed Their Prevailing Wage Laws in the 1990’s.” February,
2001, available at <http://www.smacna.org/.pdf>.
Philips, Peter. “Delaware’s Prevailing Wage Law: Its History, Purpose and Effect.” May,
1998.
Philips, Peter. “Kansas and Prevailing Wage Legislation.” Prepared for the Sheet Metal
and Air Conditioning Contractors’ National Association, 1998, available at
<http://www.smacna.org/kansas_prevailing_wage.pdf>.
Philips, Peter. “Kentucky’s Prevailing Wage Law: Its History, Purpose, and Effect.”
113
October 1999.
Philips, Peter. “Results of a Multivariate Regression Analysis of Construction Worker
Incomes with a Focus on the Implementation of Prevailing Wage Policies.”
Working Paper, Economics Department, University of Utah, 1996.
Philips, Peter. “Results of a Multivariate Regression Analysis of Construction Worker
Incomes with a focus on the Implementation of Prevailing Wage Policies.”
Working Paper, Economics Department, University of Utah, 1996.
Philips, Peter. “Square Foot Construction Costs for Newly Constructed State and Local
Schools, Offices and Warehouses in Nine Southwestern and Intermountain States
1992-1994.” Prepared for the Legislative Education Study Committee of the New
Mexico State Legislature, September 6, 1996.
Prus, Mark J. “The Effect of State Prevailing Wage Laws on Total Construction Costs.”
1996 <http://www.smacna.org/prevailing_wage_laws.pdf>.
Prus, Mark J. “Prevailing Wage Laws and School Construction Costs: An Analysis of
Public School Construction in Maryland and the Mid-Atlantic States.” Prepared
for the Prince George’s County Council, Maryland, January 1999, available at
<http://www.smacna.org/prevailing_wage_laws.pdf>.
Reich, Michael. “Prevailing Wage Laws and the California Economy.” Institute of
Industrial Relations, University of California, 1996.
Siegel, Jolie M. “Comment: Project Labor Agreements and Competitive Bidding
Statutes.” 3 U. Pa. J. Lab. & Emp. L. 295, 310 (2001).
State of Minnesota, Office of the Legislative Auditor. “Prevailing Wages: Evaluation
Description.” June, 2006.
114

Stewart, Mark B. “Union Wage Differentials, Product Market Influences and the Division
of Rents.” Economic Journal, 100.403 (Dec., 1990): 1122-1137.
Thieblot, A.J. “Fraud Prevalent in Prevailing Wage Surveys.” Government Union Review
10.1: 1-29.
Thieblot, A. J. “Prevailing Wage Laws and Market Recovery Strategies of Construction
Unions.” Journal of Labor Research 18.1 (Winter 1997): 31-46.
Thieblot, A.J. “Prevailing Wage Laws and Black Employment in the Construction
Industry.” Journal of Labor Research 20.1 (Winter 1999): 155-159.
Thieblot, A.J. “Race and Prevailing Wage Laws in the Construction Industry: Reply to
Azari-Rad and Philips.” Journal of Labor Research 24.1 (Winter 2003): 169-177.
Thieblot, A.J. “State Prevailing Wage Laws: An Assessment at the Start of 1995.”
Associated Builders and Contractors, Inc., Rosslyn, VA., 1995.
Thieblot, A.J. “The Twenty-Percent Majority: Pro-Union Bias in Prevailing Rate
Determinations.” Journal of Labor Research 26.1 (Winter 2005): 99-134.
United States Senate Republican Policy Committee. “A Bad Law in Need of Repeal: The
History and Economics of Davis-Bacon.” September 18, 2002.
Vincent, Jeff. “Prevailing Wage Reform: Fact vs. Fiction: A Response to Arguments
Against Indiana’s Prevailing Wage Law.” March 1987 (Available from the
Industrial Relations Center Reference Room, University of Minnesota).
Waddoups, C. Jeffrey. “Health Care Subsidies in Construction: Does the Public Sector
Subsidize Low Wage Contractors?” in The Economics of Prevailing Wage Laws,
eds. Hamid Azari-Rad, Peter Philips and Mark J. Prus. Ashgate: Burlington VT,
2005.
115
Waitzman, Norman. “Worker Beware: The Relationship Between the Strength of State
Prevailing Wage Laws and Injuries in Construction, 1976-1991,” Department of
Economics, University of Utah.
Walter, Mike. “The Economic Impact of Prevailing Wage Requirements in Minnesota,”
Industrial Relations Center of the University of Minnesota, January 1992.
Whittaker, William G., Congressional Research Service, “The Davis-Bacon Act:
Suspension,” 109th Congress, 1st Sess.(1993).
Wilson, Ginny, Mike Clark, Greg Hager, Cindy Upton, Betty Davis, Barry Boardman and
Tom Hewlett, “An Analysis of Kentucky’s Prevailing Wage Laws and
Procedures,” Research Report No. 304, Legislative Research Commission,
December 2001.
Woolley, John, and Gerhard Peters, “The American Presidency Project” [online], Santa
Barbara, CA: University of California (hosted), available from World Wide Web
http://www.presidency.ucsb.edu.
116