Embed Size (px)
DESCRIPTION
WISTAX Prevailing Wage Analysis
Citation preview
EvaluatingWisconsin’s Approachto DeterminingPrevailing Wages:n State Methodologyn Regional Market Comparisonsn Local Fiscal Impact
taxwisMarch 2015Wisconsin Taxpayers AllianceMadison, Wisconsin • wistax.org
Evaluating Wisconsin’s Approach to Determining Prevailing Wages:State Methodology, Regional Market Comparisons, Local Fiscal Impact
Wisconsin Taxpayers Alliance research prepared for Associated Builders and Contractors of Wisconsin, Inc. • March 2015 • www.wistax.org
©
taxwis
Page 32
Board of DirectorsAssociated Builders and Contractors of Wisconsin, Inc.5330 Wall StreetMadison, WI 53718
To the directors:
In early fall of 2014, officials from Associated Builders and Contractors (ABC) approached the Wisconsin Taxpayers Alliance (WISTAX) regarding the feasibility of studying Wisconsin’s prevailing wage law. They sought an evaluation of the soundness of Wisconsin’s approach to calculating prevailing wages and an estimate of what, if any, additional costs this approach imposes on governments, particularly local ones. Those discussions led to a formal WISTAX study proposal which was subsequently approved by ABC.
From the outset, the goal of the research was not to evaluate the strengths or weaknesses of prevailing wage laws. Rather, our aim was to study the state’s method of calculating those amounts from both statistical and sample survey perspective. In performing that analysis, we found at least two methodological “flaws” that tend to raise prevailing wages above market rates. Prevailing wages here tend to be 23% higher than averages from a statistically-valid federal survey of the same Wisconsin employers; and when prevailing wages and benefits are combined, they average 45% more than typical compensation packages estimated from the same federal survey.
This has fiscal implications for state and local governments. In 2014, the state Department of Workforce Development issued prevailing wage determinations for about $1.9 billion in building and heavy construction projects. If prevailing wages had reflected average wages and benefits, state and local governments—and taxpayers—could have saved as much as $299 million on those projects.
The research staff at the Wisconsin Taxpayers Alliance thanks the Department of Workforce Development and its expert staff for their help in navigating the arcane mechanics of Wisconsin’s prevailing wage law. We also appreciate ABC’s confidence in WISTAX’s public-finance expertise to analyze this little-studied and highly-complex issue.
Sincerely,
Todd A. BerryPresident
Wisconsin Taxpayers Alliancewww.wistax.org
Page 31
Executive Summary .............................................................................. i
Background ............................................................................................1
Previous Research ................................................................................3
Wisconsin’s Law and Method ...........................................................5
Evaluating Wisconsin’s Method .......................................................8
Reflecting the Market? .....................................................................11
The Cost to Local Governments and Taxpayers .......................17
Conclusions ..........................................................................................21
Appendix A: Prevailing vs. Avg. Const. Wages, by County ...22
Appendix B: Tot. Packages vs. Avg. Const. Wages ...................23
Appendix C: Ability to Pay Maps ...................................................24
Appendix D: BLS’s OES Survey .......................................................25
References .............................................................................................26
List of Figures
Table of Contents List of Tables
Table 1: Prevailing Wage Laws by State .......................................1
Table 2: Measuring Wisconsin’s “Calculation Bias” ...................8
Table 3: Unrepresentative Response Rates ..............................10
Table 4: Prev. Wages Higher Than OES Wages .........................17
Table 5: Prev. Pkgs. Higher Than “OES-Based Pkgs.” ...............18
Table 6: Estimated Savings, $5 Million Building .....................19
Table 7: Estimated Savings, Statewide .......................................19
Figure 1: Tier 1 and Tier 2 Counties ...............................................6
Figure 2: Examples of Prevailing Wage Calculation ................7
Figure 3: Avg. and Prevailing Wages ...........................................11
Figure 4: Avg. Wages and Prevailing Total Packages ............12
Figure 5: Measuring the Cost ........................................................13
Figure 6: Ability to Pay Varies ........................................................14
Figure 7: Ability to Pay Varies, 10 Occ. Average ......................14
Figure 8: Carpenter Pkg. Defies Common Sense....................15
Figure 9: Prev. Pkg. Can Differ Widely Within a Labor Mkt. .15
Page 29
Executive Summary
Wisconsin has had prevailing wage laws since the 1930s. Yet, Wisconsin’s specific approach to calculating prevailing wages has undergone little study.
An in-depth examination of this meth-odology shows that Wisconsin’s employer survey and unique calculations lead to prevailing wages that:
� Often do not reflect varying county construction wages or regional labor mar-kets;
� Are more “costly” in low-wage, low-income counties, particularly those north-ern Wisconsin;
� Can fluctuate widely and unpredict-ably from year to year, rather than change slowly and consistently as market wages typically do;
� Can require contractors to pay un-skilled workers more than skilled workers in some situations; and
� May cost state and local govern-ment hundreds of millions of dollars in excess costs.
Method. Wisconsin surveys construction contractors annually to get information on wages and benefits paid to workers on private construction projects. That informa-
tion is then used to calculate, by county, hourly prevailing wage and benefit rates for public construction projects.
Unfortunately, only about 10% of sur-veys are completed correctly and returned, a dramatically lower response rate than achieved by the federal government survey of the same employers.
One result of this low return rate is that the union/nonunion split in hours reported in the survey do not reflect the overall con-struction industry. Approximately 25% of the industry is unionized in Wisconsin, but 87% of the hours reported are covered under union contracts. This tends to raise prevailing wage rates above market rates. Federal wage surveys take care to boost response rates and to ensure the charac-teristics of survey respondents match the underlying population.
A second methodological “flaw” also tends to inflate prevailing wages. Most states that employ survey averages to calculate prevailing wages use all survey responses. If the desire is to measure the “market,” this kind of traditional average makes sense. However, Wisconsin is unique: it selects and averages only the top por-tion of the wage distribution. This unique
method results in prevailing wages that can be 20% to 40% above the rate that results from calculating a true average from all respondents.
Prevailing Wages and the Market. If pre-vailing wages reflected local markets, one would expect county prevailing wages would, to some extent, mirror patterns in other construction wages. There is no evi-dence of this. Federal estimates of average weekly wages from the entire construction industry show construction earnings tend to be much higher in urban counties than in rural ones. Earnings differentials can be over 200%.
Yet prevailing wages often vary little from county to county, and when they do vary, the variations do not reflect county dif-ferences reflected in overall industry earn-ings data. For example, in 2014, prevailing wages for carpenters were identical in 57 of the state’s 72 counties. Prevailing wages for roofers varied, but the pattern appears “random,” with no tie to location.
A more specific example is instructive. Average wages for the entire construction industry averaged $1,119 in Waukesha County and $569 in Washburn County. Despite this large difference, the prevailing
i
Page 30
wage for a roofer was higher in Washburn than in Waukesha ($30.50 vs. $29.40).
Ability to Pay. Since prevailing wages typically do not vary with local market rates, residents of Wisconsin’s income-poor coun-ties end up devoting a greater share of their incomes to public construction projects than residents of more prosperous coun-ties. This analysis uses an hour-cost ratio that measures how many hours an average worker must work in order to pay for one hour of prevailing wage work.
For example, the prevailing wage and benefit rate (total package) for a carpenter was $46.38 in both Dane and Florence counties. While the average Dane County worker across all industries earned $23.68 per hour, the average Florence County worker earned only $11.45. Thus, it would take four average Florence County workers an hour’s work to pay for a carpenter on a public project, but only two Dane County workers to pay that same carpenter. In general, prevailing wages were most bur-densome in Bayfield, Burnett, Florence, Iron, and Marquette counties, all remote counties mostly in the north.
Anomalies. Wisconsin’s unique prevail-ing wage methodology also created some unexpected results. For example, prevail-
ing wages and benefits for a carpenter in Adams county fluctuated between $12 per hour and $49 per hour during 2011-15. In Lafayette county during 2013-15, the range was $17.95 to $45.47. Market wages do not show this kind of volatility.
Sometimes, Wisconsin methodology results in compensation rates that do not reflect skill levels. In 2014, the prevailing wage and benefit package for an electrician in Lafayette County was $21.00 per hour; for an unskilled clean-up worker, it was $37.97.
These anomalies further indicate that prevailing wages here often bear little re-semblance to the local economies where public projects are occurring.
Excess Costs. Local data from a statisti-cally-valid federal wage survey show that prevailing wages here are, on average, 23% higher than local averages. Adding estimated benefits to the federal figures enables calculation of the difference in total packages. Wisconsin’s prevailing package rates are, on average, about 45% higher than market rates.
In 2014, state and local governments requested prevailing wage determina-tions for about $1.9 billion in building or heavy construction projects. Estimated labor costs on these projects range from
20% to 30% of the total. Those figures can be used to estimate that state and local governments could have saved between $199.7 million (9.0% of total costs) and $299.5 million (13.5%) on these projects if market averages, rather than prevailing wages, were used.
Background. About six months ago, long before the current legislative session, Associated Builders and Contractors (ABC) approached the Wisconsin Taxpayers Alli-ance (WISTAX), asking if it could study Wis-consin’s approach to calculating prevailing wages and the resulting impact, if any, on local government finance.
ABC asked WISTAX to answer two ques-tions:
1. Do the prevailing wages determined by the state Department of Workforce De-velopment accurately reflect wages and benefits in Wisconsin counties? and
2. If they overestimate area wages, what is the additional cost to local governments and taxpayers?
Remember: This study does not address whether Wisconsin should or should not have a prevailing wage law, but only how it calculates those wages. o
ii
Page 1
In early October 2014, Associated Build-ers and Contractors of Wisconsin, Inc. (ABC) approached the Wisconsin Taxpayers Alli-ance (WISTAX) regarding a possible study of Wisconsin’s prevailing wage law and its impact on local government finance. Now in its eighth decade, WISTAX is a nonprofit, nonpartisan organization dedicated to pub-lic-policy research and citizen education.
In particular, the study was to answer two questions:
1. Do the prevailing wages determined by the state Department of Workforce De-velopment (DWD) accurately reflect wages and benefits in the area? and
2. If they overestimate area wages, what is the additional cost to local governments and taxpayers?
WISTAX submitted a research proposal to ABC in late October. The study was ap-proved several weeks later.
It is important to note that this study does not address whether Wisconsin should or should not have a prevailing wage law. Rather, Wisconsin’s method of calculat-ing prevailing wages is examined. To the degree that prevailing wages exceed local market wages, the additional costs to state and local governments and taxpayers is then estimated.
HistoryAlthough not familiar to much of the
public, prevailing wage laws have a long history in both Wisconsin and the United States. These laws vary by state, but all require a minimum wage or wage and benefit package for workers employed on government construction projects.
The first prevailing wage law was ap-proved in Kansas in 1891 as part of an ef-fort by the American Federation of Labor to shorten the workday to eight hours. Similar laws were subsequently passed in New York (1894), Oklahoma (1909), Idaho (1911), Arizona (1912), New Jersey (1913), Massachusetts (1914) and Nebraska (1923).
Then, in 1927, an Alabama firm brought construction workers from that state to Long Island, New York to work on a hospi-tal building project. Rather than pay the going rate on Long Island, the firm paid its workers a lower wage commensurate with what they would earn in Alabama. Worried that the importation of low-wage workers would become commonplace, New York businesses complained to Congress.
Soon thereafter (1931), Congress passed and President Hoover signed the Davis-Bacon Act, the prevailing wage law for federally-funded construction projects. The
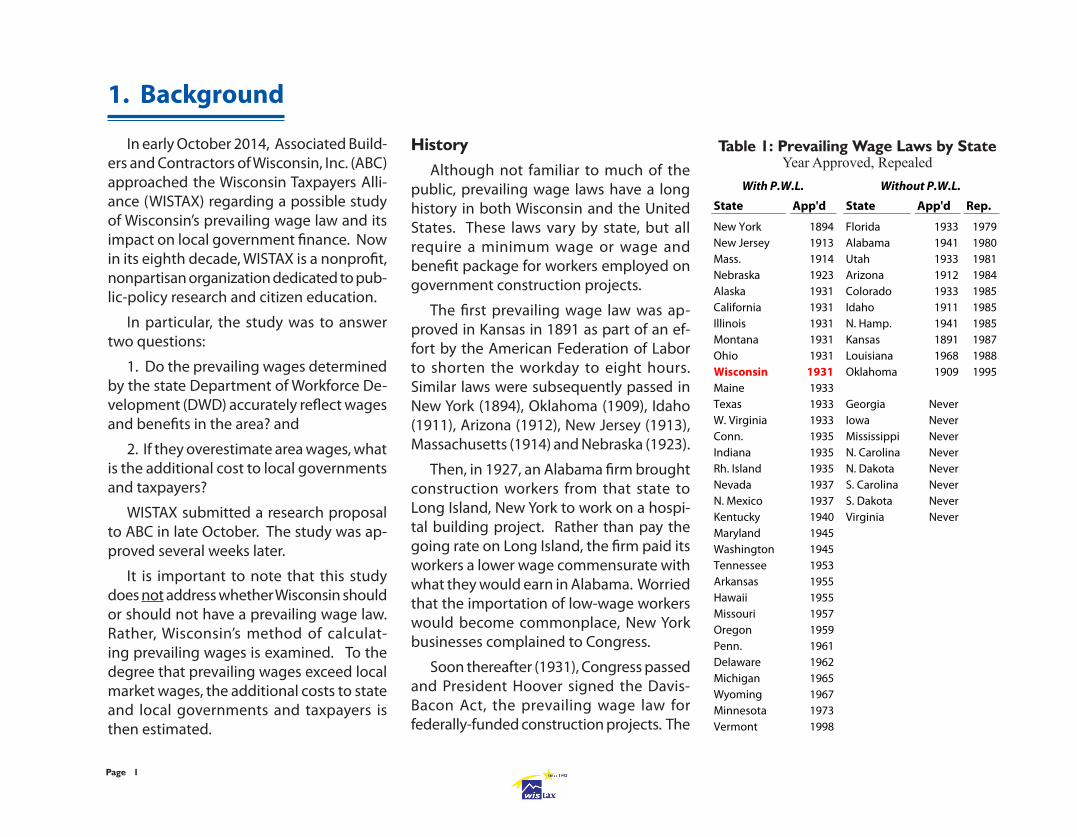
Table 1: Prevailing Wage Laws by StateYear Approved, Repealed
1. Background
State App'd State App'd Rep.
New York 1894 Florida 1933 1979New Jersey 1913 Alabama 1941 1980Mass. 1914 Utah 1933 1981Nebraska 1923 Arizona 1912 1984Alaska 1931 Colorado 1933 1985California 1931 Idaho 1911 1985Illinois 1931 N. Hamp. 1941 1985Montana 1931 Kansas 1891 1987Ohio 1931 Louisiana 1968 1988Wisconsin 1931 Oklahoma 1909 1995Maine 1933Texas 1933 Georgia NeverW. Virginia 1933 Iowa NeverConn. 1935 Mississippi NeverIndiana 1935 N. Carolina NeverRh. Island 1935 N. Dakota NeverNevada 1937 S. Carolina NeverN. Mexico 1937 S. Dakota NeverKentucky 1940 Virginia NeverMaryland 1945Washington 1945Tennessee 1953Arkansas 1955Hawaii 1955Missouri 1957Oregon 1959Penn. 1961Delaware 1962Michigan 1965Wyoming 1967Minnesota 1973Vermont 1998
With P.W.L. Without P.W.L.
Page 2
law was designed to prevent low-wage, out-of-market (typically, out-of-state) con-tractors from underbidding local contrac-tors, which could drive down local wages or encourage local contractors to relocate.
Within four years after, 15 states (includ-ing Wisconsin) passed prevailing wage laws. Currently, 32 states have such laws (see Table 1 on page 1). Of the 18 remaining states, eight have never had one. The other 10 either repealed their laws or had them in-validated by courts. All except Oklahoma’s (1995) were eliminated during 1979-88.
Wisconsin LawAlthough often viewed as one law, Wis-
consin actually has three prevailing wage laws: one covers projects funded by a local government (Wis. Stat. § 66.0903); a second covers state highway and bridge projects (Wis. Stat. § 103.50); and the third applies to all other state building projects (Wis. Stat. § 103.49). The laws underwent major revision in 1996. Detail on Wisconsin’s law begins on page five.
Study Scope and ApproachAmong the many public sector projects
subject to Wisconsin’s prevailing wage law are buildings, roads and highways, sewers,
sidewalks, curbs, and gutters. This study is limited to public construction associated with buildings such as schools, fire and police stations, and municipal buildings. Residential and agricultural buildings funded with public money are not included.
The study first reviews other research on prevailing wages and then describes Wisconsin’s law in some detail. The em-pirical portion of the study follows and is composed of three major parts. First, we evaluate Wisconsin’s method of determin-ing prevailing wages. We find two “flaws” which tend to inflate required compensa-tion.
Second, we compare prevailing wages by counties to local labor markets and the public’s “ability to pay.” We find that Wiscon-sin’s prevailing wages are generally above market rates. Further, local governments and taxpayers are affected more in rural and low-income counties. Third, we estimate the annual “cost” to local governments, and ultimately taxpayers, of prevailing wages when they are above market rates.
DataMost of the data used for this study are
from DWD’s Labor Standards Bureau. The bureau was not able to provide data files
Currently, 32 states have a prevailing wage law. Of the remaining 18, eight never had one. The other 10 either repealed their law or had it invalidated by a court.
electronically; however, we were able to copy needed data from their website and format them in a way that could be ana-lyzed.
We use two sets of information from DWD. The first is raw data from the 2013 survey of construction contractors. These are hourly wage and benefit figures for con-tractors working on building construction projects in the private sector. This informa-tion was used to calculate prevailing wages for 2014.
The second set of data contains the 2014 prevailing wages calculated by DWD. These are minimum wage and benefit combina-tions that must be paid to workers on public construction projects.
We also use separate information on employment, wages, and incomes from the federal Bureau of Labor Statistics.
Page 3
Research on prevailing wage laws is extensive. Many of the early studies focused on the federal Davis-Bacon Act; more recently, the attention has shifted to examining state prevailing wage laws. Findings from these studies vary, from the laws increasing public construction costs to them having little impact. Some research has also examined ancillary effects of pre-vailing wages.
Federal Davis-Bacon ActEarly research on prevailing wage laws
examined the impact of the Davis-Bacon Act on federal government costs. Con-ducted mostly in the 1970s and 1980s, these studies generally found that the Act increased government’s labor costs, with estimates ranging from 4% to nearly 40%.
In a 2000 report to the House and Senate Committees on the Budget, the Congressional Budget Office estimated that federal construction outlays during 2001-10 would be $10.5 billion lower with-out the Davis-Bacon Act. One of the most recent (2008) studies of that Act found federal prevailing wages were, on average, 22% above wage estimates from another federal survey. The authors suggested that the differential could raise construction costs by almost 10%.
State LawsFindings from state studies fall into three
groups. Prevailing wage laws: (1) raise costs; (2) have little or no cost impacts; or (3) have other impacts (e.g. injury rates).
Raises Costs? Over the past 20 years, state law changes have created “natural experi-ments,” allowing researchers to analyze the impacts of local prevailing wage laws. The first was a temporary lapse in Michigan’s law during 1994-97 that enabled study of public sector construction costs, both with and without prevailing wage requirements. Researchers estimated that the state saved about $275 million in 1995 because the pre-vailing wage law was not in force.
A second “natural experiment” occurred in Ohio in 1997 when the state exempted school construction from its prevailing wage law. Five years later, the Ohio Legis-lative Service studied the impact, finding that Ohio schools had saved $488 million (10.7%) on construction spending.
In 2001, California expanded its pre-vailing wage law to cover construction of state-subsidized housing. A study of 205 low-income housing projects concluded that the California prevailing wage law raised construction costs at least 9%, and as much as 37%.
Other research on state prevailing wage laws also shows higher costs associated with the laws. A 2001 study in Pennsylva-nia found a 17% wage differential between public and private construction contracts and attributed the difference to the state prevailing wage law. The authors estimated this difference, combined with higher ben-efit costs, would lead to school construction costs that were 2.25% higher due to the prevailing wage. A 2007 study of Michigan’s law found that prevailing wages there were, on average, 39% higher than median wages reported in federal surveys.
Little or No Impact? Not all research finds higher costs due to prevailing wage laws. A 1996 study examined public and private construction projects in states with and without prevailing wage laws. It found pub-lic projects in all states were, on average, significantly more expensive than similar private projects. However, the difference could not be attributed to prevailing wage laws.
2. Previous Research
While some researchers find prevailing wage laws increase construction costs between 4% and 40%, others find the laws have little or no impact on the cost of public construction.
Page 4
A 1998 study of school construction in Great Plains states found no cost difference in states with or without prevailing wage laws. A 1999 study of school construction costs in three states with prevailing wage laws (Delaware, Pennsylvania, and West Virginia) and two states without such laws (North Carolina and Virginia) found a small, but statistically insignificant, increase in costs in the states with prevailing wages.
A 2002 study of school construction costs from across the country could not find prevailing wage effects. A 2003 study by the same authors examined school
construction costs in all 50 states during 1991-99. After controlling for the business cycle, building size, school type, and other variables, the authors could find no cost effect of prevailing wage laws.
oOther Impacts? Impacts of prevailing wage laws other than direct costs have also been examined. A 2006 study reported higher productivity (about 15%) and higher rates of construction training programs in prevailing wage states. The author sug-gested the additional training and higher productivity helped explain why some studies found no cost differences.
Some researchers find that workplace injuries rise after repeal of the laws, while others show accident rates are higher in prevailing wage states compared to states that never had such laws.
This study is different from others in that the main focus is on how Wisconsin calcu-lates its prevailing wages and the implica-tions of that method. We begin by outlining state law in some detail and showing how prevailing wages are calculated here.
Page 5
3. Wisconsin’s Law and Method
State LawWisconsin’s prevailing wage law for
state-funded projects, including highways and bridges, was enacted in 1931. Two years later, the law for local construction projects was approved. These laws under-went significant change in 1996.
The laws do not apply to all publicly-funded projects. Projects must meet fi-nancial thresholds before the law applies. The prevailing wage law affects publicly-funded:
� multi-trade projects costing $234,000 or more in towns and in cities or villages with populations less than 2,500;
� multi-trade projects costing $100,000 or more in all other municipalities or for other local governments;
� single-trade projects—those in which one trade accounts for more than 85% of the cost—of $48,000 or more.
State highway and bridge projects have no threshold; i.e., the prevailing wage law applies to all these projects.
Wisconsin’s thresholds are generally in line with those in most other states. Seven states have no thresholds, and two have very low thresholds for specific projects; i.e., nearly all publicly-funded projects are
subject to the law. In another nine states, prevailing wage laws are triggered at costs of $25,000 or less. The highest thresholds are in Maryland ($500,000), Connecticut ($400,000), Indiana ($350,000), and Ken-tucky ($250,000).
In Wisconsin, prevailing wages (and to-tal compensation) are set by occupation, by county, and by project type. State law defines five project types:
A. building and heavy construction;
B. sewer, water, or tunnel construction;
C. airport pavement or state highway con-struction;
D. local street or miscellaneous pavement construction; and
E. residential or agricultural construction.
Thus, a prevailing wage exists for a carpenter working on a building or heavy construction project in Dane County. A separate prevailing wage (which may or may not be the same) applies to a carpenter working on a publicly-funded residential or agricultural project in Dane County. DWD defines about 200 occupations commonly used on public sector construction projects.
Although referred to as the prevailing wage law, Wisconsin’s law covers more than wages. It sets minimum hourly
amounts that must be paid for wages and benefits combined, as well as a prevailing wage rate.
DWD MethodData Source. Each year, DWD surveys
approximately 18,000 construction compa-nies throughout the state, using a database of construction firms that report wages and employment for unemployment insurance (UI) purposes.
The survey asks for information on hours, wages, and benefits by occupa-tion for each project worked on in the prior year. Respondents also report the project location, particularly the county, and whether the employee was covered under a collective bargaining agreement. The county is the civil division on which prevailing wages are calculated. Although information is requested for both public and private projects, data from the latter are primarily used to determine prevailing wages in Wisconsin.
Wisconsin’s prevailing wage law sets, for over 200 occupations, minimum compensation that must be paid to workers on publicly-funded construction projects.
Page 6
Survey Response. State law requires em-ployers to complete the survey but provides no penalty for noncompliance. As a result, only about 4,000 of the 18,000 surveys are returned, and approximately half of those returned are invalid.
Surveys are invalid when they are not fully completed or are filled out incorrectly. Over the past nine years, the number of valid, returned surveys has averaged about 10.5% of those mailed.
By comparison, the federal Bureau of Labor Statistics (BLS) uses the same group of firms to conduct its own wage survey twice annually using the same UI database. Nationally, the response rate for that survey is over 70%.
One characteristic of Wisconsin’s prevail-ing wage survey responses is that union contractors are more likely to respond than their nonunion counterparts. In 2014, across all project types, about 80% of hours reported were covered under a collective bargaining agreement. For project type A (building and heavy construction), union hours were 87% of all hours reported. By contrast, in project type E (residential and agricultural construction), only 10% of hours were covered by a collective bargain-ing agreement.
These percentages both vary from state averages. In 2014, 25% of Wisconsin work-ers in the construction industry were union
members; 26% were covered by union contracts.
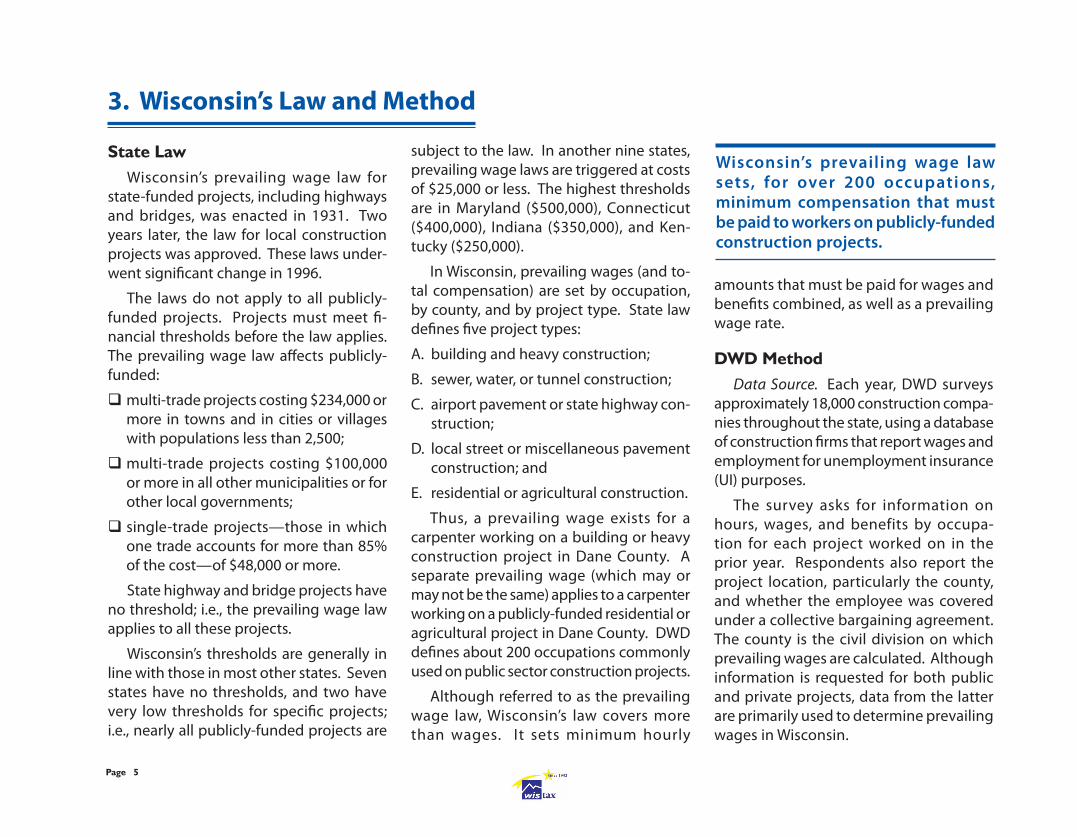
The 500-Hour Rule. To calculate a coun-ty’s prevailing wage for a particular occupa-tion/project-type combination, at least 500 hours must be reported. If that threshold is not reached, information from surrounding counties (“Tier 1”) is combined with data for the county being calculated.
The map below shows how a prevailing wage for Forest County might be calculated. If 500 hours for a particular occupation/project type (e.g., marble finisher in build-
ing and heavy construction) were not re-ported for Forest County, then information from Florence, Marinette, Oconto, Langlade, Oneida, and Vilas counties is combined with Forest County data.
For some occupations, the 500-hour threshold is still not achieved using sur-rounding Tier 1 counties. Then, survey data from the next set of surrounding counties (Iron, Price, Lincoln, Marathon, Menominee, Shawano, and Brown) are added (Tier 2). If, as in some situations, the 500-hour thresh-old is still not achieved, statewide data are used for the calculation.
This “tiering” has implications for prevail-ing wages for some occupations. In the For-est County example, some prevailing wages might be calculated using information from Brown and Marathon counties—two coun-ties with labor markets that differ from Forest’s. For some more obscure occupa-tions, statewide information, which would be dominated by large urban counties in southern Wisconsin, would be used. In such cases, the prevailing wage that results for small, rural counties is unlikely to reflect market wages there.
Forest
Florence
Marinette
Oconto
Langlade
Oneida
VilasIron
Price
Lincoln
MarathonShawano
Men.
Brown
Tier 1
Tier 2
Figure 1: Tier 1 and Tier 2 Counties Forest County Prevailing Wage Calculation
More than 80% of reported survey hours are covered under a collective bargaining agreement, yet only 25% of Wisconsin construction workers are union members.
County Analyzed
Page 7
The Calculation. Once the 500-hour threshold is met, calculating a prevailing wages is a multiple-step process, repeated for each occupation/project-type combina-tion in each county.
First, using survey information from pri-vate projects, a prevailing “total package” is calculated. The total package is the hourly amount paid for combined salaries and ben-efits. For contractors, this is the critical figure, as it is the total compensation they must pro-vide employees working on public projects.
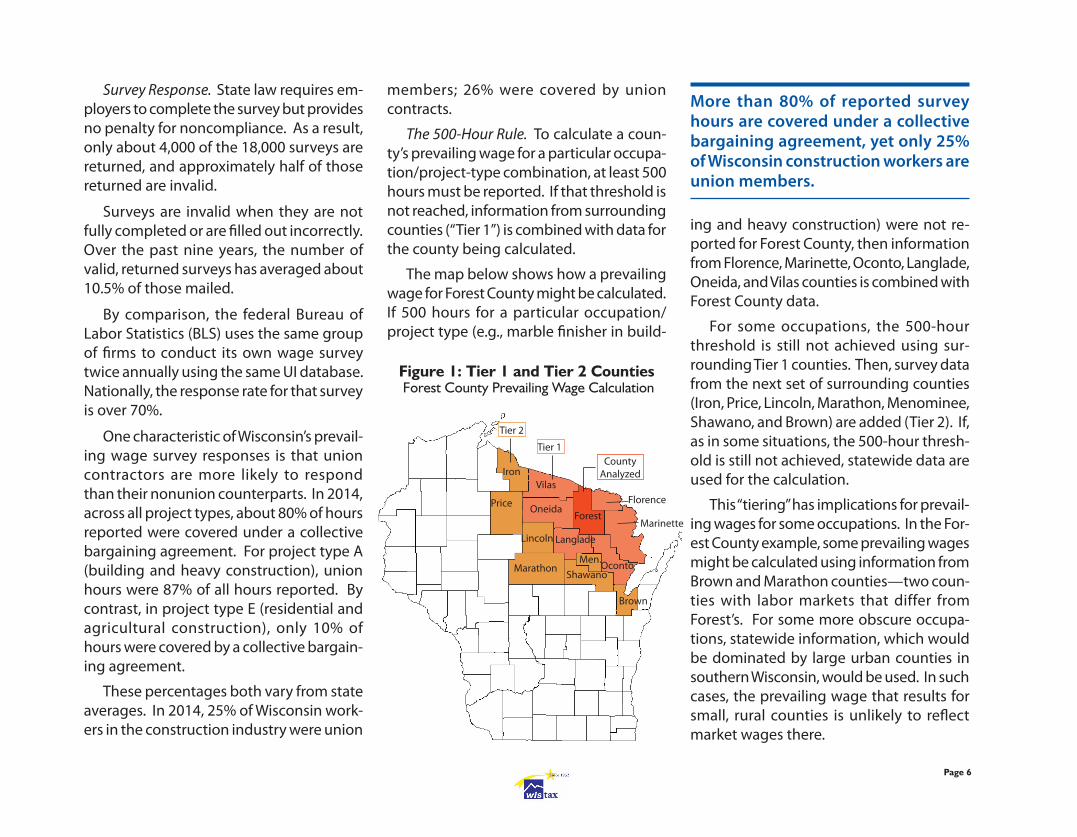
To calculate that amount, DWD first looks to see if a majority of total hours reported were at one total package amount (to the penny). If so, that amount becomes the pre-vailing package rate.
This approach is illustrated in example 1 of Figure 2. A total of 800 hours were reported for a particular occupation/proj-ect combination in a county. The same rate ($32.65) was reported for 442 of those hours. Since that rate comprises more than half of the 800 total hours, $32.65 becomes the prevailing total-package rate. Employ-ers must pay workers this amount in some combination of wages and benefits.
If one total package rate does not ac-count for a majority of the hours reported, then total package amounts are sorted from highest to lowest (see example 2 in graph-ic). Beginning at the top and moving down, hours are summed until they account for at
} 1. More than 50% of hours (442/800) at s a m e t o t a l package rate ($32.65); that rate becomes prevailing total package rate.
2 . Wage com-ponent is most common wage among data used (shaded).
} 1. Use highest total package amounts until at least 51% of hours account-ed for. Prevail-ing pack age ( $ 3 3 . 0 1 ) i s weighted av-erage of those amounts.
least 51% of the total (i.e., when they exceed 408 if 800 total hours are reported). In this example, the 51% threshold is crossed at Project 11, and the total number of hours used is 432. A weighted average (based on hours) of these hours is then calculated and used for the prevailing package amount ($33.01 in this example).
Figure 2: Examples of Prevailing Wage CalculationMajority Rule and Average of Highest 51%
Example 1: Majority of Hours at Same Rate Example 2: Use Highest 51% of Hours
Once the prevailing package amount is calculated, the wage portion is then deter-mined. In both cases, the prevailing wage is the most commonly occurring (the sta-tistical mode) wage from among packages used. In both examples below, the wage component is $24.20.
Proj. WageTotal Pkg. Hrs.
1 $27.95 $34.40 502 $28.95 $33.65 503 $24.20 $32.65 1654 $24.20 $32.65 605 $24.20 $32.65 506 $24.20 $32.65 427 $24.20 $32.65 288 $24.20 $32.65 229 $24.20 $32.65 20
10 $24.20 $32.65 2811 $24.20 $32.65 2712 $21.25 $25.25 10013 $19.75 $21.75 6114 $16.85 $19.65 3515 $17.25 $18.50 62
Prev. Wage $24.20 $32.65 442
Proj. WageTotal Pkg. Hrs.
1 $27.95 $34.40 602 $28.95 $33.65 503 $24.20 $32.65 654 $24.20 $32.65 405 $24.20 $32.65 506 $24.20 $32.65 427 $24.20 $32.65 288 $24.20 $32.65 229 $24.20 $32.65 20
10 $24.20 $32.65 2811 $24.20 $32.65 2712 $21.25 $25.25 21013 $19.75 $21.75 3114 $16.85 $19.65 3515 $17.25 $18.50 92
Prev. Wage $24.20 $33.01 432
2. Wage com-ponent is most common wage among data used (shaded).
Page 8
County Avg.DWD
Meth. Diff. Avg.DWD
Meth. Diff.
Milwaukee $41.66 $44.95 7.9% $49.42 $52.90 7.0%Dane 29.77 35.62 19.7% 43.69 46.44 6.3%Waukesha 40.01 44.96 12.4% 49.73 53.11 6.8%Brown 21.42 25.25 17.9% 45.44 46.40 2.1%Racine 40.87 44.99 10.1% 51.96 52.86 1.7%Outagamie 21.32 25.82 21.1% 44.76 46.41 3.7%Winnebago 21.10 25.74 22.0% 45.85 45.85 0.0%Kenosha 44.95 44.95 0.0% 51.82 52.79 1.9%Rock 29.97 38.49 28.4% 41.60 46.40 11.5%Marathon 28.18 36.25 28.6% 43.61 46.38 6.4%
Columbia 21.24 24.20 13.9% 41.99 46.78 11.4%Dodge 24.94 31.89 27.9% 40.29 46.89 16.4%Eau Claire 29.26 33.67 15.1% 46.17 46.46 0.6%La Crosse 28.14 30.99 10.1% 44.87 46.39 3.4%Washington 31.33 43.11 37.6% 45.91 52.75 14.9%
CarpenterRoofer
4. Evaluating Wisconsin’s Method
States with prevailing wage laws calcu-late them in a variety of ways. Six states, including Michigan, use wages and benefits from collective bargaining agreements. Five states, including neighboring Min-nesota, use the most commonly reported wage (mode) from a survey. Two states use the average of survey data.
Wisconsin and 14 other states use a com-bination of mode and average. Wisconsin and eight other states require the mode to comprise more than 50% of reported hours for it to become the prevailing wage. In other states, that percentage is as low as 30% of reported hours.
Where Wisconsin differs significantly from the other 14 states is in the data it uses to calculate the average. Typically, states average all survey data; Alaska excludes the top and bottom 5% of hours before making its calculation. Wisconsin is the only state that uses only the upper part of the wage distribution to calculate its average.
The combination of Wisconsin’s low sur-vey response rate, the difference between union and nonunion response rates, and the unique way it calculates an average can lead to prevailing wage rates that do not reflect local labor markets.
A Unique “Average”It is common sense that averaging only
the highest wages from a survey will pro-duce a higher figure than averaging over all wages. The magnitude of the difference between the two will vary with the distribu-tion of wages.
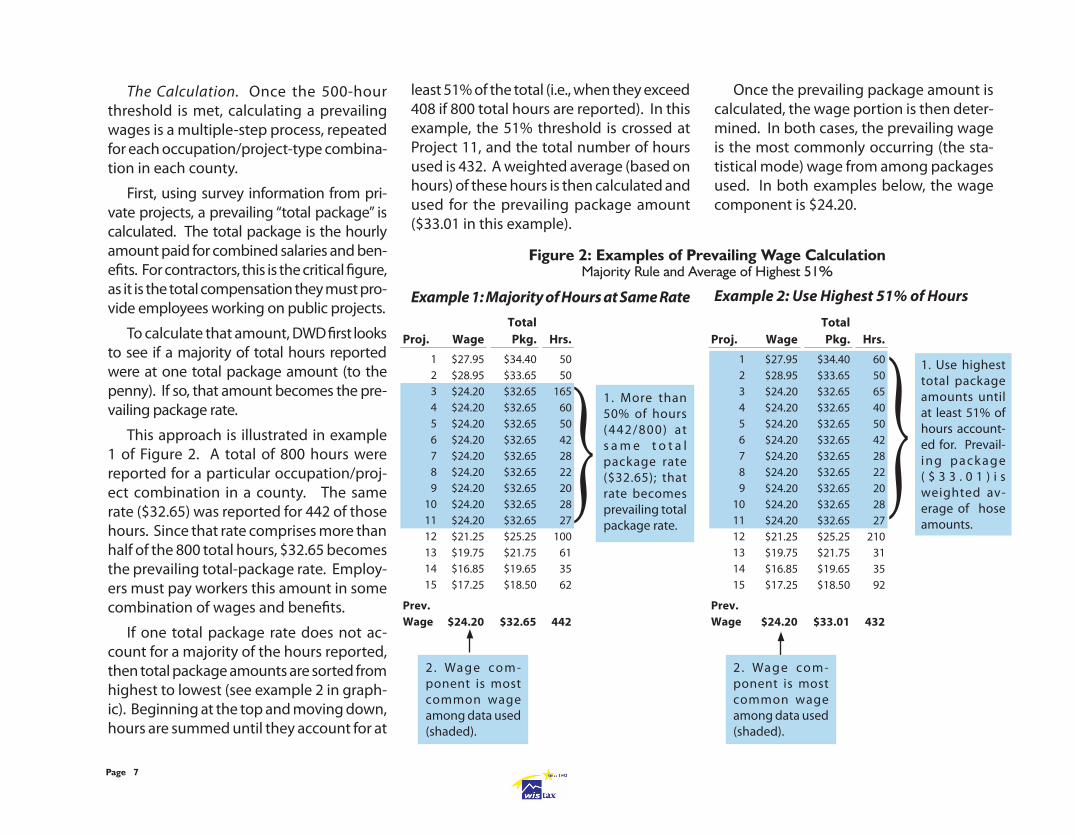
To explore the nature of this method-ological “flaw,” we collected the actual prevailing wage survey data for roofers and carpenters in 15 counties, including Wisconsin’s 10 largest. Average wages were calculated in two ways: First, as an average of all the data; and second, using DWD’s method.
If all or nearly all of the report-ed compensation are the same, there will be little or no difference between the two calculations. This can occur when union hours are 90% or more of total reported hours. For example, all hours reported were union hours for roofers in Kenosha County and for carpenters in Winnebago County, and there was no difference be-tween the two averages (Table 2). Union hours were 94% or more of total hours for carpenters in
Brown, Racine, Kenosha, Eau Claire, and La Crosse counties, and differences were minimal.
However, in those occupations where a variety of compensation amounts are
Table 2: Measuring Wisconsin’s “Calculation Bias”
Statistical Average vs. DWD Method, Roofer and Carpenter
Wisconsin’s practice of averaging only the top portion of the wage distribution returns prevailing wages that can be 20% or more higher than if a traditional average were used.
Page 9
reported, the difference between the two averages grows. In both Brown and Out-agamie counties, all of the roofer data were nonunion and varied widely. In those cases, DWD’s method returned “averages” 18% to 21% higher than a traditional average. In Washington County, union hours were less than half of the total and the difference be-tween the two methods approached 40%. Clearly, DWD’s unique averaging method raises prevailing wage rates above a tradi-tional average.
Survey ResponseWisconsin’s use of raw survey data also
has an effect. As previously mentioned, only about 10% of prevailing wage surveys are completed correctly and returned, with union contractors more likely to return them. To understand the implications for prevailing wages, a brief discussion of survey methods is useful.
Survey Techniques. Surveys are undertaken daily to generate information on everything from political preferences to personal habits to earnings and income. Typically, only a portion of the population—a sample—is surveyed. For example, the Marquette Uni-versity Law School Poll surveys between 800 and 1,500 people to gauge candidate prefer-ences among voters statewide.
If valid sampling methods are used, infor-mation from the sample can be extrapolated to the entire population. However, even
carefully crafted surveys have a margin of error that typically ranges from 3% to 5%. In other words, if a survey was conducted repeatedly, the results would reflect the true population 95% to 97% of the time.
However, for that to be true, charac-teristics of the sample need to reflect the entire population. For example, Marquette researchers would not take a sample that was 25% female and 75% male, or 60% Re-publican and 40% Democrat, and claim that responses reflected the views of the entire population. Rather, gender mix (and party affiliation) should be closer to the actual percentages for registered voters; e.g., 53% female and 47% male.
Many professional pollsters, including those at Marquette, weight their sample to reflect the true underlying population. In Marquette’s final poll before the November 2014 elections, women comprised 51% of the sample, a little less than the percentage for all registered voters. Thus, their answers were given a little more weight so that the survey results reflected the 53%/47% mix of the overall population.
“Biased” Results. If researchers are not careful, the results of their survey may not reflect the underlying population. Two types of errors can be encountered: “re-sponse bias” and “nonresponse bias.”
Response bias occurs when respondents’ answers do not reflect their true beliefs.
This would only affect the prevailing wage survey if contractors were misreporting hours or compensation. Nonresponse bias occurs when the characteristics of those not responding are significantly different from those responding. This is typically a problem in mail surveys (like Wisconsin’s prevailing wage survey). Both of these render survey results unreliable for under-standing the views or characteristics of the entire population.
Prevailing Wage Survey. From this dis-cussion, it should be evident that data collected from Wisconsin’s prevailing wage survey are likely not to represent the actual construction labor market. The union/non-union mix in the industry is approximately 25%/75%. In the building/heavy construc-tion sector, union representation may be slightly higher, but not the 85% reflected in DWD survey responses.
Thus, we have one group (nonunion contractors) that is less likely to respond to the survey. And, wages and benefits (char-acteristics) for this group are different from the responding group (union contractors). Thus, there is likely some nonresponse bias in the DWD survey. Wisconsin does
Unlike BLS., Wisconsin does not correct for possible error in its prevailing wage survey, thus limiting its usefulness for estimating construction wages.
Page 10
not weight responses to try to reflect the entire population, nor does it correct for any nonresponse bias.
Wisconsin’s methodology can be compared to a federal survey (OES Wage Survey, see page 16) that is used to esti-mate state and local wages by occupation. Federal researchers weight each survey sample to reflect the underlying distri-bution of firms. They also recognize the possibility of nonresponse bias and take steps to correct it.
Adjusting Data? We do not have enough information to correct the shortcomings of Wisconsin’s prevailing wage survey. How-ever, the survey data can be weighted to estimate the magnitude of error in prevail-ing wages the DWD survey produces.
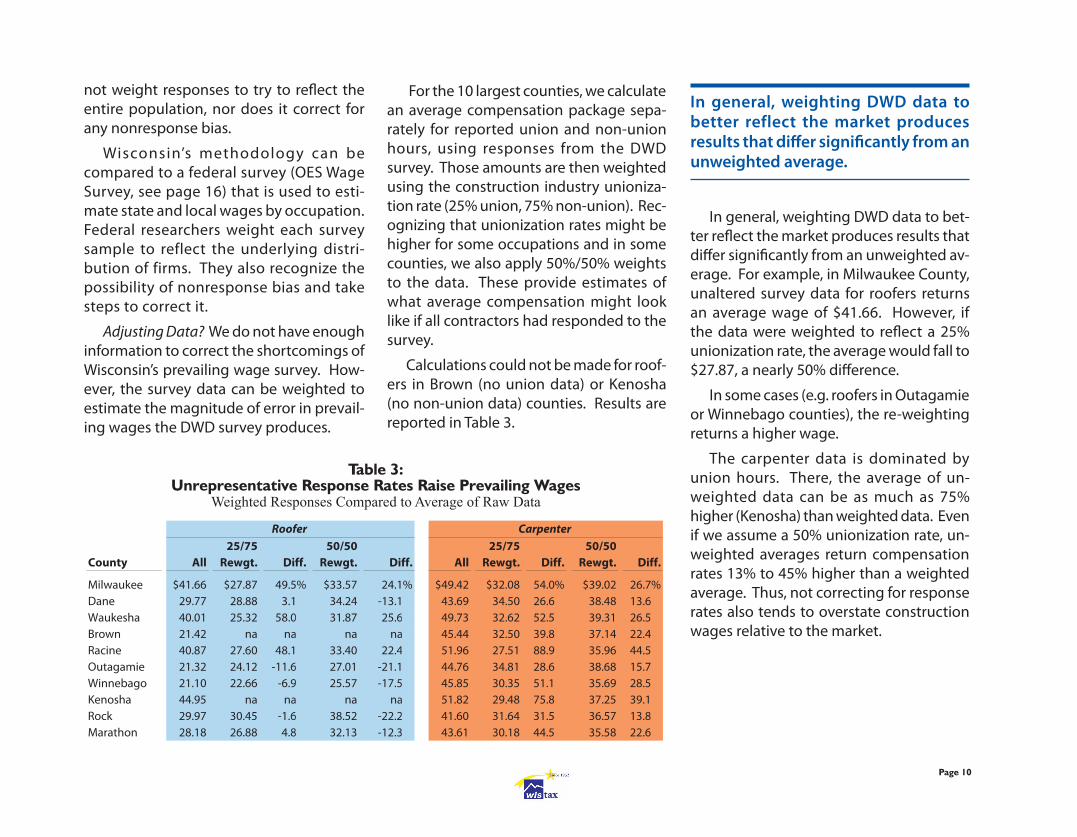
For the 10 largest counties, we calculate an average compensation package sepa-rately for reported union and non-union hours, using responses from the DWD survey. Those amounts are then weighted using the construction industry unioniza-tion rate (25% union, 75% non-union). Rec-ognizing that unionization rates might be higher for some occupations and in some counties, we also apply 50%/50% weights to the data. These provide estimates of what average compensation might look like if all contractors had responded to the survey.
Calculations could not be made for roof-ers in Brown (no union data) or Kenosha (no non-union data) counties. Results are reported in Table 3.
In general, weighting DWD data to bet-ter reflect the market produces results that differ significantly from an unweighted av-erage. For example, in Milwaukee County, unaltered survey data for roofers returns an average wage of $41.66. However, if the data were weighted to reflect a 25% unionization rate, the average would fall to $27.87, a nearly 50% difference.
In some cases (e.g. roofers in Outagamie or Winnebago counties), the re-weighting returns a higher wage.
The carpenter data is dominated by union hours. There, the average of un-weighted data can be as much as 75% higher (Kenosha) than weighted data. Even if we assume a 50% unionization rate, un-weighted averages return compensation rates 13% to 45% higher than a weighted average. Thus, not correcting for response rates also tends to overstate construction wages relative to the market.
Table 3: Unrepresentative Response Rates Raise Prevailing Wages
Weighted Responses Compared to Average of Raw Data
County All25/75
Rewgt. Diff.50/50
Rewgt. Diff. All25/75
Rewgt. Diff.50/50
Rewgt. Diff.
Milwaukee $41.66 $27.87 49.5% $33.57 24.1% $49.42 $32.08 54.0% $39.02 26.7%Dane 29.77 28.88 3.1% 34.24 -13.1% 43.69 34.50 26.6% 38.48 13.6%Waukesha 40.01 25.32 58.0% 31.87 25.6% 49.73 32.62 52.5% 39.31 26.5%Brown 21.42 na na% na na% 45.44 32.50 39.8% 37.14 22.4%Racine 40.87 27.60 48.1% 33.40 22.4% 51.96 27.51 88.9% 35.96 44.5%Outagamie 21.32 24.12 -11.6% 27.01 -21.1% 44.76 34.81 28.6% 38.68 15.7%Winnebago 21.10 22.66 -6.9% 25.57 -17.5% 45.85 30.35 51.1% 35.69 28.5%Kenosha 44.95 na na% na na% 51.82 29.48 75.8% 37.25 39.1%Rock 29.97 30.45 -1.6% 38.52 -22.2% 41.60 31.64 31.5% 36.57 13.8%Marathon 28.18 26.88 4.8% 32.13 -12.3% 43.61 30.18 44.5% 35.58 22.6%
Roofer Carpenter
In general, weighting DWD data to better reflect the market produces results that differ significantly from an unweighted average.
Page 11
5. Reflecting the Market?
The previous section highlighted flaws in Wisconsin’s approach to calculating pre-vailing wages, both in terms of method and survey response. Beyond these issues, the question remains whether the prevailing wage reflects local labor markets—and what, if any, implications there are for local governments and taxpayers.
Prevailing Wages and the MarketWisconsin’s economy is comprised of a
number of regional economies. Wages and incomes in northern Wisconsin tend to be lower than those in the southeast. If prevail-ing wages reflected these regional markets, one would expect them to vary by region.
Federal data from the Bureau of Labor Statistics (BLS) can be used to explore whether prevailing wage determinations vary with BLS averages across markets. This analysis is made easy because BLS collects county wage information by industry from the same UI database used for Wisconsin’s prevailing wage survey.
To make the DWD-BLS comparison as fair as possible, it is important to recognize differences in construction seasons nation-wide compared to Wisconsin. Wisconsin’s season tends to be shorter due to weather. So, to ensure comparability, BLS data are only used for the second and third quarters
(April through September when construc-tion is in full swing) to construct an average weekly wage by county. Then, since DWD’s 2014 prevailing wage determinations are made using 2013 survey data, these can be compared to average wages calculated from 2013 BLS data.
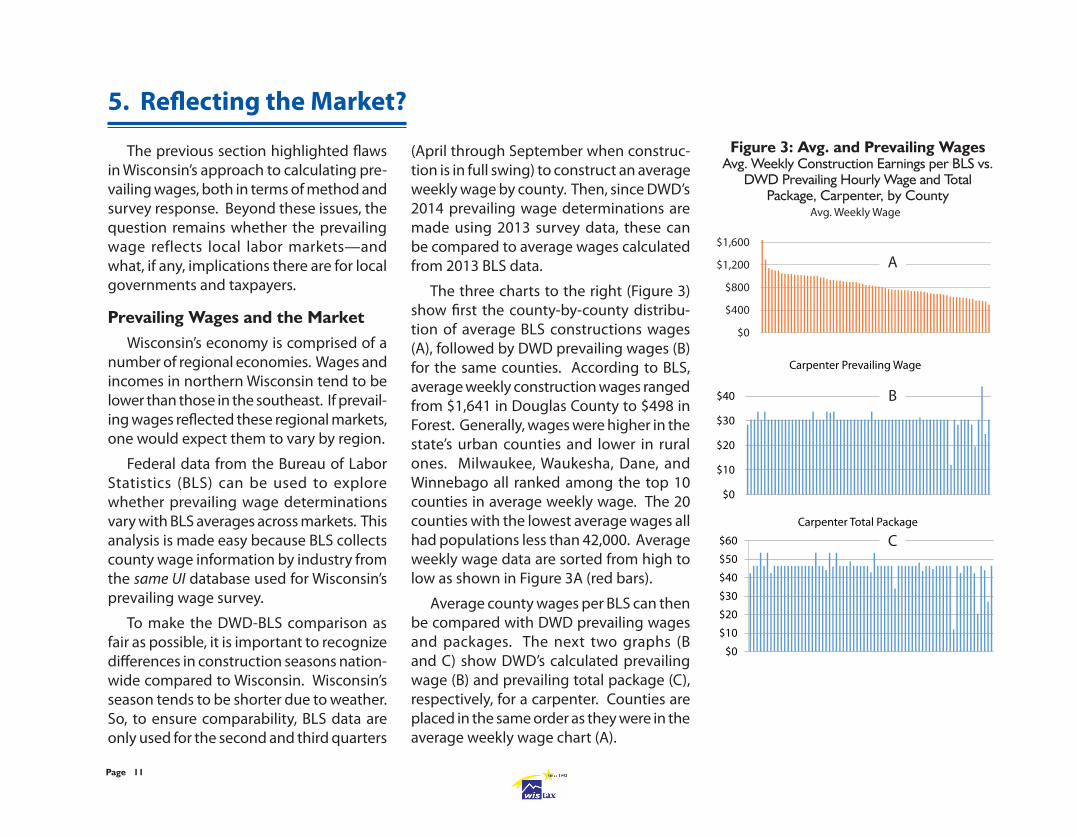
The three charts to the right (Figure 3) show first the county-by-county distribu-tion of average BLS constructions wages (A), followed by DWD prevailing wages (B) for the same counties. According to BLS, average weekly construction wages ranged from $1,641 in Douglas County to $498 in Forest. Generally, wages were higher in the state’s urban counties and lower in rural ones. Milwaukee, Waukesha, Dane, and Winnebago all ranked among the top 10 counties in average weekly wage. The 20 counties with the lowest average wages all had populations less than 42,000. Average weekly wage data are sorted from high to low as shown in Figure 3A (red bars).
Average county wages per BLS can then be compared with DWD prevailing wages and packages. The next two graphs (B and C) show DWD’s calculated prevailing wage (B) and prevailing total package (C), respectively, for a carpenter. Counties are placed in the same order as they were in the average weekly wage chart (A).
$0
$400
$800
$1,200
$1,600
Avg. Weekly Wage
$0
$10
$20
$30
$40
Carpenter Prevailing Wage
$0
$10
$20
$30
$40
$50
$60
Carpenter Total Package
A
C
B
Figure 3: Avg. and Prevailing WagesAvg. Weekly Construction Earnings per BLS vs.
DWD Prevailing Hourly Wage and Total Package, Carpenter, by County
Page 12
$0
$400
$800
$1,200
$1,600
Avg. Weekly Wage
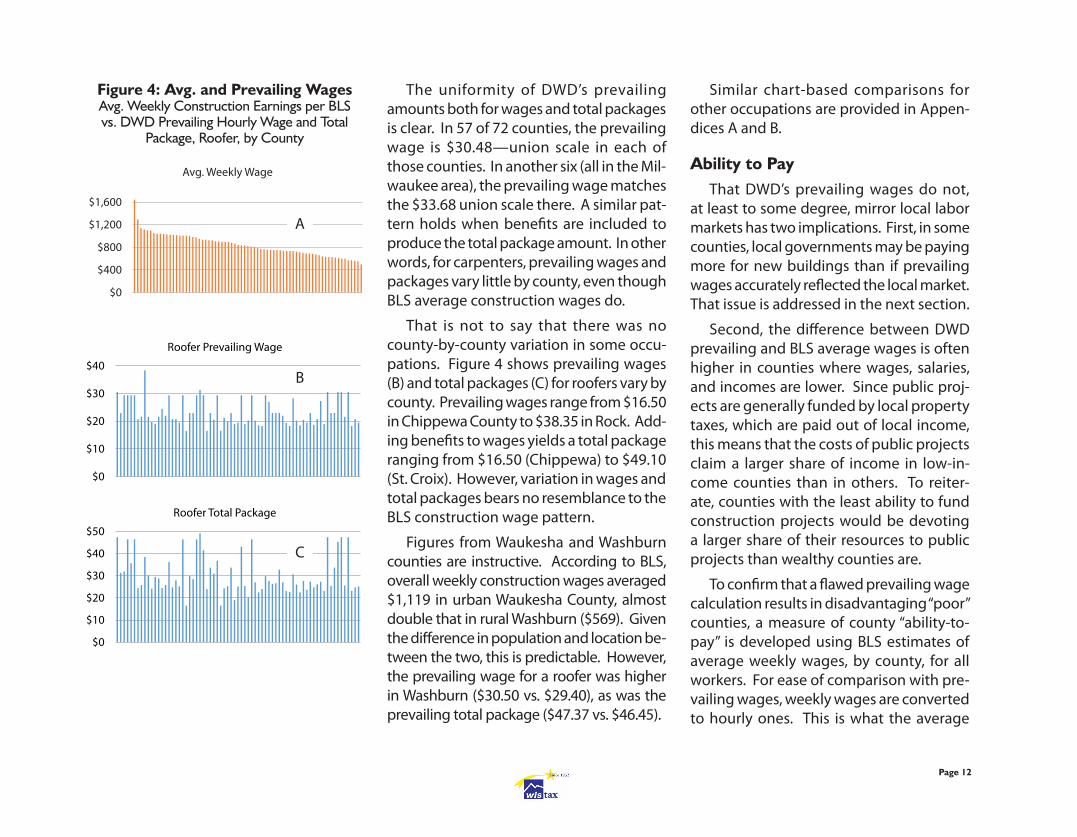
Figure 4: Avg. and Prevailing WagesAvg. Weekly Construction Earnings per BLS vs. DWD Prevailing Hourly Wage and Total
Package, Roofer, by County
$0
$0
$10
$20
$30
$40
Roofer Prevailing Wage
1 4 7 10 13 16 19 22 25 28 31 34 37 40 43 46 49 52 55 58 61 64 67 70
$0
$10
$20
$30
$40
$50
Roofer Total Package
Sheet Metal Worker
The uniformity of DWD’s prevailing amounts both for wages and total packages is clear. In 57 of 72 counties, the prevailing wage is $30.48—union scale in each of those counties. In another six (all in the Mil-waukee area), the prevailing wage matches the $33.68 union scale there. A similar pat-tern holds when benefits are included to produce the total package amount. In other words, for carpenters, prevailing wages and packages vary little by county, even though BLS average construction wages do.
That is not to say that there was no county-by-county variation in some occu-pations. Figure 4 shows prevailing wages (B) and total packages (C) for roofers vary by county. Prevailing wages range from $16.50 in Chippewa County to $38.35 in Rock. Add-ing benefits to wages yields a total package ranging from $16.50 (Chippewa) to $49.10 (St. Croix). However, variation in wages and total packages bears no resemblance to the BLS construction wage pattern.
Figures from Waukesha and Washburn counties are instructive. According to BLS, overall weekly construction wages averaged $1,119 in urban Waukesha County, almost double that in rural Washburn ($569). Given the difference in population and location be-tween the two, this is predictable. However, the prevailing wage for a roofer was higher in Washburn ($30.50 vs. $29.40), as was the prevailing total package ($47.37 vs. $46.45).
Similar chart-based comparisons for other occupations are provided in Appen-dices A and B.
Ability to PayThat DWD’s prevailing wages do not,
at least to some degree, mirror local labor markets has two implications. First, in some counties, local governments may be paying more for new buildings than if prevailing wages accurately reflected the local market. That issue is addressed in the next section.
Second, the difference between DWD prevailing and BLS average wages is often higher in counties where wages, salaries, and incomes are lower. Since public proj-ects are generally funded by local property taxes, which are paid out of local income, this means that the costs of public projects claim a larger share of income in low-in-come counties than in others. To reiter-ate, counties with the least ability to fund construction projects would be devoting a larger share of their resources to public projects than wealthy counties are.
To confirm that a flawed prevailing wage calculation results in disadvantaging “poor” counties, a measure of county “ability-to-pay” is developed using BLS estimates of average weekly wages, by county, for all workers. For ease of comparison with pre-vailing wages, weekly wages are converted to hourly ones. This is what the average
A
C
B
Page 13
worker, across all industries and occupa-tions, earns in each county.
As might be expected, the three most populous counties (Milwaukee, Waukesha, and Dane) had the highest average wages, all above $23 per hour. In five rural counties (Florence, Bayfield, Iron, Vilas, and Burnett), the average worker earned less than $14 per hour.
For each of the 10 occupations studied, DWD’s prevailing total package was divided by BLS’s average wage. The resulting ratio
$1$1.
$11.45$11.45
$11.45
$23.68
$23.68
Prevailing Pkg.$46.38
Florence County Average Wage
Dane County Average Wage
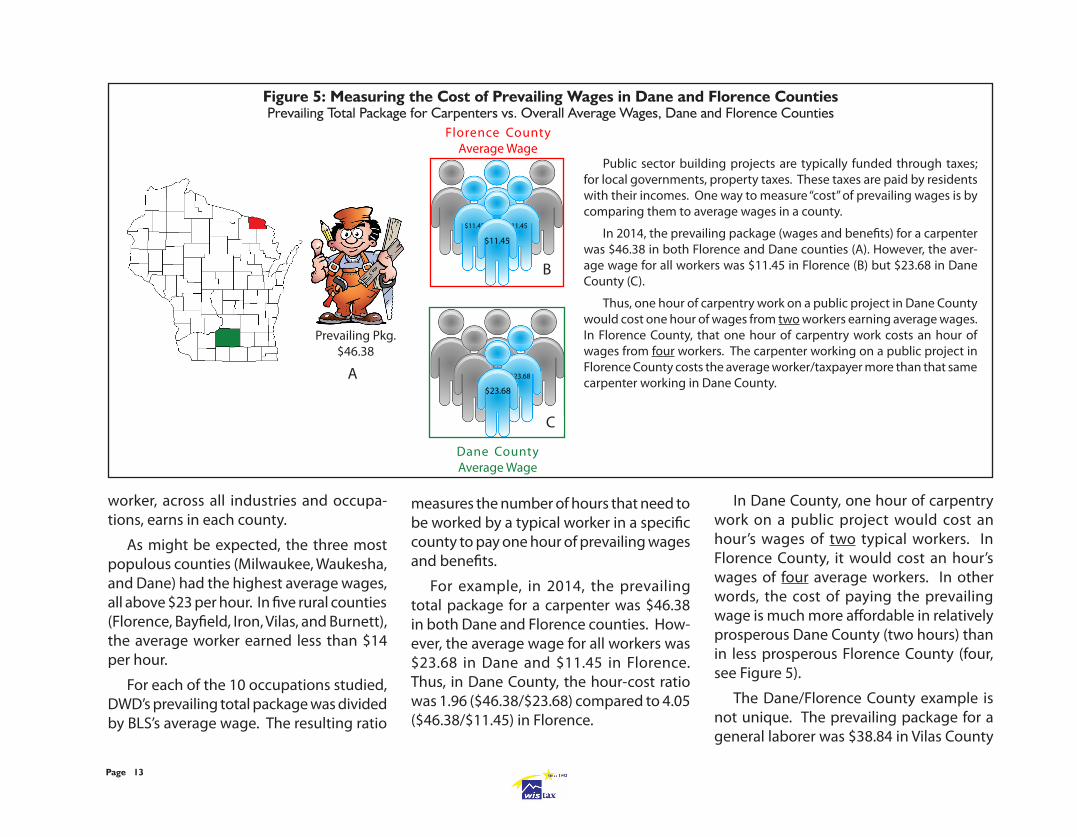
Public sector building projects are typically funded through taxes; for local governments, property taxes. These taxes are paid by residents with their incomes. One way to measure “cost” of prevailing wages is by comparing them to average wages in a county.
In 2014, the prevailing package (wages and benefits) for a carpenter was $46.38 in both Florence and Dane counties (A). However, the aver-age wage for all workers was $11.45 in Florence (B) but $23.68 in Dane County (C).
Thus, one hour of carpentry work on a public project in Dane County would cost one hour of wages from two workers earning average wages. In Florence County, that one hour of carpentry work costs an hour of wages from four workers. The carpenter working on a public project in Florence County costs the average worker/taxpayer more than that same carpenter working in Dane County.
Figure 5: Measuring the Cost of Prevailing Wages in Dane and Florence CountiesPrevailing Total Package for Carpenters vs. Overall Average Wages, Dane and Florence Counties
measures the number of hours that need to be worked by a typical worker in a specific county to pay one hour of prevailing wages and benefits.
For example, in 2014, the prevailing total package for a carpenter was $46.38 in both Dane and Florence counties. How-ever, the average wage for all workers was $23.68 in Dane and $11.45 in Florence. Thus, in Dane County, the hour-cost ratio was 1.96 ($46.38/$23.68) compared to 4.05 ($46.38/$11.45) in Florence.
In Dane County, one hour of carpentry work on a public project would cost an hour’s wages of two typical workers. In Florence County, it would cost an hour’s wages of four average workers. In other words, the cost of paying the prevailing wage is much more affordable in relatively prosperous Dane County (two hours) than in less prosperous Florence County (four, see Figure 5).
The Dane/Florence County example is not unique. The prevailing package for a general laborer was $38.84 in Vilas County
A
C
B
Page 14
More Less
Affordability
Electrician
Carpenter
Figure 6: Ability to Pay Varies, I Ratio of Prevailing Tot. Pkg. to Overall Avg. Wage,
Electrician and Carpenter, by County
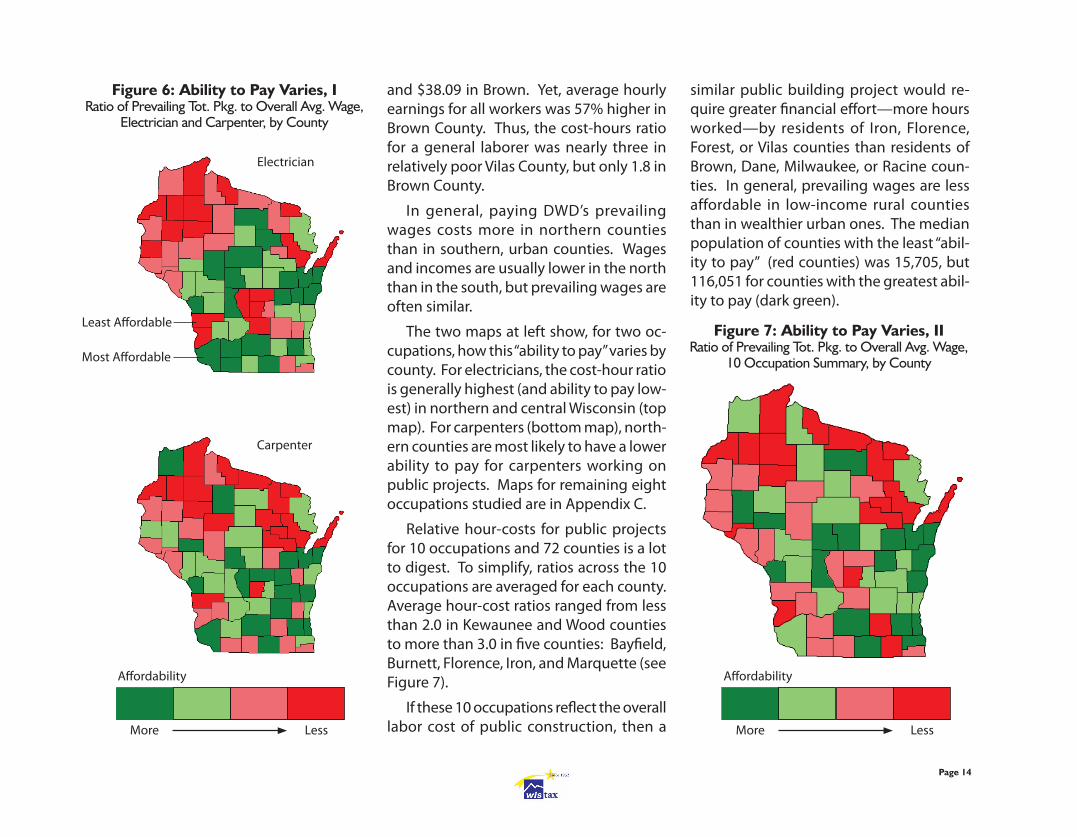
and $38.09 in Brown. Yet, average hourly earnings for all workers was 57% higher in Brown County. Thus, the cost-hours ratio for a general laborer was nearly three in relatively poor Vilas County, but only 1.8 in Brown County.
In general, paying DWD’s prevailing wages costs more in northern counties than in southern, urban counties. Wages and incomes are usually lower in the north than in the south, but prevailing wages are often similar.
The two maps at left show, for two oc-cupations, how this “ability to pay” varies by county. For electricians, the cost-hour ratio is generally highest (and ability to pay low-est) in northern and central Wisconsin (top map). For carpenters (bottom map), north-ern counties are most likely to have a lower ability to pay for carpenters working on public projects. Maps for remaining eight occupations studied are in Appendix C.
Relative hour-costs for public projects for 10 occupations and 72 counties is a lot to digest. To simplify, ratios across the 10 occupations are averaged for each county. Average hour-cost ratios ranged from less than 2.0 in Kewaunee and Wood counties to more than 3.0 in five counties: Bayfield, Burnett, Florence, Iron, and Marquette (see Figure 7).
If these 10 occupations reflect the overall labor cost of public construction, then a
similar public building project would re-quire greater financial effort—more hours worked—by residents of Iron, Florence, Forest, or Vilas counties than residents of Brown, Dane, Milwaukee, or Racine coun-ties. In general, prevailing wages are less affordable in low-income rural counties than in wealthier urban ones. The median population of counties with the least “abil-ity to pay” (red counties) was 15,705, but 116,051 for counties with the greatest abil-ity to pay (dark green).
Figure 7: Ability to Pay Varies, II Ratio of Prevailing Tot. Pkg. to Overall Avg. Wage,
10 Occupation Summary, by County
More Less
Affordability
Least Affordable
Most Affordable
Page 15
Anomalies Wisconsin’s unique method of calculat-
ing prevailing wages creates wage require-ments that do not reflect county labor markets, and makes prevailing wages much more “expensive” in some counties than in others. However, even if DWD’s approach to calculating prevailing wages was sound, the methodology creates some “wage anomalies” that make little economic sense.
Inconsistent Wages. Wage rates and compensation packages change over time. Averages at the county or state level tend to change slowly and consistently. For example, Wisconsin’s overall average wage increased every year between 2007 and 2013, rising an average of 2.4% per year from $43,930 to $50,506.
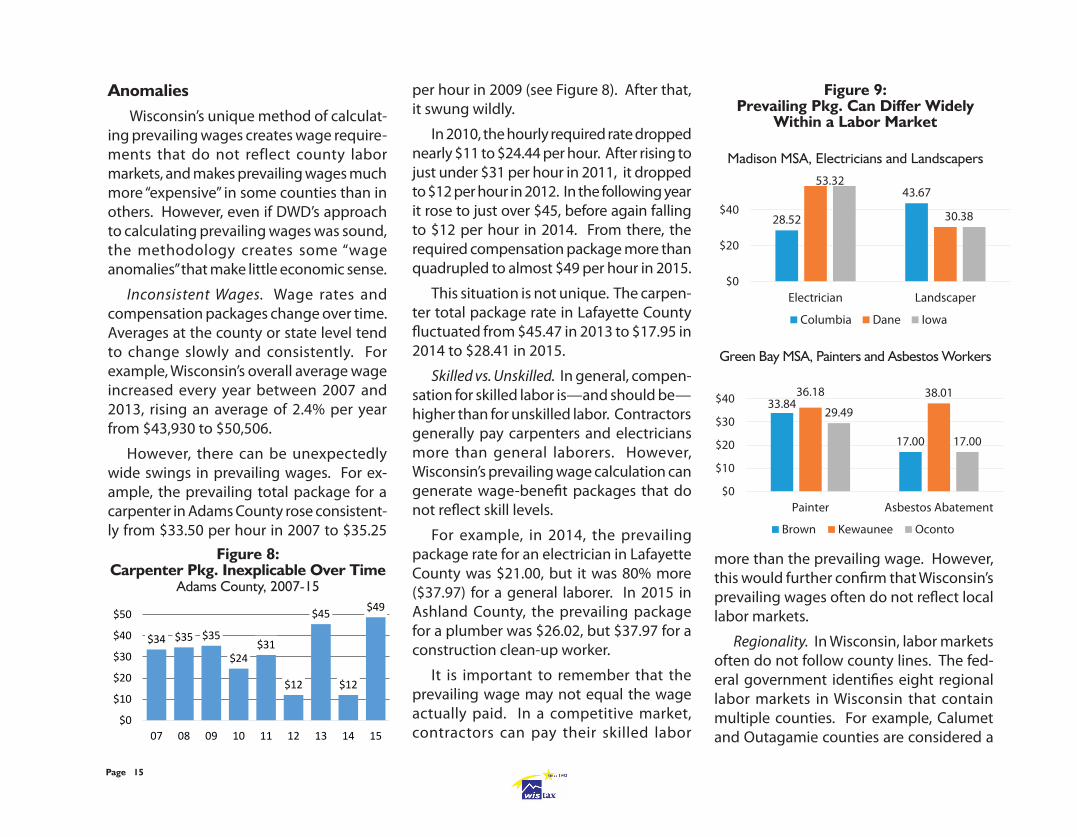
However, there can be unexpectedly wide swings in prevailing wages. For ex-ample, the prevailing total package for a carpenter in Adams County rose consistent-ly from $33.50 per hour in 2007 to $35.25
per hour in 2009 (see Figure 8). After that, it swung wildly.
In 2010, the hourly required rate dropped nearly $11 to $24.44 per hour. After rising to just under $31 per hour in 2011, it dropped to $12 per hour in 2012. In the following year it rose to just over $45, before again falling to $12 per hour in 2014. From there, the required compensation package more than quadrupled to almost $49 per hour in 2015.
This situation is not unique. The carpen-ter total package rate in Lafayette County fluctuated from $45.47 in 2013 to $17.95 in 2014 to $28.41 in 2015.
Skilled vs. Unskilled. In general, compen-sation for skilled labor is—and should be—higher than for unskilled labor. Contractors generally pay carpenters and electricians more than general laborers. However, Wisconsin’s prevailing wage calculation can generate wage-benefit packages that do not reflect skill levels.
For example, in 2014, the prevailing package rate for an electrician in Lafayette County was $21.00, but it was 80% more ($37.97) for a general laborer. In 2015 in Ashland County, the prevailing package for a plumber was $26.02, but $37.97 for a construction clean-up worker.
It is important to remember that the prevailing wage may not equal the wage actually paid. In a competitive market, contractors can pay their skilled labor
28.52
43.6753.32
30.38
$0
$20
$40
Electrician Landscaper
Columbia Dane Iowa
Figure 9: Prevailing Pkg. Can Differ Widely
Within a Labor Market
Madison MSA, Electricians and Landscapers
Green Bay MSA, Painters and Asbestos Workers
33.84
17.00
36.18 38.01
29.49
17.00
$0
$10
$20
$30
$40
Painter Asbestos Abatement
Brown Kewaunee Oconto
$34 $35 $35
$24$31
$12
$45
$12
$49
$0
$10
$20
$30
$40
$50
07 08 09 10 11 12 13 14 15
Figure 8: Carpenter Pkg. Inexplicable Over Time
Adams County, 2007-15
more than the prevailing wage. However, this would further confirm that Wisconsin’s prevailing wages often do not reflect local labor markets.
Regionality. In Wisconsin, labor markets often do not follow county lines. The fed-eral government identifies eight regional labor markets in Wisconsin that contain multiple counties. For example, Calumet and Outagamie counties are considered a
Page 16
single labor market, as are Columbia, Dane, and Iowa counties and Brown, Kewaunee, and Oconto counties.
However, in 2014, the prevailing package rate for an electrician was $28.52 in Iowa County, but nearly 90% higher ($53.32) in Dane and Columbia counties. A landscaper had to be paid at least $30.38 in Dane and Iowa counties, but $43.67 in Columbia County (see Figure 9 on page 15).
These anomalies are not limited to the Madison area. A painter had to be paid $29.49 for public projects in Oconto County, but $36.18 (23% more) for projects in Ke-waunee County. Differences were even greater with asbestos abatement work-ers: $38.01 in Kewaunee County, but only $17.00 in Brown or Oconto counties.
These anomalies provide further evi-dence that prevailing wages here often exhibit little resemblance to underlying markets.
Page 17
In the prior section, county prevailing wages were compared first to average wages in the entire construction industry (regardless of occupation), and then to average wages for all workers in a county, (regardless of industry). The evidence sug-gested that prevailing wages in Wisconsin counties bear little resemblance to underly-ing labor markets and they are more “costly” to residents in low-income counties.
To the degree that prevailing wages exceed market rates, it can be argued that state and local governments—and ultimately taxpayers—are “overpaying” for public building projects. Two ques-tions remain. First, if the DWD prevailing wage approach is flawed, how should one measure the actual market rate for various construction occupations? And, if local governments are overpaying, what is the magnitude of overpayment for public construction?
Estimating Local Construction WagesTo answer these questions, we turn again
to one of the best sources of wage informa-tion by occupation, BLS. Their Occupational Employment Statistics (OES) survey provides wage estimates for over 800 occupations by state and metropolitan statistical area or MSA (see Appendix D for survey details).
6. Cost to Local Governments and Taxpayers
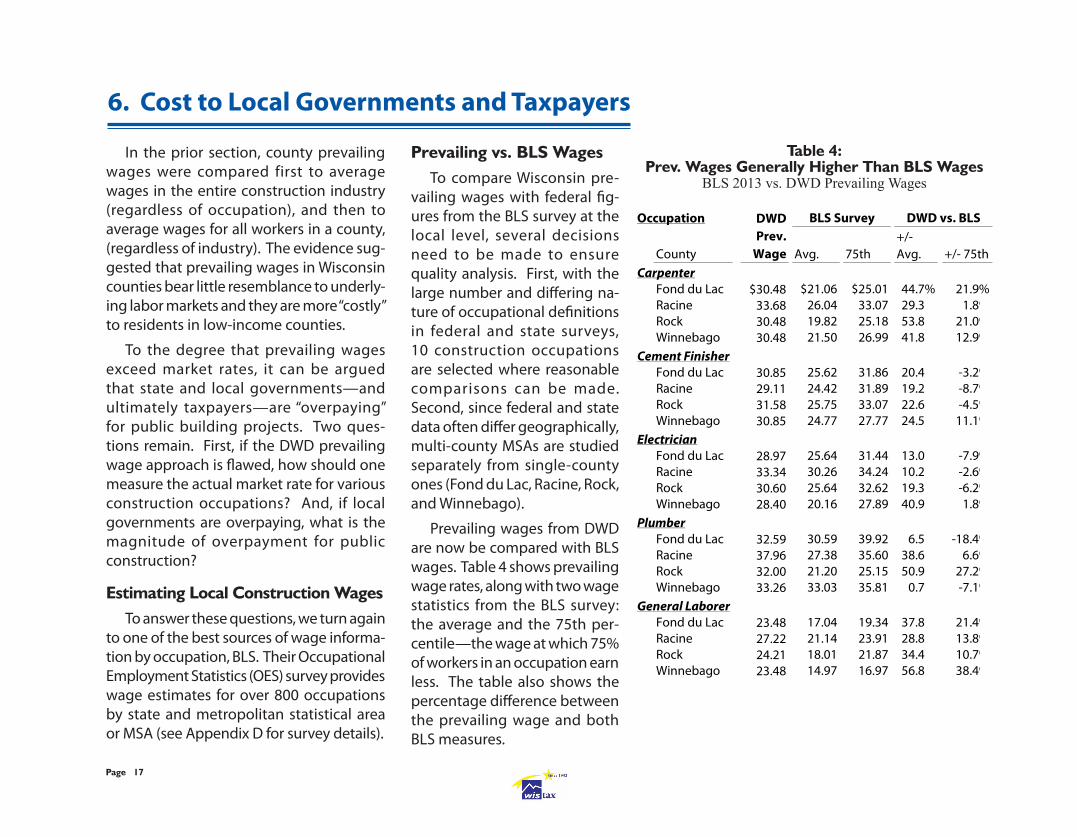
Prevailing vs. BLS WagesTo compare Wisconsin pre-
vailing wages with federal fig-ures from the BLS survey at the local level, several decisions need to be made to ensure quality analysis. First, with the large number and differing na-ture of occupational definitions in federal and state surveys, 10 construction occupations are selected where reasonable comparisons can be made. Second, since federal and state data often differ geographically, multi-county MSAs are studied separately from single-county ones (Fond du Lac, Racine, Rock, and Winnebago).
Prevailing wages from DWD are now be compared with BLS wages. Table 4 shows prevailing wage rates, along with two wage statistics from the BLS survey: the average and the 75th per-centile—the wage at which 75% of workers in an occupation earn less. The table also shows the percentage difference between the prevailing wage and both BLS measures.
Occupation
County Avg. 75th+/- Avg. +/- 75th
CarpenterFond du Lac $30.48 $21.06 $25.01 44.7% 21.9%Racine 33.68 26.04 33.07 29.3% 1.8%Rock 30.48 19.82 25.18 53.8% 21.0%Winnebago 30.48 21.50 26.99 41.8% 12.9%
Cement FinisherFond du Lac 30.85 25.62 31.86 20.4% -3.2%Racine 29.11 24.42 31.89 19.2% -8.7%Rock 31.58 25.75 33.07 22.6% -4.5%Winnebago 30.85 24.77 27.77 24.5% 11.1%
ElectricianFond du Lac 28.97 25.64 31.44 13.0% -7.9%Racine 33.34 30.26 34.24 10.2% -2.6%Rock 30.60 25.64 32.62 19.3% -6.2%Winnebago 28.40 20.16 27.89 40.9% 1.8%
PlumberFond du Lac 32.59 30.59 39.92 6.5% -18.4%Racine 37.96 27.38 35.60 38.6% 6.6%Rock 32.00 21.20 25.15 50.9% 27.2%Winnebago 33.26 33.03 35.81 0.7% -7.1%
General LaborerFond du Lac 23.48 17.04 19.34 37.8% 21.4%Racine 27.22 21.14 23.91 28.8% 13.8%Rock 24.21 18.01 21.87 34.4% 10.7%Winnebago 23.48 14.97 16.97 56.8% 38.4%
BLS SurveyDWD Prev.
Wage
DWD vs. BLS
Table 4: Prev. Wages Generally Higher Than BLS Wages
BLS 2013 vs. DWD Prevailing Wages
Page 18
In most cases, Wisconsin’s prevailing wage is significantly above the BLS average. Of the 20 occupation/county combina-tions shown in the table, 18 (90%) were at least 10% above the BLS average, and 14 (70%) were at least 20% higher. Prevailing wages for plumbers in Fond du Lac and Winnebago counties were roughly in line with BLS averages.
In many cases, the prevailing wage was even higher than BLS wages at the 75th percentile. For example, prevailing wages for carpenters in Fond du Lac and Rock counties were more than 20% above the 75th percentile for the occupation. Pre-vailing wages for general laborers were at least 10% above the 75th percentile in all four counties.
The patterns seen in Table 4 are similar for all 10 occupations studied. In these single-county MSAs, prevailing wages in 76% of the occupations studied were at least 10% above BLS averages; in 60% of occupations, they were more than 20% higher. On average, prevailing wages for these 10 occupations in the four counties were 28.0% higher than the BLS estimates.
BLS and prevailing wage estimates for multi-county MSAs were also examined. Again, the patterns continue. A total of 140 occupations (10 occupations in each of 14 counties) were examined. In 105 (75% of these combinations), the prevailing wage was at least 10% higher than the BLS aver-
age; in 76 (54%), the gap was at least 20%. The average difference between the two was 22%, not appreciably different than the 28% figure found in the single-county MSAs.
When data for all of the MSAs—single- and multi-county—are combined, the aver-age difference between prevailing wages and OES estimates is just over 23%. In other words, Wisconsin’s prevailing wages are, on average, significantly higher than market wages.
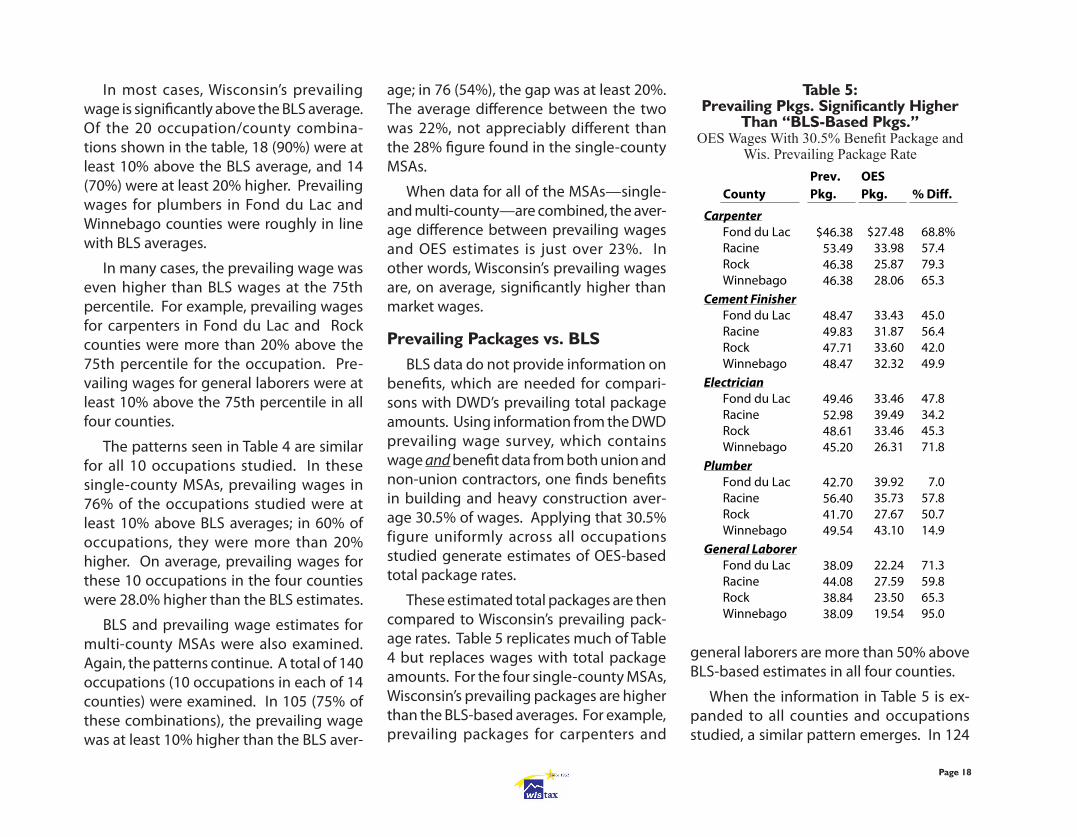
Prevailing Packages vs. BLSBLS data do not provide information on
benefits, which are needed for compari-sons with DWD’s prevailing total package amounts. Using information from the DWD prevailing wage survey, which contains wage and benefit data from both union and non-union contractors, one finds benefits in building and heavy construction aver-age 30.5% of wages. Applying that 30.5% figure uniformly across all occupations studied generate estimates of OES-based total package rates.
These estimated total packages are then compared to Wisconsin’s prevailing pack-age rates. Table 5 replicates much of Table 4 but replaces wages with total package amounts. For the four single-county MSAs, Wisconsin’s prevailing packages are higher than the BLS-based averages. For example, prevailing packages for carpenters and
general laborers are more than 50% above BLS-based estimates in all four counties.
When the information in Table 5 is ex-panded to all counties and occupations studied, a similar pattern emerges. In 124
CountyPrev. Pkg.
OES Pkg. % Diff.
CarpenterFond du Lac $46.38 $27.48 68.8%Racine 53.49 33.98 57.4%Rock 46.38 25.87 79.3%Winnebago 46.38 28.06 65.3%
Cement FinisherFond du Lac 48.47 33.43 45.0%Racine 49.83 31.87 56.4%Rock 47.71 33.60 42.0%Winnebago 48.47 32.32 49.9%
ElectricianFond du Lac 49.46 33.46 47.8%Racine 52.98 39.49 34.2%Rock 48.61 33.46 45.3%Winnebago 45.20 26.31 71.8%
PlumberFond du Lac 42.70 39.92 7.0%Racine 56.40 35.73 57.8%Rock 41.70 27.67 50.7%Winnebago 49.54 43.10 14.9%
General LaborerFond du Lac 38.09 22.24 71.3%Racine 44.08 27.59 59.8%Rock 38.84 23.50 65.3%Winnebago 38.09 19.54 95.0%
Table 5: Prevailing Pkgs. Significantly Higher
Than “BLS-Based Pkgs.”OES Wages With 30.5% Benefit Package and
Wis. Prevailing Package Rate
Page 19
of 177 occupation/county combinations examined, Wisconsin’s prevailing package rate was at least 30% higher than the BLS-based package. In 74 (42%), the Wisconsin prevailing rate was more than 50% higher than the BLS-based one. On average, Wis-consin prevailing packages were 44% higher than BLS package rates.
Even assuming a higher benefit-wage rate does not change the conclusion, only the magnitude. If benefits were assumed to be 50% of BLS wages, rather than 30.5%, Wisconsin prevailing packages would remain, on average, 26% higher than BLS-based estimates.
Impact on Public CostsBecause Wisconsin’s prevailing packages
exceed average market rates determined with more reliable federal data, state and lo-cal governments often “overpay” for build-ing projects. The question now becomes: What is the size of the overpayment?
Even though prevailing packages aver-age 45% more than BLS-based estimates, a shift to BLS-based averages would not produce savings of that magnitude. That is because labor costs are only part of total building cost.
Census Bureau figures for Wisconsin show labor’s share of costs across the entire construction industry was 27% in 2007. That is consistent with a 23%-28% range used by a 2007 Michigan study. A 2005
Minnesota study estimated them between 28% and 39%. We conservatively assume a range of 20% to 30% to estimate the savings that might occur if market rates, rather than prevailing wage rates, were used.
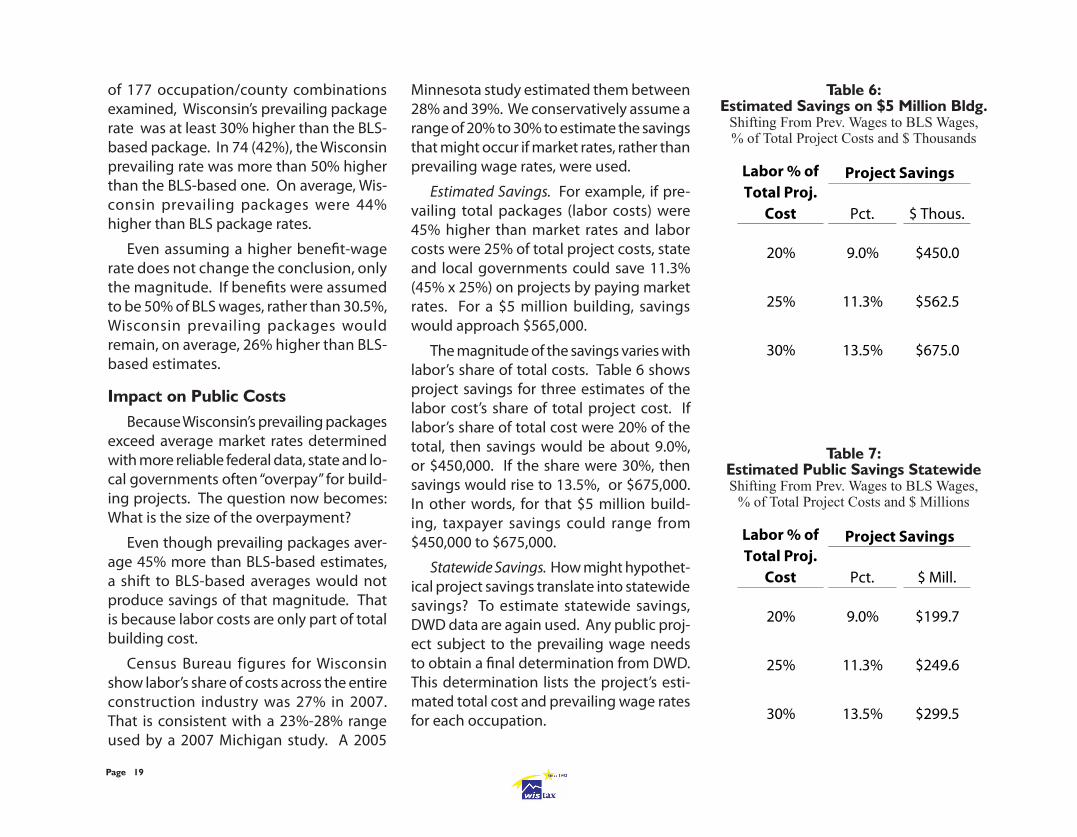
Estimated Savings. For example, if pre-vailing total packages (labor costs) were 45% higher than market rates and labor costs were 25% of total project costs, state and local governments could save 11.3% (45% x 25%) on projects by paying market rates. For a $5 million building, savings would approach $565,000.
The magnitude of the savings varies with labor’s share of total costs. Table 6 shows project savings for three estimates of the labor cost’s share of total project cost. If labor’s share of total cost were 20% of the total, then savings would be about 9.0%, or $450,000. If the share were 30%, then savings would rise to 13.5%, or $675,000. In other words, for that $5 million build-ing, taxpayer savings could range from $450,000 to $675,000.
Statewide Savings. How might hypothet-ical project savings translate into statewide savings? To estimate statewide savings, DWD data are again used. Any public proj-ect subject to the prevailing wage needs to obtain a final determination from DWD. This determination lists the project’s esti-mated total cost and prevailing wage rates for each occupation.
Table 6: Estimated Savings on $5 Million Bldg.
Shifting From Prev. Wages to BLS Wages, % of Total Project Costs and $ Thousands
Table 7: Estimated Public Savings StatewideShifting From Prev. Wages to BLS Wages,
% of Total Project Costs and $ Millions
Pct. $ Thous.
20% 9.0% $450.0
25% 11.3% $562.5
30% 13.5% $675.0
Labor % of Total Proj.
Cost
Project Savings
Pct. $ Mill.
20% 9.0% $199.7
25% 11.3% $249.6
30% 13.5% $299.5
Labor % of Total Proj.
Cost
Project Savings
Page 20
In 2014, DWD issued about 1,500 deter-minations for public building and heavy construction projects totaling about $2.2 billion. Applying the $2.2 billion total to the percentages calculated for a hypotheti-cal project yields estimated dollar savings to the public from paying market-based wages and benefits rather than method-ologically-flawed prevailing wages. Esti-mate savings statewide could have totaled between $199.7 million and $299.5 million in 2014 (see Table 7 on page 19).
These figures should be used with some caution because they do not necessarily reflect annual savings. For some projects, local governments borrow and repay a loan over 20 years. Thus, annual savings are smaller than these amounts; i.e., savings are amortized over the term of the loan.
To illustrate annual savings, assumptions are made about how certain public projects
are funded. In particular, it is assumed that projects costing $1 million or more are funded through borrowing (4% interest over 20 years), while others are funded from operating revenues or cash balances.
Almost $1.9 billion of the $2.2 billion in public projects have price tags of $1 million or more. If that amount were borrowed at 4% interest over 20 years, annual pay-ments would total $139 million. However, if market wages and benefits were used, total borrowing would fall to between $1.6 billion and 1.7 billion, and annual payments would be between $120 million and $127 million. In other words, annual savings on large projects funded by long-term bor-rowing would range from $12.5 million to $18.8 million, depending on the labor share of costs.
For other projects funded out of operat-ing revenues, savings would range from
On average, Wisconsin’s prevailing wages and benefits are 45% higher than total compensation based on a federal BLS survey. In 2014, that could have cost state and local governments here as much as $299.5 million.
$29.4 million to $44.1 million, depending again on the labor share. Combined, total annual savings for large and small projects are likely to total between $41.9 million and $62.9 million.
A final caveat: Some of these projects might also be subject to the Davis-Bacon Law if federal money were involved. If so, savings on those projects would likely be less than amounts estimated here.
Page 21
7. Conclusions
Wisconsin’s prevailing wage laws were passed in the 1930s to ensure that out-of-area contractors with low-wage workers were not able to underbid local contractors on public projects. However, Wisconsin’s approach to calculating prevailing wages has flaws which inflate these compensation requirements above market averages.
With only 10% of contractors respond-ing to DWD’s mandated survey and 85% of reported hours covered under union contracts, the underlying data do not reflect Wisconsin’s construction industry, which is 75% non-union. This response bias inflates
both wages and benefits above true market averages. Federal wage surveys avoid this by ensuring respondent characteristics are similar to those of the entire population.
In addition, Wisconsin is unique in how it calculates average wages from the DWD survey, as it only averages the highest wages, rather than averaging all responses. This unique method can inflate prevailing wages by more than 20%. When wage av-erages are increased, large, out-of-county firms with higher labor costs are competi-tive with smaller, local firms paying market wages, and can “beat out” local firms for public construction projects.
Using estimates from a statistically sound and much larger federal survey shows Wisconsin’s prevailing wages and benefits are, on average, about 45% above market averages. In 2014, this cost state and local governments—and taxpayers—between $199.7 million and $299.5 million on public building and heavy construction projects. o
Page 22
$0
$0
$10
$20
$30
Cement Finisher Prevailing Wage
$0
$10
$20
$30
Electrician Prevailing Wage
$0
$10
$20
$30
$40
Fire Sprinkler Fitter Prev. Wage
Gen'l Laborer
$0
$10
$20
1 4 7 10 13 16 19 22 25 28 31 34 37 40 43 46 49 52 55 58 61 64 67 70
Gen'l Laborer Prevailing Wage
$0
$10
$20
$30
$40
Plumber Prevailing Wage
$0
$0
$10
$20
$30
Sheet Metal Worker Prevailing Wage
$0
$10
$20
$30
$40
Steamfitter Prevailing Wage
$0
$10
$20
Truck Driver Prevailing Wage
$0
$400
$800
$1,200
$1,600
Avg. Weekly Wage
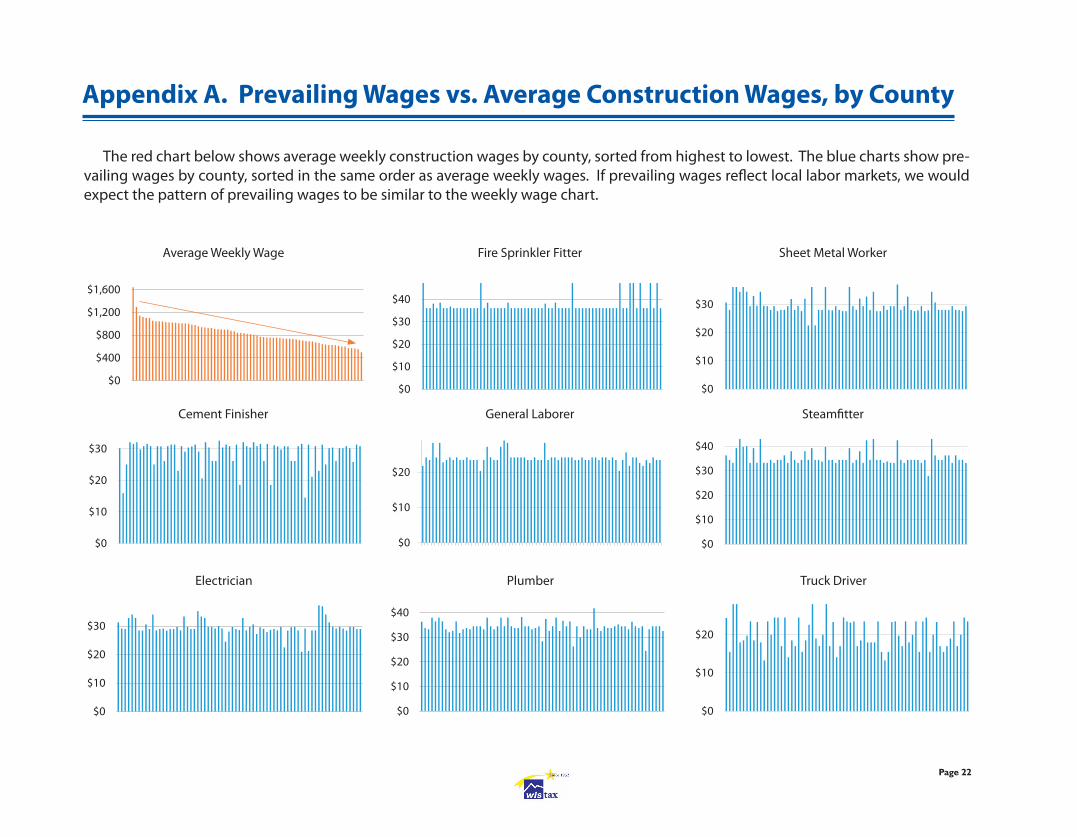
Appendix A. Prevailing Wages vs. Average Construction Wages, by County
The red chart below shows average weekly construction wages by county, sorted from highest to lowest. The blue charts show pre-vailing wages by county, sorted in the same order as average weekly wages. If prevailing wages reflect local labor markets, we would expect the pattern of prevailing wages to be similar to the weekly wage chart.
Average Weekly Wage Fire Sprinkler Fitter Sheet Metal Worker
Cement Finisher General Laborer Steamfitter
Electrician Plumber Truck Driver
Page 23
$0
$400
$800
$1,200
$1,600
Avg. Weekly Wage
$0
$0
$10
$20
$30
$40
Cement Finisher Total Package
$0
$10
$20
$30
$40
$50
Electrician Total Package
$0
$0
$10
$20
$30
$40
$50
Fire Sprinkler Fitter Total Package
$10
$20
$30
$40
$0
$0
$10
$20
$30
$40
Gen'l Laborer Total Package
$0
$10
$20
$30
$40
$50
Plumber Total Package
$0
$0
$10
$20
$30
$40
$50
Sheet Metal Worker Total Package
$0$10$20$30$40$50$60
Steamfitter Total Package
$0
$10
$20
$30
$40
Truck Driver Total Package
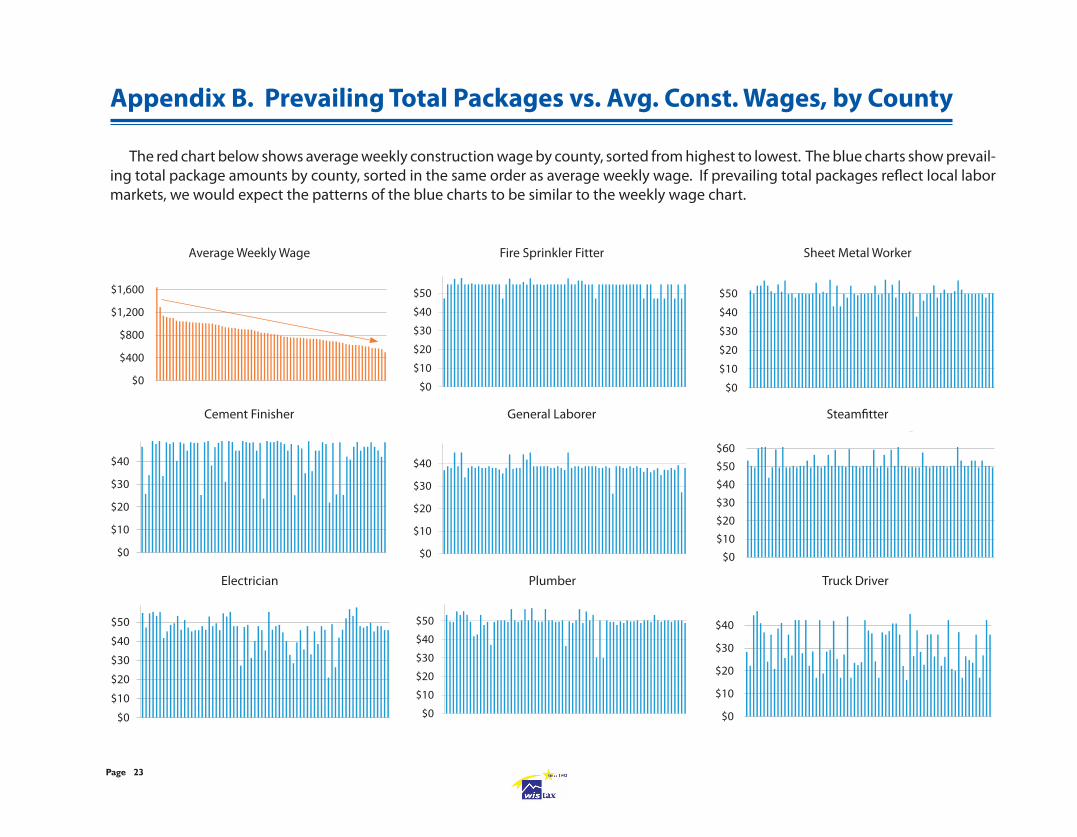
Appendix B. Prevailing Total Packages vs. Avg. Const. Wages, by County
The red chart below shows average weekly construction wage by county, sorted from highest to lowest. The blue charts show prevail-ing total package amounts by county, sorted in the same order as average weekly wage. If prevailing total packages reflect local labor markets, we would expect the patterns of the blue charts to be similar to the weekly wage chart.
Average Weekly Wage Fire Sprinkler Fitter Sheet Metal Worker
Cement Finisher General Laborer Steamfitter
Electrician Plumber Truck Driver
Page 24
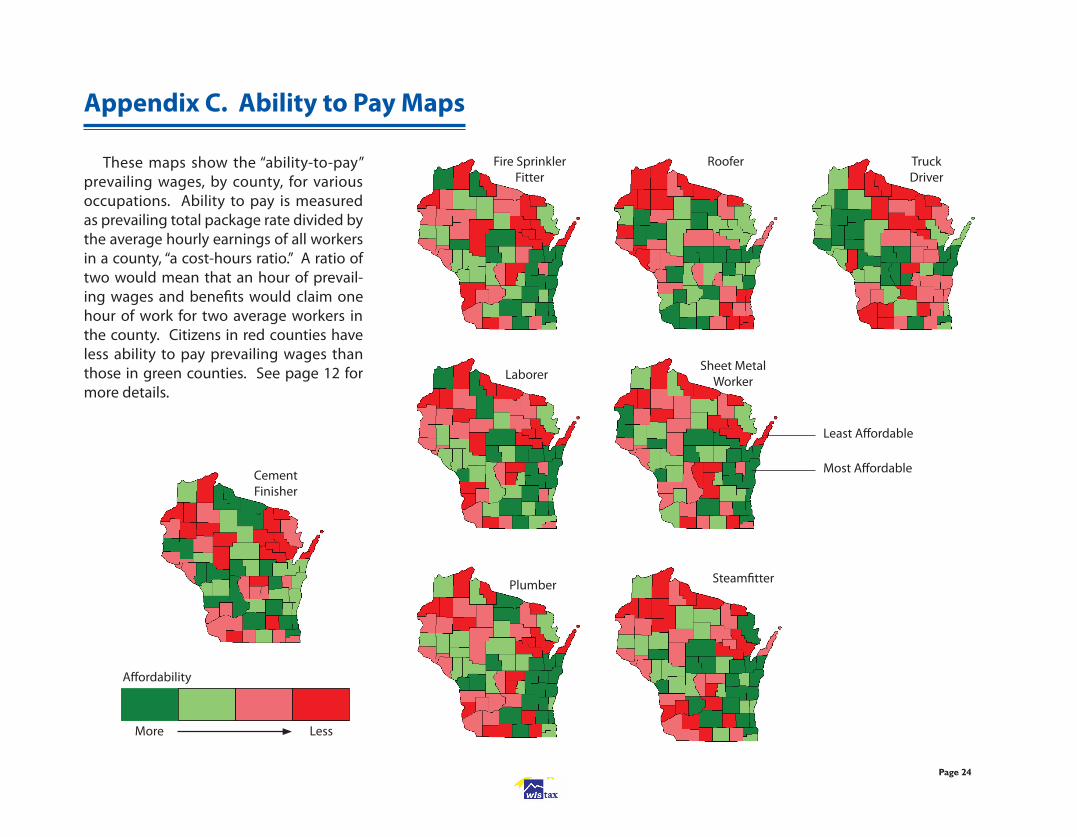
Appendix C. Ability to Pay Maps
More Less
Affordability
These maps show the “ability-to-pay” prevailing wages, by county, for various occupations. Ability to pay is measured as prevailing total package rate divided by the average hourly earnings of all workers in a county, “a cost-hours ratio.” A ratio of two would mean that an hour of prevail-ing wages and benefits would claim one hour of work for two average workers in the county. Citizens in red counties have less ability to pay prevailing wages than those in green counties. See page 12 for more details.
Cement Finisher
Plumber
Laborer
Fire Sprinkler Fitter
Roofer
Sheet Metal Worker
Steamfitter
Truck Driver
Least Affordable
Most Affordable
Page 25
The OES wage survey is conducted twice annually by the U.S. Bureau of Labor Statistics (BLS) using a database construct-ed from unemployment insurance reports to the states—the same database used for Wisconsin’s prevailing wage survey. BLS surveys a random sample of approximately 200,000 establishments nationwide.
Occupational wages are estimated us-ing data from the six most recent surveys, which combined, cover about 76 million of the 133 million workers nationally (57%). For example, the May 2013 occupational estimates use information from surveys in May 2011, 2012, and 2013, and from November 2010, 2011, and 2012. Wage data from the older surveys are “inflation adjusted” to make them comparable to the most recent survey.
This BLS survey provides wage estimates for over 800 occupations by state and by metropolitan statistical area (MSA)—a group of economically interdependent counties. For each occupation, BLS reports estimates of the average and median (half lower, half higher) wage. It also reports es-timates of the wage at various percentiles (10th, 25th, 75th, and 90th) of the wage distribution. The 75th percentile means that the person earning that wage is paid more than 75% of workers in that occupa-
Appendix D. BLS’s OES Survey
tion. Occupational definitions come from the federal Standard Occupational Classifi-cation (SOC) system.
Survey data, even from a huge national sample, are never perfect. So, using these data for this study raises four issues. First, BLS data are reported at the metropolitan statistical are (MSA) level. An MSA is a group of economically interdependent counties. While four Wisconsin MSAs are comprised of a single county, five others consist of multiple counties. Thus, data exist for Fond du Lac and Racine counties individually, but we also have data for Outagamie and Calu-met counties combined, and for Columbia, Dane, and Iowa counties combined. Prevail-ing wage data are all at the county level.
A second related issue is coverage. BLS data cover 18 counties in nine Wisconsin MSAs. Since BLS considers Kenosha, La Crosse, St. Croix, and Douglas counties to be part of MSA’s in Illinois or Minnesota, their data are not used here.
In addition, BLS aggregates informa-tion from non-MSA counties. For example, information for labor markets in Grant, Walworth, and Florence counties are com-bined. For that reason, these data are also not used. That said, 18 counties are used in this study and they are home to two-thirds of Wisconsin construction employment.
A third issue with the BLS data is that the prevailing wage figures in this study apply to one part of the construction industry—building and heavy construction—while federal BLS data span the entire construc-tion industry. Some argue that building and heavy construction often requires a different skill set than other types of con-struction. However, union contracts do not recognize that difference: A union carpen-ter working on a public building project is paid the same rate as one working on a residential building.
Finally, BLS data do not provide informa-tion on benefits, which are part of DWD’s prevailing package rates. To compensate, we adjust BLS wage data to include ben-efits.
Page 26
Azari-Rad, H; Philips, P.; and Prus, M. (2002) “Making Hay When it Rains: The Effect Prevailing Wage Regulations, Scale Economies, Sea-sonal, Cyclical and Local Business Patterns Have on School Construction Costs.” Journal of Education Finance. Vol. 23, pp. 997-1012.
Azari-Rad, H; Philips, P.; and Prus, M. (2003) “State Prevailing Wage Laws and School Construction Costs.” Industrial Relations Vol. 42, No. 3, pp. 445-47.
Belman, D. and Voos, P. (1995) “Prevailing Wage Laws in Construction: The Costs of Repeal in Wisconsin.” The Institute for Wisconsin’s Fu-ture (http://www.faircontracting.org/PDFs/prevailing_wages/PrevailingWage%20Laws%20in%20Construction_%20Cost%20of%20Repeal%20to%20Wisconsin.pdf )
Congressional Budget Office (2000) Budget Options 2000 (www.cbo.gov/ftpdocs/18xx/doc1845/wholereport, page 283)
Dunn, S.; Quigley, J.; and Rosenthal, L. (2005) “The Effect of Prevailing Wage Requirements on the Cost of Low-Income Housing.” Industrial and Labor Relations Review 59 (1): 141-57
Fraundorf, M.; Farrell, J.; and Mason, R. (1984) “The Effect of the Davis-Bacon Act on Construction Costs in Rural Areas.” Review of Econom-ics and Statistics 66 (1); 142-46
Glassman, S.; Head, M.; Tuerck, D.; and Bachman, P. (2008) “The Federal Davis-Bacon Act: The Prevailing Mismeasure of Wages.” Beacon Hill Institute at Suffolk University.
Gould, J.P. and Bittlingmayer, G. (1980) “The Economics of the Davis-Bacon Act: An Analysis of Prevailing Wage Laws.” Washington: American Enterprise Institute
Jordan, L. (2006) “An Evaluation of Prevailing Wage in Minnesota: Implementation, Comparability and Outcomes.” Brevard College (http://wabuildingtrades.org/PrevailingWageStudyFinal1109061.pdf).
Keller, E. and Hartman, W. (2001) “Prevailing Wage Rates: Effects on School Construction Costs, Levels of Taxation and State Reimburse-ments.” Journal of Education Finance, Volume 27: 713-28.
Kersey, P (2007) “The Effects of Michigan’s Prevailing Wage Law.” Mackinac Center for Public Policy (www.mackinac.org/article.aspx?ID=8907).
Mahalia, N. (2008) “Prevailing Wages and Government Contracting Costs: A Review of the Research.” Economic Policy Institute. EPI Brief-ing Paper #215 (http://www.epi.org/publication/bp215/).
Minnesota Taxpayers Association (2005) “Prevailing Wage Rates in Minnesota: An Examination of Alternative Calculation Methods and Their Effects on Public Construction Wages. (https://www.fiscalexcellence.org/our-studies/prevailing-wage-final.pdf ).
Ohio Legislative Service Commission (2002) “S.B. 102 Report: The Effects of the Exemption of School Construction Projects from Ohio’s Prevailing Wage Law.” Staff Research Report #149.
References
Page 27
Philips, P.; Mangum, G.; Waitzman, N.; and Yeagle, A. (1995) “Losing Ground: Lessons from the Repeal of Nine ‘Little Davis-Bacon Acts.’” Department of Economics, University of Utah.
Philips, P. (2001) “A Comparison of Public School Construction Costs In Three Midwestern States that Have Changed Their Prevailing Wage Laws in the 1990s: Kentucky, Ohio and Michigan.” Department of Economics, University of Utah. http://www.faircontracting.org/PDFs/prevailing_wages/Public_School%20Peter%20Phillips.pdf )
Prus, M. (1996) “The Effect of State Prevailing Wage Laws on Total Construction Costs.” Department of Economics, SUNY Cortland.
Thieblot, A. (1996) “A New Evaluation of Impacts of Prevailing Wage Law Repeal.” Journal of Labor Research 17 (2): 297-322.
Vedder, R. (1999) “Michigan’s Prevailing Wage Law and Its Effects on Government Spending and Construction Employment.” Mackinac Center for Public Policy (www.mackinac.org/article.aspx?ID=2380).