Embed Size (px)
Citation preview
An estimate of the number of tropical tree speciesJ. W. Ferry Slika,1, Víctor Arroyo-Rodríguezb, Shin-Ichiro Aibac, Patricia Alvarez-Loayzad, Luciana F. Alvese, Peter Ashtonf,Patricia Balvanerab, Meredith L. Bastiang, Peter J. Bellinghamh, Eduardo van den Bergi, Luis Bernaccie,Polyanna da Conceição Bispoj, Lilian Blanck, Katrin Böhning-Gaesel, Pascal Boeckxm, Frans Bongersn, Brad Boyleo,Matt Bradfordp, Francis Q. Brearleyq, Mireille Breuer-Ndoundou Hockembar, Sarayudh Bunyavejchewins,Darley Calderado Leal Matost, Miguel Castillo-Santiagou, Eduardo L. M. Catharinov, Shauna-Lee Chaiw, Yukai Chenx,Robert K. Colwelly,z, Chazdon L. Robiny, Connie Clarkd, David B. Clarkaa, Deborah A. Clarkaa, Heike Culmseebb,Kipiro Damascc, Handanakere S. Dattarajadd, Gilles Daubyee, Priya Davidarff, Saara J. DeWaltgg, Jean-Louis Doucethh,Alvaro Duqueii, Giselda Duriganjj, Karl A. O. Eichhornkk, Pedro V. Eisenlohrll, Eduardo Elermm, Corneille Ewangor,Nina Farwignn, Kenneth J. Feeleyoo, Leandro Ferreirat, Richard Fieldpp, Ary T. de Oliveira Filhoqq, Christine Fletcherrr,Olle Forshedss, Geraldo Francojj, Gabriella Fredrikssontt, Thomas Gillespieuu, Jean-François Gillethh, Giriraj Amarnathvv,Daniel M. Griffithww, James Groganxx, Nimal Gunatillekeyy, David Harriszz, Rhett Harrisonaaa,bbb, Andy Hectorccc,Jürgen Homeierbb, Nobuo Imaiddd, Akira Itoheee, Patrick A. Jansenn,fff, Carlos A. Jolyggg, Bernardus H. J. de Jongu,Kuswata Kartawinatahhh, Elizabeth Kearsleym, Daniel L. Kellyiii, David Kenfackjjj, Michael Kesslerkkk,Kanehiro Kitayamalll, Robert Kooymanmmm, Eileen Larneynnn, Yves Laumonierooo, Susan Lauranceppp,William F. Lauranceppp, Michael J. Lawesqqq, Ieda Leao do Amaralmm, Susan G. Letcherrrr, Jeremy Lindsellsss,Xinghui Luttt, Asyraf Mansoruuu, Antti Marjokorpivvv, Emanuel H. Martinwww,xxx, Henrik Meilbyyyy, Felipe P. L. Melozzz,Daniel J. Metcalfeaaaa, Vincent P. Medjibed, Jean Paul Metzgerbbbb, Jerome Milletcccc, D. Mohandassdddd,Juan C. Monteroeeee, Márcio de Morisson Valerianoj, Badru Mugerwaffff, Hidetoshi Nagamasulll, Reuben Nilusgggg,Susana Ochoa-Gaonau, Onrizalhhhh, Navendu Pagedd, Pia Paroliniiii, Marc Parrenn, Narayanaswamy Parthasarathyff,Ekananda Paudelaaa, Andrea Permanakkk, Maria T. F. Piedademm, Nigel C. A. Pitmand, Lourens Poortern,Axel D. Poulsenjjjj, John Poulsend, Jennifer Powerskkkk, Rama C. Prasadllll, Jean-Philippe Puyravaudmmmm,Jean-Claude Razafimahaimodisonnnn, Jan Reitsmannnn, João Roberto dos Santosj, Wilson Roberto Spironellomm,Hugo Romero-Saltosoooo, Francesco Roveropppp, Andes Hamuraby Rozakqqqq, Kalle Ruokolainenrrrr,Ervan Rutishauserssss, Felipe Saitertttt, Philippe Sanerkkk, Braulio A. Santosuuuu, Fernanda Santost, Swapan K. Sarkervvvv,Manichanh Satdichanhaaa, Christine B. Schmittwwww, Jochen Schöngartxxxx, Mark Schulzeyyyy, Marcio S. Suganumabbbb,Douglas Sheilooo,zzzz, Eduardo da Silva Pinheiroaaaaa, Plinio Sistbbbbb, Tariq Stevartccccc, Raman Sukumardd,I.-Fang Sunddddd, Terry Sunderandooo, H. S. Sureshdd, Eizi Suzukic, Marcelo Tabarellizzz, Jangwei Tangdddd,Natália Targhettaxxxx, Ida Theiladeyyy, Duncan W. Thomaseeeee, Peguy Tchoutofffff, Johanna Hurtadoggggg,Renato Valenciahhhhh, Johan L. C. H. van Valkenburgiiiii, Tran Van Dojjjjj, Rodolfo Vasquezccccc, Hans Verbeeckm,Victor Adekunlekkkkk, Simone A. Vieiraggg, Campbell O. Webblllll, Timothy Whitfeldmmmmm, Serge A. Wichnnnnn,ooooo,John Williamsppppp, Florian Wittmannqqqqq, Hannsjoerg Wöllrrrrr, Xiaobo Yangsssss, C. Yves Adou Yaottttt,Sandra L. Yapuuuuu, Tsuyoshi Yonedac, Rakan A. Zahawiggggg, Rahmad Zakariauuu, Runguo Zangttt,Rafael L. de Assismm,zzzz, Bruno Garcia Luizemm, and Eduardo M. Venticinquevvvvv
Edited by James H. Brown, University of New Mexico, Albuquerque, NM, and approved April 10, 2015 (received for review December 6, 2014)
The high species richness of tropical forests has long been recognized,yet there remains substantial uncertainty regarding the actual numberof tropical tree species. Using a pantropical tree inventory databasefrom closed canopy forests, consisting of 657,630 trees belonging to11,371 species, we use a fitted value of Fisher’s alpha and an approx-imate pantropical stem total to estimate the minimum number oftropical forest tree species to fall between ∼40,000 and ∼53,000, i.e.,at the high end of previous estimates. Contrary to common assump-tion, the Indo-Pacific region was found to be as species-rich as theNeotropics, with both regions having a minimum of ∼19,000–25,000tree species. Continental Africa is relatively depauperate with a mini-mum of∼4,500–6,000 tree species. Very few species are shared amongthe African, American, and the Indo-Pacific regions. We provide amethodological framework for estimating species richness in trees thatmay help refine species richness estimates of tree-dependent taxa.
diversity estimation | Fisher’s log series | pantropical | spatial richnesspatterns | tropical tree species richness
The authors declare no conflict of interest.
This article is a PNAS Direct Submission.1To whom correspondence should be addressed. Email: [email protected].
This article contains supporting information online at www.pnas.org/lookup/suppl/doi:10.1073/pnas.1423147112/-/DCSupplemental.
Author contributions: J.W.F.S., V.A.-R., and R.K.C. designed research; J.W.F.S. and V.A.-R.performed research; J.W.F.S., V.A.-R., S.-I.A., P.A.-L., L.F.A., P.A., P. Balvanera, M.L.B.,P.J.B., E.v.d.B., L. Bernacci, P.d.C.B., L. Blanc, K.B.-G., P. Boeckx, F.B., B.B., M.B., F.Q.B.,M.B.-N.H., S.B., D.C.L.M., M.C.-S., E.L.M.C., S.-L.C., Y.C., C.L.R., C.C., D.B.C., D.A.C., H.C.,K.D., H.S.D., G. Dauby, P.D., S.J.D., J.-L.D., A.D., G. Durigan, K.A.O.E., P.V.E., E.E., C.E., N.F.,K.J.F., L.F., R.F., A.T.d.O.F., C.F., O.F., G. Franco, G. Fredriksson, T.G., J.-F.G., G.A., D.M.G., J.G.,N.G., D.H., R.H., A.H., J. Homeier, N.I., A.I., P.A.J., C.A.J., B.H.J.d.J., K. Kartawinata, E.K., D.L.K.,D.K., M.K., K. Kitayama, R.K., E.L., Y.L., S.L., W.F.L., M.J.L., I.L.d.A., S.G.L., J.L., X.L., A. Mansor,A. Marjokorpi, E.H.M., H.M., F.P.L.M., D.J.M., V.P.M., J.P.M., J.M., D.M., J.C.M., M.d.M.V.,B.M., H.N., R.N., S.O.-G., O., N. Page, P.P., M.P., N. Parthasarathy, E.P., A.P., M.T.F.P.,N.C.A.P., L.P., A.D.P., J. Poulsen, J. Powers, R.C.P., J.-P.P., J.-C.R., J.R., J.R.d.S., W.R.S., H.R.-S.,F.R., A.H.R., K.R., E.R., F. Saiter, P. Saner, B.A.S., F. Santos, S.K.S., M. Satdichanh, C.B.S.,J. Schöngart, M. Schulze, M.S.S., D.S., E.d.S.P., P. Sist, T. Stevart, R.S., I.-F.S., T. Sunderand,H.S.S., E.S., M.T., J.T., N.T., I.T., D.W.T., P.T., J. Hurtado, R. Valencia, J.L.C.H.v.V., T.V.D.,R. Vasquez, H.V., V.A., S.A.V., C.O.W., T.W., S.A.W., J.W., F.W., H.W., X.Y., C.Y.A.Y., S.L.Y.,T.Y., R.A.Z., R. Zakaria, R. Zang, R.L.d.A., B.G.L., and E.M.V. provided tree inventory data;J.W.F.S. and V.A.-R. analyzed data; and J.W.F.S., V.A.-R., S.-I.A., P.A.-L., L.F.A., P.A., P. Balvanera,M.L.B., P.J.B., E.v.d.B., L. Bernacci, P.d.C.B., L. Blanc, K.B.-G., P. Boeckx, F.B., B.B., M.B., F.Q.B.,M.B.-N.H., S.B., D.C.L.M., M.C.-S., E.L.M.C., S.-L.C., Y.C., R.K.C., C.L.R., C.C., D.B.C., D.A.C., H.C.,K.D., H.S.D., G. Dauby, P.D., S.J.D., J.-L.D., A.D., G. Durigan, K.A.O.E., P.V.E., E.E., C.E., N.F., K.J.F.,L.F., R.F., A.T.d.O.F., C.F., O.F., G. Franco, G. Fredriksson, T.G., J.-F.G., G.A., D.M.G., J.G., N.G., D.H.,R.H., A.H., J. Homeier, N.I., A.I., P.A.J., C.A.J., B.H.J.d.J., K. Kartawinata, E.K., D.L.K., D.K., M.K.,K. Kitayama, R.K., E.L., Y.L., S.L.,W.F.L., M.J.L., I.L.d.A., S.G.L., J.L., X.L., A. Mansor, A.Marjokorpi,E.H.M., H.M., F.P.L.M., D.J.M., V.P.M., J.P.M., J.M., D.M., J.C.M., M.d.M.V., B.M., H.N., R.N., S.O.-G.,O., N. Page, P.P., M.P., N. Parthasarathy, E.P., A.P., M.T.F.P., N.C.A.P., L.P., A.D.P., J. Poulsen,J. Powers, R.C.P., J.-P.P., J.-C.R., J.R., J.R.d.S., W.R.S., H.R.-S., F.R., A.H.R., K.R., E.R., F. Saiter, P. Saner,B.A.S., F. Santos, S.K.S., M. Satdichanh, C.B.S., J. Schöngart, M. Schulze, M.S.S., D.S., E.d.S.P., P. Sist,T. Stevart, R.S., I.-F.S., T. Sunderand, H.S.S., E.S., M.T., J.T., N.T., I.T., D.W.T., P.T., J. Hurtado,R. Valencia, J.L.C.H.v.V., T.V.D., R. Vasquez, H.V., V.A., S.A.V., C.O.W., T.W., S.A.W., J.W., F.W., H.W.,X.Y., C.Y.A.Y., S.L.Y., T.Y., R.A.Z., R. Zakaria, R. Zang, R.L.d.A., B.G.L., and E.M.V. wrote the paper.
www.pnas.org/cgi/doi/10.1073/pnas.1423147112 PNAS Early Edition | 1 of 6
APP
LIED
BIOLO
GICAL
SCIENCE
SEN
VIRONMEN
TAL
SCIENCE
S

Despite decades of biological inventories worldwide, we stilldo not know how many species exist and how they are dis-
tributed (1). Although global patterns of estimated vascular plantspecies richness and distribution have become more clear (2–5),no previous study has focused on trees as a distinct growth form.As a consequence, our estimation of the number of tree speciesin tropical forests still depends on untested expert opinions (6–8)rather than on an appropriate methodological framework anddata set.Given the importance of trees as key structural components of
forest ecosystems, sources of timber and nontimber products,and providers of vital ecosystem services (9, 10), the lack of re-liable estimates of the total number of tropical tree speciesrepresents a critical knowledge gap that has direct consequencesfor estimating the diversity of other tree-dependent taxa (11). Aclassic example is Erwin’s (6) estimate of the existence of 30million arthropod species, which was based on observed hostspecificities of arthropods with individual tropical tree speciescombined with an estimate of the total number of tropical treespecies. Global arthropod richness has subsequently been reviseddownward (7, 11), but current estimates still suffer from the lackof information on the number of tropical tree species.In recent decades, the number of tree inventory plots across
the tropics has grown to such an extent that species richnessestimation at the continental and pantropical scale can now beaddressed using standardized species lists with abundance data.Prior estimates of plant richness at such broad scales have mostlybeen based on analyses of incidence data obtained from her-barium collections and flora treatments (2–5). However, thesemethods are highly sensitive to collecting biases and ignorevaluable information on species’ abundances (12). Abundancedata enable extrapolation of richness from local to global scalesusing diversity estimators that fit the observed species rankabundance data (13–15).
Results and DiscussionWe estimate the number of tropical tree species from a stan-dardized dataset of old-growth tropical forest tree inventories,including gymno- and angiosperms with diameters at breastheight (dbh) ≥10 cm. This dataset contains tree species abun-dance data for 207 1° grid cells (locations) originally dominatedby closed-canopy forests across the tropics (Fig. 1). By calcu-lating Fisher’s alpha (16) at the pantropical scale and com-bining this value with the estimated potential number of stemspresent within 500 km of each location, we arrive at a minimumnumber of tropical tree species of at least ∼40,000 and possiblymore than ∼53,000 (Table 1), i.e., at the high end of currenttotal estimates of 37,000 (7), 43,000 (8) and 50,000 (6), whichare based on expert opinion.When the analysis was restricted to each of the three main
tropical regions, we found that the Indo-Pacific had comparable
tree species richness to that found in tropical America (Table 1).Moreover, these two regions show similar rates of species turn-over for a given increase in geographical distance between lo-cations (Fig. 2). This result contradicts the widely held view thatthe Neotropics are the most diverse and species-rich region fortropical trees (8, 15, 17, 18). This underestimation of Indo-Pacific tree species richness, and our inclusion of dry as well asmoist and wet forests, may explain why some of the previousestimates (7, 8) are lower than ours. Nevertheless, the highspecies richness in the Indo-Pacific is understandable given thehighly variable topography, complex geological history, steepenvironmental gradients, past and ongoing merging of severalcontrasting floras from Madagascar, India, Southeast Asia, andNew Guinea–Australia (19, 20), as well as the large current andtime-integrated forest area (8).Tropical continental Africa has a relatively depauperate tree
flora, a finding consistent with earlier studies (21, 22). This re-gion shows comparatively low species turnover; in other words,as sample area increases, the number of tree species increases ata much slower rate than in either the Indo-Pacific or the Neo-tropics (Fig. 2). The differences in species richness and spatialturnover, when comparing continental Africa with the othertropical regions, cannot be explained solely by Africa’s smallerforest area or lower environmental variability (Table 1 and Figs.S1 and S2). Rather, these disparities further support the hy-pothesis that African forests have experienced severe extinctionevents due to repeated shrinkage of forest area during thePleistocene (19, 23). When these forests expanded to theirpresent size, they could only be repopulated by a severely depletedspecies pool derived from a limited number of refugia. In contrast,tropical America retained considerable forest cover and equatorialforests of the Indo-Pacific may even have expanded during thesame period (19, 20, 23, 24).We provide, to our knowledge, the first survey-based minimum
estimate of tropical tree species richness and its distribution. Weacknowledge, however, that the current estimate is just a first stepin an ongoing effort. Estimates of species richness will becomemore refined and increasingly accurate as forest surveys continueto expand. This study highlights the usefulness and critical impor-tance of forest surveys, and we emphasize once more the existenceof large numbers of tree species with exceptionally small pop-ulation sizes, which may necessitate novel conservation approachesfor effective preservation of current tree diversity (25, 26).
Materials and MethodsData Set. Tree inventory data (gymnosperms and angiosperms only; trunkdbh ≥10 cm) from old-growth forest plots without signs of recent humandisturbance were compiled from across the tropics and subtropics (i.e.,within 30° north and south of the equator). Individual trees from the in-ventories were pooled within their respective 1° grid cells (henceforth calledlocations). Species names were standardized using The Plant List (www.theplantlist.org), Taxonomic Name Resolution Service (tnrs.iplantcollaborative.org/TNRSapp.html), and The Asian Plant Synonym Lookup (phylodiversity.net/fslik/synonym_lookup.htm). Unknown taxa were not used in diversity andcomposition analyses. We removed all locations with fewer than 250 identifiedindividuals to minimize effects of sample size, resulting in 207 retained loca-tions (Dataset S1), each showing a reasonably high sample coverage (0.96 ± 0.3,mean ± SE) that did not differ among geographic areas (Table S1), thus sug-gesting that our estimations of species richness were not biased by differencesin sample coverage among regions.
Phylogeographic Analyses. To identify the main tropical regions for speciesrichness comparison, we performed minimum variance clustering withsquared Euclidean distances on square root-transformed relative abundancedata at the genus level (Fig. S1). These analyses were conducted at the genuslevel because virtually no overlap existed between continents at the specieslevel. We subsequently ran a detrended component analysis to visualizethese floristic patterns across the tropics (Fig. 1). To assess if difference inspecies richness and turnover among regions are related to differences inenvironmental variability among regions, we performed a principal component
Significance
People are fascinated by the amazing diversity of tropical for-ests and will be surprised to learn that robust estimates of thenumber of tropical tree species are lacking. We show that thereare at least 40,000, but possibly more than 53,000, tree speciesin the tropics, in contrast to only 124 across temperate Europe.Almost all tropical tree species are restricted to their respectivecontinents, and the Indo-Pacific region appears to be as spe-cies-rich as tropical America, with each of these two regionsbeing almost five times as rich in tree species as African tropicalforests. Our study shows that most tree species are extremelyrare, meaning that they may be under serious risk of extinctionat current deforestation rates.
2 of 6 | www.pnas.org/cgi/doi/10.1073/pnas.1423147112 Slik et al.

analysis of locations vs. environmental variables [climatic data (27) and edaphicdata (28)] (Fig. S2).
Sample Coverage and Nonparametric Estimators of Species Richness. Becauseestimates of species richness can be strongly dependent on differences ininventory completeness (29, 30), we estimated the inventory completenessfor the complete database and for each region separately using the samplecoverage estimator recommended by Chao and Shen (31), which is a re-duced-bias estimator of sample completeness:
Cn = 1−f1n
� ðn− 1Þf1ðn−1Þf1 + 2f2
�,
where f1 and f2 are the number of species represented by one (singletons)and two (doubletons) individuals in the sample, respectively, n is the totalnumber of individuals in the sample, and Cn is the proportion of the totalnumber of individuals in an assemblage (observed and not observed) thatbelong to the species represented in the sample. Sample coverage was al-most identical in all regions (Table S1), suggesting that our regional com-parisons of species richness were not biased by differences in samplecoverage among regions, and our pantropical estimate were not dispro-portionately influenced by any one region (30).
Estimates of sample coverage indicated that more than 90% of all of thetrees present in the tropics belonged to species included in our recordedsamples (Table S1). We also computed estimates of species richness based onseveral nonparametric estimators (Table S2). In particular, we considerednine of the estimators available in the software Species Prediction and Di-versity Estimation (SPADE) (31), and they estimated that, on average, wehave recorded between 79% and 91% of the species present in all regions(Table S2). However, consistent with ter Steege et al. (15), we found thatthese methods underestimated the species richness, because estimates foreach tropical region (1,539–1,680 species in Africa; 4,959–5,540 in America;and 6,232–6,784 species in Asia) were between one-half and one-third ofprevious estimates based on expert opinion and available floras (6–8). Infact, recent estimates suggest that there are ∼16,000 tree species in theAmazon (15), so having fewer than 5,540 tree species in the whole Neo-tropics is highly unlikely (Table S2). As ter Steege et al. (15) argued, thefailure of these nonparametric methods to yield plausible estimates arisesfrom fact that these estimators are designed to estimate the expectednumber of species at a local scale, based on samples that are fully repre-sentative of the area sampled (15, 32). However, like ter Steege et al. (15),
we are attempting to estimate the number of species for the whole tropics,including areas that have been poorly sampled.
Selection of Species Abundance Distribution Model to Predict Species Richness.Several models have been proposed to describe observed species abundancedistributions (SADs) within a community (33). SAD models allow for an un-derstanding of the abundance structure of biological communities, and can beuseful for predicting unsampled portions of communities. The fit of SAD modelsto the data depends, among other factors, on community evenness and sam-pling intensity (33, 34). For instance, extremely uneven SADs are predicted by thegeometric series (35), whereas unusually even SADs are predicted by the brokenstick model (36). The log series (16) and log normal (37) models are intermediate,differing in the assumed proportions of rare species: Fisher’s log series assumesvery high proportions of rare species, whereas the log-normal model assumesvery low proportions of rare species (33). Regarding sampling intensity,complete surveys usually follow log-normal types of SADs, whereas in-complete sampled communities usually deviate from log normality (34).
Here we used Fisher’s log series to estimate the expected number of specieswithin each region. The log series distribution is one of the most frequentlyused and thoroughly investigated models of the relationship between speciesrichness and the relative abundance of species (33), and it has been successfullyused to estimate the number of species at different spatial scales (14, 15, 25),although not previously at an intercontinental scale. To fit and compare the logseries model with other commonly used SAD models [i.e., log normal, brokenstick, and Pareto (power law) distributions], we used maximum-likelihood toolswith the sads package for R 3.0.3 (38). We ranked the models from the best tothe worst based on Akaike’s information criterion (AIC). The set of models witha difference in AIC (Δ) <2 can be considered to have equivalently strong em-pirical support and similar plausibility (39).
Graphical comparison of the models showed that the log series providedthe best fit to our data (Fig. S3); this result was confirmed by the AIC analyses,in which the log series model had the strongest support (Table S3). The visualanalysis of the frequency of species in octaves of abundance (so-called“Preston plots”) predicted by each SAD model also supported the idea thatlog series fit the data well and was the best model to predict the proportionof rare species (Figs. S4–S7). Therefore, we can conclude that the log series isan appropriate SAD model to fit our data.
Application of Fisher’s Log Series. Fisher’s alpha values can be used to extrap-olate species richness of a defined region if the number of individuals is known.Extrapolations with Fisher’s alpha, however, rely on two assumptions: (i) species
543210
Fig. 1. Overview of sample locations and their floristic affinities (point colors correspond to scores on the first DCA axis with similar colors indicating similargeneric composition, and the lines indicate the floristic affinities as determined by cluster analysis).
Table 1. Species richness estimates for the tropics and the three main tropical subregions
RegionSpeciesobserved
Stemsobserved
Unidentifiedstems, %
Fisher’s alphaminimum
Fisher’s alphamaximum
Stemsestimated
Speciesminimum
Speciesmaximum
Africa 1,376 117,902 8.4 218.7 286.6 3.4 × 10¹¹ 4,626 5,984America 4,375 116,754 13.5 897.2 1,203.4 8.9 × 10¹¹ 18,589 24,580Indo-Pacific 5,672 422,974 9.6 925.8 1,225.2 7.7 × 10¹¹ 19,014 24,819Pantropical 11,371 657,630 10.1 1953.0 2,607.7 2.0 × 10¹² 40,517 53,345
Observed values represent the numbers in the original dataset. Unidentified stems were excluded from estimation of minimum Fisher’s alpha, but usedto calculate maximum Fisher’s alpha. Estimated stems represent the number of stems predicted to occur within 500 km of each of the 207 samplelocations.
Slik et al. PNAS Early Edition | 3 of 6
APP
LIED
BIOLO
GICAL
SCIENCE
SEN
VIRONMEN
TAL
SCIENCE
S
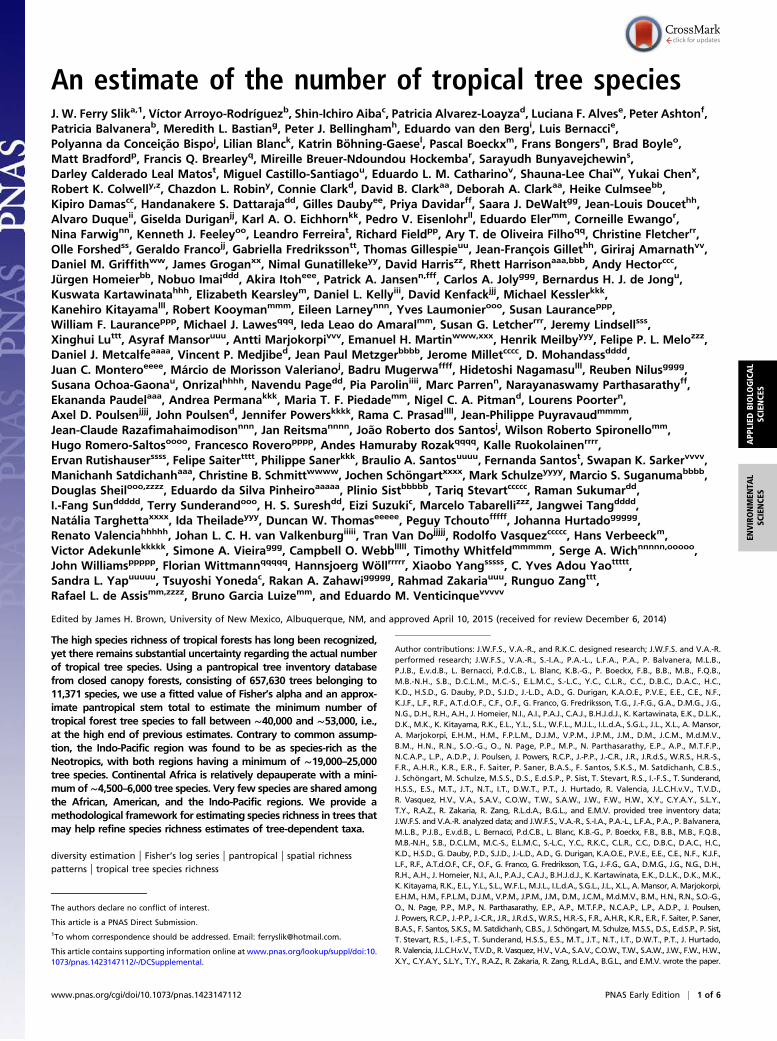
abundances are distributed in a log-series manner, and (ii ) the plantcommunity is homogeneous at the scale of the sampling. The first as-sumption held true in our case and is generally valid even for small samplesizes in tropical forests (13). The second assumption may be an adequateapproximation at small spatial scales for most lowland tropical forests(15, 40) but is unquestionably violated at larger spatial scales due to in-creasingly biogeographically, environmentally, and spatially structuredplant communities. In such cases, a large number of randomly placed samplesites are needed to capture this heterogeneity, which might adequatelyapproximate the homogeneity assumption at a large spatial scale. Despitethe large number of plots used in this study, the second assumption wasnot completely met at the continental scale, as shown by the incompleteleveling off of the Fisher’s alpha curves (Fig. 2A); this means that our regionalFisher’s alpha values, and thus our species richness estimates, remain minimumestimates of the true values.
Lower-Bound Estimation of Species Richness. For each 1° grid cell locatedwithin500 km of our 207 locations (excluding major water bodies), we calculated thetotal number of stems as the inverse distance-weighted average of the stemdensity observed in the five nearest locations, multiplied by the size of each gridcell (Fig. S8). Latitudinal change in grid cell size was taken into account. Becauseour analysis was focused on original (potential) tree species richness, weignored recent deforestation. Uncertainty in this spatial extrapolation wasassessed with a jackknife approach using 100 runs. Jackknifing removes eachdata point in turn and recomputes the spatial surface based on the remainingpoints. The differences between the original data values and the cross-vali-dated values indicate the prediction accuracy of the surface model (Fig. S8).
The lower boundof species richness at the pantropical and continental scaleswas then calculated using Fisher’s log series, with Fisher’s alpha and totalnumber of stems as input variables at each spatial scale. Because the totalnumber of stems was upscaled by several orders of magnitudes, one mightexpect that this extreme extrapolation could potentially cause a large error inour species richness estimates. However, a simple sensitivity test, in which wevaried stem numbers between 0.1 and 1.9 times the estimated values for each
spatial scale (a range much larger than the observed error in our stem numberpredictions), showed that this extreme perturbation in stem number resultedin only a 3–11% difference in number of species predicted (Table S4).
Upper-Bound Estimation of Species Richness.Our species richness estimates arenear the true value if the unidentified species (individual recorded, but notidentified) in the tree inventories, which we excluded from the analyses,follow the same rank abundance pattern as the identified species. However, ifrare species are disproportionately represented in the unidentified category,our analyses may have underestimated the true Fisher’s alpha and thus thespecies richness estimates. Because we did not know the relative abundanceof rare species in the category of unidentified individuals, we selected adataset of multiple tree inventories with a total of 10,647 individual treesfrom eastern Borneo for which this information was available. All individualsin this dataset were either identified to species or only to morphospecies(unidentified). A Mann–Whitney U test showed that, not surprisingly, rarespecies were disproportionately represented in the unidentified category(df = 1, n = 1,103, W = 194,798, P < 0.0001).
Using logistic regression of species square root-transformed abundance vs.identification status (identified vs. unidentified), we predicted the probabilitythat a tree species would be classified as identified. This classification prob-ability was then assigned to each individual tree belonging to that species.After adding a random number between 0 and 1 to the classification prob-ability of each individual tree, to account for the fact that even individualsbelonging to common species may remain unidentified, we sorted the wholelist of individuals from high to low.We produced 10 such sorted lists, each timevarying the random number added to the classification probability of an in-dividual tree. For each list we could then count the number of species presentwithin any level of identified individuals and calculate a minimum Fisher’salpha. The average of these 10 minimum Fisher’s alpha values could then becompared with the actual Fisher’s alpha observed for the whole list. Dividingthe actual Fisher’s alpha by the minimum Fisher’s alpha gives an inflationfactor with which observed Fisher’s alpha values can be multiplied to estimatethe upper boundary of Fisher’s alpha for any percentage of identified species.
0
100
200
300
400
500
600
700
800
900
1000
0 20 40 60 80 100 120
0
200
400
600
800
1000
1200
0 2000 4000 6000 8000 10000 12000 14000
Fish
er’s-
alph
aFi
sher
’s-al
pha
Sample sites
Distance (km)
Tropical America
Tropical Indo-Pacific region
Con�nental tropical Africa
A
B
Fig. 2. Increase in Fisher’s alpha with (A) increasing numbers of locations (average of 50 replicates per region with random input order of locations), i.e.,regional diversity, and (B) increasing distance around locations (based on 50 replicates per region each with a randomly selected starting location), i.e., speciesturnover. Error bars indicate SD among location reorderings. Fisher’s alpha can decline if the number of stems added to the sample increases disproportionallyto the number of new species detected.
4 of 6 | www.pnas.org/cgi/doi/10.1073/pnas.1423147112 Slik et al.

The inflation factor (Y) showed a power–function relationship with ratio ofidentified individuals (X) given by Y = 1.2237 × X−0.767. Using the appropriateinflation factor, we calculated the maximum expected species richness at allspatial scales (Table 1).
ACKNOWLEDGMENTS. We thank Michael Fine and one anonymous reviewerfor useful comments, and David Newbery, Thorsten Wiegand, George Weiblen,Vojtech Novotny, Punchi Manage Saranga Amila Ruwan, Stuart Davies, Miriamvan Heist, Terese Hart, Helen Murphy, Kazuki Miyamoto, Sylvester Tan, EdmundTanner, Mauricio Alvarez, Ana Andrade, Phourin Chhang, George Chuyong,Indiana Coronado, Chang-Fu Hsieh, Shawn Lum, Jean-Remy Makana, Cao Min,Xiaoxue Mo, Meyner Nusalawo, Atila Oliveira, Lars Schmidt, Lee Sing Kong,Takuo Yamakura, and Nicole Zweifel for providing inventory data. Funding wasprovided by the Arnold Arboretum of Harvard University; Belgian Science Policy(SD/AR/01A); Botanic Garden Meise; Brazilian Science Council; Conselho Nacionalde Desenvovimento Científico e Tecnológico of Brazil [MAUA (PRONEX-FAPEAM1600/2006), Universal (479599/2008-4)/CNPq (309458/2013-7)]; British EcologicalSociety (4709/5747); Coordination of Improvement of Higher Education Person-nel, Brazil; DEFRA Darwin Initiative; Deland Award for student research, ArnoldArboretum; Department of Biotechnology–National Remote Sensing Agency,India; Department of National Parks, Wildlife and Plant Conservation, Thailand;El Consejo de Ciencia y Technologia Grant 33851-B; Federal Ministry of Educationand Research, Germany; Forest Department Sarawak, Malaysia; Fulbright Pro-gram; Fundação de Amparo a Pesquisa de Minas Gerais, Brazil; German Agencyfor International Cooperation Projects 08.7860.3-001.00 and 13.1432.7-001.00;German Science Foundation Grants CRC 552 and CU127/3-1, HO 3296/2-2,HO3296/4-1, and RU 816; Grant Agency of the Czech Republic Project14-36098G; Intitut National pour L’etude et la Recherche Agronomiques,Democratic Republic Congo; Instituto Nacional de Pesquisas de Amazonia/
Max Planck Institute for Chemistry; Large-Scale Biosphere Atmosphere Exper-iment in Amazonia; Missouri Botanical Garden; Museo delle Scienze; NationalInstitute for Environmental Studies, Japan; National Science Foundation (NSF)Grants DEB-0075334, DEB-0515678, LTEB1357177, LTREB/DEB1357112, NSFDEB-0424767, NSF DEB-0639393, NSF DEB-1147429, NSF DEB-1350125, NSF-DEB-1053237, and NSF DEB-0841885; NERC Human-Modified Tropical ForestsProgramme; Operation Wallacea; PAPIIT-DGAPA-UNAM IB-200812, IN-204215,Mexico; Pontificia Universidad Catolica del Ecuador; Rockefeller Foundation;Royal Forest Department of Thailand; Royal Society South-East Asia RainforestResearch Programme Project RS243; Rufford Small Grant Foundation; St. LouisZoo; São Paulo Research Foundation Project FAPESP 03/12595-7-COTEC/IF41.065/2005-IBAMA/CGEN 093/2005; Smithsonian Tropical Research Institute;Society of Systematic Biologists; Systematics Association; Swiss National ScienceFoundation; Tropenbos International; University of Minnesota; US Departmentof Agriculture Forest Service, International Institute of Tropical Forestry; USAID;and theWorldWildlife Fund. Part of the data in this publication were providedby the Tropical Ecology Assessment and Monitoring (TEAM) Network, a collab-oration between Conservation International, the Missouri Botanical Garden,the Smithsonian Institution, and the Wildlife Conservation Society, and par-tially funded by these institutions, the Gordon and Betty Moore Foundation,and other donors. The Center for Tropical Forest Science network has receivedmajor support from the Smithsonian Institution, particularly the SmithsonianTropical Research Institute, the Arnold Arboretum of Harvard University, theNational Science Foundation, the Rockefeller Foundation, the John MerckFund, the John D. and Catherine T. MacArthur Foundation, the AndrewW. Mellon Foundation, the Frank Levinson Family Foundation, the HSBC Cli-mate Partnership, the Bromley Charitable Trust, John Swire & Sons Pty Ltd., andSmall World Institute Fund.
aFaculty of Science, Universiti Brunei Darusallam, Gadong, Brunei; bCentro de Investigaciones en Ecosistemas, Universidad Nacional Autónoma de México,Morelia, Mexico; cKagoshima University, Kagoshima, Japan; dCenter for Tropical Conservation, Duke University, Durham, NC; eInstituto Agronômico deCampinas, Campinas, Brazil; fDepartment of Organismic and Evolutionary Biology, Harvard University, Cambridge, MA; gSmithsonian National ZoologicalPark, Washington, DC; hLandcare Research, Lincoln, New Zealand; iUniversidade Federal de Lavras, Lavras, Brazil; jNational Institute for Space Research (INPE),São José dos Campos, São Paulo, Brazil; kCentre de Cooperation Internationale en Recherche Agronimique pour le Developpement (CIRAD), Belem, Brazil;lBiodiversity and Climate Research Centre (BiK-F), Senckenberg, Gesellschaft für Naturforschung, Frankfurt (Main), Germany; mGhent University, Gent,Belgium; nWageningen University, Wageningen, The Netherlands; oUniversity of Arizona, Tucson, AZ; pCommonwealth Scientific and Industrial ResearchOrganization (CSIRO) Land and Water, Tropical Forest Research Centre, Atherton, Australia; qManchester Metropolitan University, Manchester, UnitedKingdom; rWildlife Conservation Society, Congo Program, Nouabalé-Ndoki National Park, Republic of Congo; sDepartment of National Parks, Wildlife andPlant Conservation, Bangkok, Thailand; tMuseu Paraense Emílio Goeldi, Belem, Brazil; uEl Colegio de la Frontera Sur (ECOSUR), Chiapas, Mexico; vInstituto deBotânica de São Paulo, São Paulo, Brazil; wAlberta Innovates–Technology Futures, Vegreville, AB, Canada; xCollege of Life Sciences, Hainan Normal University,Haikou, China; yUniversity of Connecticut, Storrs, CT; zUniversity of Colorado, Boulder, CO; aaUniversity of Missouri, St. Louis, MO; bbUniversity of Göttingen,Göttingen, Germany; ccPNG Forest Research Institute, Lae, Papua New Guinea; ddIndian Institute of Science, Bangalore, India; eeUniversite Libre de Bruxelles,Brussels, Belgium; ffPondicherry University, Puducherry, India; ggClemson University, Clemson, SC; hhGembloux Agro-Bio Tech, Université de Liège, Gembloux,Belgium; iiUniversidad Nacional de Colombia, Medellin, Colombia; jjInstituto Florestal de Sao Paulo, Sao Paulo, Brazil; kkEichhorn Ecology, Zeist, TheNetherlands; llUniversidade do Estado de Mato Grosso, Caceres, Brazil; mmInstituto Nacional de Pesquisas da Amazônia, Manaus, Brazil;nnPhilipps-Universität Marburg, Marburg, Germany; ooInternational Center for Tropical Botany, Florida International University, Miami, FL; ppUniversity ofNottingham, Nottingham, United Kingdom; qqInstituto de Ciências Biológicas, Universidade Federal de Minas Gerais (UFMG), Pampulha, Belo Horizonte,Brazil; rrForest Research Institute Malaysia, Kuala Lumpur, Malaysia; ssWorld Wildlife Fund (WWF) Sweden, Stockholm, Sweden; ttPanEco/Sumatran OrangutanConservation Program (SOCP), Medan, North Sumatra, Indonesia; uuUniversity of California, Los Angeles, CA; vvInternational Water Management Institute,Colombo, Sri Lanka; wwUniversidad Laica Eloy Alfaro de Manabi, Manta, Ecuador; xxMount Holyoke College, South Hadley, MA; yyUniversity of Peradeniya,Peradeniya, Sri Lanka; zzRoyal Botanical Garden Edinburgh, Edinburgh, United Kingdom; aaaCentre for Mountain Ecosystem Studies, Kunming Institute ofBotany, Chinese Academy of Sciences, Kunming, China; bbbChina &World Agroforestry Centre (ICRAF), East and Central Asia Regional Office, Kunming, China;cccUniversity of Oxford, Oxford, United Kingdom; dddPrimate Research Institute, Kyoto University, Kanrin, Inuyama, Aichi, Japan; eeeOsaka City University,Osaka, Japan; fffSmithsonian Tropical Research Institute, Panama, Republic of Panama; gggUniversidade Estadual de Campinas, Campinas, Brazil; hhhHerbariumBogoriense, Research Center for Biology, Indonesian Institute of Sciences (LIPI), Cibinong, Indonesia; iiiTrinity College, University of Dublin, Dublin, Ireland;jjjSmithsonian Tropical Research Institute, Washington, DC; kkkUniversity of Zurich, Zurich, Switzerland; lllKyoto University, Kyoto, Japan; mmmMacquarie University,Sydney, Australia; nnnCentre ValBio, Ranomafana, Madagascar; oooCenter for International Forestry Research (CIFOR), Bogor, Indonesia; pppJames Cook University,Cairns, Australia; qqqResearch Institute for the Environment and Livelihoods, Charles Darwin University, Darwin, Australia; rrrPurchase College, State University ofNew York, Purchase, NY; sssRSPB, Sandy, Bedfordshire, United Kingdom; tttInstitute of Forest Ecology, Environment and Protection, Chinese Academy of Forestry,Beijing, China; uuuUniversiti Sains Malaysia, Georgetown, Penang, Malaysia; vvvStora Enso Oyj, Helsinki, Finland; wwwUdzungwa Ecological Monitoring Centre,Mang’ula, Tanzania; xxxSokoine University of Agriculture, Morogoro, Tanzania; yyyUniversity of Copenhagen, Copenhagen, Denmark; zzzUniversidade Federal dePernambuco, Recife, Brazil; aaaaCSIRO Land and Water, EcoSciences Precinct, Dutton Park, Australia; bbbbUniversidade de São Paulo, Sao Paulo, Brazil; ccccNationalUniversity of Laos, Vientiane, Laos; ddddKey Laboratory of Tropical Forest Ecology, Xishuangbanna Tropical Botanical Garden, Chinese Academy of Sciences,Menglun, China; eeeeFaculty of Environment and Natural Resources, University of Freiburg, Freiburg, Germany; ffffInstitute of Tropical Forest Conservation,Kampala, Uganda; ggggSabah Forestry Department, Sandakan, Sabah, Malaysia; hhhhUniversity of Sumatera Utara, Medan, Sumatra, Indonesia; iiiiUniversity ofHamburg, Hamburg, Germany; jjjjUniversity of Oslo, Oslo, Norway; kkkkDepartment of Ecology, Evolution, and Behavior, University of Minnesota, St. Paul, MN;llllInternational Institute of Information Technology, Hyderabad, India; mmmmSigur Nature Trust, Masinagudi, India; nnnnBureau Waardenburg bv, Culemborg, TheNetherlands; ooooDepartment of Biology, Yachay Tech University, Ciudad del Conocimiento, Urcuquí, Ecuador; ppppMUSE Museo delle Scienze, Trento, Italy;qqqqCibodas Botanic Gardens, Indonesian Institute of Sciences (LIPI), Cianjur, Indonesia; rrrrUniversity of Turku, Turku, Finland; ssssCarboforexpert, Geneva,Switzerland; ttttInstituto Federal do Espírito Santo, Santa Teresa, Brazil; uuuuUniversidade Federal da Paraíba, João Pessoa, Brazil; vvvvShahjalal University of Science& Technology, Sylhet, Bangladesh; wwwwChair for Landscape Management, University of Freiburg, Freiburg, Germany; xxxxInstituto Nacional de Pesquisas daAmazônia, Max Planck Project, Manaus, Brazil; yyyyOregon State University, Corvallis, OR; zzzzNorwegian University of Life Sciences, Aas, Norway; aaaaaUniversidadeFederal do Amazonas, Manaus, Brazil; bbbbbCIRAD, Monpellier, France; cccccMissouri Botanical Garden, St. Louis, MO; dddddDepartment of Natural Resources andEnvironmental Studies, National Dong Hwa University, Hualien, Taiwan; eeeeeDepartment of Biology, Washington State University, Vancouver, ON, Canada;fffffEcole Nationale des Eaux et Forets, Mbalmayo, Cameroon; gggggOrganization for Tropical Field Studies, La Selva, Costa Rica; hhhhhPontificia UniversidadCatolica del Ecuador, Quito, Ecuador; iiiiiNederlands Voedsel-en Warenautoriteit, Wageningen, The Netherlands; jjjjjCenter for Southeast Asian Studies, KyotoUniversity, Kyoto, Japan; kkkkkFederal University of Technology, Akure, Nigeria; lllllArnold Arboretum, Harvard University, Jamaica Plain, MA; mmmmmBrownUniversity, Providence, RI; nnnnnLiverpool John Moores University, Liverpool, United Kingdom; oooooUniversity of Amsterdam, Amsterdam, The Netherlands;pppppInstituto Politecnico Nacional, Oaxaca, Mexico; qqqqqBiogeochemistry Department, Max Planck Institute for Chemistry, Mainz, Germany; rrrrrBad Aussee,Austria; sssssHainan University, Haikou, Hainan, China; tttttFélix Houphouët-Boigny University, Abidjan, Ivory Coast; uuuuuInstitute of Biology, University of thePhilippines, Diliman, Quezon City, Philippines; and vvvvvUniversidade Federal do Rio Grande do Norte, Natal, Brazil
Slik et al. PNAS Early Edition | 5 of 6
APP
LIED
BIOLO
GICAL
SCIENCE
SEN
VIRONMEN
TAL
SCIENCE
S
1. Pimm SL, et al. (2014) The biodiversity of species and their rates of extinction, dis-tribution, and protection. Science 344(6187):1246752.
2. Kier G, et al. (2005) Global patterns of plant diversity and floristic knowledge.J Biogeogr 32(7):1107–1116.
3. Mutke J, Barthlott W (2005) Patterns of vascular plant diversity at continental toglobal scales. Biol Skr 55:521–531.
4. Kreft H, Jetz W (2007) Global patterns and determinants of vascular plant diversity.Proc Natl Acad Sci USA 104(14):5925–5930.
5. Joppa LN, Roberts DL, Pimm SL (2011) How many species of flowering plants arethere? Proc Biol Sci 278(1705):554–559.
6. Erwin TL (1982) Tropical forests: Their richness in Coleoptera and other arthropodspecies. Coleopt Bull 36(1):74–75.
7. Odegaard F (2000) How many species of arthropods? Erwin’s estimate revisited. Biol JLinn Soc Lond 71(4):583–597.
8. Fine PVA, Ree RH (2006) Evidence for a time-integrated species-area effect on thelatitudinal gradient in tree diversity. Am Nat 168(6):796–804.
9. Pan Y, et al. (2011) A large and persistent carbon sink in the world’s forests. Science333(6045):988–993.
10. Chazdon RL (2008) Beyond deforestation: Restoring forests and ecosystem services ondegraded lands. Science 320(5882):1458–1460.
11. Basset Y, et al. (2012) Arthropod diversity in a tropical forest. Science 338(6113):1481–1484.12. Feeley KJ, Silman MR (2011) Keep collecting: Accurate species distribution modelling
requires more collections than previously thought. Divers Distrib 17(6):1132–1140.13. Condit R, et al. (1996) Species-area and species-individual relationships for tropical
trees: A comparison of three 50-ha plots. J Ecol 84(4):549–562.14. Hubbell SP, et al. (2008) Colloquium paper: Howmany tree species are there in the Amazon
and how many of them will go extinct? Proc Natl Acad Sci USA 105(Suppl 1):11498–11504.15. ter Steege H, et al. (2013) Hyperdominance in the Amazonian tree flora. Science
342(6156):1243092.16. Fisher RA, Corbet AS, Williams CB (1943) The relation between the number of species
and the number of individuals in a random sample of an animal population. J AnimEcol 12(1):42–58.
17. Gentry AH (1988) Changes in plant community diversity and floristic composition onenvironmental and geographical gradients. Ann Mo Bot Gard 75(1):1–34.
18. Gentry AH (1992) Tropical forest biodiversity: Distributional patterns and their con-servation significance. Oikos 63:19–28.
19. Morley RJ (2000) Origin and Evolution of Tropical Rain Forests (Wiley, Chichester,United Kingdom).
20. de Bruyn M, et al. (2014) Borneo and Indochina are major evolutionary hotspots forSoutheast Asian biodiversity. Syst Biol 63(6):879–901.
21. Richards PW (1973) Africa, the ‘odd man out’. Tropical Forest Ecosystems of Africa andSouth America: a Comparative Review, eds Meggers BJ, Ayensu ES, Duckworth WD(Smithsonian Inst Press, Washington, DC), pp 21–26.
22. Parmentier I, et al. (2007) The odd man out? Might climate explain the lower treealpha-diversity of African rain forests relative to Amazonian rain forests? J Ecol 95(5):1058–1071.
23. Anhuf D, et al. (2006) Paleo-environmental change in Amazonian and African rain-forest during the LGM. Palaeogeogr Palaeocl 239(3-4):510–527.
24. Cannon CH, Morley RJ, Bush ABG (2009) The current refugial rainforests of Sundalandare unrepresentative of their biogeographic past and highly vulnerable to distur-bance. Proc Natl Acad Sci USA 106(27):11188–11193.
25. Hubbell SP (2013) Tropical rain forest conservation and the twin challenges ofdiversity and rarity. Ecol Evol 3(10):3263–3274.
26. Howe HF (2014) Diversity storage: Implications for tropical conservation and resto-ration. Global Ecol Conserv 2(12):349–358.
27. Hijmans RJ, Cameron SE, Parra JL, Jones PG, Jarvis A (2005) Very high resolution in-terpolated climate surfaces for global land areas. Int J Climatol 25:1965–1978.
28. Food and Agricultural Organization of the United Nations (FAO) (2002) Terrastat:Global Land Resources GIS Models and Databases for Poverty and Food InsecurityMapping. Land and Water Digital Media Series 20 (FAO, Rome).
29. Brose U, Martinez ND, Williams RJ (2003) Estimating species richness: Sensitivity tosample coverage and insensitivity to spatial patterns. Ecology 84(9):2364–2377.
30. Chao A, Jost L (2012) Coverage-based rarefaction and extrapolation: standardizingsamples by completeness rather than size. Ecology 93(12):2533–2547.
31. Chao A, Shen TJ (2010) Program SPADE: Species Prediction and Diversity Estimation.Program and user’s guide (CARE, Hsin-Chu, Taiwan).
32. Chao A, Colwell RK, Lin CW, Gotelli NJ (2009) Sufficient sampling for asymptoticminimum species richness estimators. Ecology 90(4):1125–1133.
33. McGill BJ, et al. (2007) Species abundance distributions: Moving beyond single predictiontheories to integration within an ecological framework. Ecol Lett 10(10):995–1015.
34. Ulrich W, Ollik M, Ugland KI (2010) A meta-analysis of species–abundance distributions.Oikos 119(7):1149–1155.
35. May RM (1975) Patterns of species abundance and diversity. Ecology and Evolution ofCommunities, eds Cody ML, Diamond JM (Cambridge Univ Press, Cambridge, MA),pp 81–120.
36. Macarthur RH (1957) On the relative abundance of bird species. Proc Natl Acad SciUSA 43(3):293–295.
37. Preston FW (1948) The commonness and rarity of species. Ecology 29(3):254–283.38. Prado PI, Miranda MD (2014) Package ‘sads’: Maximum likelihood models for species
abundance distributions. Available at cran.r-project.org/web/packages/sads/index.html.39. Burnham KP, Anderson DR (2002) Model Selection and Multimodel Inference: A
Practical Information-Theoretic Approach (Springer Science+Business Media Inc., NewYork), 2nd Ed.
40. Pitman NCA, et al. (2001) Dominance and distribution of tree species in UpperAmazonian terra firme forests. Ecology 82(8):2101–2117.
6 of 6 | www.pnas.org/cgi/doi/10.1073/pnas.1423147112 Slik et al.

Supporting InformationSlik et al. 10.1073/pnas.1423147112
Fig. S1. Results of minimum variance clustering with squared Euclidean distances on square root-transformed relative abundance data at the genus level.Only plots with more than 250 identified individuals were used. Plots were first divided into Paleotropics vs. Neotropics, and then into Continental Africa, Indo-Pacific Region (including Madagascar), and the Americas. The basal internal divisions within these three main regions mainly separate everwet from seasonaland dry forest types. Terminal numbers correspond to location numbers in Dataset S1.
-0.8
-0.6
-0.4
-0.2
0
0.2
0.4
0.6
0.8
-0.6 -0.4 -0.2 0 0.2 0.4 0.6 0.8
Tropical America
Tropical Indo-Pacif ic region
Cont inental tropical Africa
Fig. S2. Environmental variation in climate and soils among sites for the three major tropical regions of the world based on principal components analysis oflocations vs. environmental variables [climatic data (BIO1-19) and edaphic data (soil production, easy available water, pH topsoil, organic carbon topsoil, ni-trogen topsoil, soil moisture storage, soil drainage, soil depth, C:N ratio topsoil, Cation Exchange Capacity [CEC] clay topsoil, CEC soil topsoil, base saturationtopsoil, organic carbon pool, textural class topsoil, textural class subsoil)].
Slik et al. www.pnas.org/cgi/content/short/1423147112 1 of 8
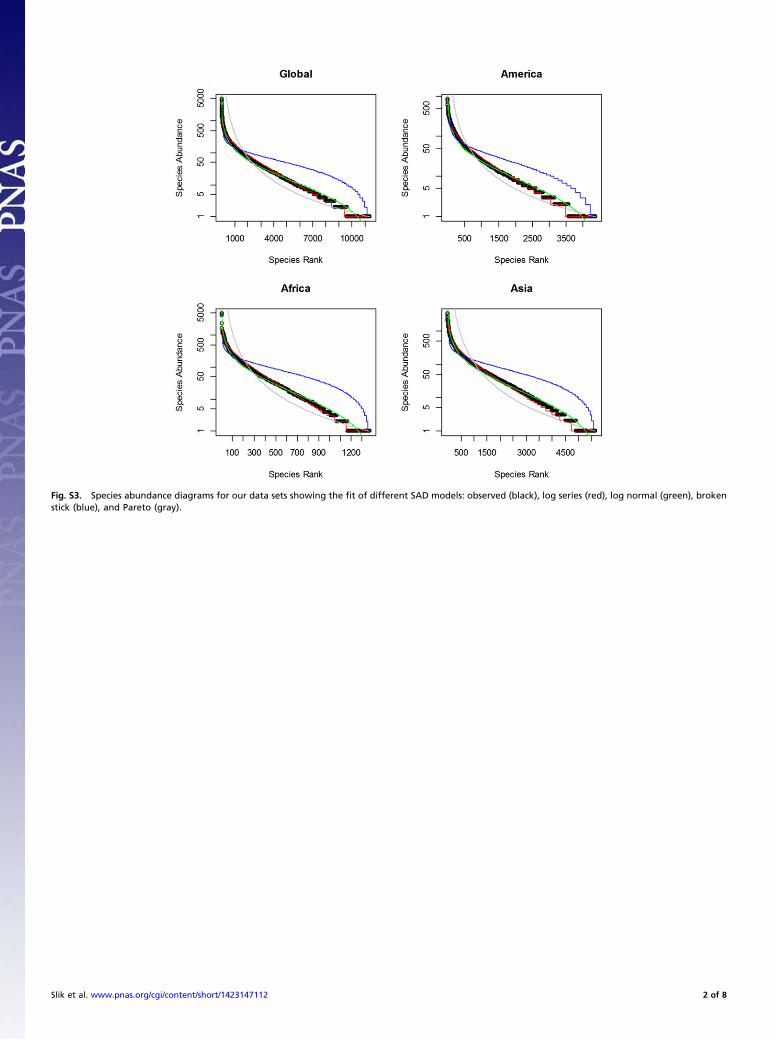
Fig. S3. Species abundance diagrams for our data sets showing the fit of different SAD models: observed (black), log series (red), log normal (green), brokenstick (blue), and Pareto (gray).
Slik et al. www.pnas.org/cgi/content/short/1423147112 2 of 8
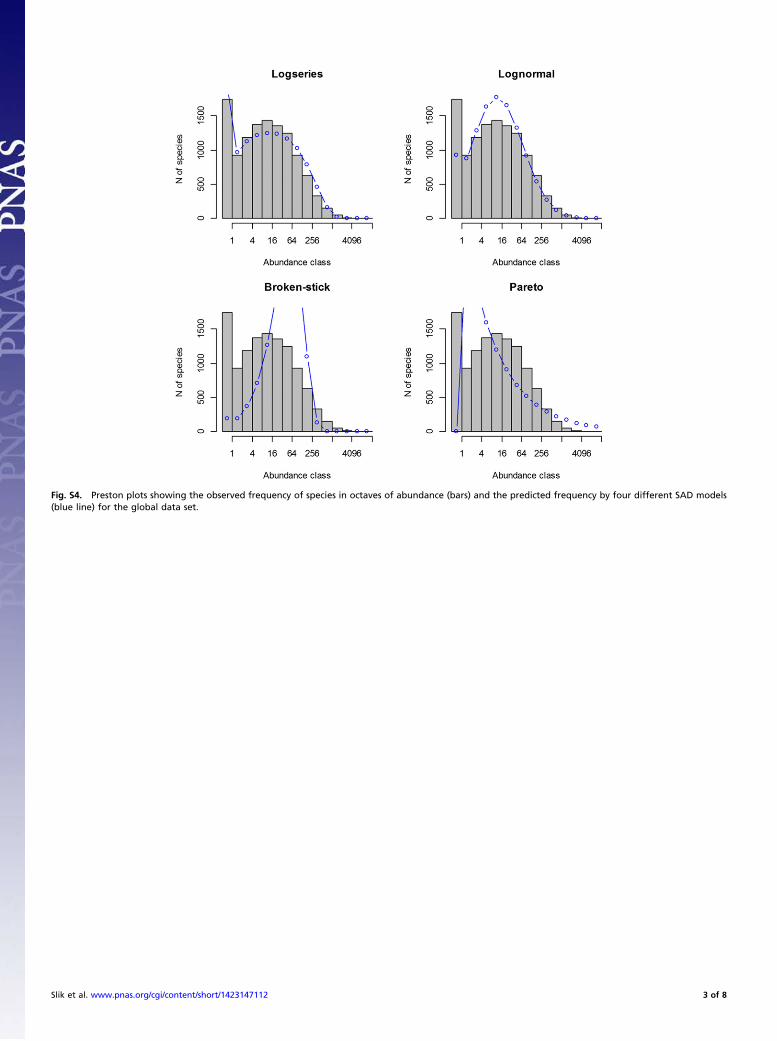
Fig. S4. Preston plots showing the observed frequency of species in octaves of abundance (bars) and the predicted frequency by four different SAD models(blue line) for the global data set.
Slik et al. www.pnas.org/cgi/content/short/1423147112 3 of 8

Fig. S5. Preston plots showing the observed (bars) frequency of species in octaves of abundance, and the predicted frequency by four different SAD models(blue line) for the American data set.
Slik et al. www.pnas.org/cgi/content/short/1423147112 4 of 8
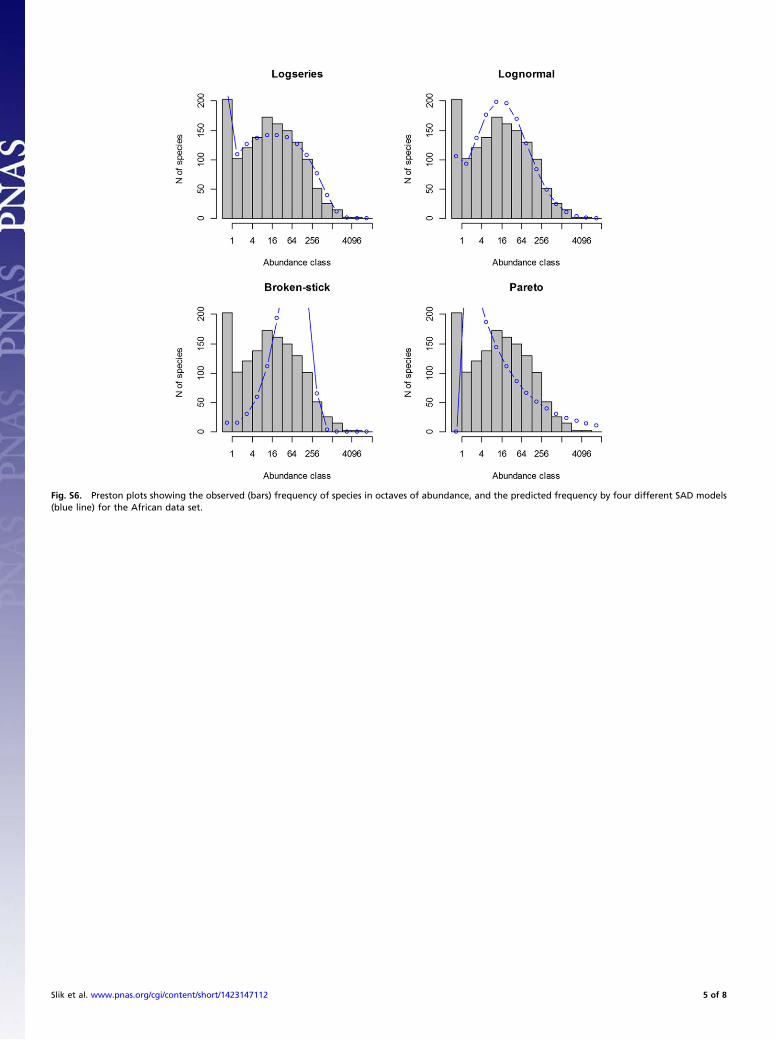
Fig. S6. Preston plots showing the observed (bars) frequency of species in octaves of abundance, and the predicted frequency by four different SAD models(blue line) for the African data set.
Slik et al. www.pnas.org/cgi/content/short/1423147112 5 of 8
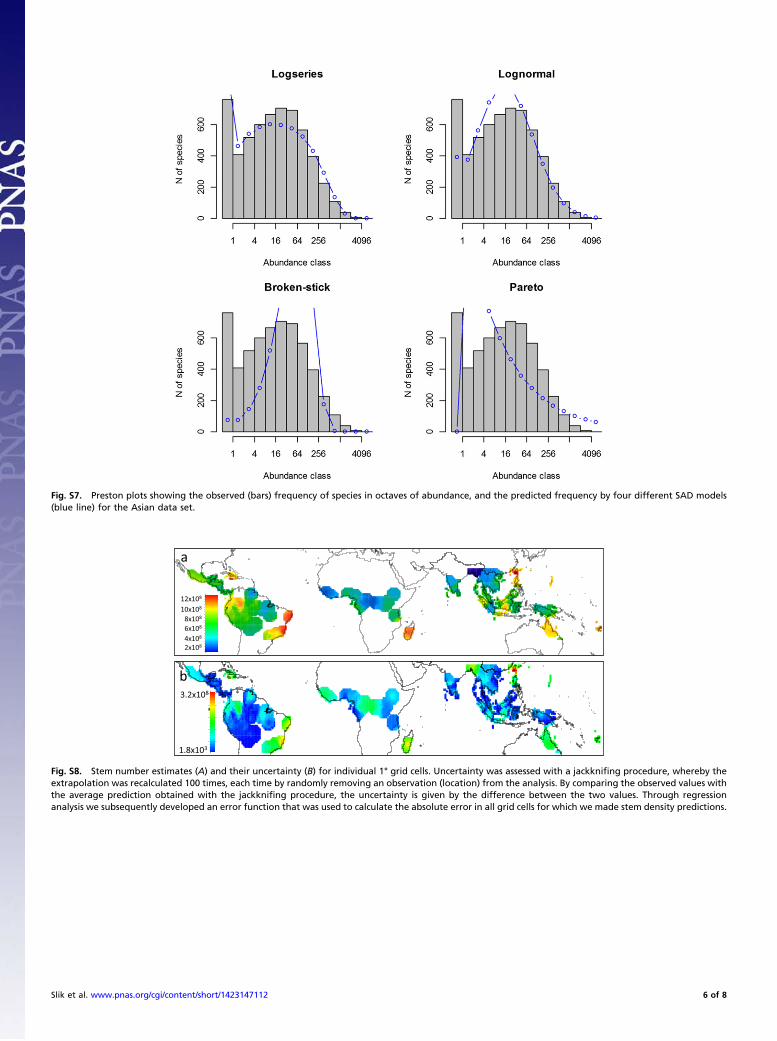
Fig. S7. Preston plots showing the observed (bars) frequency of species in octaves of abundance, and the predicted frequency by four different SAD models(blue line) for the Asian data set.
2x10⁸
12x108
6x10⁸
10x108
8x10⁸
4x10⁸
3.2x10⁸
1.8x10³
a
b
Fig. S8. Stem number estimates (A) and their uncertainty (B) for individual 1° grid cells. Uncertainty was assessed with a jackknifing procedure, whereby theextrapolation was recalculated 100 times, each time by randomly removing an observation (location) from the analysis. By comparing the observed values withthe average prediction obtained with the jackknifing procedure, the uncertainty is given by the difference between the two values. Through regressionanalysis we subsequently developed an error function that was used to calculate the absolute error in all grid cells for which we made stem density predictions.
Slik et al. www.pnas.org/cgi/content/short/1423147112 6 of 8

Table S1. Number of stems (N) and tree species (S) recorded inthe global data set and in each tropical region
Data sets N S f1 f2 Cn, % Mean Cn, %*
Pantropical 657,630 11,371 1,743 930 91.6 95.6 ± 0.3Tropical America 116,754 4,375 797 429 91.5 94.6 ± 0.7Continental Africa 117,902 1,376 203 102 90.8 96.8 ± 0.5Indo-Pacific 422,974 5,672 759 406 91.7 95.8 ± 0.5
The number of singletons (f1) and doubletons (f2) are shown, as well asthe sample coverage (Cn = percentage of the total number of individuals inan assemblage that belong to the species represented in the sample). Wealso indicate mean (±SE) sample coverage per location for each data set.*Mean sample coverage per location did not differ among regions (F2,204 =2.33, P = 0.10).
Table S2. Tree species richness estimated from our sample bydifferent nonparametric methods with the SPADE program andtheir respective variations (SE and lower and upper 95%confidence intervals)
Estimator/model Estimate SE 95% CI %
PantropicalChao1 13,004.4 103.1 12,814.5 13,219.2 87.4Chao1-bc 13,001.7 79.1 12,853.9 13,164.2 87.5ACE 12,661.1 45.3 12,575.3 12,752.9 89.8ACE-1 12,989.9 72.8 12,853.3 13,139.1 87.5First-order jackknife 13,114.0 59.0 13,002.1 13,233.6 86.7Second-order jackknife 13,927.0 102.3 13,734.3 14,135.4 81.6Gamma-Poisson model 13,236.8 128.2 13,001.9 13,505.5 85.9Gamma-Poisson-UMLE 13,228.7 127.0 12,996.0 13,494.7 86.0Gamma-Poisson-CMLE 13,232.0 127.4 12,998.6 13,498.8 85.9
AfricaChao1 1,578.0 37.5 1,516.8 1,665.8 87.2Chao1-bc 1,575.1 36.9 1,514.8 1,661.5 87.4ACE 1,538.8 15.1 1,511.7 1,571.2 89.4ACE-1 1,586.7 45.1 1,515.1 1,695.1 86.7First-order jackknife 1,579.0 20.1 1,543.2 1,622.5 87.1Second-order jackknife 1,680.0 34.9 1,618.9 1,756.4 81.9Gamma-Poisson model 1,630.1 52.8 1,545.8 1,756.2 84.4Gamma-Poisson-UMLE 1,637.0 57.3 1,546.6 1,775.2 84.1Gamma-Poisson-CMLE 1,641.4 59.0 1,548.6 1,784.3 83.8
AmericaChao1 5,115.3 69.1 4,991.9 5,263.5 85.5Chao1-bc 5,112.7 68.8 4,989.7 5,260.3 85.6ACE 4,959.3 30.4 4,902.6 5,022.1 88.2ACE-1 5,104.8 50.4 5,012.5 5,210.4 85.7First-order jackknife 5,172.0 39.9 5,097.5 5,254.2 84.6Second-order jackknife 5,540.0 69.2 5,412.1 5,683.6 79.0Gamma-Poisson model 5,211.8 83.2 5,064.0 5,391.3 83.9Gamma-Poisson-UMLE 5,201.6 82.9 5,054.4 5,380.7 84.1Gamma-Poisson-CMLE 5,204.8 83.4 5,056.7 5,385.0 84.1
AsiaChao1 6,381.5 67.8 6,260.5 6,527.3 88.9Chao1-bc 6,378.8 67.6 6,258.2 6,524.1 88.9ACE 6,232.3 29.7 6,177.0 6,293.5 91.0ACE-1 6,374.8 47.1 6,288.4 6,473.3 89.0First-order jackknife 6,431.0 39.0 6,358.4 6,511.3 88.2Second-order jackknife 6,784.0 67.5 6,659.4 6,924.3 83.6Gamma-Poisson model 6,480.3 85.2 6,329.8 6,665.2 87.5Gamma-Poisson-UMLE 6,474.6 82.6 6,328.3 6,653.6 87.6Gamma-Poisson-CMLE 6,477.8 83.2 6,330.6 6,658.0 87.6
The estimated percentage of species recorded (species sampled/speciesestimated × 100) is also indicated. CI, confidence interval.
Slik et al. www.pnas.org/cgi/content/short/1423147112 7 of 8

Table S3. Difference in Akaike’s information criterion valuesbetween the best SAD model (i.e., with the lowest AIC value,ΔAIC = 0) and the rest of models
ΔAIC df
GlobalLog series 0 1Log normal 1,225.5 2Pareto 2,570.7 1Broken stick 15,104.8 0
AmericaLog series 0 1Log normal 524.5 2Pareto 853 1Broken-stick 4,033.4 0
AfricaLog series 0 1Log normal 151.8 2Pareto 367.6 1Broken stick 2,091.2 0
AsiaLog series 0 1Log normal 576.2 2Pareto 1,722.7 1Broken stick 6,978.9 0
Note that in all cases the log series was the best model for the data. Thenumber of free parameters within each model (df) are also indicated.
Table S4. The impact of error in stem numbers for the different regions on the number of tree species estimated tooccur in each region using Fisher’s log series
Error ratio instem numbers
Speciesestimate Africa
Speciesestimate America
Speciesestimate Asia
Speciesestimate global
1.9 4,765.9 (3.0%) 19,164.7 (3.1%) 19,607.8 (3.1%) 41,770.5 (3.1%)1.8 4,754.1 (2.8%) 19,116.1 (2.8%) 19,557.7 (2.9%) 41,664.9 (2.8%)1.6 4,728.3 (2.2%) 19,010.5 (2.3%) 19,448.7 (2.3%) 41,434.9 (2.3%)1.5 4,714.2 (1.9%) 18,952.6 (2.0%) 19,388.9 (2.0%) 41,308.8 (2.0%)1.4 4,699.1 (1.6%) 18,890.7 (1.6%) 19,325.0 (1.6%) 41,174.1 (1.6%)1.3 4,682.9 (1.2%) 18,824.2 (1.3%) 19,256.4 (1.3%) 41,029.3 (1.3%)1.2 4,665.4 (0.9%) 18,752.4 (0.9%) 19,182.3 (0.9%) 40,873.0 (0.9%)1.1 4,646.4 (0.5%) 18,674.3 (0.5%) 19,101.8 (0.5%) 40,703.1 (0.5%)1.0 4,625.6 18,588.8 19,013.5 40,516.90.9 4,602.5 (−0.5%) 18,494.2 (−0.5%) 18,916.0 (−0.5%) 40,311.2 (−0.5%)0.8 4,576.8 (−1.0%) 18,388.6 (−1.1%) 18,807.0 (−1.1%) 40,081.1 (−1.1%)0.7 4,547.6 (−1.7%) 18,268.8 (−1.7%) 18,683.3 (−1.7%) 39,820.3 (−1.7%)0.6 4,513.8 (−2.4%) 18,130.5 (−2.5%) 18,540.6 (−2.5%) 39,519.3 (−2.5%)0.5 4,474.0 (−3.3%) 17,966.9 (−3.3%) 18,371.8 (−3.4%) 39,163.2 (−3.3%)0.4 4,425.2 (−4.3%) 17,766.7 (−4.4%) 18,165.2 (−4.5%) 38,727.4 (−4.4%)0.3 4,362.3 (−5.7%) 17,508.6 (−5.8%) 17,898.9 (−5.9%) 38,165.5 (−5.8%)0.2 4,273.6 (−7.6%) 17,144.8 (−7.8%) 17,523.5 (−7.8%) 37,373.7 (−7.8%)0.1 4,122.0 (−10.9%) 16,522.9 (−11.1%) 16,881.8 (−11.2%) 36,019.9 (−11.1%)
The impact of the error is minimal, with a doubling of stem numbers resulting in an increase of only ∼3.0% in estimated speciesnumbers, and a decline in tree numbers of 90% resulting in a decline in estimated species numbers of only ∼11%.
Other Supporting Information Files
Dataset S1 (XLSX)
Slik et al. www.pnas.org/cgi/content/short/1423147112 8 of 8