Embed Size (px)
Citation preview

XVI Annual Conference Proceedings January, 2015
ISBN no. 978-81-923211-7-2 http://www.internationalconference.in/XVI_AIC/INDEX.HTM Page 974
AN EMPIRICAL STUDY ON FACTORS AFFECTING SATISFACTION
OF EMPLOYEES AND THEIR IMPACT ON THE ORGANISATION
WITH SPECIAL REFERENCE TO EDUCATION SECTOR
Dr. Manish Madan Dr. Nidhi Gupta
Associate Professor Professor & HOD – BBA
Rukmini Devi Institute of Advanced Studies Rukmini Devi Institute of Advanced S.
Madhuban Chowk, Rohini, Delhi. Madhuban Chowk,Rohini, Delhi.
,
Abstract
Purpose: Everyone from managers, retention agents to HR need to get a handle on employee
loyalty and satisfaction – how engaged is the workforce to the organization and are workers
really contented with the way of things for gauging their choice to stay with the company.
Human Resource Management’s main aspects are measurement of employee satisfaction and
employee commitment towards their organization. Companies must ensure that employee
satisfaction is high among the workers, which is a must condition for increasing productivity,
responsiveness, quality and overall customer service. The litmus test can be conducted to
study absenteeism, turnover and average length of service. If turnover is increasing, surely
the loyalty levels are low and vice versa.
Design/Methodology/Approach: Descriptive research has been applied, describes data and
characteristics about the population or phenomenon being studied. The researchers have used
primary data through self-constructed structured Questionnaire and as far as the secondary
data is concerned that was obtained from web sites, journals etc.Structured questionnaire was
constructed to interview the employees of various Educational Institutions on 23 different
parameters on Likert’s five point scale, which was later reduced to 5 factors by using the
statistical technique of factor analysis.
Findings: It is found that the employees working in the Educational Institutions are satisfied
in terms of Authority and work culture, Relationship with Peers, Salary and Career
Advancement, Involvement and Training and Rotation of job.

XVI Annual Conference Proceedings January, 2015
ISBN no. 978-81-923211-7-2 http://www.internationalconference.in/XVI_AIC/INDEX.HTM Page 975
Research Limitations/Implications: The study focuses on general problems faced by
employees in the Educational institution. There might be certain more variables as one
employee is satisfied on particular aspect but another may not on the same aspect.
Key Words: Employee Satisfaction, Satisfaction of Employees, Educational Institutions.
INTRODUCTION
The relationship between how satisfied a person is with their job and their actual job
performance is open to discussion and debate. It's hard to correlate those two aspects
primarily because when people are asked if they get job satisfaction from working at ABC
Company, a certain percentage will say yes just because they think if they say no, there could
be a negative consequence. For instance, if you tell your boss you are not satisfied with your
job, what if his reply is 'Then I guess you better leave'? Thus, while we understand there is a
correlation between satisfaction and performance, it's hard to definitively nail it down without
some sort of survey error being present. “Productive employees are always happy
employees.” “productive employees are not productive employees.” We frequently here these
obvious statements but these are conflicting statements too made by HR professionals and
managers in organizations. Now a daysdebatable topic among practitioners are employee
attitudes and job satisfaction even at a time when employees are increasingly important for
organizational success and competitiveness. Therefore, the purpose of this article is to
provide greater understanding of the research on this topic and give recommendations related
to the major practitioner knowledge gaps. As indicated indirectly in a study of HR
professionals (Rynes, Colbert, & Brown, 2002), as well as based on our experience, the
major knowledge gaps in this area are: (1) the causes of employee attitudes, (2) the results of
positive or negative job satisfaction, and (3) how to measure and influence employee
attitudes. As per the outcome of a 2011 survey of U.S. households by the Conference Board,
across all income brackets, job dissatisfaction is widespread among workers of all age
groups. The study found that only 47% of those surveyed say they are satisfied with their
jobs, down from 61.1 percent in 1987, the first year in which the survey was conducted.
Organizations measures frequently job satisfaction which is a very important attribute. Rating
scale is the most common way of measurementwhere employees report their reactions to their
jobs. Questions relate to salary, work responsibilities, variety of tasks, promotional
opportunities the work itself and co-workers. Some questioners ask yes or no questions while

XVI Annual Conference Proceedings January, 2015
ISBN no. 978-81-923211-7-2 http://www.internationalconference.in/XVI_AIC/INDEX.HTM Page 976
others ask to rate satisfaction on 1 – 5 scale where 1 represents “not all satisfied” and 5
represents “extremely satisfied”.
JOB SATISFACTION
The important components to an employee's job satisfactioninclude pay, promotion, benefits,
supervisor personality, co-workers and safety on the job. These job characteristics affect how
an employee feels on the job. Besides these there are other, more subtle influences on
employee job satisfaction like personality types and rudiments of workplace culture.
According to Arnold et al (1998) the concept of job satisfaction has gained importance for
two important reasons. Firstly, Someone’s general mental well-being can be indicated by job
satisfaction. If a person is unhappy at work, this person will be unhappy in general.Secondly,
and more importantly for this project, the general assumption is that happiness at work
improves work motivation and, in consequence, job performance. Job satisfaction has been
an important focal point for organizational and industrial psychology. In defining job
satisfaction the reference is often made to Locke’s (1976) description of job satisfaction as a
“pleasurable or positive emotional state resulting from the appraisal of one’s job or job
experiences” (Jex, 2002).Several elements related to the job such as salary, working
conditions, colleagues and boss, career prospects and, of course, the intrinsic aspects of the
job itself (Arnold et al, 1998) are directly involved in appraisal..
The study also found that those teachers who received parental support reported higher levels
of job satisfaction than teachers who did not. The study also revealed that there was no
correlation between teacher satisfaction and benefits such as salary, holidays and working
hours. Research conducted by Lumsden(1998) showed that major percentage of teacher’s
time is spent in the classroom and therefore got few opportunities to share their successes
with colleagues. Hence they preferred to rely more often on the students’ level of response.
Education sector is seen as more to be a pure & divine service.Every company should
consider their employees as valuable assets whichneeds to be developing starts from the
recruitment process until their development. This whole process contains a considerable cost
for any organization. Satisfaction is a relevant measure because many studies have
demonstrated that other factors being equal, satisfied individuals are likely to be willing to
exert more effort than unsatisfied individuals (Bryant, 2006; Özgüngör, 2010). The same
holds true for satisfied faculty members and students as well in education institutes.
As employee turnover continues to be a serious business predicament, the concept of job
satisfaction assumes significance for educational sectors also that are facingacute shortage of

XVI Annual Conference Proceedings January, 2015
ISBN no. 978-81-923211-7-2 http://www.internationalconference.in/XVI_AIC/INDEX.HTM Page 977
qualified and competitive teaching work force. Faculty job satisfaction levels seem to have
direct bearing on the institutional as well as the student development. The proper
understanding of job satisfaction, retention and employee turnover aspects of the faculties
would help the policy makers to understand a very important organ of the society, responsible
for future of the nation and generation.
Some studies also threw the light on the fact thatintellectual challenge of teaching and career
growth also play a crucial role in teacher job satisfaction. On the other hand, it is perceived
that work overload, poor pay and the depiction of faculties by the media have been linked
with faculty’s job dissatisfaction. On a similar line of thought, Watt and Richardson
(2007)said that if the teaching environment does not facilitate the satisfaction needs of
teachers, then teachers are unhappy and unproductive.
The other factors which are responsible for increment in teacher discontentment like
problems arising from changes in organizational routines, overwork – especially paperwork,
students’ evaluations, schools’ grading procedures, behavior problems, low pay, student
indiscipline, few possibilities for career progression and the overall decline of society’s
esteem towards education and trainingSingh and Rawat (2010)and Shann (2001).
Furthermore, Arnett and Polkinghorne (2010) identified some other factors as contributing
to teacher’s satisfaction or dissatisfaction: nature of recent education reforms, inclusion of
students with special needs, support and recognition from school or college administrator,
faculty’s pay, physical environment or the ambience of the school, daily workload of
teaching itself, class size, student discipline and behavior, lack of resources for delivering the
quality education and lack of opportunities for career progression.
MHRD has formulated an action plan to achieve an increase in the Gross Enrolment Ratio
(GER) in higher education to 21% by the end of the 12th five-year plan period from the
current 13.5%. Raising the GER would create the requirement of an additional demand over
26 million in higher education and almost one million school teachers by 2020.
REVIEW OF LITERATURE
Keith Davis, “Job satisfaction is defined as “Favorableness or favorableness with which the
employees view their work and results when there is a fit between job characteristic and
wants of the employees”.
XVI Annual Conference Proceedings January, 2015
ISBN no. 978-81-923211-7-2 http://www.internationalconference.in/XVI_AIC/INDEX.HTM Page 978
Stephen P. Robbins: Job satisfaction as the “Difference between the amount of rewards the
workers receive and the amount they believe they should receive”. Further he says, “Job
satisfaction is an individual general attitude towards his or her job”.
C.B.Mamoria explains: “Job satisfaction is the collection of tasks and responsibilities
regularly assigned to one person while a job is a group of positions, which involves
essentially the same duties, responsibility, skill and knowledge”.
In Locke words, “Job satisfaction is defined as a pleasurable or positive emotional state
resulting from the appraisal of one’s job or job experience”.
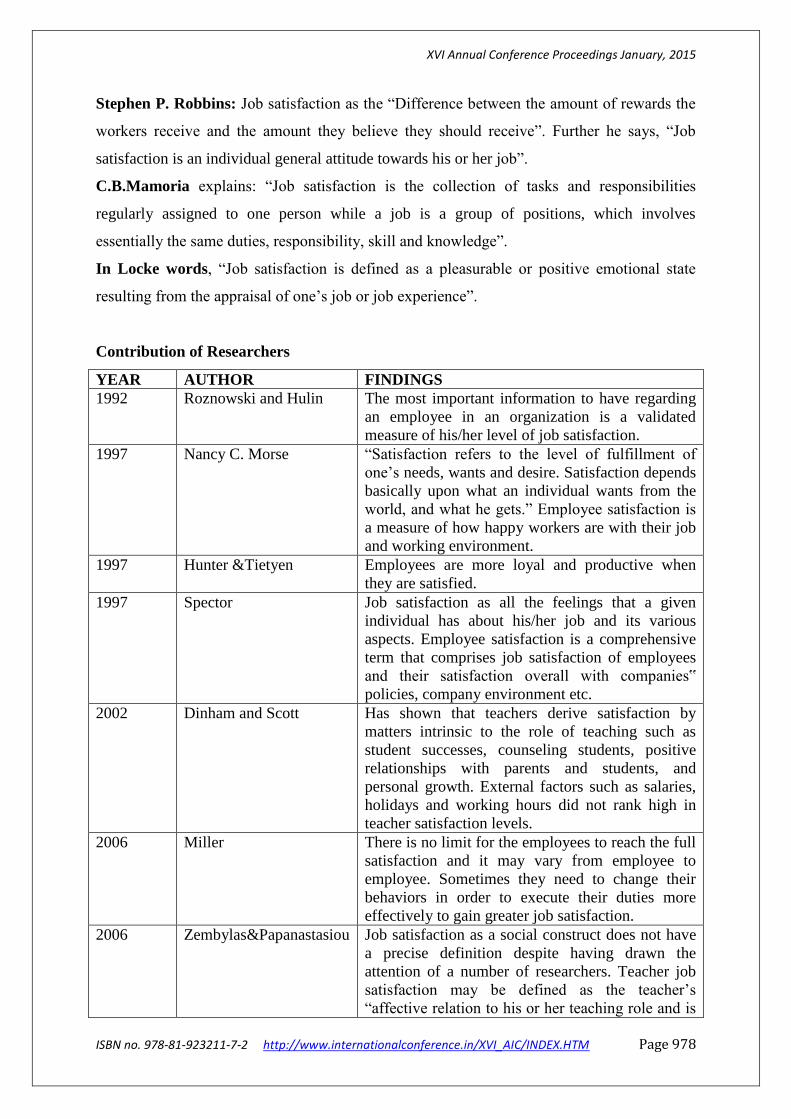
Contribution of Researchers
YEAR AUTHOR FINDINGS
1992 Roznowski and Hulin The most important information to have regarding
an employee in an organization is a validated
measure of his/her level of job satisfaction.
1997 Nancy C. Morse “Satisfaction refers to the level of fulfillment of
one’s needs, wants and desire. Satisfaction depends
basically upon what an individual wants from the
world, and what he gets.” Employee satisfaction is
a measure of how happy workers are with their job
and working environment.
1997 Hunter &Tietyen Employees are more loyal and productive when
they are satisfied.
1997 Spector Job satisfaction as all the feelings that a given
individual has about his/her job and its various
aspects. Employee satisfaction is a comprehensive
term that comprises job satisfaction of employees
and their satisfaction overall with companies‟
policies, company environment etc.
2002 Dinham and Scott Has shown that teachers derive satisfaction by
matters intrinsic to the role of teaching such as
student successes, counseling students, positive
relationships with parents and students, and
personal growth. External factors such as salaries,
holidays and working hours did not rank high in
teacher satisfaction levels.
2006 Miller There is no limit for the employees to reach the full
satisfaction and it may vary from employee to
employee. Sometimes they need to change their
behaviors in order to execute their duties more
effectively to gain greater job satisfaction.
2006 Zembylas&Papanastasiou Job satisfaction as a social construct does not have
a precise definition despite having drawn the
attention of a number of researchers. Teacher job
satisfaction may be defined as the teacher’s
“affective relation to his or her teaching role and is

XVI Annual Conference Proceedings January, 2015
ISBN no. 978-81-923211-7-2 http://www.internationalconference.in/XVI_AIC/INDEX.HTM Page 979
a function of the perceived relationship between
what one wants from teaching and what one
perceives it is offering to a teacher”.
2007 Bhatti&Qureshi It is sure that there may be many factors affecting
the organizational effectiveness and one of them is
the employee satisfaction. Effective organizations
should have a culture that encourages the employee
satisfaction
2007 Kaliski Job satisfaction is a worker’s sense of achievement
and success on the job. It is generally perceived to
be directly linked to productivity as well as to
personal well-being. Job satisfaction implies doing
a job one enjoys, doing it well and being rewarded
for one‟s efforts. Job satisfaction further implies
enthusiasm and happiness with one‟s work. Job
satisfactionis the key ingredient that leads to
recognition, income, promotion, and the
achievement of other goals that lead to a feeling of
fulfillment.
2008 Moyes, Shao &
Newsome
Employee satisfaction may be described as how
pleased an employee is with his or her position of
employment.
2010 Singh and Rawat Identified other factors that contribute to increased
teacher discontentment: problems arising from
changes in administrative routines, overwork –
especially paperwork, students’ evaluations,
schools’ grading procedures, behavior problems,
low pay, student indiscipline, few possibilities for
career progression and the overall decline of
society’s esteem towards teaching.
2011 BrikendAziri Studied Job Satisfaction and found that Job
satisfaction is under the influence of a series of
factors such as: The nature of work, Salary,
Advancement opportunities, Management, Work
groups and Work conditions. It is one of the major
challenges for today‟s organization. Job
satisfaction represents a combination of positive or
negative feelings that workers have towards their
work. Meanwhile, when a worker employed in a
business organization, brings with it the needs,
desires and experiences which determinates
expectations that he has dismissed.
Table 1: Contribution of Researchers
OBJECTIVES OF STUDY
1. To study the satisfaction level of employees of educational Institutions regarding
salary with respect to experience.

XVI Annual Conference Proceedings January, 2015
ISBN no. 978-81-923211-7-2 http://www.internationalconference.in/XVI_AIC/INDEX.HTM Page 980
2. To study the satisfaction level of employees of educational institutions between the
gender groups regarding job rotation.
3. To study the satisfaction level regarding training opportunities with respect to
different age groups.
4. To study the overall satisfaction of employees in the educational Institutions.
HYPOTHESIS OF STUDY
HN1: There is no difference in satisfaction of employees of educational institutions regarding
salary with respect to experience.
HA1: There is difference in satisfaction of employees of educational institutions regarding
salary with respect to experience.
HN2:There is no difference of satisfaction between the gender groups regarding job rotation.
HA2:There is difference of satisfaction between the gender groups regarding job rotation.
HN3: There is no difference in the satisfaction level of employees in training opportunities
with respect to age group.
HA3: There is difference in the satisfaction level of employees in training opportunities with
respect to age group.
HN4: Employees are satisfied in the educational Institutions.
HA4: Employees are not satisfied in the educational Institutions.
RESEARCH METHODOLOGY
Research Design
A research design is a systematic plan to study a scientific problem.Descriptive research has
been applied, which is also known as statistical research, describes data and characteristics
about the population or phenomenon being studied.
Sources of Data
To cater the need of the research, the researchers have used primary data through self-
constructed structured Questionnaire and as far as the secondary data is concerned that was
obtained from web sites, journals etc.
Data Collection Tool
XVI Annual Conference Proceedings January, 2015
ISBN no. 978-81-923211-7-2 http://www.internationalconference.in/XVI_AIC/INDEX.HTM Page 981
Structured questionnaire was constructed to interview the employees of various Educational
Institutions on 23 different parameters like: Salary, Job rotation, Work environment, welfare
measures in the educational institutions etc. measured on Likert’s five point scale, which was
later reduced to 5 factors by using the statistical technique of factor analysis.
Sampling Technique
Under the probabilistic sampling techniques, systematic sampling was done.
Sample Size
Sample sizes of 150 employees from various departments of educational Institutions were
taken for the study.
Statistical Tools Used
IBM SPSS 20 (Statistical Package for the Social Sciences), for data analysis and as far as for
hypothesis testing the statistical tools used are Chi square test for factor, Kruskal Wallis test,
Mann-Whitney U test etc and for the reduction of factors the factor analysis is done using
Rotated component matrix and for the reliability the cronbach’s alpha was calculated and
sample adequacy was tested on KMO and Bartlett’s Test.
DATA ANALYSIS AND INTERPRETATION
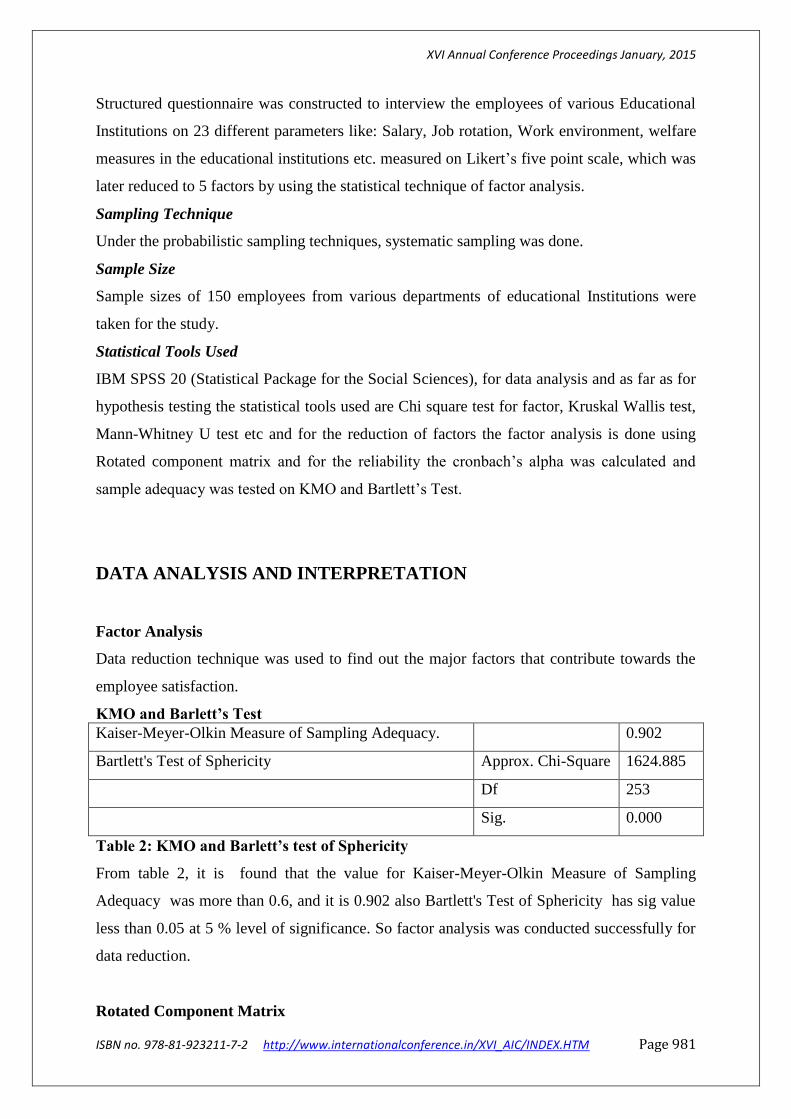
Factor Analysis
Data reduction technique was used to find out the major factors that contribute towards the
employee satisfaction.
KMO and Barlett’s Test
Kaiser-Meyer-Olkin Measure of Sampling Adequacy. 0.902
Bartlett's Test of Sphericity Approx. Chi-Square 1624.885
Df 253
Sig. 0.000
Table 2: KMO and Barlett’s test of Sphericity
From table 2, it is found that the value for Kaiser-Meyer-Olkin Measure of Sampling
Adequacy was more than 0.6, and it is 0.902 also Bartlett's Test of Sphericity has sig value
less than 0.05 at 5 % level of significance. So factor analysis was conducted successfully for
data reduction.
Rotated Component Matrix

XVI Annual Conference Proceedings January, 2015
ISBN no. 978-81-923211-7-2 http://www.internationalconference.in/XVI_AIC/INDEX.HTM Page 982
1 2 3 4 5
Duties with authority 0.745
Respect given by superiors 0.648
Number of working hours in
Educational Institution.
0.632
Fair Treatment by the superiors and
management of Institution.
0.541
Support from superiors and
management of Institution.
0.528
Freedom to take Decisions.
Work Recognition
Environment of working in Team 0.761
Treatment of Mistakes 0.682
Freedom of suggestions 0.657
Comfortable discussion on personal
issues.
0.631
Proper guidance from superiors and
management of Institution.
0.612
Clarity of Role
Satisfied with salary and rewards. 0.862
Opportunities for career development 0.731
Opportunities for further study 0.629
Appreciation of Creativity and
Innovations.
Satisfied with Welfare Facilities.
Involvement in Decision Making 0.638
Training and Development activities. 0.549
Full Utilization of Potential 0.521
Proper Division of Work
Rotation of Job 0.831
Table 3: Rotated Component Matrix
From the table 3, the 23 variables are condensed to five factors viz.
XVI Annual Conference Proceedings January, 2015
ISBN no. 978-81-923211-7-2 http://www.internationalconference.in/XVI_AIC/INDEX.HTM Page 983
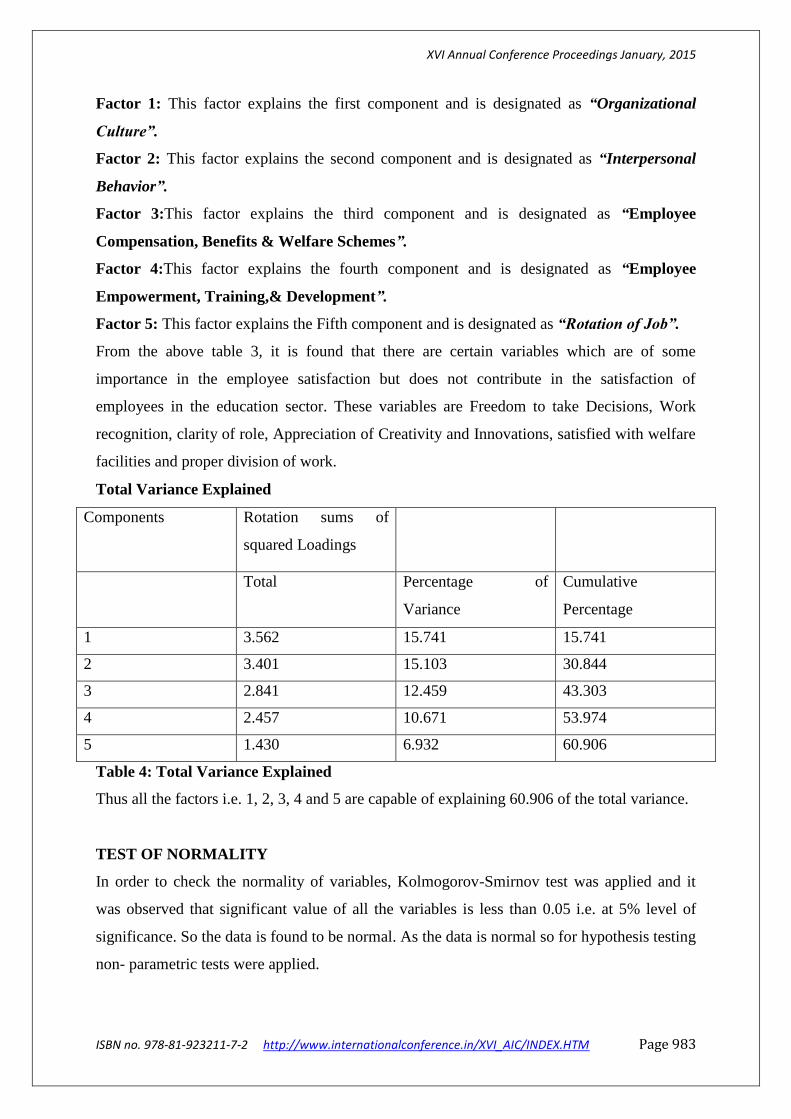
Factor 1: This factor explains the first component and is designated as “Organizational
Culture”.
Factor 2: This factor explains the second component and is designated as “Interpersonal
Behavior”.
Factor 3:This factor explains the third component and is designated as “Employee
Compensation, Benefits & Welfare Schemes”.
Factor 4:This factor explains the fourth component and is designated as “Employee
Empowerment, Training,& Development”.
Factor 5: This factor explains the Fifth component and is designated as “Rotation of Job”.
From the above table 3, it is found that there are certain variables which are of some
importance in the employee satisfaction but does not contribute in the satisfaction of
employees in the education sector. These variables are Freedom to take Decisions, Work
recognition, clarity of role, Appreciation of Creativity and Innovations, satisfied with welfare
facilities and proper division of work.
Total Variance Explained
Components Rotation sums of
squared Loadings
Total Percentage of
Variance
Cumulative
Percentage
1 3.562 15.741 15.741
2 3.401 15.103 30.844
3 2.841 12.459 43.303
4 2.457 10.671 53.974
5 1.430 6.932 60.906
Table 4: Total Variance Explained
Thus all the factors i.e. 1, 2, 3, 4 and 5 are capable of explaining 60.906 of the total variance.
TEST OF NORMALITY
In order to check the normality of variables, Kolmogorov-Smirnov test was applied and it
was observed that significant value of all the variables is less than 0.05 i.e. at 5% level of
significance. So the data is found to be normal. As the data is normal so for hypothesis testing
non- parametric tests were applied.

XVI Annual Conference Proceedings January, 2015
ISBN no. 978-81-923211-7-2 http://www.internationalconference.in/XVI_AIC/INDEX.HTM Page 984
HYPOTHESIS TESTING
Measurement of satisfaction of employees of educational institutions regarding salary
with respect to experience.
HN1: There is no difference in satisfaction of employees of educational institutions regarding
salary with respect to experience.
HA1: There is difference in satisfaction of employees of educational institutions regarding
salary with respect to experience.
Test Statistics
Test Statistics Salary and Career Advancement
Chi – Square 18.42
Df 3
Asymp. Sig. 0.000
a. Kruskal-Wallis Test
b. Grouping Variable: Experience
Table 5: Test Statistics of satisfaction of employees regarding salary with respect to
experience
Kruskal – Wallis test is applied to measure the satisfaction of employees of educational
institutions regarding salary with respect to experience. From the table 5, it is found that the
Asymp. Sig. value is 0.000 which is less than 0.05 i.e. 5% level of significance. Thus the null
hypothesis is rejected and the alternative hypothesis is accepted that is there is difference in
satisfaction of employees of educational institutions regarding salary with respect to
experience.
Measurement of satisfaction between the gender groups regarding job rotation.
HN2:There is no difference of satisfaction between the gender groups regarding job rotation.
HA2:There is difference of satisfaction between the gender groups regarding job rotation.
Test Statistics
Rotation of Job
Mann-Whitney U 347.9

XVI Annual Conference Proceedings January, 2015
ISBN no. 978-81-923211-7-2 http://www.internationalconference.in/XVI_AIC/INDEX.HTM Page 985
Wilcoxon W 384.7
Z – value -1.832
Asymp. Sig. (two tailed) 0.173
Grouping Variable: Gender
Table 6: Test Statistics of satisfaction of employees between the gender regarding job
rotation
Mann-Whitney U and Wilcoxon W testsare applied to measure the satisfaction between the
gender groups regarding job rotation.From the table 6, it is found that the Asymp. Sig. value
is 0.173 which is more than 0.05 i.e. 5% level of significance. Thus the null hypothesis is
accepted and the alternative hypothesis is rejected that is there isno difference of satisfaction
between the gender groups regarding job rotation.
Measurement of satisfaction level of employees in training opportunities with respect to
age group.
HN3: There is no difference in the satisfaction level of employees in training opportunities
with respect to age group.
HA3: There is difference in the satisfaction level of employees in training opportunities with
respect to age group.
Test Statistics
Involvement and Training
Chi-Square 7.931
Df 4
Asymp. Sig. 0.074
a. Kruskal-Wallis Test
b. Grouping Variable: Age
Table 7: Test Statistics of satisfaction of employees in training opportunities
Kruskal – Wallis test is applied to measure the satisfaction level of employees in training
opportunities with respect to age group. From the table 7, it is found that the Asymp. Sig.
value is 0.074 which is more than 0.05 i.e. 5% level of significance. Thus the null hypothesis
is accepted and the alternative hypothesis is rejected that is there is no difference in the
satisfaction level of employees in training opportunities with respect to age group.
Measurement of Satisfaction level of employees in the Educational Institutions.
HN4: Employees are satisfied in the educational Institutions.
XVI Annual Conference Proceedings January, 2015
ISBN no. 978-81-923211-7-2 http://www.internationalconference.in/XVI_AIC/INDEX.HTM Page 986
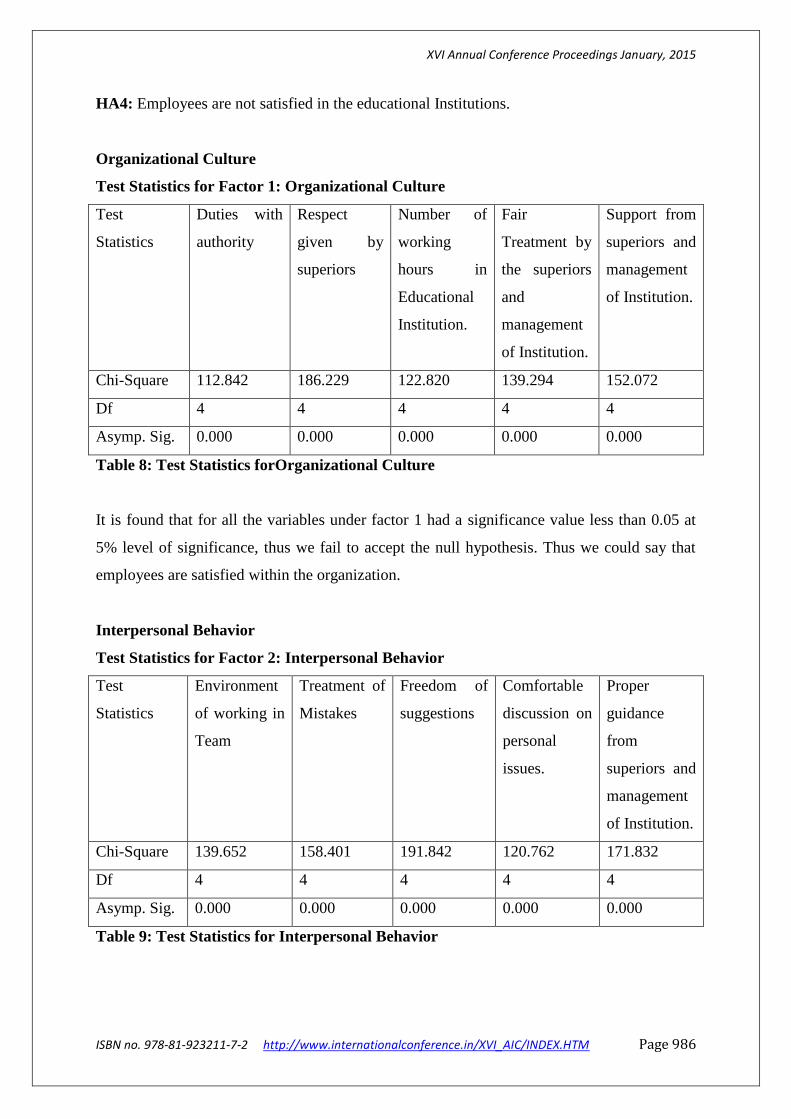
HA4: Employees are not satisfied in the educational Institutions.
Organizational Culture
Test Statistics for Factor 1: Organizational Culture
Test
Statistics
Duties with
authority
Respect
given by
superiors
Number of
working
hours in
Educational
Institution.
Fair
Treatment by
the superiors
and
management
of Institution.
Support from
superiors and
management
of Institution.
Chi-Square 112.842 186.229 122.820 139.294 152.072
Df 4 4 4 4 4
Asymp. Sig. 0.000 0.000 0.000 0.000 0.000
Table 8: Test Statistics forOrganizational Culture
It is found that for all the variables under factor 1 had a significance value less than 0.05 at
5% level of significance, thus we fail to accept the null hypothesis. Thus we could say that
employees are satisfied within the organization.
Interpersonal Behavior
Test Statistics for Factor 2: Interpersonal Behavior
Test
Statistics
Environment
of working in
Team
Treatment of
Mistakes
Freedom of
suggestions
Comfortable
discussion on
personal
issues.
Proper
guidance
from
superiors and
management
of Institution.
Chi-Square 139.652 158.401 191.842 120.762 171.832
Df 4 4 4 4 4
Asymp. Sig. 0.000 0.000 0.000 0.000 0.000
Table 9: Test Statistics for Interpersonal Behavior

XVI Annual Conference Proceedings January, 2015
ISBN no. 978-81-923211-7-2 http://www.internationalconference.in/XVI_AIC/INDEX.HTM Page 987
It is found that for all the variables under factor 2 had a significance value less than 0.05 at
5% level of significance, thus we fail to accept the null hypothesis. Thus we could say that
employees are satisfied within the organization.
Employee Compensation, Benefits & Welfare Schemes
Test Statistics for Factor 3: Employee Compensation, Benefits& Welfare Schemes
Test Statistics Satisfied with salary
and rewards.
Opportunities for
career development
Opportunities for
further study
Chi-Square 119.742 109.621 78.023
Df 4 4 4
Asymp. Sig. 0.000 0.000 0.000
Table 10: Test Statistics for Employee Compensation, Benefits & Welfare Schemes
It is found that for all the variables under factor 3 had a significance value less than 0.05 at
5% level of significance, thus we fail to accept the null hypothesis. Thus we could say that
employees are satisfied within the organization.
Employee Empowerment, Training,& Development
Test Statistics for Factor 4: Employee Empowerment, Training,& Development
Test Statistics Involvement in
Decision Making
Training and
Development
activities.
Full Utilization of
Potential
Chi-Square 56.921 68.928 119.632
Df 4 4 4
Asymp. Sig. 0.000 0.000 0.000
Table 11: Test Statistics for Employee Empowerment, Training, & Development
It is found that for all the variables under factor 4 had a significance value less than 0.05 at
5% level of significance, thus we fail to accept the null hypothesis. Thus we could say that
employees are satisfied within the organization.
Rotation of Job
Test Statistics for Factor 5: Rotation of Job
Test Statistics Rotation of Job

XVI Annual Conference Proceedings January, 2015
ISBN no. 978-81-923211-7-2 http://www.internationalconference.in/XVI_AIC/INDEX.HTM Page 988
Chi-Square 98.037
Df 4
Asymp. Sig. 0.000
Table 12: Test Statistics for Rotation of Job
It is found that for all the variables under factor 5 had a significance value less than 0.05 at
5% level of significance, thus we fail to accept the null hypothesis. Thus we could say that
employees are satisfied within the organization.
Conclusion
The outcome of this research is that the employees working in the Educational Institutions are
satisfied in terms of Authority and work culture, Relationship with Peers, Salary and Career
Advancement, Involvement and Training and Rotation of job.There is difference in
satisfaction of employees of educational institutions regarding salary with respect to
experience.There is no difference of satisfaction between the gender groups regarding job
rotation.There is no difference in the satisfaction level of employees in training opportunities
with respect to age group.
REFERENCES
Arnett, S.E. and Polkinghorne, F.W. (2010). Job dissatisfaction: a factor in maintaining a
highly qualified family and consumers sciences teacher workforce. Online Journal of
Workforce Education and Development Volume IV, Issue 4 – Fall 2010
Arnold, J., Cooper, C.L., Robertson, I.T. (1998). Work Psychology: Understanding Human
Behaviour in the Workplace.3rd ed. Pearson Education: Prentice Hall.
Bhatti, K., and Qureshi, T. (2007).Impact of Employee Participation on Job Satisfaction,
Employee Commitment, and Employee Productivity.International Review of Business
Research Papers, 3(2), 54 – 68.
Brikend, A. (2011).Job Satisfaction.Management Research and Practice, 3(4), 77-86.
Bryant, J. L. (2006). Assessing expectations and perceptions of the campus experience: The
Noel

XVI Annual Conference Proceedings January, 2015
ISBN no. 978-81-923211-7-2 http://www.internationalconference.in/XVI_AIC/INDEX.HTM Page 989
Levitz StudentSatisfaction Inventory.New Directions for Community Colleges, 134. San
Francisco: JosseyBass.
Carpitella, B. (2003). Make residential construction the industry of choice [Electronic
version]. Professional Builder, Oct 2003.
Derek R. Allen, Merris Wilburn, (2002).Linking customer and employee satisfaction to the
bottom line, ASQ quality press publications cat log, Milaukee, WI.
Dinham, S., and Scott, C. (2002).A Three Domain Model of Teacher and School Executive
Satisfaction.Journal of Educational Administration, 36, 362-378.
Freeman, S. (2005). Employee satisfaction: The key to a Successful Company.Retrieved on
March15,2011http://library.lp.findlaw.com/articles/file/00301/008927/title/Subject/topic/Emp
loyment.
Heskett, J. L., Jones, T. O.,Loveman, G. W., Sasser, W. E., and Schlesinger, L. A. (1994).
Putting the Service-Profit Chain to Work.Harvard Business Review, 72 (2).
Hunter, W., and Tietyen, D. (1997). Business to Business Marketing: Creating a Community
of Customers. Lincolnwood-Illinois, McGraw-Hill Professional.
Jex, Steve, M., (2002). Organizational psychology: A scientist Practitioner Approach.
Judge, T.A., Hulin, C.L. (1993), Job Satisfaction as a Reflection of a Disposition: a Multiple
Source Causal Analysis.Organizational Behavior and Human Decisions Processes, 56, 388-
421.
Kaliski, B.S. (2007). Encyclopedia of Business and Finance, Second edition, Thompson Gale,
Detroit, p. 446.
Locke, E.A. (1976). The nature and causes of job satisfaction.In M.D. Dunnette (Ed.),
Handbook of industrial and organizational psychology (pp.1297-1349. Chicago: Rand
McNally.

XVI Annual Conference Proceedings January, 2015
ISBN no. 978-81-923211-7-2 http://www.internationalconference.in/XVI_AIC/INDEX.HTM Page 990
Lumsden, L. (1998). Teacher Morale. ERIC Digest, Number 120. Eugene, OR: ERIC
Maloney, W.F., and McFillen, J.M. (1986).Motivational Implications of Construction
Work.Journal of Construction Engineering and Management, March 1986, 137-151.
Miller, J. L. (2006). Coach Yourself to Succeed @ Work: How to Achieve Optimal
Performance and Job Satisfaction.CA, Dorrance Publishing Co.
Moyes, G. D., Shao, L. P., and Newsome, M. (2008).Comparative Analysis of Employee Job
Satisfaction in the Accounting Profession.Journal of Business & Economics Research, 6(2),
65-81.
Nancy C. M. (1977). Satisfactions in the White-Collar Job, Ayer publishing.
Özgüngör, S. (2010).Identifying Dimensions of students' ratings that best predict students'
self efficacy, course valueand satisfaction.Eurasian Journal of Educational Research, 38, 146-
163.
Rousseau, D. (1978). Characteristics of Departments, Positions, and Individuals:Contexts for
Attitudes and Behaviors.Administrative Science Quarterly, 23, 521–540.
Rynes, S. L., Colbert, A. E., and Brown, K. G. (2002).HR professionals’ beliefs about
effective
Human resource practices: Correspondence between research and practice. Human Resource
Management, 41, 149–174.
Shann, M. H. (2001). Professional Commitment and Satisfaction among Teachers in Urban
Middle schools. The Journal of Educational Research, 92 No. 2, 67-73.
Singh, H.R., and Rawat.H.S. (2010). The Study of Factors Affecting the Satisfaction Level
of Private School Teachers’ in Haryana. VSRD-TNTJ, I (4), 2010, 188-197.
Spector, P.E. (1997). Job Satisfaction: Application, Assessment, Causes, and Consequences.
Thousand Oaks, CA: Sage.

XVI Annual Conference Proceedings January, 2015
ISBN no. 978-81-923211-7-2 http://www.internationalconference.in/XVI_AIC/INDEX.HTM Page 991
Watt, H.M.G., & Richardson, P.W. (2007). Motivational factors influencing teaching as a
career choice: Development and validation of the FIT-Choice Scale. Journal of Experimental
Education, 75(3), 167-202.
Zembylas, M. and Papanastasiou, E. (2004).Job Satisfaction AmongSchool Teachers in
Cyprus. Journal of Educational Administration, 42, 357-374.