Embed Size (px)
Citation preview

UNIVERSITY STUDENT
SATISFACTION:
AN EMPIRICAL ANALYSIS
A thesis submitted in partial fulfilment
of the requirements for the
Degree of Master of Commerce and Management
at
Lincoln University
by
Tzu-Hui Kao
Lincoln University
2007

.".--..... -.~ •• ~ ...... f"_ • ..;
;::.-.:. ·.:-:~.:.-~:~-.I JI'_ • .;_._~j.J'_"'~"-~
: .. - -. >-- .... ~
Abstract of a thesis sublnitted in partial fulfilhnent of the requirement
for the Degree of M. c. M.
UNIVERSITY STUDENT SATISFACTION:
AN EMPIRICAL ANALYSIS by Tzu-Hui Kao
New Zealand's tertiary education sector has experienced political refolID, social changes,
economic changes and globalisation in the last two decades, and the sector has become more
internationally competitive. DeShields, Kara, and· Kaynak (2005) recommended that
management of higher education should apply a market-oriented approach to sustain a
competitive advantage. Therefore, understanding and managing students' satisfaction and
their perceptions of service quality is important for university management if they are to
design and implement a market-oriented approach.
The purpose of this research is to ,gain an empirical understanding of students' overall
satisfaction in a university in New Zealand's higher education sector. A hierarchal nlodel is
used as a framework for the analysis. Fifteen hypotheses are formulated and tested to identify
the dimensions of service quality as perceived by university students, to examine the
relationship between students' overall satisfaction with influential factors such as tuition fees
(price) and the university's image, and to determine the impact of students' overall
satisfaction on favourable future behavioural intentions. In addition, students' perceptions of
these constructs are compared using demographic factors such as gender, age, and ethnicity.
The findings of the study are based on the analysis of a sample of 223 students studying at
Lincoln University. Support is found for the use of a hierarchical model and the primary
dimensions; Interaction Quality, Physical Environment Quality, and Outcome Quality, as
broad dimensions of service quality. Ten sub-dimensions of service quality, as per~eived by
- 11 -

students, are identified. These are: AcadeInic Staff, Administration Staff, AcadeInic Staff
Availability, Course Content, Library, Physically Appealing, Social Factors, Personal
Development, Academic Development, and Career Opportunities. The results indicate that
each of the priInary dimensions vary in tenns of their importance to overall perceived service
quality, as do the sub-dimensions to the plimary dimensions. In addition, the statistical results
support a relationship between service quality and price; service quality, iInage, and "',-'-'···'····..-·····1 .. _"'-.... ~ ... ~ .. ; ... :f'-: ... ___ .... -.. :i
satisfaction; and satisfaction and favourable future behavioural intentions. However, there is
no statistical support for a relationship between price and satisfaction. The results also
suggest that students' perceptions of the constructs are primarily influenced by their ethnicity
and year of study.
- - ------"".-.,".:- <--
The results of the analysis contribute to the servIce marketing theory by providing an
empirically based insight into the satisfaction and service quality constructs in the New
Zealand higher education sector. The study also provides a analytical framework for
understanding the effects of the three primary dimensions on service quality and the effects of
service quality on constructs including price, image, satisfaction, and favourable future
behavioural intentions.
This study will assist management of higher education to develop and implement a
market-oriented service strategy in order to achieve a high quality of service, enhance
students' level of satisfaction and create favourable future behavioural intentions.
Key Words: Higher Education, Hierarchal Model, Student Satisfaction, Service Quality,
Service Quality Dimensions, Behavioural Intentions.
- iii -

Acknowledgements This thesis reflects the contributions and support of many people. First and fOrelTIOst, I would
like to gratefully acknowledge the input, support and guidance from my main supervisor Mr.
Michael D. Clemes. His patience, flexibility, energy, and insightful discussions were
invaluable. Thank you to n1y associate supervisor, Dr. Christopher Gan, who provided .. "--.. - .. '"-.'-1
r·.-t ......... ·_' .~~'_-_ •• _~-.,
valuable perspectives and guidance on this research at key times.
To my parents for their moral and financial support and their continuing encouragement
throughout the hard times when I was staying away from home, I am much appreciative. My
deep appreciation goes to Auntie Sarah, who provided much support throughout the years that
I studied in New Zealand. To my family, a sincere thank you for all of their support and
encouragement during my studies.
Finally, my special thanks go to all the individuals and postgraduate fellows in the Commerce
Division. Their willingness to help and give advice on this research was much appreciated. I
also greatly appreciate the support of the lecturing staff at Lincoln University who helped me
distribute my questionnaire during their lecture periods.
- iv-
-i
L.-:-_ ",.;:"'-~';-h~.--~~---\..~ _~~'<~C~ __ " ~,',
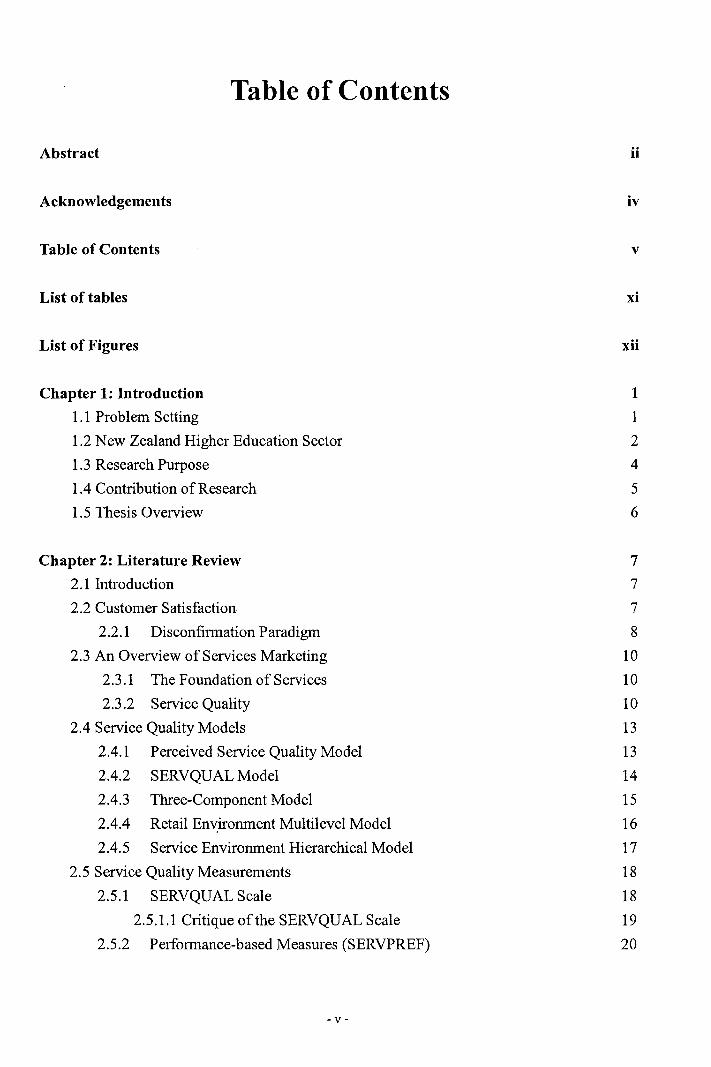
Table of Contents
Abstract
Acknowledgements
Table of Contents
List of tables
List of Figures
Chapter 1: Introduction 1.1 Problem Setting 1.2 New Zealand Higher Education Sector 1.3 Research Purpose 1.4 Contribution of Research 1.5 Thesis Overview
Chapter 2: Literature Review 2.1 Introduction 2.2 Customer Satisfaction
2.2.1 Disconfirmation Paradigm 2.3 An Overview of Services Marketing
2.3.1 The Foundation of Services 2.3.2 Service Quality
2.4 Service Quality Models 2.4.1 Perceived Service Quality Model 2.4.2 SERVQUAL Model 2.4.3 Three-Component Model 2.4.4 Retail Environment Multilevel Model 2.4.5 Service Environment Hierarchical Model
2.5 Service Quality Measurements 2.5.1 SERVQUAL Scale
2.5.1.1 Critique of the SERVQUAL Scale 2.5.2 Performance-based Measures (SERVPREF)
-v-
ii
iv
v
xi
xii
1 1 2 4 5 6
7 7 7 8
10 10 10 13 13 14 15 16 17 18 18 19 20

, 2.6 Service Quality/Satisfaction Studies in Higher Education Sector 2.6.1 North Amelica 2.6.2 Europe 2.6.3 Australasia 2.6.4 Cross-country
2.7 Constructs Related to Service Quality 2.7.1 Relationship between Satisfaction and Service Quality 2.7.2 Price 2.7.3 Image
21 22 24 25 27 28 28 30 31
2.7.4 Behavioural Intentions related to Service Quality and Satisfaction 32 2.8 Chapter Summary 33
Chapter 3: Research Model and Hypotheses 3.1 Introduction 3.2 Conceptual Gaps 3.3 Hypotheses Development
3.3.1 Hypotheses Relating to Research Objective 1 3.3.2 Hypotheses Relating to Research Objective 2 3.3.3 Hypotheses Relating to Research Objective 3 3.3.4 Hypotheses Relating to Research Objective 4 3.3.5 Hypotheses Relating to Research Objective 5
3.4 Chapter Summary
Chapter 4: Research Design and Methodology 4.1 Introduction 4.2 Sample Derivation 4.3 Sample Size 4.4 Method of Data Collection 4.5 Questionnaire Design
4.5.1 Construct Operationalisation 4.5.2 Design and Layout of the Survey Instrument 4.5.3 Pre-testing Procedures
4.6 Data Analysis Techniques 4.6.1 Factor Analysis
4.6.1.1 Modes of Factor Analysis 4.6.1.2 Types of Factor Analysis 4.6.1.3 Assumptions for Factor Analysis 4.6.1.4 Tests for Determining Appropriateness of Factor Analysis
- VI-
34
34 34 36 37 39 40
40
41 41
42 42 42 43 43 44
44 45 46 47 47 48 48 49 50

·_-:-:i--":"-:'~.~-.~_-_:_l ... -..;,,-,,=--....... ::.-.--.:-.--:~
4.6.1.5 Factor Extraction in Principal COlnponents Analysis 4.6.1.6 Factor Rotation 4.6.1.7 Interpretation of Factors
4.6.2 Summated Scale 4.6.2.1 Content Validity 4.6.2.2 Dimensionality 4.6.2.3 Reliability
4.6.3 Multiple Regression Analysis 4.6.4 Analysis of variance (ANOVA) 4.6.5 Statistical Assumptions for Multiple Regression and Analysis of
Variance 4.6.5.1 Outliers 4.6.5.2 Multicollinearity 4.6.5.3 Linearity 4.6.5.4 Error Term Normality 4.6.5.5 Error Term Independence 4.6.5.6 Error Term Homoscedasticity
4.7 Chapter Summary
Chapter 5: Results and Discussion 5.1 Introduction 5.2 Sample and Response Rates
5.2.1 Non-response Bias 5.2.1.1 Early/Late Responses 5.2.1.2 Item Non-Responses
5.3 Descriptive Statistics 5.4 Assessment for Factor Analysis
5.4.1 Statistical Assumptions for Factor Analysis 5.4 .1.1 Examination of the Correlation Matrix 5.4.1.2 Inspection of Anti-Image Correlation Matrix 5.4.1.3 Barlett's Test of Sphericity 5.4.1.4 Kaiser-Oeyor-Olkin measure of Sample Adequacy, MSA
5.4.2 Factor Analysis Results 5.4.2.1 Latent Root Criterion 5.4.2.2 Scree Test Criterion 5.4.2.3 Factor Rotation 5.4.2.4 Interpretation of Factors
- Vll-
52 53 55 56 56 56 56 57 57 58
59 60 61 62 62 63 64
65 65 65 65 65 66 67 68 68 68 69 69 69 69 69 70 70 71
," ........ . ::a:-........ O;...:. .. ;.;~~.-,t.'~:.~
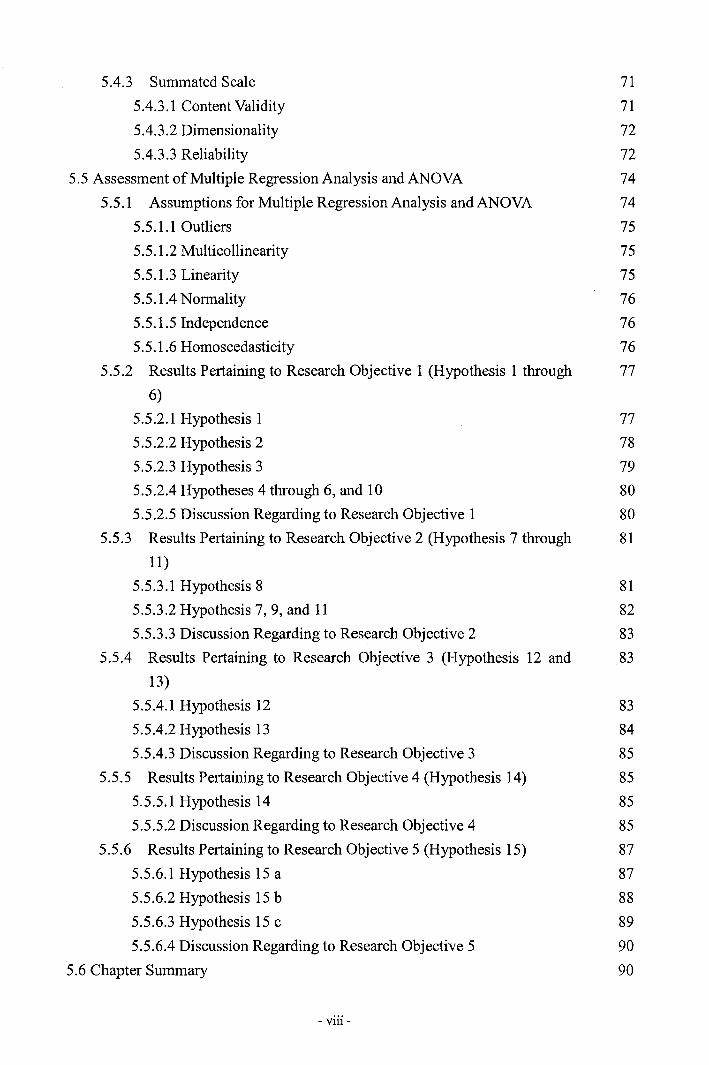
5.4.3 Suml11ated Scale 5.4.3.1 Content Validity 5.4.3.2 Dil11ensionality 5.4.3.3 Reliability
5.5 Assessment of Multiple Regression Analysis and ANOVA 5.5.1 Assumptions for Multiple Regression Analysis and ANOVA
5.5.1.1 Outliers 5.5.1.2 Multicollinearity 5.5.1.3 Linearity 5.5.1.4 Nonnality
71 71 72 72 74 74 75 75 75 76
5.5.1.5 Independence 76 5.5.1.6 Homoscedasticity 76
5.5.2 Results Pertaining to Research Objective 1 (Hypothesis 1 through 77 6)
5.5.2.1 Hypothesis 1 77 5.5.2.2 Hypothesis 2 78 5.5.2.3 Hypothesis 3 79 5.5.2.4 Hypotheses 4 through 6, and 10 80 5.5.2.5 Discussion Regarding to Research Objective 1 80
5.5.3 Results Pertaining to Research Objective 2 (Hypothesis 7 through 81 11)
5.5.3.1 Hypothesis 8 81 5.5.3.2 Hypothesis 7, 9, and 11 82 5.5.3.3 Discussion Regarding to Research Objective 2
5.5.4 Results Pertaining to Research Objective 3 (Hypothesis 12 and 13)
5.5.4.1 Hypothesis 12 5.5.4.2 Hypothesis 13 5.5.4.3 Discussion Regarding to Research Objective 3
5.5.5 Results Pertaining to Research Objective 4 (Hypothesis 14) 5.5.5.1 Hypothesis 14 5.5.5.2 Discussion Regarding to Research Objective 4
5.5.6 Results Pertaining to Research Objective 5 (Hypothesis 15) 5.5.6.1 Hypothesis 15 a 5.5.6.2 Hypothesis 15 b 5.5.6.3 Hypothesis 15 c 5.5.6.4 Discussion Regarding to Research Objective 5
5.6 Chapter Summary
- viii -
83 83
83 84 85 85 85 85 87 87 88 89 90 90
'>:':':-:-:-:-l>:'_~_:! -!,J_·-lo~j.~_~..r1
Chapter 6: Conclusions and Implications 6.1 Introduction 6.2 Sumlnary of the Study 6.3 Conclusions Pertaining to Research Objective 1 6.4 Conclusions Pertaining to Research Objective 2 6.5 Conclusions Pertaining to Research Objective 3 6.6 Conclusions Pertaining to Research Objective 4 6.7 Conclusions Pertaining to Research Objective 5 6.8 Contributions
6.8.1 Theoretical Implications 6.8.2 Managerial Implications
6.9 Litnitations 6.10 Avenues for Future Research
References
Appendices Appendix 1: Cover letter Appendix 2: Questionnaire Appendix 3: Data Imputation Appendix 4: Correlation Matrix Appendix 5: Anti-Image Correlation Matrix Appendix 6: Factor Extraction table Appendix 7: Rotated Factor Tables Appendix 8: Questionnaire Items with VARIMAX Rotation Appendix 9: Multicollinearity Statistics Appendix 10: Scatter Plots Appendix 11: Normality Plots Appendix 12: Analysis of Variance Results
- ix-
92 92 92 94 95 97 97 98 99 99
102 104 105
107
119 119 120 123 126 128 130 130 133 134 137 138 140

- .-.: --~-- -'.' ,- -' -' --I
-__ ._~_r-_-_-~r-_._::-<"_--:--:: of .. '-,:,~:, .. :,,:~_..-:. .... __ :_~:
List of Tables
Table 4.1: Modes of Factor Analysis (Stewart, 1981) 48 Table 4.2: Guidelines for identifying significant factor loadings based on sample size 55 (Hair et aI., 1998) Table 5.1: Independent Satnple Test for Non-response Bias Table 5.2: Gender, Age, and Ethnicity Results Table 5.3: Major Results Table 5.4: Year of Study Results Table 5.5: Reliability of Scaled Items for Interaction Quality Table 5.6: Reliability of Scaled Items for Physical Environment Quality Table 5.7: Reliability of Scaled Items for Outcome Quality Table 5.8: Reliability of Scaled Items for Satisfaction and Related Constructs Table 5.9: Durbin-Watson Test Statistics Table 5.10: Model 1: Multiple Regression Results Relating to Hypothesis 1
66 67 68 68 73 73 73 74 76 77
Table 5.11: Model 2: Multiple Regression Results Relating to Hypothesis 2 78 Table 5.12: Model 3: Multiple Regression Results Relating to Hypothesis 3 79 Table 5.13: Model 4: Multiple Regression Results Relating to Hypotheses 4, 5, 6 and 80 10 Table 5.14: Model 5: Multiple Regression Results Relating to Hypotheses 8 Table 5.15: Model 6: Multiple Regression Results Relating to Hypotheses 7, 9, and 11 Table 5.16: Model 7: Multiple Regression Results Relating to Hypotheses 12 Table 5.17: Model 8: Multiple Regression Results Relating to Hypotheses 13 Table 5.18: ANOVA Results Relating to Hypothesis 15a Table 5.19: ANOVA Results Relating to Hypothesis 15b Table 5.20: ANOVA Results Relating to Hypothesis 15c Table 23A: Separate T-Tests Results Table 24A: Estimated Means Results Table 25A: Correlation Matrix Table 26A: Anti-Image Correlation Matrix Table 27 A: Eigenvalues and the Explained Percentage of Variance by the Factors Table 28A: Rotated Component Matrices with VARIMAX Rotation Table 29 A: Pattern matrix with OBLIMIN Rotation Table 30A: VARIMAX Rotated Component Matrix with Variables Table 31A: Pearson Correlation Matrix, Modell
- x-
81 82
84 84 88 88 89
123 125 126 128 130 131 132 133 134

";-..... -~.~-~~ .. Jo'--.::-..:.1
.~ -~---. --~--- -, :.----~
~~"-~'"~~ -:.. .~~_ .... ~- ."':...l .'. _-..c .... ".-_.-.,
!
Table 32A: Pearson Correlation Matrix, Model 2 Table 33A: Pearson Correlation Matrix, Model 3 Table 34A: Pearson Correlation Matrix, Model 4 Table 35A: Pearson Correlation Matrix, Model 5 Table 36A: Pearson Correlation Matrix, Model 6 Table 37 A: Pearson COITelation Matrix, Model 7 Table 38A: Pearson Correlation Matrix, Model 8 Table 39A: Multicollinearity Statistics Table 40A: Students' Perceptions of Satisfaction and Peliaining Constructs Table 41A: Students' Perceptions of the Primary Dimensions of Service Quality Table 42A: Students' Perceptions of Sub-dimensions of Service Quality
- XI-
134 134 135 135 135 136 136 136 140 141 142

~:-'~.':':~~2:>:':~~ :..:;-=-~ .... ~-:~~--;;..:;
, ,-------" -.- .--.-,
List of Figures Figure 2.1: Perceived Service Quality Model (Gronroos, 1984) 14 Figure 2.2: Detenninants of Perceived Service Quality (Parasuraman et aI., 1988) 15 Figure 2.3: Three-Component Model (Rust and Oliver, 1994) 16 Figure 2.4: Retail Environlnent Multilevel Model (Dabholkar et aI., 1996) 16 Figure 2.5: Service Environment Hierarchical Model (Brady and Cronin, 2001) Figure 3.1: Student Satisfaction in Higher Education: A Conceptual Model Figure 5.1: The Scree Plot Figure 5.2: University Student Satisfaction: Path Model Figure 9A: Residual Scatter Plots Figure lOA: Residual Scatter Plots Figure 11A: Nonnal P-P Plot of Regression Standardised Residual
- xii -
18 36 70 86
137 138 139

Chapter 1: Introduction "·······...,.·····.:·--1
1.1 Problem Setting
Customer satisfaction has been positioned as a central issue in the marketing literature
(Churchill and Suprenant, 1982). Academics and practitioners have studied and developed
strategies to maintain strong relationships with custolners, as satisfied custOlners usually : t ~:_-~ oJ :_~_ •• _ p-: .. ::-_. "~l :"'!".J_·~·...r~_~·-"-" .... l
results in customer retention and customer loyalty (Zeithaml, Parasuraman, and Berry, 1996).
One strategy is to offer high quality products and this strategy has been commonly deemed to
be a competitive advantage that leads to success for many organisations (Sureshchander,
Rajendran, and Anantharaman, 2002). Crosby (1991) maintains that providing a high level of
quality lowers costs and retains satisfied customers, and ultimately generates higher profit
margins for an organisation.
The service sector has grown immensely since 1970s, and this growth has attracted
researchers and prompted them to study service quality and customer satisfaction issues in
service industries (see Sureshchander et aI, 2002; Rust and Oliver, 1994). However, because
services exhibit several unique characteristics, identified as intangibility, inseparability,
heterogeneity, perishability and lack of ownership (Clemes, Mollenkopf, and Bum, 2000),
researchers have difficulty in defining and measuring service quality and customer
satisfaction (Giese and Cote, 2000; Parasuraman, Zeithaml, and Berry, 1988).
Generally, the higher education sector has been increasingly recognised as an intangibly
dominant service as the sector possesses all the unique characteristics of services (DeShields,
Kara and Kaynak, 2005). The higher education sector has also faced reduced subsidies and
intense global competition. In response, the sector has shifted its focus to market-oriented
marketing mechanisms as have many other service industries (DeShields et aI., 2005). The
- 1 -

higher education sector needs to continue strive to deliver a high quality of service and satisfy
its participating customers to achieve sustainability in a cOlnpetitive service environment
(DeShields et aI., 2005).
This chapter begins with a review of the higher education sector in New Zealand, states the
objectives of the study, and finally assesses contributions that this study will make to the
services marketing literature.
1.2 The New Zealand Higher Education Sector
New Zealand higher education sector has experienced major political reforms, social changes,
and economic changes since the restructuring of the New Zealand economy in the mid 1980s
(Clemes, Ozanne, and Tram, 2001).
The New Zealand tertiary education system has been through several reforms, the structural
reforms of the 1980s, the institutional autonomy and academic freedom debates in the 1990s
(Ministry of Education, 1997), and the present reform started in 2002 (Ministry of Education,
2004).
The 2002 reform began with implementation of the Tertiary Education Strategy 2002/07 (TES)
comprised of six strategies that aim to create a rnore coherent and collaborative tertiary
education system, ensure the system is better aligned to the nation's economic and social
development goals, and is actively identifying and meeting the needs of the communities it
. . .~~_ •• ~._ .... w .... _ .. _ ... ...:.; serves (Ministry of Education, 2006).
In terms of social change, the participation rate of domestic students in tertiary education
increased substantially, rising from 8.9 percent of the population in 1994 to 13.4 percent in
.>-.~~-.. -.--'.--'=-I 2003 (Ministry of Education, 2006). However, the increasing number of students has mainly
-2-

I
"~-·---""'····-,,"---""""1
--=-" ... --'--:-.... -'0.-""-'.-:..., .. .:...rJl'_~_ .. ..A.-._-L.::..,;;'::O':: ... ::..,
come fronl part-time and mature students aged over 25, and nlany of these students have been
enrolled in private tertiary institutions (Ministry of Education, 2006). The full-time, full-year
students 1 of all tertiary levels2 of qualifications declined from 28 percent in 1998 to 19 percent
in 2003 (Scott, 2005). The average age of tertiary students increased frOln 27.6 years in 1994
to 30.9 years in 2003, and the proportion of students aged less than 25 decreased from 51
percent to 38 percent over the saIne period (Ministry of Education, 2006). Moreover, the trend
of gender participation rates also changed, female student enrollments have exceeded male
student enrollments since 1993 (Ministry of Education, 1997). For example, 56.5 percent of
all students enrolled in tertiary education organisations were female in 2004, up from 52
percent in 1994 (Ministry of Education, 2006).
The social changes that have accelerated since 2002 were partly influenced by economic
changes that increased the number of part-time and mature students and acted to create more
private tertiary institutions. There has been a dramatic increase in private tertiary institutions
offering courses. For example, private institutions increased from 850 in 2001 to 888 in 2002'
(Tertiary Sector Performance Analysis and Reporting, 2004).
The development of a free market economy also had a large impact on the type of programs
offered by tertiary institutions (Clemes, et aI., 2001). For example, business and employer
groups have been reporting continuing skill shortages across a wide variety of business and
occupational areas (Ministry of Education, 2006). In 2004, the highest proportion of students
were enrolled in Management and Commerce degrees (20.6 percent of all students), and
mixed field programmes (19.4 percent of all students). The students' selection of Management
and Commerce degrees largely reflected the then current employment emphasis (Victoria
University of Wellington, Department of Education, 1996). However, the increasing
1 A full-time full-year student is defined as someone whose combined EFTS use for a year is 1.0 EFTS or more. This excludes those full-time students who study for part of the year.
2 Tertiary Levels including :Certificate, Diploma, Bachelors, Honours, Postgrad CertiDip, Masters, and Do~torate Degrees
- 3 -

-' ._' . ...-.-'-_~-_~ ~ .. r.:.-~-_ popularity of the mixed field programmes also suggests that New Zealand was in the process
of moving to a broader knowledge-based econolny and society (Tertiary Sector Perfolmance
Analysis and Reporting, 2004).
There has also been considerable growth in education provided for international students. The
education sector has become the third largest export service industry in the services sector and
education generated approximately NZ$2.2 billion in 2004 (Ministry of Education, 2005).
Despite the drop in the international students during the Asian economic downturn in 1997,
the number of foreign fee-paying students participating in public tertiary institutions increased
by 295 percent, from 3,199 in 1994 to 12,649 in 2001 (International Policy and Development
Unit, 2002). In 2004, there were 29,051 foreign fee-paying students studying in public tertiary
institutions, a 908.1 percent growth from 1994 (Ministry of Education, 2005).
The recent political reforms, social changes, economic changes, and globalisation have
prompted the New Zealand higher education sector to become more internationally
- - , -_~_r-:_-L-_~:._:""':""-"'-'::
competitive. The higher education sector is seeking ardently marketing strategies to succeed
in the marketplace, and DeShields et al. (2005) recommended that higher education
management should apply market-oriented principles and strategies that are used in
profit-making institutions. Therefore, the approaches to enhance perceived service quality and
customer satisfaction that are normally adopted in other service industries have also attracted
the interest of higher education management (Ford, Joseph, and Joseph, 1999).
1.3 Research Purpose
Clemes et al. (2001) empirically investigated students' perceptions of service quality in the
higher education sector in New Zealand. The research implication was that the perceptions of
service quality varied significantly among students of different ages, different ethnic
backgrounds and those studying different courses.
-4-

The purpose of this research is to gain an elnpirical understanding of students' overall
•.. c···"'·, .. ···-:·i . ! satisfaction in a university in New Zealand's higher education sector. In particular, this
research will identify the dilnensions of service quality as perceived by university students.
The relationship between students' overall satisfaction with influential factors such as tuition
fees (prices), and university's image is also examined. In addition, students' overall
satisfaction will be compared using demographic factors such as gender, age, and etlmicity.
Finally, the impact of students' overall satisfaction on favourable future behavioural intentions
will be analysed.
This research uses a hierarchical model structure proposed by Brady and Cronin (2001) as a
framework. The research has five main objectives:
(1) To identify the service quality dimensions as perceived by students in the New Zealand
higher education sector.
(2) To determine the effects of the dimensions of perceived service quality and other
influential factors on students' overall satisfaction.
(3) To examine the relationship of students' overall satisfaction with favourable future
behavioural intentions.
(4) To identify the least and most important service quality dimensions as perceived by
students in higher education in New Zealand.
(5) To examine the effects of demographic factors on students' satisfaction and related
constructs.
1.4 Contribution of Research
By satisfying these objectives this study will contribute to the marketing literature from both
an academic and practical perspective. First, this study will contribute to the marketing
literature by providing an examination of several services marketing constructs. This is an
- 5 -

"-- --- ~- - ---I
._.~_"C-_'_4_ -- ..... i
=>-_'t-~ ... J'~:"i--_ - • ."."..-_-_,
-'.----. ":-·--·-'-'-.:"1
• - .... :T~_ --"- -- i
important contribution as it should provide an illlproved understanding of student perceptions
of: service quality, satisfaction, influential factors, and favourable future behavioural
intentions.
Second, this study will benefit marketers and practitioners in the New Zealand higher
education sector. The research findings will provide practical information about what students
of different ethnic backgrounds consider important in their evaluation of service quality, and
the effect that ethnicity has on other important constructs. These findings are important as
they may assist higher education marketers and practitioners in developing and implementing
services marketing strategies to ensure a high quality of service and enhance student
satisfaction. Higher levels of satisfaction should increase favourable future behavioural
intentions.
1.5 Thesis Overview
This study consists of six chapters in order to meet the research objectives outlined in Section
1.3.
Chapter Two reviews the customer satisfaction and service quality literature, the empirical
research in the higher education sector, and the literature on influential factors and favourable
future behavioural intentions. Chapter Three presents the conceptual model based on the
findings of the literature review undertaken Chapter Two and develops several hypotheses.
Chapter Four details the methodology used to test the hypotheses. Chapter Five presents and
discusses the results of the analysis undertaken in this study. Lastly, Chapter Six offers
conclusions and recommendations based on the results and discussions presented in Chapter
Five.
- 6-

._:._~ _~ "~_ -..4.- ,- •. _~_ -~-. . . ..- . ~ --.
:.:~ :&:<:--~ .• ~. ~~;! --~": .. I --."":-'-"""""."-'1
• ~._ -_r;·,:_~_i...:;. __ -...:
__ ~ - - - - ~: __ :.< I
Chapter 2: Literature Review
2.1 Chapter Introduction
This chapter examines the relevant literature on satisfaction and the constructs such as service
quality, image and price that may impact on an individual's satisfaction. The chapter begins
with defining and reviewing the disconfirmation paradigm. Section 2.3, 2.4 and 2.5 exalnine
the relevant literature regarding the conceptualisation and measurement of service quality.
Section 2.6 presents an overview of the literature specific to service quality and satisfaction in
the higher education sector. Section 2.7 discusses the relationship between satisfaction and
service quality and relates these constructs to favourable future behavioural intentions, and
then examines other factors such as image/reputation and price that may impact on student
satisfaction.
2.2 Customer Satisfaction
Since Cardozo (1965) proposed that the concept of customer satisfaction was an important
marketing activity outcome, numerous researchers have attempted to develop a consensus
definition of the construct (Giese and Cote, 2000). Customer satisfaction was traditionally
conceptualised as a cognitive construct (Westbrook, 1987), but others have argued that
customer satisfaction was involved in customers' affective responses (Yi, 1990).
Hunt (1977) described customer satisfaction as stepping away from an experience and
evaluating it.
"The evaluation rendered that the [ consumption] experience was at least as good as it was
supposed to be" (p.459).
Oliver (1981) suggested that customer satisfaction was an evaluation of the surprise inherent
- 7 -

in a product acquisition and/or consulnption expelience.
"The summary psychological state resulting when the emotion surrounding disconfinned
expectations is coupled with the consumer's plior feelings about consumption expeliences"
(p.27).
These two definitions emphasized the evaluative process, however, other researchers
recomlnended viewing customer satisfaction as the response to an evaluative process (Giese
and Cote, 2000).
For example,
"The consumer's response to the evaluation of the perceived discrepancy between plior
expectations (or some norm of performance) and the actual performance of the product (or
service) as perceived after its consumption" (Tse and Wilton, 1988, p. 204).
"[Product satisfaction] is an attitude - like post consumption evaluative judgment" (Mano
and Oliver 1993, p. 454).
Drawing from these definitions, customer satisfaction was viewed as a summary of emotional
and cognitive responses (Rust and Oliver, 1994) that pertained to a particular focus
(expectations, product/service, or consumption experience) and occurred at a particular time
(after consumption, after choice, or accumulative expeliences) (Giese and Cote, 2000).
2.2.1 Disconfirmation Paradigm
The vast majolity of the customer satisfaction literature has been based on the disconfirmation
paradigm, these studies have used some valiant of the disconfirmation paradigm which holds
that satisfaction is related to the size and direction of the disconfirmation expelience, where
disconfirmation is related to the person's initial expectations (see Oliver, 1993, 1981; Yi, 1990;
Churchill and Suprenant, 1982).
- 8 -

Churchill and Suprenant (1982) highlighted that the full discontirmation paradigm
encompassed four constructs, expectations, perfonnance, discontirmation and satisfaction.
Expectations reflected custolners' pre-consumption perception associated with goods or
services (Barsky, 1992), or anticipated performance (Churchill and Suprenant, 1982),
performance represented customers' perception of actual performance of goods or services - .... .
,'".1' ~ •. ,: .;_--...... :.:.- .. :.,.~~
(Oliver, J993), discontirmation arose from discrepancies between prior expectations and
actual performance, and satisfaction was described as an outcome of purchase and use
resulting from the buyer's comparison of the rewards and costs of purchase in relation to the
anticipated consequences (Churchill and Suprenant, 1982).
The relation between the four constructs was that expectations and the performance directly
affected the satisfaction, or indirectly, via subjective disconfirmation (Oliver, 1980; Tse and
Wilton, 1988). Disconfirmation occupied a central position as a crucial intervening variable
on customer satisfaction (Churchill and Suprenant, 1982). The operation of disconfirmation in
influencing satisfaction is generally seen as two processes consisting of forming expectations
and a comparison of those expectations against the outcome (Rust and Oliver, 1994).
The satisfaction level depended on the level of disconfirmation which ranged from negative
disconfirmation, confirmation, and positive disconfirmation. More specifically, negative
disconfirmation occurred when the good or service was more poorly performed than expected
(Churchill and Suprenant, 1982), or when customers had exceedingly high expectation levels
-... -.. '---. that the performance was unable to match. Confirmation was when goods or services
performed as expected, and customers would likely to be neither satisfied nor dissatisfied.
Lastly, positive disconfirmation happened when the performance of goods or services was
better than expected and favoured a satisfactory experience (Churchill and Suprenant, 1982).
- 9 -
•• ---. -;-~.~ "'-·-'-'-'1
--'~-=-"":-:.--~. ~-~ -~:---j ~",,~~.o::r_.t_""_"....F:''''_~_~
The concept of disconfinnation was also widely recognised and has been adopted to
conceptualise service quality (discussed in Section 2.4). The following section overviews the
early foundations of service and the service quality consttuct.
2.3 An Overview of Services in Marketing
2.3.1 The Foundation of Services Traditionally, the marketing literature has fundamentally focused on the manufacturing
industry that produces tangible goods (Gronroos, 1978). The concept of service was ignored,
researchers and practitioners considered that services were indifferent from goods except for
intangibility (Shostack, 1977). Therefore, many service firms adopted marketing planning that
was originally designed for physical goods (Shostack, 1977). ~owever, Gronroos (1978)
suggested that services should not be treated as physical goods and that intangible services
required new market planning and market mix concepts.
Following this contention, the early services marketing literature concentrated on
differentiating services from goods (see Lovelock, 1983, 1981; Shostack, 1977). Shostack
(1977) emphasised that there were rarely pure goods or pure services, Lovelock (1983)
classified services with regard to their people/things involvement and tangible/intangible
actions. Rathmell (1966) distinguished goods from services and described thirteen distinct
characteristics. The literature commonly identifies five distinct characteristics that
differentiate services from goods: intangibility, inseparability, heterogeneity, perishability and
lack of ownership, summarised in Clemes et aI. (2000).
2.3.2 Service Quality Parasuraman et aI., (1985) and Rust, Zhahorik and Keiningham, (1995) recognised quality
was as a competitive advantage for an organisation's success and survival, and that quality
products and services delight customers and lead to organisational growth. However, the
- 10 -

interest in quality Inanagelnent in the service sector was estitnated to have started sixty years
later than in the goods sector (Gummesson, 1991). Hence, the cOlnprehensive goods quality
literature combined with the customer satisfaction literature, have contributed to the
foundation of early service quality theory (Parasuraman et aI., 1988, 1985; Gronroos, 1984,
1982).
Quality was traditionally defined as 'confonnance to specifications' (Crosby, 1979). In the
goods sector, research into quality focused on measuring the costs of quality defects and
managing quality through several systematic approaches that were associated with prevention,
appraisal, and failure (Alahassane, Zafar, and Curtis, 1995). This perspective of quality was
primarily technology driven and product oriented (Gummesson, 1991), or often referred to as
'objective quality' (Garvin, 1983).
However, several researchers claimed that 'objective quality' only conformed to
manufacturers' specifications and that it did not necessarily correspond to conformance of
customers' specifications (Steenkamp, 1989). Jacoby, Olson and Haddock (1971) contended
that customers used cues to form their impressions of quality, regardless of product's actual
quality. Similarly, Gilmour (1977) found that customers' purchasing behaviour was related
more to perceived product characteristics than to actual performance characteristics.
Researchers recognised that customers' specifications were also essential; in fact, Gummesson
(1991) suggested that manufacturers would be in danger if they did not understand quality as
perceived by customers. This was primarily because customers' expectations often cannot be
anticipated by manufacturers (Zeithaml, 1988).
Service quality was viewed as subjective in nature, and commonly referred to as 'perceived
service quality' in the service sector (Rust and Oliver, 1994). Shostack (1977) contended that
- 11 -

-."'~".r:.. -:"' __ T.r-j-~rJ:""l ~~....:~.s.-II-"~f"lio\
. -.1
the reality of services to custolners Inust be defined experientially, rather than in engineering
tenns. Similarly, Oliver (1993) and Olshavsky (1985) found that custolners evoke different
subsets of attributes to infer quality in different situation. FUliher, the dissimilarities to goods
make the evaluations of services not possible if custolners relied only on the previous
dimensions of goods quality (Parasuraman et aI., 1985).
Several pioneers of service quality research have described service quality as an elusive and
indistinct construct (Cronin and Taylor, 1992; Cannan, 1990; Parasuraman et aI., 1985).
Services have been observed as only existing during the time they are rendered (Shostack,
1977), and that evaluations of service quality involve both processes of service delivery and
outcomes of services (Gronroos, 1982).
Parasuraman et aI. (1985) defined perceived service quality as a fonn of attitude, related to
but not equivalent to satisfaction, resulting from a comparison of expectations with
perceptions of perfonnance. Service quality was interpreted as an enduring global attitude,
while satisfaction was related to a specific transaction (Cannan, 1990). Cannan (1990)
cautioned that calling quality an attitude was not a common practice among researchers.
However, Cronin and Taylor (1992) argued that service quality was best conceptualised and
measured as an attitude.
The complexity in conceptualising and measuring service quality has been deemed to be one
of the most debated and controversial topics in service marketing (Brady and Cronin, 2001).
Parasuraman et aI. (1985) concluded that service quality was more difficult for customers to
evaluate than goods quality. However, service quality was seen as increasingly important in
both the goods and services sectors, and the need to effectively manage service quality was
recognised. Therefore, an improved understanding of customers' perceptions of service
quality was deemed to be required (Rust and Oliver, 1994).
- 12 -

The following section reviews seminal conceptualisations of service quality and the
corresponding conceptual models developed.
2.4 Service Quality Models
Many studies on service quality have attempted to conceptualise the construct and develop a
corresponding model (see Gronroos, 1984, 1982; Parasuraman et al., 1988, 1985). One of the
most recent service quality models developed by Brady and Cronin (2001) was integrated
from a two-dimensional, three-dimensional, and five-dimensional structure, to a
multi-dimensional structure. The following section presents a review of service quality
models.
2.4.1 The Perceived Service Quality Model Gronroos (1984, 1982) was one of the first scholars to conceptualise service quality.
Gronroos's (1982) perceived service quality model (Figure 2.1) was based on the
disconfirmation paradigm (Churchill and Suprenant, 1982). In his model, service quality was
defined as "the result of a comparison between customer's expectation, and hislher real-life
experiences with the services" (Gronroos, 1984). Gronroos (1982) also suggested that
functional and technical quality were the two most important dimensions of service quality.
Technical quality referred to the outcome of the production process, or what the customer
receives in a customer encounter. For example, if an insurance claim is settled to the
customers' satisfaction then the outcome of the claims handling process results in good
technical quality.
Functional quality referred to the interaction between buyer and seller, that is, how the service
is delivered. For example, if the claims handling process is poor from the customers' view
point then the functional quality will be low (Gronroos, 1982).
- 13 -

:..:...:1. ••• _ ..... -~· .. ·_·a:j
~J.>:' :_~_:_'>:-_:.:.:~ ""'_~_~_'""-_':.-..! ...F''''L--_~'~
EXPECTED SERVICE
< Perceived Serviced Quality>
t Traditional marketing activities (advertising, field selling, PR, pricing) and extemal influence by traditions, ideology and word-of-mouth
TECHNICAL QUALITY
What?
IMAGE
FUNCTIONAL QUALITY
How?
PERCEIVED SERVICE
Figure 2.1: Perceived Service Quality Model (Gronroos, 1984; p. 40).
2.4.2 The SERVQUAL Model Parasuraman, et al. 's (1988, 1985) also employed the disconfirmation paradigm as a basis to
conceptualise their SERVQUAL model (Figure 2.2). They contend that there is a gap between
customer's expectation and perception of the service performance, and that the level of
perceived service quality is dependent on the magnitude of the gap. The smaller the gap, the
higher the level of perceived service quality.
Distinct from Gronroos' (1984, 1982) two dimensional service quality model (technical and
functional), Parasuraman et al. (1985) initially evaluated ten service quality dimensions
(determinants) and in a later study consolidated them into five dimensions (Parasuraman et aI.,
1988). These five dimensions are:
Tangibility: Physical facilities, equipment, and appearance of personnel.
Reliability: Ability to perform the promised service dependably and accurately.
Assurance: Knowledge and courtesy of employees and their ability to inspire trust and
confidence.
- 14 -

Elnpathy: eating, individualized attention the finn provides its custOlners.
Responsiveness: Willingness to help custolners and provide prolnpt service. (Parasuratnan et
aI., 1988; p. 23).
Detenninants of .. Service Quality .. Expected ~
Service Reliability PERCEIVED Responsiveness - ... SERVICE ~
Empathy QUALTY Assurance Perceived Tangibles .. Service -..
Figure 2.2: Determinants of Perceived Service Quality (Parasuraman et aI., 1988).
2.4.3 The Three-Component Model Rust and Oliver (1994) recognised that the two dimensions in Gronroos (1984, 1982) service
quality model were critical; however, they suggested another important dimension underlying
service quality. Therefore, Rust and Oliver's (1994) proposed a three-component model,
consisting of the service product (technical quality), the service delivery (functional quality),
and the service environment (Figure 2.3).
Rust and Oliver's (1994) conceptualised model was empirically validated by McDougall and
Levesque (1994), and by McAlexander, Kaldenberg, and Koening (1994) and these authors
confirmed the existence of the three components in retail banking and health care
respecti vel y.
- 15 -

Service Product
Service Delivery
Figure 2.3: Three-Component Model (Rust and Oliver, 1994)
2.4.4 The Retail Environment Multilevel Model Drawing from an extensive review of the past literature on quality, Dabholkar, Thorpe, and
Rentz (1996) argued that the SERVQUAL model would be inappropriate in a retail
environment. Dabholkar et al. (1996) developed a hierarchical model (Figure 2.4) that
involved multi facets and dimensions of service quality.
Dalbholkar et al. 's (1996) model comprised three levels, the highest order measures
customers' overall perception of service quality, the second order consists of five basic
dimensions, and the third order consists of the sub-dimensions.
Figure 2.4: Retail Environment Multilevel Model (Dabholkar et al., 1996).
- 16 -

.• j_:"_'~-_"'_'~_:'-J .. ~
.~,--.. ~ .=.--::-.::---~ -"'::--:-'- '-:;1 ,;... . .z_.t_~_ .. ...Jl:..'""_.". __ ..... "'"
2.4.5 The Service Environment Hierarchical Model
Brady and Cronin (2001) suggested that Dabholkar et aI. 's (1996) hierarchical structure Inodel
was not only applicable in a retail service environment, but it could also be applied to other
service industries. Brady and Cronin (2001) investigated and enhanced the nlodel to make it
more relevant in generic service industries (Figure 2.5) .
Firstly, they agreed with Rust and Oliver's (1994) view that the overall perception of service
quality was based on a customer's evaluation of three dimensions of the service encounter (1)
the service-employee interaction (i.e. functional quality (Gronroos, 1984, 1982)), (2) the
service environment (i.e. servicescapes (Bitner, 1992)), and (3) the outcome (i.e. technical
quality (Gronroos, 1984, 1982)).
The dimensions are incorporated into three primary dimensions of perceived service quality.
Brady and Cronin (2001) termed the dimensions as (1) interaction quality, (2) physical
environment quality and (3) outcome quality.
The next level in the Brady and Cronin's model (2001) is formed by nine distinct
sub-dimensions that are divided evenly between the three primary dimensions. The nine
sub-dimensions aggregate to form a perception on each of the three primary dimensions, and
perceptions of the primary dimensions ultimately combine to form an overall service quality
perception.
Brady and Cronin (2001) proposed that customers evaluated the sub-dimensions in terms of
the reliability, responsiveness, and empathy (Parasuraman et aI., 1988) of the service
performance (see Figure 2.5).
Empirical evidences supported Brady and Cronin's (2001) conceptualised model based on
four service industries, fast food, photograph developing, amusement parks, and dry cleaning.
- 17 -

A replication study (Liu, 2005) based on fast food restaurants, gasoline stations, medical
clinics, photo shops, mobile phone repair shops and 24-hour grocery stores also confilmed the
hierarchical nature of perceived service quality suggested Brady and Cronin (2001). Collins
(2005) used the hierarchical structure as a framework to research spectator satisfaction in
professional sports and found empirical support a hierarchical structure.
Note: R :::: a reliability item, S(:l :::: a responsiveness item, E ""an empathy item. The broken line indicates 1hat the path was added as part ·of . model·respecification.
Figure 2.5: Service Environment Hierarchical Model (Brady and Cronin, 2001).
The next section will discuss the measurement of service quality and the critiques of the
SERVQU AL instrument.
2.5 The Service Quality Measurements
2.5.1 SERVQUAL Scale The SERVQUAL instrument was developed by Parasuraman et al. in 1985 and refined in
1988, the function of the instrument was to measure customers' perception of service quality.
The instrument was conformed to fit Pararuraman's et al. (1985) conceptual model of service
quality (discussed in Section 2.4.2) where perceived service quality is formed by a
comparison of customers' expectations and performance.
- 18 -

In the original instrument, expectations were assessed using 22 itelns and by asking customers
what they expected from a specific organisation. Sitnilarly, performance was also assessed
using 22 items and asking customers to evaluate the service performed by the specific
organisation. The items were measured seven point Likert scale to represent the extent of
agreelnent and the extent of disagreement.
The 22 pairs of items represented five dimensions; tangibles, responsiveness and assurance
dimensions have four items each; and the remaining two dimensions, reliability and empathy
have five items each. Reliability was found to be most important amongst all of the
dimensions (Parasuraman et at, 1988).
Parasuraman et al. (1988, 1985) asserted that the SERVQUAL instrument could be
generalised to most of the service organisations as their empirical results based on five
different service industries exhibited good reliability and validity. Further, they maintained
that the instrument was insightful if the purpose of the research was to diagnose service
shortfalls accurately (Parasuraman et at, 1994).
2.5.1.1 Critique of the SERVQUAL Scale
Although SERVQUAL is extensively used and frequently cited across a range of service
organisations, considerable criticisms have also been raised questioning its reliability and
validity (Cronin and Taylor, 1994, 1992; Babakus and Boller, 1992; Carman, 1990).
Buttle (1996) grouped the criticisms into theoretical and operational issues.
The theoretical issues include:
(l) Gap model-there is little evidence that customers assess service quality in terms of
performance minus expectation gaps; (2) process orientation- SERVQUAL focuses on the
process of service delivery, not on the outcomes of the service encounter; and (3)
dimensionality- SERVQUAL's five dimensions are not universal- the number of dimensions
- 19 -

cOlnprising service quality is contextualised; itelns do not always load on the factors that one
would a priori expect; and there is a high degree of intercorrelation between the five
ditnensions (Buttle, 1996).
The operational issues include:
(1) Expectations- the tenn expectation is polymeric; consumers use standards other than
expectations to evaluate service quality (SQ); and SERVQUAL fails to measure absolute SQ
expectations; (2) item composition- four or five items can not capture the variability within
each SQ dimension; (3) two administrations- two administrations of the instrument causes
boredom and confusion; (4) variance extracted: the over SERVQUAL score accounts for a
disappointing proportion of item variances (Buttle, 1996).
As a result of these criticisms, researchers have developed alternative approaches with the
objective being able to improve the measurement of service quality (Cronin and Taylor,
1992).
2.5.2 Performance-based Measures (SERVPREF)
Cronin and Taylor (1992) suggested that SERVQUAL is inadequate; alternatively, they
introduced the SERVPREF instrument to measure service quality. The major difference
between the two approaches is that SERVQUAL utilises a disconfinnation paradigm whereas
SERVPREF utilises an attitudinal paradigm.
Cronin and Taylor (1992) defined service quality as a long-tenn attitude, and suggested that it
would be inappropriate to include an expectation construct in the measure. Therefore,
perceived service quality is considered purely as a perfonnance-based construct and only
customers' perception of perfonnance by an organisation are measured.
Cronin and Taylor's (1992) empirical results suggested that SERVPREF exerted better
- 20-

--_0 -__ -•.• _- ~ -...::..--~-_ -.,.r:.-_~
~---------<'---;'
--:--.... ------ - ------1
predictability of custolners' responses of the service quality delivered by an organisation than
SERVQUAL. Parasuraman et aI. (1994) defended the inclusion of expectations and
maintained it would be more favorable as a construct for practitioners because the superior
diagnostic value of SERVQUAL more than offsets the instruments loss of predictive power.
However, Zeithaml, Berry and Parasuraman (1996) later conceded that the perceptions only
measurement was more appropriate if the primary purpose of research was an attempt to
explain the variance in a dependent construct. Therefore, several studies have excluded the
expectation construct when measuring service quality (Bigne, Moliner, and Sanchez, 2003;
Brady and Cronin, 2001; Clemes et aI., 2001).
2.6 Service Quality/Satisfaction Studies in the Higher Education Sector
Fundamental approaches to service quality and satisfaction measurement in higher education
concentrate on teaching quality, for example, Students' Evaluation of Teaching Effectiveness
(SETE) (Guolla, 1999). Fundamental approaches are primarily involved with the teaching
side of the experience, however, the student experience involves more than just teaching and
learning (Cuthbert, 1996a), and it is rational to include aspects of the service enviromnent to
evaluate total student experience (Souter and McNeil, 1996).
Education researchers have frequently utilised modified SERVQUAL (Parasuraman et aI.,
1988) and SERVPREF (Cronin and Taylor, 1992) instruments, and they have included
physical enviromnent aspects to examine overall students' perception of service quality (see
Bigne et aI., 2003; Athiyaman, 1997; Cuthbert, 1996a).
It is important to know that the higher education literature, the definition of quality
predominantly focuses on the assessment of outcomes (Ewell, 1994). Outcomes are the
consequences or results associated with instructional experiences; the end results of
- 21 -

institutional, program, or cunicular goals (Anderson, Moore, Anaya, and Bird, 2005).
Assessing students' outcolnes often requires asking students what they are able to do after
they complete their studies (Anderson et aI., 2005), or measuring the knowledge, skills and
abilities the students have attained (Gardiner, Anderson, and Cambridge, 1997) after
instructional experiences. The College Student Experiences Questionnaire (CESQ) developed
by Pace and Kur (1998) has encompassed the estimate of gains when measuring outcomes of
students' university or college experiences (Segar, 2001). Therefore, the estimate of gains by
students may be viewed as the outcome dimension of service quality when students'
university experiences are evaluated.
The following sections present an overview of the empirical studies conducted on service
quality and/or satisfaction in major higher education settings, including North America,
Europe, and Australasia, and cross-cultural studies that involved the United States and New
Zealand, and the United States and the United Kingdom.
2.6.1 North America Guolla (1999) applied the SEEQ (Students' Evaluatjon of Educational Quality) instrument to
examine students' course satisfaction and instructor satisfaction. Seven dimensions were
identified; learning, enthusiasm, organisation, interaction, rapport, assignments and materials.
Guolla (1999) sampled undergraduate and MBA students. In both samples, most of the
dimensions were found to have a positive and significant relationship with course and
instructor satisfaction. The learning dimension was found to have the greatest impact when
evaluating course satisfaction; and enthusiasm was most important when measuring instructor
satisfaction. For MBA students, the rapport dimension had a significant negative relationship
with course and instructor satisfaction. On the other hand, the undergraduate students' sample
showed neither the organisation, nor the interaction dimension, maintained a positive
- 22-

significant relationship with the course and instructor dimension.
DeShields et al. (2005) investigated the detenninants of student satisfaction. The authors
argued that faculty performance, advising staff, and classes were the most itnportant variables
that influenced students' college experience, and ultimately satisfaction (defined as perceived
service performance) and retention.
DeShields et al. 's, (2005) results suggested that faculty performance and classes had a positive
and significant relationship with student partial experience and advising staffhad a positive
but insignificant relationship with student partial experience. Analysis of means also indicated
student partial experience was positively related to student level of satisfaction.
~ .- ; -" = - - '-- =. - ---- -- _. ~.- The authors contend that the positive insignificant relationship between advising staff and
student partial experience cannot be interpreted as student dissatisfaction since students may
not perceive that the advising staff performance is directly related to expected outcomes from
a college experience. They imply that the interaction quality (faculty) is positively related to
the outcome quality (student partial experience) and will ultimately influence student
satisfaction.
Segar (2001) conducted a survey in Elizabethtown College and used the College Student
Experiences Questionnaire (CSEQ) developed by Pace and Kuh (1998) as the measurement
instrument. The CSEQ covered thirteen Quality of Effort dimensions including 'art, music,
theater', 'campus facilities', 'clubs and organisations', 'computer and information
technology', 'course learning', 'experiences with faculty, 'information in conversations',
'library', 'personal experiences', 'scientific and quantitative experiences', 'student
acquaintances' and 'writing experiences'. Furthermore, a total of thirty-five gain estimates
related to the quality of effort dimensions and college live decision objectives were broadly
classified into intellectual, social, personal, moral, and vocational growth aspects. Examples
of the gains include: 'developing the ability to function as a member ofa team', 'gaining a
- 23 -

range of infonnation that tnay be relevant to a career, understanding yourself, your abilities, ....... -.. _-= - --'" ~ =-----1
interests, and personality'.
Segar (2001) reported that students rated highest those gains that related to personal,
interpersonal, teclmical, and vocational gains. Segar's (2001) results showed that the
estimates of relationships with other students rated the highest, and also was the single
_' ••• - _ -~r ._
-... ~-..,,".::~~::..,,"----,~::--:. ... strongest predictor of college satisfaction. Alternatively, estimates on administrative personnel
rated as the lowest predictor of college satisfaction.
2.6.2 Europe
Cuthbert (l996a) reviewed several techniques measuring student experience and pointed out
that these approaches only covered the teaching side of the experience. The author argued that
a modified SERVQUAL instrument may be applicable in a higher education context because
it might be able to encompass the whole student experience.
Two sets of questionnaire were constructed; one was referred to students' expectation of
general university, and the other referred to their experience in Manchester Metropolitan
University. The study results implied that staff and their relationship with students would
override other dimensions such as computer facilities, library, and sports facilities when
measuring the overall level of perceived service quality. Cuthbert (1996b) also concluded that
the SERVQUAL instrument (Parasuraman et aI., 1988) may not be appropriate for measuring
service quality in higher education.
Oldfield and Baron (2000) studied students' perceptions of service quality of the Management
Faculty at a university in the United Kingdom. The authors adapted a modified SERVPREF
instrument to measure students' perceptions of service quality. They contended that service
quality in higher education must consider interpersonal and service delivery aspects, as well
as the physical elements of their educational experiences in lecture rooms, libraries, and
computer rooms. However, the empirical results showed three factors of service quality are;
- 24-

requisite, acceptable, and functional. Requisite factors represented those items that are
essential to enable students to fill their study obligations. Acceptable factors represented those
items that students acknowledge as being desirable but not essential during their course of
study. Lastly, Function factors represented those items of a practical or utilitarian nature
(Oldfield and Baron, 2000).
Bigne et al. (2003) examined the multi-service public services, including university
experience, in Spain. The SERVPREF insttument (Cronin and Taylor, 1992) was used as a
reference to detennine the perceptions of quality in the core service (teaching quality). Only
one item per ditnension (tangibility, reliability, responsiveness, confidence and empathy) was
used to detennine the perceptions of the peripheral services (library quality, infonnation
attention quality, and registration quality).
Bigne et al. (2003) used conjoint analysis to examine the relationships between perceptions of
service quality (both core and peripheral) and overall university quality to detennine overall
student satisfaction. The authors' conclusion was that the perception of core service quality
was dominant for overall quality, but that the perceptions of the peripheral service quality
must not be neglected by universities.
2.6.3 Australasia Soutar and McNeil (1996) examined students' expectations on perceptions of the academic
and administrative service quality at a large Australia university. The SERVQUAL instrument
was modified and used in Souter and McNeil's (1996) study. The authors proposed
communication, knowledge and availability were also important dimensions in a higher
education setting and added these dimensions to the SERVQUAL instrument. Data was
collected from three classes at the Australian university.
The authors found that students were satisfied with all eight quality dimensions of the
academic section surveyed, especially with the tangible dimension. However, students
- 25 -

expressed dissatisfaction with the adn1inistrative section, especially the system dimension
(parking facilities and enrolhnent procedures).
Athiyaman's (1997) research was set in a medium-sized university in Australia. Specifically,
pre-enrollment and post-enrollment attitudes were surveyed. The first survey was conducted
with new enrolling students in 1993, and a second survey in 1995, after the sample group of - ~- . - - ---
-:-,",,-~-, .. :::---'""--,-..• -...---.-.
new enrolling students had experienced the university environment.
Eight services and service characteristics were identified to examine students' perception of
university quality, (1) emphasis on teaching students well, (2) availability of staff for student
consultation, (3) library services, (4) computing facilities, (5) recreational facilities, (6) class
sizes (7) level and difficulty of subject content, and (8) student workload.
Athyiaman's (1997) results confirmed that satisfaction was a transaction-specific, short-term,
overall attitude. The author also found that students' level of satisfaction and the perceptions
of quality were a critical influence on behavioural intentions.
Clemes et al. (2001) conducted a research at Lincoln University in New Zealand. The authors
integrated a conceptual model that was based on Gronroo's (1982) perceived service quality
model. Further, the SERFPREF instrument was the frame of reference for the methodology
the authors used to measure perceived service quality. Specifically, seven aspects (tangible
aspects, competence, physical environment, attitude and behaviour, accessibility, reliability,
and personal interaction) were identified under Gronroos' (1982) functional quality and
technical quality dimensions.
Under functional quality, understanding the student, accessibility, and course process were
significant. Under technical quality, the quality of education, the campus facilities, and the
environment were significant. The library and laboratory aspects were insignificant. The
research highlighted that age, course of study and ethnicity were characteristics that could
also impact on the level of perceived service quality.
- 26-

2.6.4 Cross-Cultural Research -: ...•. ~ !
A cross-cultural research study by Ford et al. (1999) compared the perceptions of service
quality of undergraduate business students in New Zealand and the United States. Ford et al.
(1999) argued that the importance-performance paradigm would be the most approptiate
approach when measuring service quality in education.
There were seven dimensions identified, nalnely, programme issues, academic reputation, ,;::-~~",:--::::;>J.:<,
_'~~~-J_"';;'._.:---':_-'
physical aspects/cost, career opportunities, location, time and others such as, university
preferences influenced by family and friends and word-of-mouth communication.
The results of the rankings of the sub-dimensions exhibited cultural differences. Only the
academic reputation (reputable degree, excellent instructor, and excellent academic facility)
dimension was recognised as the most important by both cultural groups; the rankings of the
other sub-dimensions did not correlate across cultures.
The authors found it difficult to generalise service quality across cultures and business sectors,
and therefore, recommended that the sub-dimensions may be appropriate to measure service
quality, but the service quality dimensions should be further developed for the specific culture
and sector under investigation.
The objectives ofMai's (2005) cross-cultural research was to examine students' perceptions
of education quality and identify the main factors affecting their perceptions. The samples
were composed of students in the United States and in the United Kingdom. Mai (2005)
proposed two hypotheses, the first was that the satisfaction level of students in United States
was higher than the students in United Kingdom, the second proposed that there were
associations between key service quality dimensions and overall satisfaction.
The author's questionnaire was based on the SERVQUAL methodology and was designed to
quantify student perceptions. As a result, nineteen independent variables were used to express
the overall level of satisfaction. For example, 'lecturers' expertise in their subject area', and
- 27 -

'lecturers' willingness to provide assistance in academic related areas'.
The results showed that students in the United Kingdom were less satisfied than students in
the United States. The result supported the first hypothesis. Furthelmore, the results also
indicated only general satisfaction anl0ng students (less than very satisfied), and that
'lecturer's interest in the subject matter' rated the highest aITIong all education services.
Pearson's Correlations showed fifteen of seventeen variables were significantly correlated.
'Overall impression of the school' and 'overall impression of the quality of education' showed
a particularly strong influence on the prediction of overall satisfaction. The research also
indicated that overseas students expressed lower levels of overall satisfaction than domestic
students.
The following section will examine the relationships between important constructs such as
customer satisfaction, service quality, price, image, and favourable future behavioural
intentions.
2.7 Constructs Related to Service Quality 2.7.1 The Relationship between Satisfaction and Service Quality Practitioners and marketers tend to use the tenn service quality and satisfaction
interchangeably which has caused some difficulties when distinguishing the theoretical
concepts of the two constructs and clarifying the causal direction of their relationships
(Parasuraman et aI., 1994). The underlying problem was that the service quality and
satisfaction constructs have not been clearly defined and differentiated from each other
(Iacobucci, Grayson and Omstonn, 1994). Parasuraman et ai. (1988) defined service quality
as a form of attitude, a long-run overall evaluation, whereas satisfaction was seen a
transaction-specific measure. On the basis of this definition, perceived service quality was
considered as a global measure, and therefore, the direction of causality was from satisfaction
to service quality (Parasuraman et aI., 1988).
- 28 --

-" '-'- •.. J Cronin and Taylor (1992) disagreed with Parasuraman et al. 's (1988) identification of a causal
directional relationship between satisfaction and service quality. They argued that according
to the satisfaction and attitude literature, attitude was a function of satisfaction, which means
an individual's attitude accumulates to fonn their satisfaction (for example, see Oliver, 1981).
Parasuraman et al. 's (1988) conceptualisation of service quality was not shared by Cronin and
Taylor (1992). These authors argued that service quality was in fact an antecedent of
satisfaction, the direction of causality was from service quality to satisfaction (Cronin and
Taylor, 1992). Cronin and Taylor's (1992) empirical research that was based on four service
industries supported their argument. Further, in regard to the effects of satisfaction and service
quality on purchase intentions, Cronin and Taylor (1992) proved that both constructs would
impact on purchase intentions but that satisfaction exerted a stronger and more consistent
effect on purchase intentions than service quality. They reasoned that customers may not
necessarily buy the highest quality service as convenience, price, or availability may enhance
satisfaction and not affect customers' perceptions of service quality (Cronin and Taylor, 1992).
Parasuraman et al. (1994) and Cronin and Taylor (1994) concurred that the causal directional
relationship between satisfaction and service quality needed further study.
Iacobucci et al. (1994) presented an extensive review of the related literature and suggested
that the constructs were connected in a number of ways: (1) they may be both different
operationalisations of the same construct; (2) they may be orthogonally related, that is, they
may be entirely different constructs; and (3) they may be conceptual cousins, their family '-"0" •• ~_' __ .' ___ O_'-I
connections may be dependent on a number of other considerations.
Fueling to the continuing debate on the relationship between service quality and satisfaction,
an additional concept of satisfaction was fonnulated by Bitner and Hubbert (1994) when they
introduced the concept of encounter satisfaction and advocated that it was distinct from
- 29-
---:: -.-~------'-.
overall satisfaction and service quality.
Further, Sureshchandar et al. (2002) maintained that satisfaction possessed a
multi-dimensional nature and they challenged that satisfaction should be operationalised
along the same dimensions that constituted service quality. The authors determined that
satisfaction and service quality were strongly correlated; however, they concluded that they
were indeed two distinct constructs. ~-r-~,::,-;".:' ~<:~...::-__ .. ~::: .... i.-J/.-..;;.-.,:-........ ~
In endeavouring to clarify the specifications and the nature of the satisfaction and service
quality constructs, Rust and Oliver (1994) proposed that service quality was only one of many
dimensions on which satisfaction was based.
2.7.2 Price Kotler (1972) originally described the main concept of marketing as a transaction in which
there was an exchange of values between two parties. Doyle (1984), Hauser and Urban(1986)
and Zeithaml (1988) agreed that the evaluation of value was a function of monetary and
non-monetary costs, such as sacrifices associated with utilising the product/service and the
benefits or utilities received in exchange. From this viewpoint, value was seen to be both
situational and personal (LeBlanc and Nguyen, 1999). Edvardsson and Gustavsson (1991)
maintained that an individual's value judgment was based on hislher background of social
environment, society reference groups and past experiences.
Tellis and Gaeth (1990) defined the value construct in terms of customers' concerns with the
quality received in comparison to the price paid for the product/service. Similarly, Edvardsson
and Gustavsson (1991) and Zeithaml (1988) suggested that price must be considered when
evaluating service quality. For example, when customers perceive price as being higher than it
was they did not like their consumption experience, and the value assessment was rated as
poor (Kiefer and Kelly, 1995).
- 30-

::..:-> :-::::"'-":~::'-:-;:~:j .~_;"'~-.-...:..r.;..:;.-:~;;,
~'.: - .~.: --. -. -. _.:- "
Rust and Oliver (1994) showed that improving quality, or decreasing price tnay improve the
service quality evaluation. In addition, Cronin et aI., (2000) found that both service quality
and value were significant predictors of satisfaction, and that satisfaction improved favourable
future behavioural intentions.
2.7.3 Image Image was viewed as the sum of beliefs, attitudes, and impressions that a person or group has
an object (Barich and Kotler, 1991). On the organisational level, corporate image was
described as the perceptions of an organisation reflected in the associations held in customers'
memories (Keller, 1993).
Corporate image was seen as a result of an aggregate process by which the customers
compare and contrast the various attributes of organisations (Nguyen and LeBlanc, 2001).
Corporate image was consequently assumed to influence customers' purchase decision,
especially when customers have a lack of knowledge about the services attributes (Andressen
and Lindastad, 1998). Corporate image was believed to create a halo effect on customers'
satisfaction judgments (Andressen and Lindastad, 1998).
It has been proposed that perceptions of image were built through a person's knowledge
system (Andreassen and Lindastad, 1998). The knowledge system aroused from ideas,
feelings, and previous experiences that the person retrieved from memory and transformed
into mental images (Yuille and Catchpole, 1977).
In higher education, it is particularly the case, according to Gavin (as cited by Kotler and Fox,
1995) that:
An institution's actual quality is often less important than its prestige or reputation for quality,
because it is a university's perceived excellence which, in fact, guides the decisions of
- 31 -

prospective students and scholars considering offers of en1ployment.
Several empirical researchers have found that corporate image was an antecedent, or a
mediator of constructs, regarding the evaluation of organisations and the services provided -
perceived quality, perceived value, and loyalty, individually or together with satisfaction
(Nguyen and LeBlanc, 1998; Andressen and Lindastad, 1998). Palacio, Menses and Perez's
(2002) study that related to university image also empirically suppol1ed that corporate image
had a significant relationship with image and student satisfaction.
2.7.4 Favourable Future Behavioural Intentions related to Service Quality and Satisfaction
Zeithaml et aI. (1996) suggested that increasing customer retention or lowering the rate of
customer defection was a major key to the ability of service providers to generate profits.
Some behaviour of customers signal the service provider whether they will remain or defect
(Zeithaml et aI., 1996). In particular, favourable future behavioural intentions signals
customers' willingness to (1) say positive things about the organization; (2) recommend the
organisation to other customers; (3) remain loyal to the organisation (that is, repurchase from
it); (4) increase the volume of purchase; and (5) pay price premiums. Favourable future
behavioural intentions have often been linked to improving service quality (Boulding, et aI.,
1993), increasing the level of satisfaction (Anderson and Sullivan, 1993), and having a
positive effect on value (Zeithaml, 1988).
Boulding et aI.'s (1993) study involved university students and identified strong links between
service quality and favourable future behavioural intentions and their strategic importance to
the university. The favourable future behavioural intentions included praising the university,
planning to pledge to contribute money to the class upon graduation, and planning to
recommend to an employer as a good place from which to recruit. Similarly, Athyiaman's
- 32 -

(1997) empirical study related to Australian university student experiences confilmed that
related service quality and satisfaction related equally well to the favourable future
behavioural intention construct.
2.8 Chapter Summary
This chapter presented the relevant literature regarding the conceptualisation and
r~"'~-,- .. _.;~<" ~~w ........ - ... '
-W'~~----",,:---:-,,-:---:·,("·"i measurelnent of service quality, and the relationship of service quality to related constructs
such a satisfaction, price, image and favourable future behavioural intentions. It also
specifically overviewed the service quality and satisfaction literature in the higher education
sector.
- 33 -

Chapter 3: Conceptual Gaps and Hypotheses
3.1 Introduction
This chapter discusses the conceptual gaps identified in the literature review discussed in
Chapter Two. A conceptual model of student satisfaction is presented, and fifteen hypotheses
proposed in this study are discussed. The proposed hypotheses will also address the following
five research objectives:
(1) To identify the service quality dimensions as perceived by students in the New Zealand
higher education sector.
(2) To determine the effects of the dimensions of perceived service quality and other
influential factors on students' overall satisfaction.
(3) To examine the relationship of students' overall satisfaction with favourable future
behavioural intentions.
(4) To identify the least and most important service quality dimensions as perceived by
students in higher education in New Zealand.
(5) To examine the effects of demographic factors on students' satisfaction and related
constructs.
3.2 Conceptual Gaps
A review of the literature on service quality in higher education has identified five conceptual
gaps. The first gap relates to a lack of published research with regard to students' perceptions
of service quality in New Zealand. Although there is a body of perceived service quality and
satisfaction literature related to higher education, the studies were mostly undertaken in the
United States and Europe, and the findings may not pertain precisely to New Zealand as
service quality is often characterised as industry specific or context specific (Ueltschy and
- 34-

Krampf, 2001; Cronin and Taylor, 1994). In addition, cross-cultural studies on the higher
education sector (see Section 2.6.4) suggest that students studying in different countries have
different perceptions of service quality (Mai, 2005; Ford et aI., 1999).
The second gap relates to a lack of published research in higher education with regard to the
impact of influential factors such as image and price on service quality and satisfaction. This
gap is important because an individual's perception is not determined solely by service quality,
but also influenced by other factors (Zeithaml, 1988).
The third conceptual gap relates to a lack of published research in higher education and
unifying theory regarding the relationship of service quality and satisfaction with favourable
future behavioural intentions. This gap is important as encouraging favourable future
behavoural intentions is perceived by many organisations as the ultimate goal to generate
financial profits (Cronin, Brady, and Hult, 2000; Zeithaml et aI., 1996).
The fourth gap relates to a lack of research pertaining to the service quality dimensions that
students perceive to be more or less important. This gap is important as university
management can be more confident that they are measuring the appropriate aspects of a
university education as perceived by students.
The fifth gap relates to the effect of demographic characteristics on perceptions of service
quality and satisfaction. In the higher education literature, researchers have suggested that the
differences in service encounters are partly influenced by an individual's social and personal
relationships (Clemes et aI., 2001). However, there are few studies that reveal to what degree
these demographic characteristics affect students' overall evaluation of service quality and
satisfaction (Clemes et aI., 2001).
- 35 -

- .. -.·--.-.. ~-·~·_-_I_·~· ..
:-:-:-:-:~::---~-:,-~-_~";'-!_~...z.j.J_"".!'-~-F..J
3.3 Hypotheses Development
A hierarchicaltTIodel has been developed for this study based on Brady and Cronin's (2001)
multi-level structure model (see Figure 3.1). Information obtained from the literature review
presented in Chapter 2 and from infotmation gained in focus group interviews (see Section
4.5) has also has been used to develop the hierarchicallTIodel.
The hierarchical model of service quality presented in Figure 3.1 suggests that students are
expected to form perceptions on each of three primary dimensions; interaction quality,
physical environment quality, and outcome quality in order to form an overall service quality
perception. Students' perceptions of service quality are then assumed to influence both price
and students' overall satisfaction. There are a total of fifteen hypotheses formulated, the first
thirteen hypotheses are formulated to test each path in the model. The fourteenth hypothesis
tests the relative importance of the service quality dimensions, and the last hypothesis is
formulated to examine the differences in students' overall satisfaction based on demographic
factors.
Figure 3.1: Student Satisfaction in Higher Education: A Conceptual Model.
- 36-
}
}
Primaty Dimensions
Proposed Sub-dimensions

• .:.-_-..J_-_-_._-~_:_-_J
- ~ l"". "-~~5""" _,,:...;'._-_~ _" ~;._~
":":.-.... -........... :....:.~-. .:-...::,.:-.~-~
-------- --
- -'-'- -~ ... -, -",,', " .. -..-,
-.--'- - -'- .. .....--, ~ - -',
3.3.1 Hypotheses Relating to Research Objective 1
Cronin and Taylor (1994) suggested that dimensional structures need to be confinned for each
research setting as custolner satisfaction and service quality are found to be culturally
sensitive (Ueltschy and Krampf, 2001; Ford et aI., 1999). Therefore, the proposed set of
sub-dimensions in Figure 3.1 will be specifically analysed for the New Zealand higher
education sector based on a review of the literature, focus group interviews, and exploratory
factor analysis.
Lovelock (1981) suggested that educational institutions were 'people processing' services and
that institutions were highly involved with personal contacts and personal interactions. Thus,
interaction quality involves teacher-student and staff-student relationships and is regarded as
an important construct when measuring perceptions of higher education service quality
(Oldfield and Baron, 2000; Guolla, 1999). Specifically, the proposed set of sub-dimensions
that students evaluate as components of interaction quality are as follows:
(a) Personal interaction (Mai, 2005; Bigne et aI., 2003; Guolla, 1999);
(b) Expertise (DeShields et aI., 2005; Mai, 2005; Sahney and Karunes, 2004);
(c) Attitudes and behaviour (Sahney and Karunes, 2004; Clemes et aI., 2001);
(d) Accessibility (DeShields, et aI., 2005; Clemes et aI., 2001; Athiyaman, 1997); and
(e) Administration staff (Bigne et aI., 2003; Souter and McNeil, 1996).
These sub-dimensions are expected to positively affect interaction quality; hence the first
hypothesis is proposed:
HI: Higher perceptions of each interaction quality sub-dimension (Hla, Hlb, Hlc, HId,
and HIe) will positively affect interaction quality.
Students spend much of their time in contact with physical elements of their educational
experiences, therefore, physical environment aspects is an important construct and must not
be neglected when measuring perceptions of service quality (Oldfield and Baron, 2000;
- 37 -
Cuthbert, 1996). The literature reveals the following common sub-dimensions that are
components of physical environment quality:
(a) Course content (Mustafa and Chiang, 2006; Athyiaman, 1997);
(b) Library facilities (Oldfield and Baron, 2000; Athyiaman, 1997);
(c) Computer room facilities (Mai, 2005; Athyiaman, 1997);
(d) Lecture room facilities (Clemes et aI., 2001; Oldfield and Baron, 2000)
(e) University layouts (Ford et aI., 1999); and
(t) Social factors (Brady and Cronin, 2001).
Higher perceptions of these sub-dimensions are expected to positively affect physical
environment quality; hence the second hypothesis is proposed:
H2: Higher perceptions of each physical environment quality sub-dimension (H2a, H2b,
H2c, H2d, H2e, and H2t) will positively affect physical environment quality.
Outcome quality (teaching and learning outcomes) relates to the consequences and results of
what students' have gained in their educational experiences (Anderson et aI., 2005). Outcome
quality is also considered a crucial construct when measuring perceptions of service quality.
Generally, important outcome gains can be classified as:
(a) General education (Drexler Jr. and Kleinsorge, 2000; Pace and Kur, 1998);
(b) Personal and social (Tam, 2006; Pace and Kur, 1998);
(c) Vocational preparation (DeShields et aI., 2005; Ford et aI., 1999; Pace and Kur, 1998);
(d) Information technology (Drexler and Kleinsorge, 2000; Pace and Kur, 1998); and
(e) Intellectual development (DeShields et aI., 2005; Pace and Kur, 1998).
These sub-dimensions are expected to positively affect outcome quality; hence the third
hypothesis is proposed:
H3: Higher perceptions of each outcome quality sub-dimension (H3a, H3b, H3c, H3d,
and H3e) will positively affect outcome quality.
- 38 -

According to Brady and Cronin (2001), overall perceived service quality is influenced by the
ptimary ditnensions; interaction quality, physical environlnent quality and outcolne quality.
After fonnulating the hypotheses proposing the effects of the sub-dimensions on their
corresponding ptimary dimensions, the following hypotheses have been fonnulated to test the
effects of the ptimary dimensions on overall perceived service quality.
H4: Higher perceptions of the quality of service interactions will positively affect overall
service quality perceptions.
H5: Higher perceptions of the quality of physical environment will positively affect
overall service quality perceptions.
H6: Higher perceptions of the quality of service outcomes will positively affect overall
service quality perceptions.
3.3.2 Hypotheses Relating to Research Objective 2
The discussion in Section 2.7 revealed that satisfaction has a number of antecedents, including
service quality, and that a number of other influential factors are expected to affect
satisfaction.
The literature reviewed in Section 2.7.1 suggests that service quality is an antecedent of
satisfaction and that service quality will have a positive impact on satisfaction. Therefore, the
first hypothesis related to Research Objective Two is the relationship of service quality to
satisfaction:
H7: Higher perceptions of overall service quality will positively affect students' overall
satisfaction.
Price is considered as the monetary value that is expected to be made within the context of
service quality perceptions (Edvardsson and Gustavsson, 1991). Further, ptice is also
expected to influence satisfaction if an inapproptiate ptice is charged (Cronin et aI., 2000).
- 39-

Therefore, the following two hypotheses regarding price are proposed:
--,..-"-- - H8: Higher perceptions of overall service quality will positively affect price judgments.
H9: Higher perceptions of the price judgment will positively affect students' overall
satisfaction.
The literature review indicated that another influential factor that has impacts on service
quality and_satisfaction is image. Two hypotheses have been formulated regarding image:
HI0: Higher perception of image will positively affect students' overall perceptions of
service quality.
H 11: Higher perception of image will positively affect students' overall satisfaction.
3.3.3 Hypotheses Relating to Research Objective 3 Section 2.7.4 discussed some of the behaviours related to service quality and satisfaction.
Students who had satisfactory educational experiences are expected to recommend the
university to others, and this is also an important predictor of attending the same institution in
the future (Boulding el aI., 1993). There are two hypotheses proposed for favourable future
behavioural intentions:
H12: Higher perceptions of satisfaction will positively affect the intention to recommend
the university to others.
H13: Higher perceptions of satisfaction will positively affect the intention to attend the
university in the future.
3.3.4 Hypotheses Relating to Research Objective 4 ,_, _-..r.' .-~-:;.. _ .~ .. ' .. ' _,-: Although several studies have measured students' experiences in higher education institutions
(Oldfield and Baron, 2000; Athyiaman, 1997; Cuthbert 1996 a,b), the comparative importance
of the service quality dimensions identified in these studies has not been clearly determined.
The following hypothesis is therefore proposed:
- 40-

H14: Students will vary in their perceptions of the impol1ance of (a) each of the primary
dimensions, and (b) each of the sub-ditnensions.
3.3.5 Hypotheses Relating to Research Objective 5 Although the demographic factors are expected to influence satisfaction, it is also necessary to
know how they impact on perceptions of service quality (Clemes et aI., 2001). Thus, the
following hypothesis is proposed:
H15a: Students' level of satisfaction and the influential factors, and favourable future
behavioural intentions will differ according to students' demographic characteristics
(age, gender, ethnicity, year in school, and courses of study) . • ~ - --': ."-:. ---=-
H15b: Students' perceptions of the primary dimensions of service quality will differ
according to students' demographic characteristics (age, gender, ethnicity, year in
school, and courses of study).
H 15c: Students' perceptions of the sub-dimensions of service quality will differ according
to students' demographic characteristics (age, gender, ethnicity, year in school, and
courses of study).
3.4 Chapter Summary
Chapter Three identified five conceptual gaps in the literature pertaining to student
satisfaction, s~rvice quality, price, image, and favourable future behavioural intentions in a
higher education setting. A conceptual model was developed, and fifteen testable hypotheses
were stated.
-41-

w ; ••• _ .:~,,, ~
1\ .
:-::':--.- :-..::----..::.:~ .. :,
Chapter 4: Research Design and Methodology
4.1 Introduction
This chapter outlines the research plan and the methodology used to test the fifteen
hypotheses formulated in Section 3.3, and to achieve the five research objectives stated in
Section 3.1. The research plan includes sample derivation, estimating sample size, method of
data collection, questionnaire design, and the data analysis techniques used in this study.
4.2 Sample Derivation
Tertiary education institutions in New Zealand are comprised of Colleges of Education,
Institutes of Technology and Polytechnics, Private Training Establishments, Wanangas, and
Universities. Universities cater for the majority of students attending these tertiary education
institutions (Ministry of Education, 2006). In this study, the perceptions of quality, satisfaction,
price, image, and favourable future behavioural intentions of university students are
specifically examined.
The data was collected at Lincoln University, New Zealand during the period July 18th to
August 10th, 2006. The target population was all 200 and 300 level commerce students, 18
years and older enrolled during the 2006 academic year. The 200 and 300 level commerce
student population during the period the research was conducted was 560. First year students
(100 level) were not surveyed as the majority of these students did not have sufficient
university experience to answer all of the questions in the questionnaire.
- 42-

:-:~=-:::~~,-J
,.-•. c-_-~~_-_-..~;~ , , . I
c ~ - • 1 ~;'~~'_.-'_ '.J:..~~,~J
4.3 Sample Size
The recOlntnended'sample size for factor analysis of observations and vatiable ratio ranges
from three to twenty titnes the variables under scrutiny (Mundfrom, Shaw, and Ke, 2005).
Hair, Anderson, Tatham, and Black (1998) recommended that the minimum sample size
needed to be at least five times as many observations as there are variables to be analysed.
There are 44 variables to be factor analysed in this study, hence a minimum of 220 completed
questionnaires were required.
For multiple regression analysis, Garson (2006) suggests that the population should be greater
than, or equal to, the number of independent variables plus 104 for testing regression
coefficients. Further, Garson (2006) recommends that for testing the R-square, there should be
least 8 times the numbers of independent variables plus 50. In this study, there are 5
independent variables, therefore, at least 109 and 90 completed questionnaires are required
respectively in order to test the regression coefficients and the R-square. However, the exact
number of independent variables to be analysed depends on the results of the factor analysis
(Hair et a!., 1998).
4.4 Method of Data Collection
In this study, a survey questionnaire was the instrument used to collect the data. Two
volunteers distributed the questionnaires in several commerce subjects to students at the
conclusion of lectures. In order to increase the generalisability of the results, prerequisite or
core commerce subjects \vere selected, as these subjects have a broad demographic
representation of students. The subjects selected were Accounting 202, Business Management
204, Marketing 201,301,304, Finance 202,304, and Value and Property Management 312.
- 43 -

The questionnaire set included one research information sheet, one three-page questionnaire,
and one pre-paid envelope. The volunteers explained to students that they could fill out the
questionnaire during their free time and mail back the completed questionnaire using the free
post envelop enclosed. Further, volunteers asked students not to take a questionnaire if they
had been given one in one of their other subjects. A total of 470 questionnaires were
distributed using this process.
4.5 Questionnaire Design
4.5.1 Construct Operationalisation The extensive review of the literature presented in Chapter 2 identified the proposed primary
and sub-dimensions of service quality, as well as the important factors related to students'
perceptions of service quality and satisfaction in higher education. However, in order to
provide additional insights into the proposed dimensions and develop a questionnaire
specifically for New Zealand, it was necessary to conduct focus group interViews.
Focus group research has long been prominent in marketing studies, as market researchers
seek to tap emotional and unconscions motivations (Garson, 2006). In particular, Greenbaum
(1998) suggests that focus group research is most popular with attitude research, such as
service quality evaluations. The use of focus group interviews is also consistent with several
service quality studies (Brady and Cronin, 2001; Parasuraman et aI., 1985).
Greenbaum (1998) recommends that mini focus groups consisting of 4 to 6 participants is the
most efficient size for focus group research, therefore, two mini focus group interviews were
conducted following Greenbaum's (J 998) guidelines. Further, Hair, Bush and Ortinau (2000)
recommended that the focus groups sbould be as homogeneous as possible. Therefore, the
focus group members were gathered in accordance to their year of study at Lincoln University.
The first group consisted offive students studying at least three 200 level subjects. The
- 44-
.J'.--.~-~-"------'--'i
~_"'~."""j-_~"'_'oJ~_"""';";
second focus group consisted of six students studying at least three 300 level subjects.
The dOlnain of the construct was specified to the interviewees at the start of the focus group
interviews, as recommended by Churchill (1979). Students were asked to explain all of the
factors that contributed to their judgements of university experiences. They were asked to
consider three aspects; their lectures, the university environment, and their leatning outcomes
aspects. After these concepts, the students were asked to consider the most important factors
of each of the three aspects.
The information gathered in the focus group interviews was recorded and transcribed. The
information and the findings from the literature review were used as the basis for the item
generation in the questionnaire development stage. The final questionnaire consisted of 62
items formulated to measure all of the constructs discussed in Chapter 2 (see Figure 3.1).
4.5.2 Design and Layout of the Survey Instrument The questionnaire is divided into five sections. Sections A, Band C contain the Interaction
Quality, Physical Environment Quality, and Outcome Quality items. The items are grouped in
accordance with each of their pertaining primary dimensions. Section D contains the items on
Service Quality, Satisfaction, Price, and Image. Section E contains demographic and
favourable future behavioural intention items.
Performance-only items are included in the questionnaire, as numerous studies have
demonstrated the superiority of performance-only over difference score measures (Zeithaml et
aI., 1996, Cronin and Taylor, 1994). Moreover, all the items are positively worded, as
recommended by Parasuraman et aI. (1991) and Carman (1990). This study focused on
students' overall academic satisfaction, therefore, students were requested to evaluate their
overall experiences at Lincoln University, and not to relate their response to any particular
subject or lecturer.
- 45 -

Molenaar (1982) recolnlnended that for items used in questionnaire, the optiInal nUlnber of
response categories was seven plus or minus two. A seven-point Likert-type scale was used to
Ineasure the performance-only itelns used in the questionnaire developed for this study. Only
the extreme end-points were verbally labelled, from 1 representing Strongly Agree to 7
representing Strongly Disagree, no verbal labels were used for scale points 2 to 6, as Andrews
(1984) suggested that labelling all of the response categories can result in inaccurate
responses. One NI A response category representing not applicable was included for all
performance-only items as this reduces central tendency bias (Smith, 1995) and improves the
likelihood of eliciting accurate and valid responses (Coulthard, 2004).
Two performance-only items in Section D were labeled differently, one item measuring
Satisfaction ranged from 1 representing Very Dissatisfied to 7 representing Very Satisfied, and
one item measuring Service Quality ranged from 1 representing Poor to 7 representing
Excellent. The three items measuring favourable future behavioural intentions in Section E
are labelled from Highly Unlikely (1) to Highly Likely (7). In Section E, the demographic
factors are selected by ticking the appropriate box.
The Service Quality and Satisfaction constructs were measured using three items each, as
combining three or more items reduces measurement error and improves reliability (Churchill,
1979). The Intention to Recommend construct was measured using a single item, however,
Hair et al. (1998) cautioned that some degree of measurement error may occur with single
item measures.
4.5.3 Pre-testing Procedures As the questionnaire was developed specifically for this research, a pre-test procedure was
used to improve the reliability and validity of the instrument. In the pre-test procedure, thirty
200 level and 300 level students studying a commerce degree were requested to read the
- 46-

<:.1:..-_":_'
. " ---~. - ~ ~~ ", r'
questiolllaire, respond to the statements, and comlnent on any ambiguous or unclear
statements that were difficult to answer. Some minor wording modifications to the
questionnaire were made as a result of this process. The final version of the questionnaire is in
Appendix 2.
4.6 Data Analysis Techniques
The three statistical techniques used in this study are exploratory factor analysis, multiple
regression analysis, and analysis of variance. Exploratory factor analysis is used to examine
the underlying factors that make-up the sub-dimensions, multiple regression analysis is used
to test the conceptual model, and analysis of variance is used to compare the results that are
based on demographic factors .
4.6.1 Factor Analysis Factor analysis is a branch of multivariate analysis that is concerned with the internal
relationships of a set of variables (Stewart, 1981). Factor analysis has three general functions:
(1) minimising the number of variables while the amount ofinforrnation in the analysis is
maximised; (2) searching qualitative and quantitative data distinctions when the data is too
large; (3) testing hypotheses about the number of distinctions or factors underlying a set of
data (Stewart, 1981). Factor analysis generates a table in which the rows are the observed raw
indicator variables and the columns are the factors or latent variables which explain as much
of the variance in the indicating variables as possible (Garson, 2006).
The following sections overview different types of factor analysis, the assumptions of factor
analysis, and appropriateness of factoring a correlation matrix, factor rotation, and
interpretation of resulting factors.
- 47 -
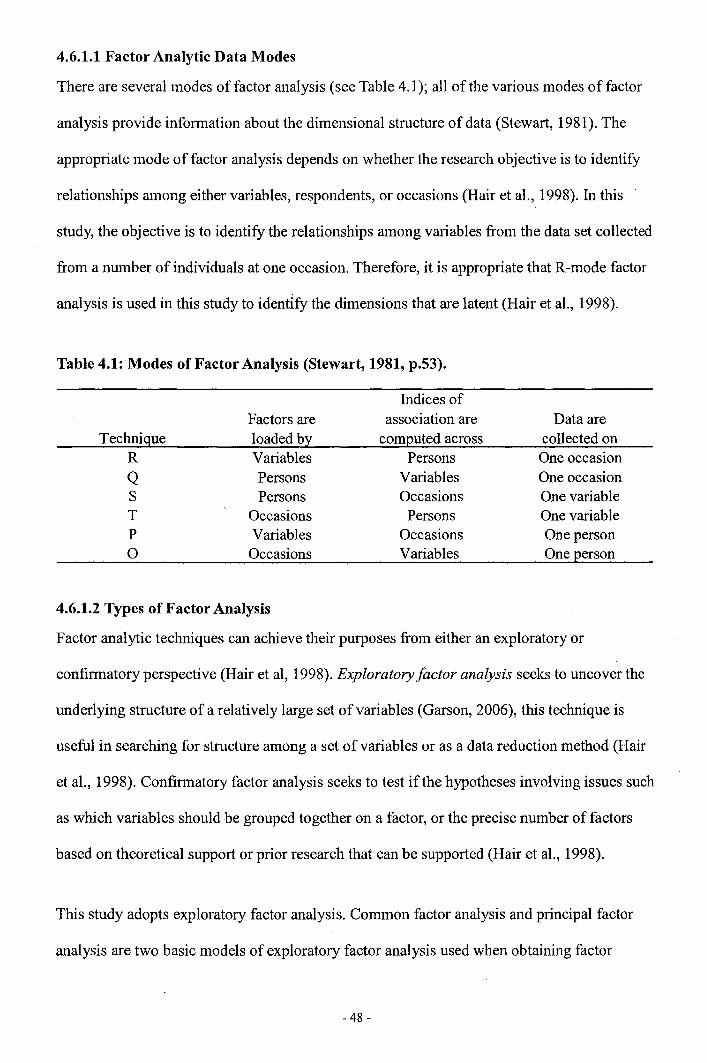
4.6.1.1 Factor Analytic Data Modes
There are severallnodes of factor analysis (see Table 4.1); all of the various modes of factor
analysis provide infolmation about the dimensional structure of data (Stewart, 1981). The
appropriate mode of factor analysis depends on whether the research objective is to identify
relationships among either variables, respondents, or occasions (Hair et aI., 1998). In this .
study, the objective is to identify the relationships among variables from the data set collected
from a number of individuals at one occasion. Therefore, it is appropriate that R-mode factor ~T .. -·'-_"';-_-·'· P:-'~~-:~~~":;'~"';."'-.
analysis is used in this study to identify the dimensions that are latent (Hair et aI., 1998).
Table 4.1: Modes of Factor Analysis (Stewart, 1981, p.53).
Indices of Factors are association are Data are
Technique loaded by computed across collected on R Variables Persons One occasion Q Persons Variables One occasion S Persons Occasions One variable T Occasions Persons One variable P Variables Occasions One person 0 Occasions Variables One person
4.6.1.2 Types of Factor Analysis
Factor analytic techniques can achieve their purposes from either an exploratory or
confirmatory perspective (Hair et aI, 1998). Exploratory factor analysis seeks to uncover the
underlying structure of a relatively large set of variables (Garson, 2006), this technique is
useful in searching for structure among a set of variables or as a data reduction method (Hair
et aI., 1998). Confirmatory factor analysis seeks to test if the hypotheses involving issues such
as which variables should be grouped together on a factor, or the preCise number of factors
based on theoretical support or prior research that can be supported (Hair et aI., 1998).
This study adopts exploratory factor analysis. Common factor analysis and principal factor
analysis are two basic models of exploratory factor analysis used when obtaining factor
- 48 -

solutions (Hair et aI., 1998). The selection of the appropriate tTIodel is based on two criteria (l)
the objectives of the factor analysis, and (2) the amount of prior knowledge about the variance
in the variables (Hair et aI., 1998).
Common/actor analysis is used when the primary objective is to identify the latent
dimensions or constructs represented in the original variables, and the researcher has little
knowledge about the amount of specific and error variance (Hair et aI., 1998). Common factor :..:'"'"'~~ ..::_ ~:..-. t-:.r-_ -_.-~ ~ ;_"'':'~_''_L_''.,.,~ ___ ... ....itJ_:'-'
analysis is a correlation-focused approach seeking to reproduce the intercorrelation among the
variables (Garson, 2006). In contrast, component/actor analysis is appropriate when the
primary concern is about prediction, or the minimum number of factors needed to account for
the maximum portion of the variance represented in the original set of variables, and when
prior knowledge suggests that specific and error variance represents a relatively small
proportion of the total variance (Hair et aI., 1998). Component factor analysis is a
variance-focused approach seeking to reproduce both the total variable variance with all
components and to reproduce the correlations (Garson, 2006).
Common factor analysis is considered more problematic and complicated, and as a result, the
use of component factor analysis has become much more widespread (Hair et aI., 1998). In
this study, component factor analysis was considered the most appropriate method to analyse
the data.
4.6.1.3 Assumptions for Factor Analysis
Regardless of the type of factor analysis adopted, there are several critical conceptual and
statistical assumptions underlying factor analysis (Hair et aI., 1998). The assumptions are:
No selection bias/proper specification. Factor analysis is a technique of exploring data whose
structure is unknown; the technique has no means of determining the appropriateness of data
other than the correlation among variables (Hair et aI., 1998). The exclusion of relevant
- 49-

variables and the inclusion of inoelevant variables in the cOlTelation matrix being factored will
affect, often substantially, the factors which are uncovered (Garson, 2006). Therefore,
researchers must ensure that the observed patterns are conceptually valid and appropriate to
study using factor analysis (Hair et aI., 1998).
Linearity. Factor analysis is a linear procedure, the smaller the sample size, the more
important it is to screen the data for linearity (Garson, 2006).
Normality. Screening data for nonnality is necessary if a statistical test is applied to the
significance of the factors (Hair, et aI., 1998). However, as factor analysis is used to identify
interrelated sets of variables, some degree of multicollinearity is desirable (Hair, et aI., 1998).
Homoscedasticity. Factor analysis also assumes homoscedasticity to the extent that they
diminish the observed correlations (Hair et aI., 1998).
However, if the data matrix has sufficient correlations to justify the application of factor
analysis, the statistical assumptions of linearity, normality, and homoscedasticity do not have
to be met (Hair et aI., 1998). The approaches to justify sufficient correlations for factor
analysis are discussed in the following section.
4.6.1.4 Tests for Determining Appropriateness of Factor Analysis
Hair et aI., (1998) suggested that there are several useful methods for determining whether a
factor analysis should be applied to a s~t of data. The methods are: (1) examination of the
correlation matrix; (2) inspection of the anti-image correlation matrix; (3) Barlett's test of
sphericity; and (4) The Kaiser-Meyer-Olkin measure of sampling adequacy.
Examination of the correlation matrix is the simplest method for determining appropriateness
of a matrix for factoring. If visual inspection reveals most of substantial number of
- 50-

correlations greater than .30, then factor analysis is appropriate (Hair et aI., 1998), if the
correlation coefficients are too sIn all throughout the matrix, factoring Inaybe inappropriate
(Stewart, 1981).
Inspection of anti-image correlation matrix. Another procedure for detennining the
appropriateness of a matrix for factoring is an inspection of the off-diagonal eleinents of the
anti-image covariance or correlation Inatrix (Stewart, 1981). An anti-image correlation matrix
is the negative value of the partial correlations (Hair et aI., 1998); the correlation matrix
should be near diagonal if the matrix is appropriate for factoring, if the anti-image matrix has
many nonzero off-diagonal entries, the correlation matrix is not appropriate for factoring
(Stewart, 1981).
Barlett s Test of Sphericity is a widely programmed statistical test of appropriateness of a
matrix for factoring; it provides the statistical probability that the correlation matrix has
significant correlations among at least some of the variables (Hair et aI., 1998). Barlett's Test
of Sphericity is computed by the fonnula:
where N is the sample size, P is the number of variables, and \R\ is the detenninant of the correlation matrix
Equation 4.1: Barlett's Test Sphericity.
The hypothesis tested is that the correlation matrix came from a population of variables that
are independent. Rejection of the hypothesis is an indication that the data are appropriate for
factor analysis (Stewart, 1981).
- 51 -

Kaiser-Oeyor-Olkin measure of sample adequacy, MSA. The MSA provides the extent which
the variables belong together are thus appropriate for factor analysis (Stewart, 1981). There is
a MSA statistic for each individual variable and their sum is the overall statistic (Garson,
2006), the formula for overall MSA is: where q2 jk is the square of the off-diagonal elements of
the anti-itnage correlation matrix, and ,.2 jk is the square of the off-diagonal elelnents of
the original correlations
Equation 4.2: Overall Measure of Sample Adequacy.
The index ranges from 0 to 1.0, reaching 1 when each variable is perfectly predicted without
error by other variables (Hair et aI., 1998). Kaiser and Rice (as cited by Stewart, 1981) gave
the following calibration of the MSA: .90+ (marvellous); .80+ (meritorious); .70+
(middling); .60+ (mediocre); .50+ (miserable); below .50 (unacceptable).
4.6.1.5 Factor Extraction in Principal Components Analysis
When a large set of variables is factored, the initial procedure is to extract the combinations of
variables explaining the greatest amount of variance and then proceed to combinations that
account for smaller amounts of variance (Hair et aI., 1998). Stewart (1981) suggested that
there is a well established body of literature pertaining to factor analysis regarding in
determining how many factors to extract, and the criteria for ceasing to extract. Common
criteria are (l) Latent Root Criterion; and (2) Scree Plot.
Latent root criterion is the most commonly used technique. The rational is that any individual
factor should account for the variance of at least a single variable if it is to be retained for
interpretation; each variable contributes a value of 1 to the total eigenvalue (Hair et aI., 1998).
Only the factors having latent roots or eigenvalues greater than 1 are considered significant,
otherwise they should be disregarded (Stewart, 1981). This method is most reliable when the
- 52 -

number of variables in the factor analysis is between 20 and 50 (Hair et aI., 1998).
Scree test criterion is derived by plotting the latent roots against the nUlnber of factors in their
order of extraction, and the shape of the resulting curve is used to evaluate the cutoff point
(Hair et aI., 1998). The procedure is explained by Stewart (1981):
"A straight edge is laid across the bottom portion of the roots to see where they fonn an
approximately straight line. The point where the factors curve above the straight line gives r ___ ~ •• ' __ .:-.. ..-_~...; ___ ""_:~
f...I"....I' .. ,.J.'-':._ ...... v..:.."'-':"
the number of factors, the last factor being the one whose eigenvalue immediately proceeds
the straight line" (p.58).
4.6.1.6 Factor Rotation
The selection of the final factors involves interpreting the computed factor matrix. The factor
matrix contains factor loadings for each variable on each factor (Hair et aI., 1998). Factor
loadings indicate the degree of correspondence between the variable and the factor, with
higher loadings making the variable representative of variable loadings (Hair et aI., 1998).
Computation of factor matrix can be unrotated, orthogonally rotated, and obliquely rotated.
An unrotated factor matrix is computed to assist in obtaining a preliminary indication of the
number of factors to extract (Hair et aI., 1998). The solution maximises the sum of squared
factor loadings, efficiently creates a set of factors which explains as much of the variance in
the original variables as possible (Garson, 2006). However, an unrotated factor matrix may
not provide a meaningful pattern of variable loadings as they tend to load on multiple factors
(Garson, 2006), computation of factor rotations are desired to improve the interpretation by
reducing the ambiguity in the unrotated factor solution (Hair et aI., 1998).
Orthogonal rotations are the simplest case of rotation in which axes are maintained at 90
degrees. Three orthogonal rotation methods include VARIMAX, and QUARMAX.
- 53 -

i ._\
~ _-. ~-_-"_T.-~-.->'~ __ "_;,_-•• :.:..-:-,--,--1
VARIMAX maximises the variance of the squared loadings of a factor on all the variables in a
factor matrix, this process has the effect of differentiating the original variable by extracted
factor (Garson, 2006). When the con-elation is close to + 1 or -1, it can be interpreted as a high
positive or negative association between the variable and the factor; when the con-elation is
closest to 0, it indicates a lack of association (Hair et aI., 1998). QUARMAX is an alternative
orthogonal method, it focuses on rotating the initial factor so that a variable loads high on one
factor and as low as possible on all other factors (Hair et aI., 1998).
Oblique rotations are similar to orthogonal rotations, except that oblique rotations allow
con-elated factors instead of maintaining independence between the rotated factors (Hair et aI.,
1998). Two commonly used oblique methods include OBLIMIN and PROMAX.
OBLIMIN is the standard method when seeking a non-orthogonal solution. Perfonning
OBLIMIN will result in higher eigenvalues but diminished interpretability of the factors
(Garson, 2006). PROMAX is similar to OBLIMIN but computationally faster than OBLIMIN
and therefore is sometimes used (Garson, 2006). '-j~
The use of the orthogonal rotation approach is more widespread in the marketing literature.
Nevertheless, very few factors are uncon-elated in reality (Hair et aI., 1998), a strong
likelihood of con-elated factors and hierarchical factor solutions are intuitively attractive and
theoretically justified in many marketing applications (Stewart, 1981). Stewart (1981)
suggested that both orthogonal and oblique rotation should be conducted. Therefore, in this
study, a VARIMAX orthogonal rotation and an OBLIMIN oblique rotation were perfonned.
- 54-

_ -_ • .' _~_- ~ r~ __ _
__ • ~'_1 , _ :.-_ .'.'
" ""
4.6.1.7 Interpretation of Factors
When interpreting factors, decisions must be Inade regarding which factor loadings are worth
consideIing. The significance of factor loadings is dependent on the sample size (see Table
4.1), in general, the larger the absolute size of the factor loading, the more iInportant the
loading in interpreting the factor matIix (Hair et aI., 1998). Hair et ai. (1998, p.112) suggested
three cIiteIia for the significance of factor loadings:
"(1) The larger the sample size, the smaller the loading to be considered significant; (2) the
larger the number ofvaIiables being analysed, the smaller the loading to be considered
significant; and (3) the larger the number of factors, the larger the size of the loadings on
later factors to be considered significant for interpretation".
Table 4.2: Guidelines for identifying significant factor loadings based on sample size (Hair et aI., 1998, p.112).
Sample Size Sample Size Factor Needed for Factor Needed for
Loading Signficance Loading Signficance 0.30 350 0.55 100 0.35 250 0.60 85 0.40 200 0.65 70 0.45 150 0.70 60 0.50 120 0.75 50
* Based on a .05 significance level and power level of 80 percent, and standard errors assumed to be twice those of conventional correlation coefficients.
Most factor solutions does not result in a simple structure where the single highest loading is
significant for each vaIiable, hence many vaIiables have several moderate-size loadings (Hair
et aI., 1998). The factor solution is obtained when all significant loadings for vaIiables load on
a factor (Hair et aI., 1998). By examining all the underlined vaIiables for a particular factor,
the researcher needs to assign a name or label to a factor that accurately reflects the vaIiables
loading on that factor (Hair et aI., 1998).
- 55 -
4.6.2 Summated Scale The results of an exploratory factor analysis are often used to replace the original set of
vatiables with an entirely new, smaller set of vatiables (Hair et aI., 1998). In order to reduce
the reliance on a single response and measurement error3, Hair et aI. (1998) recommends
using a summated scale as a replacement vatiable.
A sUlnmated scale is formed by combining all the vatiable loadings highly or a factor and the
sum or the average score of the vatiables (Hair et aI., 1998). As the summated scale will
represent the multiple aspects of concept in a single measure, construction of summated scale
must maintain content validity, dimensionality and reliability (Hair et aI., 1998).
4.6.2.1 Content Validity
Content validity4 considers practical and theoretical issues to ensure that the summated scales
are assessing the correspondence between individual items and the concept (Hair et aI., 1998).
A display of content validity indicates that the items are adequate and are representative of the
concept they are intended to measure (Churchill, 1979).
4.6.2.2 Dimensionality
The assumption for creating a summated scale is that items are unidimensional, meaning that
they are strongly associated with each other and represent a single concept. The test of .
unidimensiona1ity is that each summated scale should consist of items loading on a single
factor (Hair et aI., 1998).
4.6.2.3 Reliability
Reliability is an assessment of the degree of consistency between multiple measurements of
variables. One reliability test is internal consistency, the rational of internal consistency is that
the individual items or indicators of the scale should all be measuring the same construct and
3 Measurement error is the degree to which the observed values are not representative of the "true" values due to any number of reasons. 4 Also known as face validity
- 56-

thus be highly correlated (Hair et aI., 1998). Cronbach's alpha (1951) has been one of Inost
widely used Ineasure to test scale reliability. Churchill (1979) recommends that an alpha of
0.60 or greater is adequate for a newly developed questionnaire.
4.6.3 Multiple Regression Analysis
After perfonning the factor analysis and creating summated scales, the proposed
sub-dimensions may be confinned and used for subsequent statistical analyses. In this study,
thirteen hypotheses were fonnulated (see Chapter 3) that relate to examining the relationships
between the constructs. According to Hair et ai. (1998), when analysing the relationships
between a single dependent variable and several independent variables, multiple regression
analysis is an appropriate statistical technique.
Multiple regression analysis provides a means of objectively assessing the degree and
character of the relationship between dependent and independent variables by fonning the
predictive powers of independent variables (Hair et aI., 1998). The independent variables, in
addition to their predictive powers, may also be considered for their individual contribution to
the variate and its predictions. Furthennore, the beta coefficients of the independent variables
can also be used to detennine its derived importance to the dependent variable when
compared with other independent variables in the same model (Chu, 2002).
To interpret the regression variate, Hair et ai. (1998) recommended that the most direct
method is to detennine the relative importance of each independent variable in the prediction
of the dependent measure.
Multiple regression takes the fonn y = c + biX I + b2X2 + ... + bnXn + e. The y is the true
dependent; the b I , b2, ... ,bn are the regression coefficients, representing the amount the
dependent variable y changes when the corresponding independent changes 1 unit; the c is the
constant, where the regression line intercepts the y axis; and the e is the error tenn reflected in
- 57 -
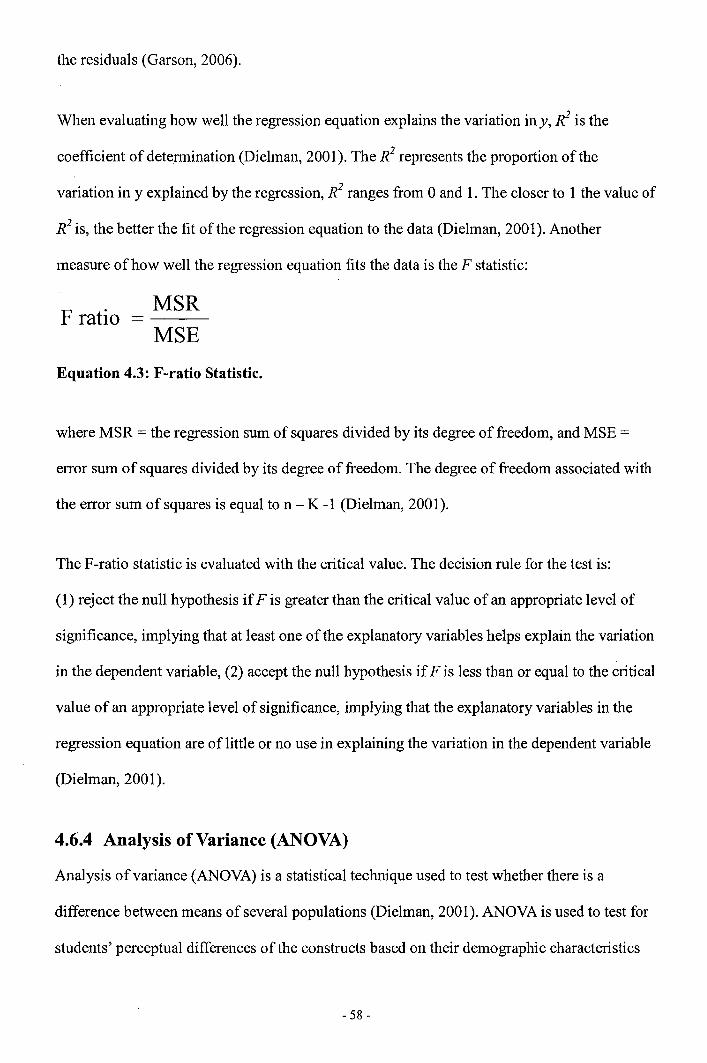
'-"=~'-'---,~:"I ,I
J ,
..... - - ---~,-".,-,->. '-"'-1
.-:-. - ,~ >-- - ~ - ~ - ,
the residuals (Garson, 2006).
When evaluating how well the regression equation explains the variation iny, R2 is the
coefficient of detennination (Diehnan, 2001). The R2 represents the propol1ion of the
variation in y explained by the regression, R2 ranges from 0 and 1. The closer to 1 the value of
R2 is, the better the fit of the regression equation to the data (Dielman, 2001). Another
measure of how well the regression equation fits the data is the F statistic:
F ratio MSR MSE
Equation 4.3: F-ratio Statistic.
where MSR = the regression sum of squares divided by its degree of freedom, and MSE =
error sum of squares divided by its degree of freedom. The degree of freedom associated with
the error sum of squares is equal to n - K -1 (Dielman, 2001).
The F-ratio statistic is evaluated with the critical value. The decision rule for the test is:
(1) reject the null hypothesis if F is greater than the critical value of an appropriate level of
significance, implying that at least one of the explanatory variables helps explain the variation
in the dependent variable, (2) accept the null hypothesis if F is less than or equal to the critical
value of an appropriate level of significance, implying that the explanatory variables in the
regression equation are of little or no use in explaining the variation in the dependent variable
(Dielman, 2001).
4.6.4 Analysis of Variance (ANOVA)
Analysis of variance (ANOVA) is a statistical technique used to test whether there is a
difference between means of several populations (Dielman, 2001). ANOVA is used to test for
students' perceptual differences of the constructs based on their demographic characteristics
- 58 -

_____ • r 0 _._
p-- - ~ ---..- "----.>-~·I
.-~.,...-... -•. .,..".--..;.-.~~~
in this study. The logic of an ANOVA test is cOlnparing the estimates of the variance of the
respondents within the groups and the estitnates of the valiance of the respondents between
the groups (Hair et aI., 1998). The key statistic used to conduct the test is F -statistic of
difference of group lneans:
F = Mean Square within groups Mean Square between groups
=
Equation 4.4: F Statistic for ANOVA.
MSB MSw
To detennine if the F-statistic is sufficiently large to support rejection of null hypotheses
(when means of all groups are equal), the F-statistic must be greater than the critical value
froln the F distribution (F erit) based on the numeratorS and denominator6 degrees of freedom,
which implies that the means across all groups are not all equal (Hair et aI., 1998).
4.6.5 Assumptions for Regression Analysis and Analysis of Variance The following assumptions are tested prior to applying the regression analysis and analysis of
variance used in this study.
4.6.5.1 Outliers
Outliers are observations with a unique combination of characteristics identifiable as
distinctly different from the other observations (Hair et aI., 1998). Outliers have large residual
values, and are far from the rest of the observations (Hair et la., 1998). The presence of an
outlier may have large effects on the estimated regression line, and can at times produce
confusing results and mask important infonnation that could otherwise be obtained from the
regression (Dielman, 2001).
Outliers can be identified by examining a study of the standardised residuals, a rule of thumb
is that outliers are points whose standarised residuals are greater than 3 (Maddala,.2001).
5 Numerator degree of freedom is the number of populatio.ns minus one 6 Denominator degree of freedom is the total sample size minus the number of the populations
- 59-

Outliers should be studied carefully to see whether deletion is an appropriate option (Diehnan,
2001). Outliers should be removed only if there is reason to believe that other variables not in
the model explain why the outlier observations are unusual (Garson, 2006).
4.6.5.2 Multicollinearity
In the multiple regression analysis, it is not desirable for strong relationships to exist among
explanatory variables (Dielman, 2001). When the explanatory variables are highly correlated, :::_.".. __ ':, __ k,,-r_"-_'_-_~_ •
J..s_~~';...A='::-~':~.r:..: .. ::"_ ..
the multicollearity problem occurs (Dielman, 2001), and it becomes difficult to disentangle
the separate effects of each of the explanatory variables on the dependent variable (Maddala,
2001).
Further, Hill, Griffins, and Judge (2001) comment that the presence of a high degree of
multicollinearity will result in the following problems: (1) the regression coefficient cannot be
defined when the explanatory variables have one or more exact relationships 7; (2) the variance,
standard errors, and covariances of the regression coefficient will be disproportionately large
when the explanatory variables have nearly exact relationships; (3) when the standard errors
are large, the usual t-test may lead to the confusion that the parameter estimates are not
significantly different fromzero, and excluded the possibility of high R2 or F-values that
indicates significant explanatory power; (4) dropping or adding variables causes large changes
in the estimates of the coefficients of other variables. However, Maddala (2001) stated that as
long as there is enough variation in the explanatory variables and the variance of the error
term is sufficiently small, high correlation among exploratory variables does not necessarily
create a problem.
To detect whether multicollinearity is considered a serious problem, Maddala (2001) suggests
that when the R2 is very high, and F-ratio is also highly significant, but there are insignificant
7 The exact relationship is when the correlation coefficients are ± 1
- 60-

"_-_ -.- I
:.. •. ~--.-.----... - .... --,-• ..r;
individual t-ratios, then multicollinearity has a significant effect on the regression equations.
Dielman (2001) recomlnended computing the variance inflation factor (VIF) which Ineasures
the strength of the relationship between one explanatory and other explanatory variables in the
regression. The VIF is computed by performing the regression of J0 on the remaining
explanatory variables and the coefficient of detennination from this regression R2j. The VIF
for the variable J0 is
1 VIFj= ---I- R 2 j
Equation 4.5: Variance Inflation Factor.
If there is no relationship, then R2j =0.0 and VIFj=I, and VIFj increases as R2j increases. If the
individual VIFj values are large (greater than 10), or the average of the VIFj greater than 10,
then multicollinearity may be influencing the least-squares estimates of the regression
coefficients (Dielman, 2001). Moreover, the VIFvalues should also be evaluated relative to
the overall fit of the model, that is, when the VIFvalues are less than II (l_R2) where R2is the
coefficient of the determination for the model with all explanatory variables included, it .
indicates that the explanatory variables are more strongly related to the dependent variables
than they are to each other, hence multicollinearity is not a serious problem (Dielman, 2001).
The condition indices in SPSS is an altenlative method of assessing excessive collinearity in
the data, it is the square roots of the ratio of the largest eigenvalues to each other eigenvalue.
A condition index over 30 suggests serious collinearity problems and an index over 15
indicates possible collinearity problems (Garson, 2006).
4.6.5.3 Linearity
The linearity of the relationship between the dependent and independent variable represents
the degree to which the change in the dependent variable is associated with the independent
- 61 -

variable, where the regression coefficient of independent variables is constant across the range
of values (Hair et aI., 1998).
The concept of correlation is based on a linear relationship (Hair et aI., 1998), the assulnption
of linearity can be checked visually through residual plots (Dielman, 2001). In multiple
regression with more than one independent variable, an examination of the residuals shows
the combined effects of all predictor variables (Hair et aI., 1998).
In a multiple regression, the scatter plot of the standardised residuals versus the fitted values
provides an overall picture, while the plots of the standardised residuals versus each
explanatory variable ~ay help identify any violations specifically related to an individual
explanatory variable (Dielman, 2001).
4.6.5.4 Error term Normality
Errors, represented by the residuals, should be normally distributed for each set of values of
variables (Garson, 2006). The simplest diagnostic for the set of predictor variables in the
equation is a histogram of residuals with a visual check for a distribution approximating the
normal distribution (Hair et aI, 1998).
However, a normality probability plot is a better method for assessing normality (Hair et aI.,
1998). When the plot of the normal-scores8 (cumulative probabilities) and the data is
approximately a straight line, the normality appears reasonable, or otherwise the plot will
show curvature (Dielman, 2001).
4.6.5.5 Error Term Independence
Multiple regression analysis assumes that the error terms are independent (Dielman, 2001). In
a residual plot, the pattern should appear random and similar to null plots of residuals (Hair et
aI., 1998). If the independence assumption is violated, the residual plots will have a consistent
8 Normal scores are numbers we expect to see from a sample from a normal distribution, so the plots of the two sets of data have to be similar (Dielman, 2001).
- 62 -

- - .. - . ~ - . J...=':' • .. :." .• r ~.,,:._;_ ''''~
:-~:&-:.o-:.,:-==_::",: ,>:~.
::;..-~~---!~
pattern (Hair et aI., 1998).
A well-known and widely used test to diagnosis enor tenn independence is Durbin-Watson
test (Dielman, 2001). The Durbin-Watson statistic is computed by first using least squares to
estitnate the regression equation and then by computing the residuals:
where yi represents one of the saInple y values and Yi is the corresponding predicted y
value. The residuals are used to compute the Durbin-Watson statistic, d:
d
i=1
Equation 4.6: Durbin-Watson Statistic.
The value of d ranges from 0 to 4, value closes to 0 indicates extreme positive autoconelation,
value closes to 4 indicates extreme negative autocorrelation, and value closes to 2 indicates no
serial autocorrelation (Garson, 2006). The decision rule for Durbin-Watson test is: (l) reject
the null hypothesis if d < dL, (2) accept the null hypothesis if d > du, and (3) inconclusive if dL
< d < du (Dielman, 2001).
4.6.5.6 Error Term Homoscedasticity
The assUmption of homoscedasticity states that the error term, ei, have constant variances (52
(Dielman, 2001). However, the presence of unequal variance (heteroscedascticity) is one of
the most common violations of multiple regression assumptions (Hair et aI., 1998).
Ina residual plot of ei versus an exploratory variable x, the residuals should appear scattered
randomly about the zero line with no differences in the amount of variation in the residuals
regardless of the value ofx (Dielman, 2001). In the case ofheterocedascticity, there appears
to be a difference in violation, and is identified by a triangular-shaped pattern in the residual
plot (Hair et aI., 1998).
- 63 -

When heteroscedascticity is present, the use of least-squares has two n1ajor drawbacks: (1) the
estimates. of the regression coefficient are no longer Ininimuln variance estin1ates, and (2) the
estimates of the standard enors of the coefficients are biased (Diehnan, 2001).
4.7 Chapter Summary
This chapter has outlined the research plan and methodology used to test the fifteen
hypotheses, stated in Section 3.3. In particular, the sample size selection, data collection
method and questionnaire design were detailed. The statistical methodology used in this
including factor analyses, multiple regression analysis, and analysis of variance and their
assumptions were also explained.
- 64-

:-.-~-..-:-~ -_._--- .- ~---~
Chapter 5: Results and Discussion
5.1 Introduction
This chapter presents the results and discusses the findings of the study. The data set is
examined to ensure its appropriateness for factor analysis. The statistical assumptions of
multiple regression and analysis of variance are tested to ensure the representativeness of the
results. The results of the factor analysis, multiple regression analysis, and analysis of
variance are presented, and the 15 hypotheses tested. The results are discussed in tenns of
their relation to each of the pertaining research objectives.
5.2 Sample and Response Rates
Of the 470 questionnaires distributed, 228 were returned within the two-week response period.
Five of the questionnaires were incomplete, or were not suitable for use in this study. This
resulted in a total of 223 completed questionnaires, and a 47.44 percent usable response rate.
The usable responses were above the minimum sample size of 220 as suggested by Hair et al.
(1998). Therefore, the sample size was deemed to be acceptable for the purposes of this
research.
5.2.1 Non-response Bias
5.2.1.1 Early/Late Responses
The generalisability of the results can be affected by non-response bias (Churchill, 1979).
Annstrong and Overton (1977) suggested an extrapolation method for estimating
non-response bias. Extrapolation method is based on the assumption that a subject who has
responded less readily9 is more like a non-respondent.
9 Less readily was defined as answering later, or as requiring more prodding to answer (Armstrong & Overton, 1977)
- 65 -

In this study, 97 respondents sent their questionnaires back during first week and 126
. :- i respondents sent them back during second week. Firstly, the mean scores for the sum of
sub-dimensions, the Service Quality itelns, the Satisfaction itelns, the Itnage items, the Price
items, the Future Attendance items and Recommendation item of the two groups were
computed. Secondly, independent t-tests (as shown in Table 5.1) were conducted to determine
if the group means were statistically significant. The equal variance significance values for all
constructs were all greater than 0.05 significance level, indicating that the two groups have
equal variances. The equal variance that means significance values were also greater than 0.05,
indicating that the two groups have equallneans. Therefore, the researcher concluded that
there was no evidence of non-response bias in this study.
Table 5.1: Independent Sample Test for Non-Response Bias.
Equal Variance Assumed Levene's Test for t-test for Equality of Means
Equality of Variances Significant at 5% level
Construct F Sig. t df Sig. Mean Std. Error (2-tailed) Difference Difference
Interaction Quality 0.577 0.448 -0.332 221 0.740 -0.052 0.156 Physical Environment Quality 0.001 0.974 -0.656 221 0.512 -0.101 0.153 Outcome Quality 1.555 0.214 0.465 221 0.642 0.082 0.177 Service Quality 0.085 0.771 -0.847 221 0.398 -0.124 0.147 Satisfaction 0.009 0.923 -0.019 221 0.985 -0.003 0.167 Image 0.036 0.850 0.585 221 0.559 0.093 0.160 Price 0.189 0.664 1.815 221 0.071 0.422 0.232 Future Attendance 0.199 0.656 -0.147 221 0.883 -0.034 0.228 Recommend 0.070 0.792 0.445 221 0.657 0.111 0.248
5.2.1.2 Item Non-Responses
Item non-response refers to the particular items that the respondents leave blank on their
questionnaires due to fatigue, sensitivity, lack of knowledge, or other factors, and these
responses must be properly accounted for in the analysis (Garson, 2006).
In this study, Not Applicable (N! A) was included in the response category to capture these
types of responses. The non-response rate for most of the items used in the questionnaire was
- 66-

less than 1 %. However, four items had a non response rate greater than 1 %. Firstly, Separate
'Variance t-tests (as shown in Appendix 3, Table 23A) were cOlnputed to detennine whether
the missing values are Missing Completely At Randoln (MCARlo) or Missing At Random
(MARl I). The correlation between variables that have 1 % or more missing values and all
other variables are significant at greater than 0.05 level, indicating that these missing values
are missing at randoln (MAR). Therefore, imputation for these missing values was undertaken.
The missing values have been imputed with the estimated means (as shown in Appendix 3,
Table 24A) based on the Maximum Likelihood Estimation (MLE) method with normal
distribution, as recommended by Garson (2006).
5.3 Descriptive Statistics
Section E of the Questionnaire has been designed to capture some basic demographic details
of the respondents that took part in this study. Results of the demographic characteristics of
the respondents are presented in Tables 5.2 and 5.3. There are slightly more male respondents
than female respondents, 52.02% and 47.98% respectively. Respondents aged 18-24 account
for 70.4% of the sample, and Asian students is the highest ethnic group (60.99%).
Table 5.2: Gender, Age, and Ethnicity Results.
Gender Frequency Percent Ethnicity Frequency Percent Male 116 52.02 NZEuropean 64 28.70
Female 107 47.98 NZMaori 2 0.90 Total 223 100 Pacific Islander 3 1.35 Age Frequency Percent European 5 2.24
18-24 157 70.40 Asian 136 60.99 25-32 54 24.22 Others 13 5.83 33-40 8 3.59 Total 223 100
40+ 4 1.79 Total 223 100
10 Missing Completely A Random (MCAR) is a condition which exists when missing values are randomly distributed across all observations. II Missing At Random (MAR) is a condition which exists when missing values are not randomly distributed across all observations but are randomly distributed within one or more sub-samples.
- 67 -

The results for the students' field of study and year of enrolln1ent are presented in Tables 5.3
and 5.4. Of the thirteen Inajors available at the university, the Finance major was the largest
group (22.87%), followed by Accounting (15.25%) and Business Management (15.25%).
There were more respondents studying in Year 3 than Year 2,59.19% and 40.81 %
respectively.
Table 5.3: Major Results.
Major ~requency Percent Major ~requency Percent Accounting 34 15.25 Hospitality Management 10 4.48
Agribusiness 6 2.69 International Business 8 3.59 Business Management 34 15.25 Marketing 22 9.87
Computing 6 2.69 Property Management 17 7.62 E-Commerce 0 0.00 Supply Chain Management 15 6.73
Finance 51 22.87 Tourism Management 12 5.38 Economics 8 3.59 Total 223 100
Table 5.4: Year of Study Results.
Year of Study Frequency Percent Year 2 (200 level) 91 40.81 Year 3 (300 level) 132 59.19
Total 223 100
5.4 Assessment for Factor Analysis
5.4.1 Statistical Assumptions for Factor Analysis After the data was collected and tabulated, a series of statistical assumptions were met to
ensure the appropriateness of the data for factor analysis.
5.4.1.1 Examination of the Correlation Matrix.
> -. •
;,.:,"...,-.. -.. ~~:-.. ' .. :",:: .. ; -~ .. :j The visual inspection of the correlation matrix (Appendix 4) revealed that more than half of
the correlations were greater than .30 as recommended by Hair et al. (1998), therefore, the
data is considered appropriate for factor analysis.
- 68 -
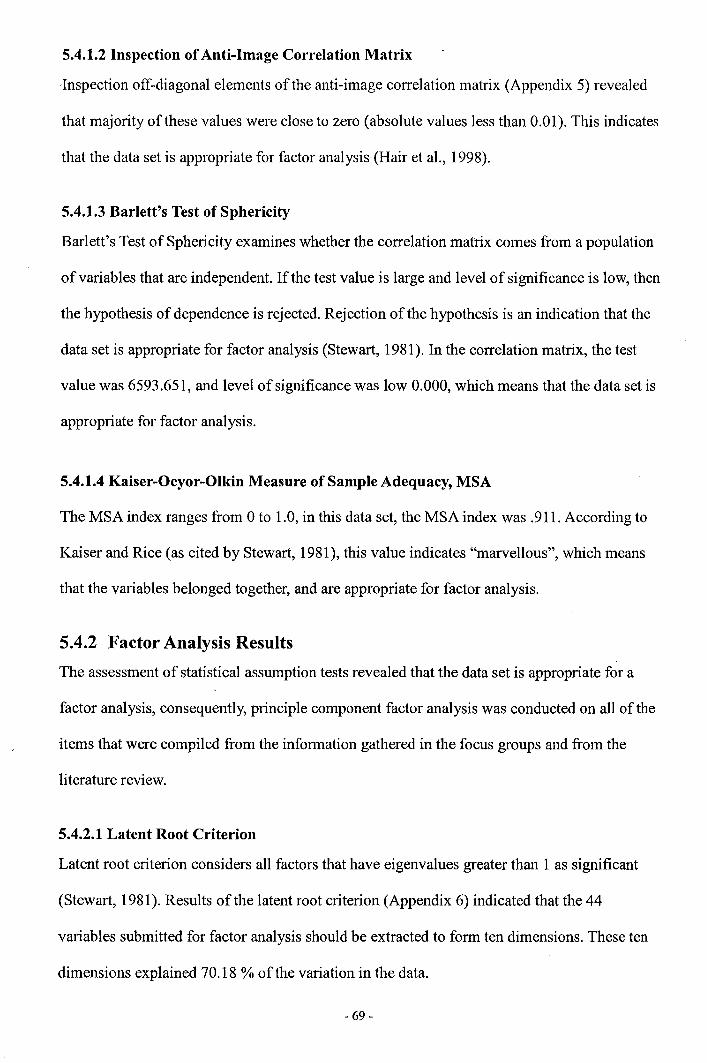
--- cl I
5.4.1.2 Inspection of Anti-Image Correlation Matrix
'Inspection off-diagonal elelnents of the anti-image correlation matrix (Appendix 5) revealed
that majority of these values were close to zero (absolute values less than 0.01). This indicates
that the data set is appropriate for factor analysis (Hair et aI., 1998).
5.4.1.3 Barlett's Test of Sphericity
Barlett's Test of Sphericity examines whether the correlation matrix comes from a population
of variables that are independent. If the test value is large and level of significance is low, then
the hypothesis of dependence is rejected. Rejection of the hypothesis is an indication that the
data set is appropriate for factor analysis (Stewart, 1981). In the correlation matrix, the test
value was 6593.651, and level of significance was low 0.000, which means that the data set is
appropriate for factor analysis.
5.4.1.4 Kaiser-Oeyor-Olkin Measure of Sample Adequacy, MSA
The MSA index ranges from 0 to 1.0, in this data set, the MSA index was .911. According to
Kaiser and Rice (as cited by Stewart, 1981), this value indicates "marvellous", which means
that the variables belonged together, and are appropriate for factor analysis.
5.4.2 Factor Analysis Results The assessment of statistical assumption tests revealed that the data set is appropriate for a
factor analysis, consequently, principle component factor analysis was conducted on all of the
items that were compiled from the information gathered in the focus groups and from the
literature review.
5.4.2.1 Latent Root Criterion
Latent root criterion considers all factors that have eigenvalues greater than 1 as significant
(Stewart, 1981). Results of the latent root criterion (Appendix 6) indicated that the 44
variables submitted for factor analysis should be extracted to form ten dimensions. These ten
dimensions explained 70.18 % of the variation in the data.
- 69-

5.4.2.2 Scree Test Criterion
By laying a straight edge across the bottom portion of the roots, there are ten factors before
the curve becomes approximately a straight line (see Figure 5.1). Therefore, this indicates that
the extraction often dimensions is appropriate for this analysis.
Component Number
Figure 5.1: The Scree Plot.
5.4.2.3 Factor Rotation
The selection of the final factors involves interpreting the computed factor matrix (Hair et a!.,
1998). In this study, the initial inspection of the unrotated factor matrix revealed that 42
variables highly loaded on a single factor. However, b 14 and b 15 loaded together on the other
independent factor. The matrix did not have a meaningful pattern, and in order to reduce
ambiguity, an orthogonal rotation (VARIMAX) and an oblique rotation (OBLIMIN) were
conducted.
After factor rotation, both the VARIMAX and OBLIMIN rotations (Appendix 7, Tables 28A
and 29A) displayed similar factor loadings on most of the variables, the only exception was
- 70-

that the OBLIMIN rotation detennined five variables (a07, a09, all, b04, c02, cI3) as
insignificant, and the VARIMAX rotation detetmined that these variables were significant and . '.
::,...-~-..:-~ .. ..= J __ • ..r~~- ~-i
loaded on Factor 1 (a07, all), Factor 2 (c02, c13), Factor? (b04), and Factor 8 (a09).
Although the significance of the vatiable loadings was slightly different, and the significance
of the loadings changed slightly between rotations, the variables consistently loaded on the
same factors for both VARIMAX and OBLIMIN rotations. Therefore, the final factorial
structure was based on the VARIMAX rotation tnethod as the VARIMAX considered the
factors as independent (Hair et aI., 1998).
5.4.2.4 Interpretation of Factors
Hair et aI. (1998) suggested that for a sample size of approximately 200, factor loadings
greater ± 040 should be considered significant. VARIMAX considered all variables significant,
and six variables (b02, b04, c02, c04, cll, c13) had significant loadings on two factors. The
remaining 38 variables had one loading on one factor (see Appendix 8 for details of the
variable loadings). Each factor was subsequently named in accordance to the construct that
they represented. The ten factors were named: (1) Academic Staff; (2) Academic
Development; (3) Physically Appealing; (4) Administration Staff; (5) Personal Development;
(6) Library; (7) Career Opportunities; (8) Course Content; (9) Social Factors; (10) Academic
Staff Availability.
5.4.3 Summated Scale
In order to summate the items, the content validity, dimensionality, and reliability of the
measurement scales were assessed.
5.4.3.1 Content Validity
All variables (items) were inspected by the researcher to ensure that they were an adequate
and a thorough representation of the construct under investigation. In the final rotation, all the
- 71 -

itelTIS did not load exactly on the sixteen sub-dimensions that were oIiginally proposed to
represent the pIilnary dimensions. However, these itelTIS did load on the priInary dimensions
that were originally proposed. The only exception was the items under Course Content (bOI,
b02, b03). Course Content that loaded on the Interaction Quality dimension was originally
proposed as a sub-dimension of Physical Environment Quality. It was therefore concluded
that the items exhibited adequate content validity.
5.4.3.2 Dimensionality
As noted in Section 5.4.3, six variables had two significant factor loadings, indicating that
these variables were associated with two factors. However, four of these vaIiables (b02, c02,
c04, cll) highly loaded on one factor, and moderately loaded on the different factors in the
component matrix, hence these four variables were included to represent the most highly
loaded factor. The other two variables (b04, c13) moderately loaded on two factors, and could
not be considered as highly associated with any particular factor and therefore they were
excluded. The outcome of this process resulted forty two variables representing ten factors.
5.4.3.3 Reliability
The remaining forty two variables were subjected to reliability tests, except for the variable
alO that represented only one factor. The Cronbach's Coefficient Alpha was used to measure
reliability. All of the factors have a Cronbach's Coefficient Alpha greater than .60, as
recommended by Churchill (1979) for explanatory research. The variables used in the
summated scale and their Cronbach's Coefficient Alpha are summarised in Table 5.5, 5.6 and
5.7.
- 72 -

Table 5.5: Reliability of Scaled Items for Interaction Quality.
Sub- Cronbach's Item Items Rotation
Dimension Alpha No. Loadings a04 Lecturers' Know ledge 0.753 aOI Academic staff are polite and courteous 0.701 a05 Lecturers' teaching ability 0.700 a03 Students feel comfortable talk to lecturers 0.694
Academic 0.909 a06 Preparation and organisation of classes 0.666
Staff a08 Lecturers and support staff are willing to help 0.653 a02 Opportunity to participatc in class discussions 0.621 a07 Academic staff are concerned about student welfare and interests 0.516 all Minimum contact difficulty oflecturers 0.432
Administration al4 Administration staff are courteous 0.819
Staff 0.912 al2 Administration staff are sympathic and reassuring 0.784
- - - - ---- - --- - :.:'"..- :..:...-- --' a13 Administration staff solve my problems at a promised time 0.760
Academic Staff' alO Lecturer's Office Hours 0.661 Availability
_-~_-" ... -_-...r.:_~_-_-_-..:.
bOI Useful course materials 0.721 Course
0.782 b02 Relevant course materials 0.699 Content b03 Interesting course materials 0.664
a09 Prompt Return of the works 0.404
Table 5.6: Reliability of Scaled Items for Physical Environment Quality. Sub- Cronbach's Item
Items Rotation
Dimension Alpha No. Loading
Library b06 Relevant infonnation provided when required 0.792
Atmosphere 0.847 b07 Problems solved at a promised time 0.762
b05 Quiet library to study 0.745 blO Comfortable lecture rooms 0.731 bll Quality equipment in lecture rooms 0.722
Physically 0.834 b13 Campus facilities (e.g. parking, accomodation, cafe) 0.636
Appealing b12 The university has an excellent physical layout 0.574 b09 Quality equipment in computer labs 0.539 b08 Computer Accessibility 0.472
Social 0.779 bl4 Attitude of students sitting nearby 0.888
Factors b15 Disturbances during the lecture 0.851
Table 5.7: Reliability of Scaled Items for Outcome Quality. Sub- Cronbach's Item
Items Rotation
Dimension Alpha No. Loadings c06 Understand people of other racial and ethnic background better 0.709
Personal 0.793
cOS Developed personal code of values and ethics 0.697 Development c08 Ability to function as a member of a team 0.587
cOl Acquired a broad general education in difTerent fields 0.489 cl4 Become more competent in one's field of study 0.685 c07 Ability learn effectively on oneself, pursue ideas, and find the required infonnation 0.638
Academic cl2 Gained specific computing and infonnation technology techniques 0.601
Development 0.882 c04 Ability to analyse quantitative problems 0.597 cl5 Achieved ones' own expected grades 0.589 c03 Developed writing and speaking skills 0.549 cO2 Developed analytical and logical thinking 0.506 elO Gained some knowledge and skills tor a particular career 0.769
Career Opportunities 0.812 c09 Guidance and infonnation on career opportunities at university 0.711
ell Gained knowledge and skills for first job 0.607
- 73 -

In addition to the reliability tests conducted on the sun1mated scale of the sub-dimensions,
reliability tests were also perfonned on the Service Quality, Satisfaction, Image, Ptice, and
Future Attendance sUlnmated scales. The itelns that were used in the summated scale are
shown in Table 5.8. The scores of Cronbach's Coefficient Alpha of these constructs were all
above 0.60, as recommended by (Churchill, 1979), hence it was concluded that these
measures also demonstrated reliability,
Table 5.8: Reliability of Scaled Items for Satisfaction and Related Constructs.
Construct Cronbach's
Items Alpha
Service Excellent service quality
Quality 0.785 Superior service quality
Overall service quality Satisfying experience
Satisfaction 0.867 Overall satisfaction Feel to the university Personal impression about the university
Image 0.906 General university image to students Fulfills promises made to students University's reputation
Price 0.932 University's tuition fees Good value for money
Future 0.855 Intention to choose same university
Attendance Intention to continue for further studies at the same university
All of the summated scales were judged to demonstrate sufficient content validity,
unidimensionality, and reliability for a newly developed questionnaire. The mean of each of
the scales was then used to represent each one of the dimensions identified in Tables 5.5, 5.6,
5.7 and 5.8 for further analysis.
5.5 Assessment of Multiple Regression and ANOVA
5.5.1 Assumptions for Regression Analysis and ANOVA A seties of statistical assumption tests were assessed for each of the eight multiple regression
models to ensure a robust result.
- 74-

5.5.1.1 Outliers
,Each one of the eight regression models was exatnined to ensure that outliers were not present. '.
,;:.--... ;.-:"...:~~~---:~ ... ~j Outliers are identified as the observations whose standardised residual is greater than 3. As
recotnmended by Maddala (2001), outliers were removed frotn the analysis in order to reduce
the effects of their influence on the perfonnance of the regression models ..
5.5.1.2 Multicollinearity
Multicollineaity was assessed for each regression equation. Initial inspection of the Pearson
Correlation Matrix (Appendix 9, Tables 31A - 38A) for each of the regression models shows
that the correlations between the independent variables did not exceed 0.80. Moreover, the R2
values for the eight models were not exceedingly large. The F-values for all the models are
highly significant, individual t-values are also significant except for only two variables in
separate models.
Collinearity statistics (see Appendix 9, Table 39A) were also assessed for all of the regression
models. The VIF values for all independent variables in each model were lower than 4 and
less than 1/(1- R2), indicating that the independent variables were related to the dependent
variables more than to each other, hence multicollinearity was deemed to be not a serious
problem. Moreover, the tolerance values were all above 0.20, and all of the independent
variables in each model had conditional indices lower than 15. In summary, the collinearity
statistics indicated that no multicollinearity problems occurred in any of the regression models
used in this study.
5.5.1.3 Linearity
The scatter plot of standardised residuals versus the fitted values (see Appendix 10, Figure 9A)
for all eight regression models were visually inspected. The plots did not show any systematic
pattern, thus providing support for the specified linear relationship.
- 75 -

5.5.1.4 Error Term Normality
Both histogratn residual plots and the nonnality probability plots were plotted to assess
nonnality (see Appendix 11, Figures lOA and 11A). The histogram plots show that the
distribution approximates the nonnal distribution, and that the P-P plots are approximately a
straight line and not curvature. Therefore, the residuals were deemed to have a reasonable
nonnal distribution.
5.5.1.5 Error Term Independence
The Durbin-Watson test was computed to diagnosis error tenn independence, the test value
and the corresponding critical value are summarised in Table 5.9.
Table 5.9: Durbin-Watson Test Statistics. Test Critical Value (at 1 % level)
Model Dependent Variable Statistic DL DU 1 Interaction Quality 1.909 1.633 1.715 2 Physical Environment Quality 1.899 1.643 1.704 3 Outcome Quality 1.992 1.643 1.704 4 Service Quality 1.906 1.633 1.715 5 Price 1.773 1.664 1.684 6 Satisfaction 1.722 1.643 1.704 7 Future Attendance 2.030 1.664 1.684 8 Recommend Service 1.880 1.664 1.684
The Durbin-Watson test statistics for each of the eight models are greater than the DU,
indicating the there was no autocorrelation in the residuals. Therefore, the assumption of error
tenn independence was satisfied.
5.5.1.6 Error Term Homoscedasticity
The error tenns are expected to have equal variances. In the scattered residual plots
(Appendix 10, Figure 9A), the residual appeared scattered randomly about the zero line and
not exhibiting a triangular-shaped pattern, thus provided sufficient evidence to satisfy the
error tenn homoscedasticity assumption.
- 76-

, ... -... .:'--...::~-~
I'
:-.':o=-=-~:':.,.:,:...:-~: ' -.J~-~~"';
~ .. -"_'_:':--Io..-_~_-_-;"_' .. ".
-- -r = ... ---
5.5.2 Results Pertaining to Research Objective 1 (Hypothesis 1 through 6) This section presents the results relating to Hypotheses 1 through 6 that were fonnulated in
order to achieve Research Objective 1. Hypotheses 1, 2, and 3 were proposed to test the
second-order of the hierarchicaltnodel. The sumtnated scaled sub-dimensions were regressed
against their pertaining primary dimensions as derived from the literature review, perceived
by the focus group respondents, determined by the researcher, and confirmed by the
exploratory factor analysis. Hypotheses 4, 5, and 6 were proposed to test the first-order of the
hierarchical model, therefore, the primary dimensions were regressed against Total Service
Quality.
5.5.2.1 Hypothesis 1
The regression model for Hypothesis 1 has Interaction Quality as the dependent variable and
its pertaining sub-dimensions as the independent variables. Four sub-dimensions that relate to
Interaction Quality were identified, namely, Academic Staff, Administration Staff, Academic
Staff Availability, and Course Content. The results relating to Hypothesis 1 are presented in
Table 5.10.
Table 5.10: Modell: Multiple Regression Results Relating to Hypothesis 1.
MODEL 1 Interaction Quality constant Academic Staff Administration Staff Academic Staff Availability Course Content Adjusted R 2=O.658 F=106.140***
U nstandardised
Coefficients B Std. Error
0.062 0.147 0.579 0.079 0.291 0.048 0.028 0.040 0.136 0.068
*** Significant at 1 % level ** Significant at 5% level * Significant at 10% level
Standardised Coefficients Beta t
0.420 0.476 7.369 0.311 6.091 0.033 0.711 0.115 1.990
Sig.
0.675 0.000 0.000 0.478 0.048
The F statistic is 106.140 at 1 % level of significance, indicating that at least one of the
*** ***
**
independent variables helps explain some of the variation in Interaction Quality. Further, the
adjusted coefficient of determination reveals that 65.8% of the variation in Interaction Quality
- 77 -

-----'_ -~-...:->-~-_'_ -L-" -..... -_"
.- .... ---":....:--:--:->=->~-~
..... : ... .:.:.-""_~"-~..:-u:...."':
_-_~_-'O~-J_'-r...-_-.. -~ .• , .. :-.:
is explained by the regression model. The p-values of the t-tests were less than 1 % level of
'significance for Academic Staff and Administration Staff, and less than 5% level of
significance for Course Content, showing that the beta coefficients of these three
sub-dimensions are significant, and explain some of the variation in Interaction Quality.
However, the p-value of the t-test were greater than the 10% level of significance for
Academic Staff Availability, showing that when the other sub-dimensions are included in the
model, the beta coefficient of Academic Staff Availability sub-dimension does not help
explain the additional variation in Interaction Quality. Therefore, the results only partially
support Hypothesis 1.
5.5.2.2 Hypothesis 2
The regression model for Hypothesis 2 has Physical Environment Quality as the dependent
variable and pertaining sub-dimensions as the independent variables. Three sub-dimensions
that relate to Physical Environment Quality were identified, namely, Library, Physical
Appealing, and Social Factors. The results relating to Hypothesis 2 are presented in Table
5.11.
Table 5.11: Model 2: Multiple Regression Results Relating to Hypothesis 2.
MODEL 2 Physical Environment Quality constant Library Physically Appealing Social Factors Adjusted R2=O.656 F=140.175***
U nstandardised
Coefficients B Std. Error
0.023 0.158 0.197 0.044 0.656 0.052 0.106 0.035
*** Significant at 1 % level ** Significant at 5% level * Significant at 10% level
Standardised Coefficients Beta t
0.145 0.218 4.484 0.629 12.677 0.124 3.042
Sig.
0.884 0.000 0.000 0.003
*** *** ***
The F statistic is 140.175 at 1 % level of significance, which means that the model explains
some of the variation in Physical Environment Quality. Further, the adjusted coefficient of
determination reveals that 65.6% of the variation in Physical Environment Quality is
explained by the regression model. The p-values of the t-tests are less than the 1 % level of
- 78 -

significance for Library and Physically Appealing, and less than the 5% level of significance
for Social Factor showing that the beta coefficients of these three sub-dimensions are
significant in explaining Physical Envirorunent Quality. Therefore, Hypothesis 2 is suppo11ed
by the results of the statistical analysis.
5.5.2.3 Hypothesis 3
The regression model for Hypothesis 3 has Outcome Quality as the dependent vatiable and
pertaining sub-dimensions as the independent vatiables. Three sub-dimensions that relate to
Outcome Quality were identified, namely, Personal Development, Academic Development,
and Career Opportunities. The results relating to Hypothesis 3 are presented in Table 5.12.
Table 5.12: Model 3: Multiple Regression Results Relating to Hypothesis 3.
MODEL 3 Outcome Quality constant Personal Developement Academic Development Career Opportunities Adjusted R2=O.629 F=120.521 ***
U nstandardised
Coefficients B Std. Error
-0.348 0.185 0.234 0.085 0.780 0.093 0.147 0.066
*** Slgmficant at 1 % level ** Significant at 5% level * Significant at 10% level
Standardised Coefficients Beta t
-1.885 0.170 2.751 0.571 8.350 0.125 2.248
Sig.
0.061 0.006 0.000 0.026
The F statistic is 120.521 at 1 % level of significance, indicating that the at least one of the
*** *** **
independent vatiables helps explain some of the vatiation in Outcome Quality. Further, the
adjusted coefficient of determination reveals that 62.9% of the vatiation in Outcome Quality
is explained by the regression model. The p-values of the t-tests were less than the 1 % level of
significance for Personal Development and Academic Development, and less than the 5%
level of significance for Career Opportunities, showing that these vatiables explained some of
the vatiation in Outcome Quality. Therefore, the results support Hypothesis 3.
- 79-

~-:-.:-:..=- ~-:o.::.':-:-;::-~-':' • ... '~-,,"~~~:-~.';'-------:".--!'-I~
5.5.2.4 Hypotheses 4 to 6 and 10
,Model 4 has the independent variables, Interaction Quality, Physical Environment Quality,
and Outcolne Quality, and they are regressed against Service Quality. In addition to the
prilnary dimensions, the Image construct is also 'included as an independent variable to test its
effect on Service Quality (Hypothesis 10). The results relating to Hypothesis 4, 5, 6, and 10
are presented in Table 5.13.
Table 5.13: Model 4: Multiple Regression Results Relating to Hypotheses 4, 5, 6 and 10.
MODEL 4 Service Quality constant Interaction Quality Physical Environment Quality Outcome Quality Image Adjusted R2=O.571 F=74.257***
Unstandardised
Coefficients B Std. Error
0.842 0.159 0.278 0.055 0.166 0.060 0.222 0.057 0.142 0.046
*** Significant at 1 % level ** Significant at 5% level * Significant at 10% level
Standardised Coefficients Beta t Sig.
5.290 0.000 0.309 5.033 0.000 *** 0.180 2.739 0.007 *** 0.266 3.915 0.000 *** 0.166 3.083 0.002 ***
F statistic equal to 74.257 is significant at 1 %level of significance. Therefore, the independent
variables help to explain some of the variation in Service Quality. Further, the adjusted
coefficient of detennination reveals that 67.1 % of the variation in Service Quality is explained
by the regression model. The p-values of the t-tests were less than the 1 % level of significance
for Interaction Quality, Physical Environrilent Quality, Outcome Quality, and Image. Since all
primary dimensions and image are significant, these variables each help explain some of the
variation in Service Quality. Accordingly, Hypotheses 4, 5, 6, and 10 are all supported by the
statistical analysis.
5.5.2.5 Discussion Regarding Research Objective 1
There are nine significant sub-dimensions of service quality as perceived by students at
Lincoln University. These are Academic Staff, Administration Staff, Course Content, Library,
Physically Appealing, Social Factors, Personal Development, Academic Development, and
- 80-

--~-' .. !
Career 0ppo11unity. The beta coefficients suggest that increase in these sub-dilnensions will
'positively affect their pe11aining prilnary ditnensions. The effect of Academic Staff
Availability on Interaction Quality is insignificant, suggesting increasing the perfonnance on
this sub-dimension may not positively affect the Interaction Quality perfolmance.
The support found for Hypotheses 4, 5, and 6 provides further evidence for the use of
Interaction Quality, Physical Environment Quality, and Outcome Quality as primary
dimensions of service quality in the context of higher education. Further, the results of
Hypotheses 1 through 6 suggest that there is support for a hierarchical factor structure of
service quality for higher education.
5.5.3 Results Pertaining to Research Objective 2 This section presents the statistical results of Hypotheses 7, 8, 9, and 11 in order to achieve
Research Objective 2. Research Objective 2 examines the relationships between Satisfaction,
Service Quality, Price, and Image.
5.5.3.1 Hypothesis 8
For Hypothesis 8, the relationship between Price and Service Quality was examined, the
results relating to Hypothesis 8 are presented in Table 5.14.
Table 5.14: ModelS: Multiple Regression Results Relating to Hypotheses 8.
MODELS Price constant Service Quality Adjusted R2=O.256 F=77.465***
U nstandardised
Coefficients B Std. Error
1.545 0.318 0.812 0.092
*** Significant at 1 % level ** Significant at 5% level * Significant at 10% level
Standardised Coefficients Beta t
4.853 0.509 8.801
F statistic equal to 77.465 is significant at 1 % level of significance. Therefore, the
Sig.
0.000 0.000
independent variable helps to explain some of the variation in Price. Further, the adjusted
- 81 -
***

,-.---"';..-. --~-~-~--~.,:
- - .. "~-._' .. -.... -":-... -_-_-J:'-~
coefficient of detennination reveals that 25.6% of the vatiation in Price is explained by the
'regression n10del. The p-value of the t-test was less than the 1 % level of significance for
Service Quality. Therefore, Hypothesis 8 is statistically supported.
5.5.3.2 Hypotheses 7, 9, and 11
Model 7 examines the constructs that may affect students' satisfaction. Consequently, three
hypotheses relating to Service Quality, Image, and Price were tested. The results relating to
Hypotheses 7, 9, and 11 are sumtnarised in Table 5.15.
Table 5.15: Model 6: Multiple Regression Results Relating to Hypotheses 7,9, and 11.
MODEL 6 Satisfaction constant Service Quality Image Price Adjusted R 2=O.758 F=229.134***
Unstandardised
Coefficients B Std. Error
-0.348 0.145 0.909 0.046 0.080 0.045 0.025 0.030
*** Significant at 1 % level ** Significant at 5% level
* Significant at 10% level
Standardised Coefficients Beta t Sig.
-2.392 0.018 0.809 19.706 0.000 0.077 1.780 0.077 0.036 0.843 0.400
F statistic equal to 229.134 is significant at 1 %level of significance. Therefore, the
independent variables help to explain some of the variation in Satisfaction. Further, the
adjusted coefficient of detennination reveals that 75.8% of the variation in Satisfaction is
explained by the regression model. The p-values of the t-tests were less than 1 % level of
*** *
significance for Service Quality, and less than 10% level of significance for Image, showing
that the beta coefficients of these two independent variables are significant, and explain some
of the variation in Satisfaction. However, the p-value of the t-tests were greater than the 10%
level of significance for Price, showing that when the other independent variables are
included in the model, the beta coefficient of Price does not help explain the additional
variation in Satisfaction. Therefore, while Hypotheses 7 and 11 are supported, Hypothesis 9 is
not supported.
- 82-

5.5.3.3 Discussion Regarding Research Objective 2
In addition to Service Quality being positively influenced by students' perceptions of the three
primary dimensions, the t-statistic for Image shows a significant positive effect. However, the
beta coefficient of Image (0.166) suggests that Image is not perceived as important to Service
Quality as Interaction Quality (jJ= 0.309), Outcome Quality (jJ= 0.266) or Physical
Environment Quality (jJ=0.180) by students.
The t-statistic for Service Quality shows that increasing favourable perceptions of Service
Quality (jJ= 0.509) positively influence perceptions of Price, and as well, positively influences
Satisfaction. The t-statistic Satisfaction is also positively influenced by Image, but is not
influenced by the perceptions of Price. The standardised coefficients of Service Quality, Price,
and Image explain Satisfaction numerically, and identify that Service Quality (jJ= 0.809) has
the most influential effect on Satisfaction, followed by Image (jJ= 0.077), and Price (jJ= 0.036)
has the least effect.
5.5.4 Results Pertaining to Research Objective 3 Research Objective 3 is related to the relationship between Satisfaction and favourable future
behavioural intentions. Consequently, Hypothesis 12 and 13 are tested in order to achieve
Research Objective 3.
5.5.4.1 Hypothesis 12
Hypothesis 12 is related to Future Attendance and Satisfaction. The results related to
Hypothesis 12 are presented in Table 5.16.
- 83 -

Table 5.16: Model 7: Multiple Regression Results Relating to Hypotheses 12.
MODEL 7 Future Attendance constant Satisfaction Adjusted R2=0.326 F=l 07.438***
U nstandardised
Coefficients B Std. Error
1.439 0.246 0.784 0.076
*** Significant at 1 % level ** Significant at 5% level * Significant at 10% level
Standardised Coefficients Beta t
5.839 0.574 10.365
Sig.
0.000 0.000
F statistic equal to 107.438 is significant at 1 %level of significance. Therefore, the
***
independent variable helps to explain some of the variation in Future Attendance. Further, the
adjusted coefficient of determination reveals that 32.6% of the variation in Future Attendance
is explained by the regression model. The p-value of the t-test was less than the 1 % level of
significance for Satisfaction. Therefore, Hypothesis 12 is statistically supported.
5.5.4.2 Hypothesis 13
Hypothesis 13 tested the final relationship path of the proposed model, that is, Satisfaction
and Recommendation. The result relating to Hypothesis 13 is presented in the Table 5. 17.
Table 5.17: Model 8: Multiple Regression Results Relating to Hypotheses 13.
MODEL 8 Recommend constant Satisfaction Adjusted R2=0.411 F=155.528***
U nstandardised
Coefficients B Std. Error
0.756 0.250 0.958 0.077
*** Significant at 1 % level ** Significant at 5% level * Significant at 10% level
Standardised Coefficients Beta t
3.023 0.644 12.471
Sig.
0.003 0.000
F statistic equal to 155.528 is significant at 1 %level of significance. Therefore, the
independent variable helps to. explain some of the variation in Recommend. Further, the
adjusted coefficient of determination reveals that 41.1 % of the variation in Recommend is
explained by the regression model. The p-value of the t-test was less than the 1 % level of
significance for Satisfaction. Therefore, Hypothesis 13 is statistically supported.
- 84-
***

5.5.4.3 Discussion Regarding Research Objective 3
An enhanced level of Satisfaction reinforces the decision to positively consider Future
Attendance at the Satne university, as well as increasing the intention to Recolnmend the
university to others. However, the adjusted R2 for the Future Attendance (32.6%) and
Recommend (41.1 %) Models are not very high, indicating that a proportion of the variations
in Future Attendance and RecOlnmend are not explained by the regression models.
5.5.5 Hypothesis Pertaining to Research Objective 4 Multiple regression Models 1,2, 3, and 4 were used in order to identify the least and most
important Service Quality dimensions as perceived by students. The results are presented in
Table 5.14, 5.15, 5.16., and 5.17.
5.5.5.1 Hypothesis 14
Hypothesis 14a postulated that students perceive each of the three primary dimensions to be
more or less important, and this is supported by the statistical results. The most important
primary dimension perceived by students was Interaction Quality (/3= 0.309), followed by
Outcome Quality (/3= 0.266), and Physical Environment Quality (/3= 0.180) that was
perceived as the least important dimension of the three primary dimensions.
Hypothesis 14b postulated that the sub-dimensions pertaining to the three primary dimensions
would vary in importance. This information is summarised in Figure 5.2, which lists all the
standardised beta coefficient of the eight regression models.
5.5.5.2 Discussion Regarding Research Objective 4
The three primary dimensions, Interaction Quality, Physical Environment Quality and
Outcome Quality vary in terms ofth~ir importance to overall Perceived Service Quality. In
addition, each of the pertaining sub-dimensions also varies in importance to each of the
primary dimensions. The statistical results of eight regression models are illustrated in Figure
- 85 -
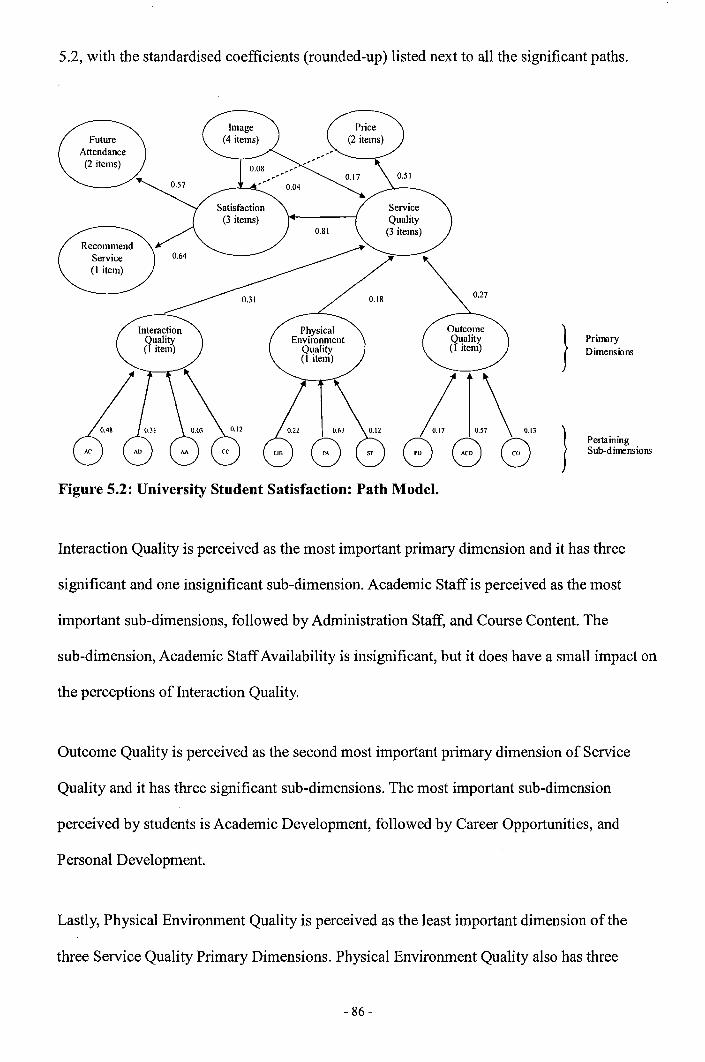
5.2, with the standardised coefficients (rounded-up) listed next to all the significant paths.
1"' .. - •• -_-.-J'..: ........ _-.. ~ ... 1
} Pritmry Dimensions
it\ 0.13
} 8 G 8 Pertaining Sub-dimensions
Figure 5.2: University Student Satisfaction: Path Model.
Interaction Quality is perceived as the most important primary dimension and it has three
.. - --- - --~---'----:...--=~ .. ,!-.--~"'""---
significant and one insignificant sub-dimension. Academic Staff is perceived as the most
important sub-dimensions, followed by Administration Staff, and Course Content. The
sub-dimension, Academic Staff Availability is insignificant, but it does have a small impact on
the perceptions of Interaction Quality.
Outcome Quality is perceived as the second most important primary dimension of Service
Quality and it has three significant sub-dimensions. The most important sub-dimension
perceived by students is Academic Development, followed by Career Opportunities, and - - ... "-- - - - - =- - - ~ -.- -..
Personal Development.
Lastly, Physical Environment Quality is perceived as the least important dimension of the
three Service Quality Primary Dimensions. Physical Environment Quality also has three
- 86 -

!.-';.-;'~~J';-'_-:..}-"'~'"'-": ~:P'j.._~~~~ ~:~~~-: .. ~~
:'- ~ ~ -~ • ," .0-" ..... ~
significant sub-ditnensions, Physically Appealing being the most itnportant, followed by
Library, and Social Factors.
5.5.6 Hypothesis Pertaining to Research Objective 5 In order to achieve Research Objective 5, Hypothesis 15 has been formulated to test if there
are differences between groups based on the demographic characteristics of the respondents.
One crucial assumption for an analysis of variance to be effective is that the groups being
compared must be of a similar sample size. The groups; Gender, Major and Year of Study
meet this criteria. However, the Age and Ethnic Groups have disproportionate sample sizes.
Therefore, to obtain a reliable statistical result, the age groups were combined into two groups,
18 to 24 years and 25 years and over. The ethnic groups were also combined into two groups,
Western and Asian.
5.5.6.1 Hypothesis 15a
Hypothesis 15a postulates that there is no perceptual difference between Satisfaction, Service
Quality, Image, Price, Future Attendance, and Recommendation among the Gender, Age,
Eethnicity, Major, and Year of Study Groups. The F statistics (See Appendix 12, Table 40A)
show that there are no perceptual differences between males and females, age 18-24 years and
25 years and over, and majors. For the Western and Asian ethnic groups, except for the Image
construct, the means of the Service Quality, Satisfaction, Price, Future Attendance and the
Recommendation constructs are significantlY,different. There is also a mean differences on
Future Attendance (5% level) and Recommendation (10% level) between the year two and
year three students. Table 5.18 summarised the AN OVA results relating to Hypothesis 15a, the
significant perceptual differences are indicated.
- 87 -

Table 5.18: ANOVA Results Relating to Hypothesis 15a.
Service Quality Satisfaction Image Price Future Attendance Recommend *** Significant at 1 % level ** Significant at 5% level * Significant at 10% level
5.5.6.2 Hypothesis 15b
Gender Age Ethnicity Major Year of Study
*** ***
*** ** ** *** *
Hypothesis 15b postulates that there are no perceptual differences of the Primary Dimensions,
Interaction Quality, Physical Environment Quality and Outcome Quality among the Gender,
Age, Ethnicity, Major, and Year of Study Groups. Of these five demographic groups, the
Physical Environment Quality dimension is perceived differently by Western and Asian
students at 1 % level of significance. In addition, the Outcome Quality and Interaction Quality
dimension are perceived differently between year two and year three students at 5% and 1 %
level of significance respectively (See Appendix 12~.Table 41A). There is no perceptual
differences between the remaining groups. Table 5.19 summarised the AN 0 VA results relating
to Hypothesis 15b, the significant perceptual differences are indicated.
Table 5.19: ANOVA Results Relating to Hypothesis 15b.
Interaction Quality Physical Environment Quality Outcome Quality *** Significant at 1 % level ** Significant at 5% level * Significant at 10% level
Gender Age
- 88 -
Ethnicity
**
Major Year of Study
*
**

5.5.6.3 Hypothesis 15c
Hypothesis 15c postulates that there are no perceptual differences of the sub-dimensions that
pertain to the primary dimensions between the gender, age, etlmicity, major, and year of study
groups. The results show no perceptual differences of the sub-dimensions within the age
groups. However, the gender, ethnicity, major, and year of study do perceive differences in
some of the sub-dimensions (see Appendix 12, Table 42A).
The F -statistics of the sub-dimensions indicate that there are perceptual differences of the
Social Factors between male and female groups (0.10 level of significant) and the Academic
Staff Availability within the major groups (0.10 level). There are perceptual differences of
Social Factors (0.10 level), Academic Development (0.05 level), and Career Opportunity
(0.01) sub-dimensions between Western and Asian students. In addition, Year 2 and Year 3
study groups had perceptual differences of four sub-dimensions; Academic Staff (0.05 level),
Course Content (0.01 level), Personal Development (0.01 level), and Academic Development
(0.01 level). Table 5.20 presents summary of ANOVA results relating to Hypothesis 15c, the
significant perceptual differences are indicated.
Table 5.20: ANOVA Results Relating to Hypothesis 15c.
Academic Staff Administration Staff Course Content Library Physical Appealing Social Factors Personal Development Academic Development Career Opportunities *** Significant at 1 % level ** Significant at 5% level * Significant at 10% level
Gender Age
*
- 89 -
Ethnicity Major Year of Study
**
***
* ***
*** *** ***

:.'~:..:... ~!"~,,_,:, __ -.-_~.:' or-o
.-:"~.;,:---,a;~.:. .. -.:_-a., ... ~
5.5.6.4 Discussion Regarding Research Objective 5
The five demographic groups, Gender, Age, Ethnicity, Major, and Year of Study, Age and
Major groups perceive no differences of the sub-diInensions and primary dimensions of
Service Quality, Service Quality, Price, Itnage, Satisfaction, Future Attendance, and
Recommendation. Gender groups have no mean differences of all constructs except Social
Factor sub-dimension between male and female. Major groups also have no perceptual
differences of all constructs except Academic Staff Availability. Similarly, the Year of Study
groups do have perceptual differences of the sub-dimensions, namely, Academic Staff, Course
Content, Personal Development, and Academic Development. In addition, Outcome Quality,
Future Attendance, and Recommendation are perceived differently by these groups. The
Western and Asian ethnic groups have perceptual differences of the sub-dimensions, Social
Factors, Academic Development, and Career Opportunities. In addition, Western and Asian
groups have perceptual differences of Physical Environment Quality, Service Quality,
Satisfaction, Future Attendance, and Recommendation.
5.6 Chapter Summary
This chapter presented the results based on the research plan and the methodology outlined in
Chapter Four. A preliminary examination of the data set indicates that the questionnaire· is
reliable and valid. In addition, examination of the data set indicates that the statistical
assumptions required to perform factor analysis, multiple regression analysis and analysis of
variance have been met.
Using principle components factor analysis, the original sixteen sub-dimensions proposed to
represent service quality were reduced to 10 sub-dimensions. Each path in the conceptual
model (presented in Section 3.3) was subsequently tested using eight multiple regression
models. Hypothesis 1 was partially supported, and Hypothesis 9 was not supported, the
remaining 12 hypotheses were supported by the statistical results. Hypothesis 15 related to the
- 90-

different perceptions that may exist between delnographic groups shows that of all the groups,
the Ethnicity and Year of Study Groups have the most perceptual differences within their
groups. The relnaining delnographic groups have the Ininimal perceptual differences within
their groups.
- 91 -

Chapter 6: Conclusions and Implications
6.1 Introduction
This chapter provides a sumlnary of the research, reviews the findings, and reports several
conclusions based on the results and discussion presented in Chapter Five. The theoretical and
managerial contributions, limitations, and avenues for future research are also discussed.
6.2 Summary of the Study
The literature review presented in Chapter Two suggests that the hierarchical factor structure
for measuring and conceptualising service quality in other service industries may also be
appropriate for use in higher education. The literature review, the focus groups, and the
statistical analysis add support for the presence of a hierarchical structure and support the
three primary dimensions underlying service quality in higher education organisations,
namely, Interaction Quality, Physical Environment Quality, and Outcome Quality.
While the three primary dimensions of service quality may be appropriate for use across
industries and cultures, several researchers (Dabholkar et aI., 1996; Van Dyke, Keppelman,
: .•. --:..-:-~.~ .-'-----~.:.-: and Prybutok, 1997) commented that service quality sub-dimensions should be developed .. - .
specifically to suit the industry due to the inability to identify a common set of
sub-dimensions. In agreement with the contention of these researchers, this study has
identified the service quality sub-dimensions of higher education in New Zealand, as
perceived by students.
Several constructs related to service quality were identified in the literature review. Service
quality has been related to; satisfaction (Rust and Oliver, 1994; Cronin and Taylor, 1994;
Parasuraman et aI., 1994), and price (Caurana, Money, and Berthon, 2000; Bolton and Drew,
- 92 -

1991; Zeithan11, 1988). Favourable future behavioural intentions have been related to
satisfaction (Zeithan11 et aI., 1996; Boulding et aI., 1993). In the case of higher education,
image was viewed as perceived excellence (Gavin, as cited by Kotler and Fox, 1995) and has
been related to service quality and satisfaction (Nguyen and LeBlanc, 1998; Andressen and
Lindastad, 1998). Accordingly, this study analysed each of these constructs and the
relationships between them.
In addition, several researchers (Ham, 2003; Clemes et aI., 2001; Ford et aI., 1999) suggested
that the perceptions of service quality not only vary across industries but it also differs due to
the demographic characteristics of consumers. Therefore, the constructs have also been
examined based on the respondents' gender, age, ethnicity, major and year of study.
In order to achieve a better understanding of students' perceptions of service quality and their
effects of these perceptions on the related constructs such as satisfaction, price, image, and
favourable future intentions, five research objectives were identified in this study:
(1) To identify the service quality dimensions as perceived by students in the New Zealand
higher education sector.
(2) To determine the effects of the dimensions of perceived service quality and other
influential factors on students' overall satisfaction.
(3) To examine the relationship of students' overall satisfaction with favourable future
behavioural intentions.
(4) To identify the least and most important service quality dimensions as perceived by
students in higher education in New Zealand.
(5) To examine the effects of demographic factors on students' satisfaction and related
constructs.
- 93 -

These five research objectives were addressed by testing 15 hypotheses, developed in Chapter
Three, Hypotheses 1 through 6 relate to Research Objective 1, Hypotheses 7 through 11 relate
to Research Objective 2, Hypotheses 12 and 13 relate to Research Objective 3, Hypothesis 14
relates to Research Objective 4, and Hypothesis 15 relates to Research Objective 5.
6.3 Conclusions Pertaining to Research Objective 1
Research Objective One was ,achieved. The dimensions of service quality, as perceived by
students at Lincoln University, New Zealand, were identified. The primary dimensions of
service quality are Interaction Quality, Physical Environment Quality, and Outcome Quality,
as identified in the literature review, supported by the focus group research, and supported by
the statistical analysis. The findings specifically support the presence of a hierarchical factor
structure of service quality (Brady and Cronin, 2001) for higher education.
The results of the statistical analysis reduced the sixteen sub-dimensions originally proposed
to ten sub-dimensions. The ten sub-dimensions are: Academic Staff, Administration Staff,
Academic Staff Availability, Course Content, Library, Physically Appealing, Social Factors,
Personal Development, Academic Development, and Career Opportunities. The number of
sub-dimensions are not equal to the number of sub-dimensions identified by Brady and
Cronin (2001) and Collins (2005). This finding supports the contention of earlier studies (Van
Dyke et aI., 1997) that have identified different factor structures across services industries.
Some of the sub-dimensions are also different in content than the sub-dimensions identified
for several other services (for example, see Collins, 2005; Brady and Cronin, 2001; Dabholkar
et aI., 1996).
However, the ten sub-dimensions identified in this study are similar in content to the
dimensions factored by other researches that have focused on higher education (DeShields et
aI., 2005; Clemes et aI., 2001; Oldfield and Baron, 2000; Athiyaman, 1997). However, the ten
- 94-

sub-dimensions do differ in number from other higher education studies (Athiyaman, 1997;
Cuthbert, 1996a, b).
The different sub-dimensional factor structure supports the view that the dimensionality ofthe
service quality construct is dependent on the service industry under investigation, and adds
support to the claims tbat industry and cultural-specific measures of service quality need to be
developed to identify different dimensional structures (Clemes et aI., 2001; Dabholkar et aI.,
1996).
There are three primary dimension identified in this study; Interaction Quality, Physical
Environment Quality, and Outcome Quality. Several studies on service quality in higher
education (see Section 2.6) bave focused on teacher and students' interaction and the physical
facilities of the university. This study adds empirical support to this vein ofiiterature and
identifies Interaction Quality and Physical Environment Quality as important dimensions
when assessing service quality in higher education institutions. However, the statistical
significance of Outcome Quality as an explanatory variable provides additional empirical
support for the study by Tam (2006) who suggests that outcomes are also an important aspect
to consider when assessing students' university experiences.
6.4 Conclusions Pertaining to Research Objective 2
Research Objective Two only partially achieved as Hypotheses 7, 8,10, and II are confinued
by the significant positive effects on their related constructs. However, Hypothesis 9 was not
confinned as Price did not significantly influence Satisfaction.
Hypothesis 8 proposed that Price is positively influenced by Service Quality. This result
supports the trade-off relationship identified by Zeithaml (1988) and Bolton and Drew (1991)
between service quality and price. Moreover, the finding empirically supports those of
Caurana et al. (2000), who detennined that value (measured in monetary tenns) is influenced
- 95 -

by service quality. However, the variation on the perceptions of Price attributed to Service
Quality is 25.6%. This finding suggests that there are other unidentified factors that influence .. ----·--------~-.-·-.. - ...... i
the perceptions of Price in higher education.
The statistical analysis indicates that Image has appositive impact on Service Quality (fJ=
0.192). This finding supports Bloemer, Ruyter and Peeters's (1998) result that perceptions of
image had a positive significant effect on service quality. However, the beta coefficient also
indicates that the importance of Image on Service Quality is less than the importance of each
of the three Primary Dimensions.
The three independent variables; Service Quality, Price and Image explained approximately
73% of the variation in Satisfaction. The strongest positive effect was between Service
Quality and Satisfaction (fJ= 0.783). This result supports the findings of Brady et al. (2002)
who detennined that service quality was an antecedent of the higher order construct of
Satisfaction. Image also has an independent effect (fJ=0.099) on satisfaction, supporting
Palacio, et al. 's (2002) view that a university's image influences students' level of satisfaction.
However, Image's beta coefficient indicates it has only a minor impact on satisfaction in this
study. This finding is different from Mai's (2005) finding that' overall impression of the
school' had a strong influence on satisfaction. Additionally, Image also indirectly influences
Satisfaction through Service Quality, however, the effect is minimal. Andressen and Lindastad
(1998) suggested that image has a larger impact on Satisfaction when people have a lack of
knowledge about an organisation through their own experiences. Therefore, the potential of
image to influence Satisfaction may be increased or decreased by students' actual university
experiences.
Price has an insignificant relationship with Satisfaction. This finding implies that an increase
in the perception of price does not have an impact on the level of satisfaction. This finding is
- 96-

different to the finings of other studies (Caurana et aI., 2000; McDougall and Levesque, 2000)
that found that perceptions of price had a strong impact on satisfaction.
6.5 Conclusions Pertaining to Research Objective 3
Research Objective Three was achieved as Hypotheses 12 and 13 relating to Satisfaction and
students' favourable future behavioural intentions were confinned. The Intention to Attend the
same university in the future is positively influenced by students' level of Satisfaction.
Similarly, the Intention to Recommend the university to other people is also positively
influenced by students' level of satisfaction. The result empirically support those of Boulding
et aI. (1993) and Athi yaman (1997) that maintain improving students' level of satisfaction will
increase their favourable behavoural intentions in the future. Further, as Service Quality and
Image are positively related to Satisfaction, these constructs can also be seen to have an
indirect effect on favourable future behavioural intentions of students. However, the statistic
analysis indicates that Satisfaction accounted for only a small amount of the variation in
Future Attendance (R 2= 32.6%) and Recommendation (R 2= 41.1 %). This implies that there
are other important antecedents of favourable future behavioural intentions that have not been
identified in this study.
6.6 Conclusions Pertaining to Research Objective 4
Research Objective Four was achieved as the least and most important service quality
dimensions were identified as perceived by students for a higher education institution in New
Zealand.
The primary dimension Interaction Quality was perceived by students as most important,
follow~d by Outcome Quality, and Physical Environment Quality. These findings agree with
Cuthbert's (1996a, b) contention that when measuring the overall level of service quality in a
- 97 -

university envirorunent, staff and student interaction factors ovenide physical facility factors.
Further, Outcolne Quality exerts a stronger impact on Service Quality than Physical
Environment Quality, iInplying that students perceived the leanling outcomes of their
experiences as more iInpo11ant than the university's facilities and learning environment.
6.7 Conclusions Pertaining to Research Objective 5 ..
.. ~~.:::..::w ___ : .• _ ~ :
Research Objective Five was partially satisfied as the Age Groups perceived no differences on
all of the constructs. However, the Gender, Ethnicity, Major, and Year of Study Groups had
perceptual differences of several of the constructs.
The statistical results differ from Clemes et aI. 's, (2001) study, as in this study Age Groups
exhibited no perceptual differences of the dimensions. However, the findings agree with
Clemes et aI. 's (2001) findings that there were perceptual differences of the Academic Staff
Availability within the Major Groups. The findings are also consistent with Clemes et aI. 's
(2001) finding that there were perceptual differences of the dimensions within the ethnic
- . - . -.-............... ~---" groups. The perceptual differences within ethnic groups found in both studies are also
• - ,J_ •. _ ! consistent with other cross-cultural studies on higher education (Mai, 2005; Ford et aI., 1999) .
The statistical results showed that there were no perceptual differences between the male and
female groups, except for the perceptions of the Social Factors sub-dimension. This difference
has not been identified in previous higher education studies. The results of this study do
support those of other higher education studies that measured male and female perceptual
differences (Ham, 2003; Clemes et aI., 2001).
The significant result of perceptual differences within the Year of Study Groups revealed in
this study adds empirical support to Oldfield and Baron's (2000) research that experiences of
students and the course content received by students in different years of study would make
- 98 - ;'

,::-"-~j -~ .'-:.;-! -~=. --~ ;:a."-- ... : .. _<c-_ .... _~_ ..... "-_--"-~
their perceptions of the constructs different.
6.8 Contributions
Achieving the five research objectives of this study makes several contributions to improving
the theoretical understanding of the higher education sector. First of all, achieving Research
Objective 1 supports Cuthbert's (1996b) call for further research to revisit underlying
concepts of the dimensions of service quality in the context of higher education. This study
provides a more detailed analysis of students' perceptions of higher education and adds
additional infonnation to the existing literature in higher education. Secondly, achieving
Research Objective 2 and 3 support LeBlanc and Nguyen's (1997) recommendations to
investigate the relationship between satisfaction, service quality, price, image, and favourable
future behavioural intentions in the context of higher education. Consequently, this study
provides a more comprehensive understanding of the relationships between these constructs.
Thirdly, achieving Research Objective 4 supports Chu's (2002) contention that the derived
importance of the constructs is more important than their relative importance. Lastly,
Research Objective 5 satisfies Marzo-Navarro, Pedraja-Iglesias and Rivera-Torres's (2005)
call to analyse the demographic characteristics of students such as age, gender, ethnicity,
major, and year of study in relation to constructs such as service quality and satisfaction.
In addition, the research model that was developed for higher education context in a New
Zealand setting provides a valuable framework for higher education management to aid them
in identifying the variables that are important to students when they evaluate their university
experience.
6.8.1 Theoretical Implications The results of this study add support to the use of a hierarchical factor structure to
conceptualise and measure service quality, such as those developed by Brady and Cronin
- 99-

(2001) and Dabholkar et al. (1996). However, the three pritnary dimensions tnay not be
: -' - - -'- - ~ -- - -' generic for all service industries outside of the education sector and for different and cultures.
The prilnary dimensions identified in this study should be confirmed through the use of an
appropriate qualitative and quantitative analysis. The sub-dimensions also need to be
confirmed using an appropriate qualitative and quantitative analysis as they may vary across
industries and cultures. It is also valuable to compare the derived importance of any primary
and sub-dimensions that are identified in future research.
Academic Staff Availability was one of the service quality sub-dimension identified in the
factor solution. However, it should be noted that this sub-dimension is insignificant in the
Regression Modell (as discussed in Section 5.5.2.1). This finding is attributed to the open
office hour system that many of the Commerce lecturers include as part of their teaching
schedule. The majority of students can readily contact their lecturers under the open office
hour system and it may function more as a moderating dimension.
The study also provides a framework for understanding the effects of the three primary ,-------dimensions of service quality on several constructs including satisfaction, price, image, and
favourable future behavioural intentions. The results of this study identify service quality as
having the most influential effect on satisfaction in higher education, and the results also
suggest that service quality has an influence on the perceptions of the price (tuition fees)
being paid. The positive relationship that was identified between Service Quality and Price
may be interpreted as the higher the service quality, as perceived by students, the more willing
students are to pay a higher price (fees) for their education. It is also plausible that in the case
of higher education case, where most university students are between the ages of 18 and 24
(Ministry of Education, 2006), that students may not pay for their tuition fees or they may
only pay a portion of their tuition fees. The contribution students receive from others for their
tuition fees may result in students being less sensitive to the level of their tuition fees and
- 100-

lnore sensitive to the quality of the university's service, in particular, Outcolne Quality.
The results of this study also indicate that the perceptions of Price do not have a significant
. effect on Satisfaction. This result may be attributed to the direct measurement of Price on
Satisfaction that was used in this study. Measuring the indirect effect of Price on Satisfaction,
using a value construct in a similar modeling framework to that of Cronin et al. (2000) may ,-:-.-
.-';,. _"o~"'; _'~-..--::...:;;,..:"':
provide different results.
The impact of Image on Service Quality and Satisfaction was significant in the research
model. However, Image was much less important than Service Quality as a predicator of
Satisfaction. The image of a university is important to students. However, students obtain a
perception of their university's image from the outside community and from their personal
experiences within the university. Therefore, as students obtain more inside knowledge about
their university it is plausible that their perceptions of the university's image changes with
their experiences. These perceptual changes may not always be highly favourable and if this is
the case they may not increase the students' perceptions of their university's image.
The constructs in this study were also evaluated based on the perceptions of the demographic
groups. The ethnic group had the most perceptual differences of several of the constructs. In
particular, Asian students were less satisfied than Western students with their overall
university experiences (see Section 5.5.6). This may be attributed to the fact that their
education is obtained in a western style environment. It may be difficult for many Asian
students to adapt to a western culture and this added challenge may make them less satisfied
with their overall university experience.
Further, the Year of Study Groups also had perceptual differences· of several constructs, in
particular, the sub-dimensions pertaining to Interaction and Outcome Quality. The results
- 101 -

show that students studying in Year 3 are more satisfied with Inany of the pertaining _~,::,,-_·~,-·_,-,:,,'-_'-_-':''-::'-l~-i
sub-dimensions than those students studying in Year 2. The lecturers are often different and
the subject content changes at the two different levels. Many of the Year 2 subjects are
prerequisites for the Year 3 subjects and through this process students Inay be able to obtain a
higher understanding and appreciation of their 300 level subjects. Class sizes are also smaller
in Year 3 and students may have a more elnpathic relationship with their lecturers and peers in
Year 3 as for many students this is their final year.
6.8.2 Managerial Implications A general managerial implication highlighted in this research is that in order to achieve
sustainability in today's competitive educational environment, university management is
encouraged to apply a market-oriented approach such as those used in profit-oriented service
organisations.
In relation to Research Obj ective 1, the results of this study identified three primary
dimensions of academic service quality and ten sub-dimensions pertaining to the primary
dimensions. University management can use the hierarchical model developed in this research
for higher education in this strategic planning as the model provides a framework for
evaluating students' perceptions of service quality. However, as the dimensions of service
quality vary across industries and cultures, university managers should note that the primary
and sub-dimensional structures must be care full y developed for their own specific institution
and cultural setting to accurately measure students' perceptions of their university "_" 0".".'_--,'"\.·_->'-~""'-4>:;;.;;':;;;":;'-=-_-::.-_1
expenences.
In relation to Research Objective 2 and 3, the results provide university management with an
improved understanding of the effect that service quality, price, and image have on
satisfaction and favourable future behavioural intentions. The results of this research suggest
- 102-

that improving students' perceptions of service quality should enhance students' level of
satisfaction. Further, a higher level of satisfaction should ultilnately enhance students'
intention to attend the same university in the future and increase positive word of mouth about
the university's academic programme. In the case of the university used in this study, although
the university's itnage did not have as strong impact on satisfaction as expected, a positive
image did help to improve students' perceptions of academic service quality and improve their ... --- .. ~ -... " .... ..-.
level of satisfaction. University management should be concerned with their institution's
image and should develop and use marketing strategies that positively enhance the perception
of image in the minds of students and stakeholders.
In relation to Research Objective 4, the results of this study indicate that Interaction Quality is
the most important dimension in a higher education context, followed by Outcome Quality
and then Physical Environment Quality. When designing a measurement instrument to
evaluate students' perceptions of service quality, management should recognise that the order
of importance of the primary dimensions may vary between institutions. University
management should concentrate on the sub-dimensions under Interaction Quality and improve
the university's performance on the sub-dimensions. Resources could be allocated to the
sub-dimensions based on the empirical findings. However, the sub-dimensions pertaining to
Outcome Quality and Physical Environment Quality should also be resourced, as overall
students' perceptions of academic service quality experiences do not rely solely on staff and
student relationships.
In relation to Research Objective 5, the results (as discussed in Section 5.5.6) indicate that
there are cultural differences between Western and Asian students. University management
should be aware of the presence of perceptual differences between Western and Asian students.
University management should consider whether to adjust their service strategy to cater more
for Asian students, or to retain the current strategy that offers primarily a Western style of
- 103 -

education and encourage Asian students to adjust to the Westenl educational environment. For
exatnple, university managelnent may consider offering specialised subjects in Asian business
practices or subjects that specifically focus on marketing to Asian cultures.
6.9 Limitations
While this study provides a number of ilnportant contributions to the marketing theory and for --------... ~ ... -------~~,.--.-
higher education management, there are also some key limitations.
Firstly, this research focused solely on academic student satisfaction. There are also many
social aspects that contribute to student satisfaction and service quality in an educational
environment that this study did not measure.
Secondly, Lincoln University is considered a small higher education institution based on total
student members (approximately 3600 students), and this may limit the generalisability of
results for those higher education institutions that have large enrollments.
Thirdly, this study measured the perceptual differences between Western and Asian students
based on demographic characteristics, however, perceptual differences between Western and
Asian students based on psychographic characteristics were not identified in this study.
Fourthly, this study focused on the perceptions of students and did not measure the
perceptions of staff and other stakeholders regarding student satisfaction and the pertaining
constructs.
Lastly, the standardised coefficients are comparable against those in the same multiple
regression models, but not against other regression models. Comparisons can not be made
with the independent variables from multiple regression models based on the data collected at
other universities.
- 104-

6.10 Avenues for Future Research
A number of avenues for future research have elnerged as a result of this study:
~ Future researches could include the social aspects of education that no doubt have an
impact on overall student satisfaction.
~ Future researchers conducting students at other higher education institutions need to
develop their own hierarchical model. In addition, future researchers may wish to split
the Acadelnic Staff sub-dimension into two sub-dimensions as it is likely that this
sub-dimension will be present in most higher education studies focusing on service
quality and satisfaction.
~ Future researches may decide to concentrate more fully on psychographic differences
between Western and Asian students and the impact of these differences on perceptions
of satisfaction, service quality, image, price, and favourable future behavioural
intentions.
~ ----_. ~-.,~--~ Future researches may extend the current study and to measure the perceptions of staff
and other stakeholders regarding students satisfaction and the pertaining constructs used
in the hierarchical model.
~ Future researches could analyse the changes in the importance of dimensions as the
performance on the dimension changes. For example, a longitudinal study on students
from entrance to graduation may provide more information on their level of satisfaction
and the importance of the pertaining constructs at different stages of students'
educational experiences.
- 105 -

>- Future researchers may Ineasure post graduate students' perceptions of the constructs as
their perceptions may differ froln those of undergraduate students.
>- Future researchers could incorporate additional statistical techniques such as structural
equation modeling to confirm the path of the Inodel developed for this study.
- 106-

References: Alahassane, D., Zafar, K. U., & Curtis, V. F. (1995). Cost of quality in the new Inanufacturing
environment. Management Accounting, 77(2), 20-26.
Anderson, E. W., & Sullivan, M. W. (1993). The antecedents and consequences of customer
satisfaction for firms. Marketing Science, 12(2), 125-144.
Anderson, H. M., Moore, D. L., Anaya, G., & Bird, E. (2005). Student Learning Outcomes
Assessment: A Component of Program Assesslnent. American Journal of Pharmaceutical
Education, 69(1-5), 256.
Andreassen, T. W., & Lindestad, B. (1998). Customer loyalty and complex services: The
itnpact of corporate image on quality, customer satisfaction and loyalty for customers with
varying degrees of service expertise. International Journal of Service Industry Management,
9(1), 7.
Andrews, F. M. (1984). Construct validity and error components of survey measures: A
structural modelling approach. Public Opinion Quarterly, 48,409-422.
Armstrong, S. J., & Overton, T. S. (1977). Estimating Response Bias in Mail Surveys. Journal
of Marketing Research, 14(3), 396-402.
Athiyaman, A. (1997). Linking student satisfaction and service quality perceptions: The case
of university education. European Journal of Marketing, 31(7), 528.
Babakus, E., & Boller, G. W. (1992). An empirical assessment of the SERVQUAL scale.
Journal of Business Research, 24(3), 253-268.
Barich, H., & Kotler, P. (1991). A framework for marketing image management. Sloan
Management Review, 32(2), 94-104.
Barsky, J. D. (1992). Customer satisfaction in the hotel industry: meaning and measurement. Hospitality Research Journal, 16(1), 51-73.
- 107-

Bigne, E., Moliner, M. A., & Sanchez, J. (2003). Perceived quality and satisfaction in
lTIultiservice organisations: The case of Spanish public services. The Journal of Services
Marketing, 17(4/5), 420-443.
Bitner, M. J. (1992). Servicescapes: The impact of physical surroundings on customers and
employees. Journal of Marketing, 56(2), 57-72.
Bitner, M. 1., & Hubbert, A., R. (1994). Encounter satisfaction versus overall satisfaction
versus quality. Thousand Oaks: Sage.
Bloemer, 1., Ruyter, K. D. & Peeters, P. (1998). Investigating drivers of bank loyalty: the
complex relationship between image, service quality and satisfaction. The International
Journal of Bank Marketing 16(7),276.
Bolton, R. N., & Drew, J. H. (1991). A multistage model of customers' assessments of service
quality and value. Journal of Consumer Research, 17(4),375-385.
Boulding, W., Kalra, A., Staelin, R., & Zeithaml, V. A. (1993). A dynamic process model of
service quality: From expectations to behavioral intentions. JMR, Journal of Marketing
Research, 30(1), 7-28.
Brady, M. K. & Cronin, 1. J. J. (2001). Some new thoughts on conceptualizing perceived
service quality: A hierarchical approach. Journal of Marketing, 65(3), 34-50.
Brady, M. K. & Cronin, 1.1.1. (2002) Performance-only measurement of service quality: a
replication and extension. Journal of Business Research, 55(1),17-31.
Buttle, F. (1996). SERVQUAL: Review, critique, research agenda. European Journal of
Marketing, 30(1), 8-35.
Cardozo, R. N. (1965). An Experimental study of customer effort, expectation and satisfaction.
Journal of Marketing Research, 2(3),244-249.
Carman, J. M. (1990). Consumer perceptions of service quality: An assessment of the
SERVQUAL dimensions. Journal of Retailing, 66(1), 33-55.
- 108 -
Caruana, A., Money, A. H., & Be11hon, P. R. (2000). Service quality and satisfaction -The
moderating role of value. European Journal of Marketing, 34(11112), 1338.
Churchill, O. A., Jr. (1979). A paradigm for developing better Ineasures of marketing
constructs. JMR, Journal of Marketing Research, 16( 1), 64-73.
Churchill, O. A., Jr., & Surprenant, C. (1982). An investigation into the detetminants of
customer satisfaction. JMR, Journal of Marketing Research, 19(4),491-504.
Clemes, M., Mollenkopf, D., & Bum, D. (2000). An investigation of marketing problems
across service typologies. The Journal of Services Marketing, 14(7), 573-594.
Clemes, M. D., Ozanne, L. K., & Tram, L. (2001). An examination of students' perceptions of
service quality in higher education. Journal of Marketing for Higher Education, 10(3), 1-19.
Collins, M. J. (2005). Spectator satisfaction in professional sport: A test of a hierarchical
model: A thesis submitted in partial fulfillment of the requirements for the Degree of Master of
Commerce and Management. Lincoln University, Christchurch.
Coulthard, L. J. M. (2004). Measuring service quality- A review and critique of research using
SERVQUAL. International Journal of Market Research 46(4), 479-497. -~---"~---~.-""-~---' .
Cronbach, L. J. (1951). Coefficient alpha and the internal structure of tests. Psychometrika,
16(3), 297-333.
Cronin, J. J. J., Brady, M. K., & Hult, O. T. M. (2000). Assessing the effects of quality, value,
and customer satisfaction on consumer behavioral intentions in service environments. Journal
of Retailing, 76(2),193.
Cronin, J. J. J., & Taylor, S. A. (1992). Measuring Service Quality: A reexamination and
extension. Journal of Marketing, 56(3), 55-68.
Cronin, J. J. J., & Taylor, S. A. (1994). SERVPERF versus SERVQUAL: Reconciling
perfotmance-based and perceptions-minus-expectations measurement of service quality.
Journal of Marketing, 58(1), 125-131.
- 109-

.. • <-~<>L~:=-.. ~ ... -.-_.',-_~ ... _'.f -f..J
Crosby, L. (1991). Expanding the role ofCSM in total quality. International Journal of
Service Industry Management, 2(2),5-19.
Crosby, P. B. (1979). Quality isji~ee: The art ofmaldng quality certain. New York: New
Alnetican Library.
Cuthbert, P. F. (1996a). Managing service quality in HE: is SERVQUAL the answer? Part 1.
Managing SenJice Quality, 6(2), 11.
Cuthbert, P. F. (1996b). Managing service quality in HE: is SERVQUAL the answer? Part 2.
Managing Service Quality, 6(3), 31.
Dabholkar, P. A., Thorpe, D. I., & Rentz, J. O. (1996). A measure of service quality for retail
stores: Scale development and validation. Academy of Marketing Science. Journal, 24(1),
3-16.
DeShields, O. W. J., Kara, A., & Kaynak, E. (2005). Detenninants of business student
satisfaction and retention in higher education: applying Herzberg's two-factor theory. The
International Journal of Educational Management, 19(2/3), 128-139.
Dielman, T. E. (2001). Applied regression analysis for business and economics (3 rd ed.).
Duxbury: Thomson Learning.
Drexler, J. A. J., & Kleinsorge, I. K. (2000). Using total quality processes and learning
outcome assessments to develop management cumcula. Journal of Management Education,
24(2), 167-182.
Edvardsson, B., & Gustvasson, B. (1991). Quality in services and quality in service
organizations: A model for quality assessment. In S. W. Brown, E. Gummesson, B.
Edvardsson & B. Gustvasson (Eds.), SenJice quality: Multidisplinary and multinational
perspectives (319-340). New York: Lexington Books.
Ewell, P. T. (1994). A matter ofintegtity: Accountability and the future of self-regulation
Change, 26(6), 24-39.
- 110-

Ford, J. B., Joseph, M., & Joseph, B. (1999). Itnportance-perfomlance analysis as a strategic
tool for service tnarketers: the case of service quality perceptions of business students in New
Zealand and the USA. The Journal of Services Marketing, 13(2), 171.
Gardiner, L. F., Anderson, C., & Cambridge, B. L. (1997). Learning through assessment:
resource guide for higher education Washington, DC: American Association for Higher
Education.
Garson, G. D. (2006). Statnotes: Topics in multivariate analysis. Retrieved from:
http://www2.chass.ncsu.edu/garsonipa765/statnote.htm
Gavin, D. A. (1983). Quality on the line. HanJard Business Review, 64,65-73.
Giese, J. L., & Cote, J. A. (2000). Defining consumer satisfaction. Academy of Marketing
Science Review, 2000, 1.
Gilmour, P. (1977). Marketing Transport Services. European Journal of Marketing 11(6),
383-389.
Greenbaum, T. L. (1998). The Handbookfor Focus Group Research (2nd ed.). London: Sage.
Gronroos, C. (1978). A service-oriented approach to marketing of services. European Journal
of Marketing, 12(8),·588-601.
Gronroos, C. (1982). An applied service marketing theory. European Journal of Marketing,
16(7), 30-41.
Gronroos, C. (1984). A service quality model and its marketing implications. European
Journal of Marketing, 18(4),36.
Gummesson, E. (1991). Service Quality: A Holistic View. In S. W. Brown, E. Gummesson, B.
Edvardsson & B. Gustavsson (Eds.), Service Quality: Multidisciplinary and Multinational
Perspectives (3-22). New York: Lexington Books.
Guolla, M. (1999). Assessing the teaching quality to student satisfaction relationship: Applied
customer satisfaction research in the classroom. Journal of Marketing Theory and Practice,
7(3), 87-97.
- III -

Hair, J. F., Anderson, R. E., Tatham, R. L., & Black, W. C. (1998). Multivariate Data Analysis
(5 ed.). New Jersey: Prentice Hall.
Hair, J. F. J., Bush, R. P., & Ortinau, D. J. (2000). Market research: A practical approachfor
the new millenniuril. Singapore: McGraw-Hill.
Ham, C. L. (2003). Analyzing the value of service quality management: Gaining competitive
advantages. International Journal of Value - Based Management, 16(2), 131-152.
Hauser, J. R., Urban, G. L., (1986). The Value Priority Hypotheses for Consumer Budget
Plans. Journal of Consumer Research 12(4), 446-463
Hill, C., Griffiths, W., & Judge, G. (1997). Undergraduate Econometrics New York: Wiley.
Hunt, H. K. (1977). CS/D- Overview and future research directions. In H. K. Hunt (Eds.)
Conceptualisations and measurement of consumer satisfaction (455-488) Cambridge, MA:
Marketing Science Institute.
Iacobucci, D., Grayson, K. A., & Ostrom, A. L. (1994). The calculus of service quality and
consumer satisfaction: Theoretical and empirical differentiation and integration (Vol. 3). CT:
JAI Press.
International Policy and pevelopm~nt Unit (Ed.). (2002). Foreign fee-paying students
statistics to 2001. Wellington: Ministry of Education. Retrieved from:
http://educationcounts.edcentre.govt.nz/publications/downloads/ffp-students-report-2001.pdf
Jacoby, J., Olson, 1. C., & Haddock, R. A. (1971). Price, brand name and product composition
characteristics as determinants of perceived quality. Journal of Applied Psychology, 55(6),
570-579.
Kiefer, N. M., & Kelly, T. J. (1995). Price recollection and perceived value in restaurants.
Cornell Hotel and Restaurant Administration Quarterly, 36(1),47-50.
Kotler, P. (1972). A generic concept of marketing. Journal of Marketing, 36(2),46-54.
Kotler, P., & Fox, K. (1995). Strategic marketing in educational institutions (2nd ed.). New
Jersey: Englewood Cliffs.
- 112 -

LeBlanc, G., & Nguyen, N. (1997). Searching for excellence in business education: an
exploratory study of customer iInpressions of service quality. Th"e International Journal of
Educational Management, 11(2), 72.
LeBlanc, G., & Nguyen, N. (1999). Listening to the customer's voice: Exatnining perceived
service value among business college students. The International Journal of Educational
Management, 13(4), 187.
Liu, C.-M. (2005). The multidimensional and hierarchical structure of perceived quality and
customer satisfaction. International Journal of Management, 22(3),426-436.
Lovelock, C. H. (1981). Why marketing management needs to be different for services. In 1.
H. Donnelly & W. R. George (Eds.), Marketing of Services. Chicago, IL: American Marketing
Association.
Lovelock, C. H. (1983). Classifying services to gain strategic marketing insights. Journal of
Marketing, 47(3), 9-20.
Maddala, G. S. (2001). Introduction to Econometrics (3 rd ed.). New York: Wiley.
Mai, L.-W. (2005). A comparative study between UK and US: The student satisfaction in --. ~'- "'" ... _---_ .. -- --"
higher education and its influential factors. Journal of Marketing Management, 21(7), pp 859.
Mano, H., & Oliver, R. L. (1993). Assessing the dimensionality and structure of the
consumption experience: Evaluation, feeling, and satisfaction. Journal of Consumer Research,
20(3), 451-466.
Marzo-Navarro, M., Pedraja-Iglesias, M., & Rivera-Torres, M. P. (2005). Measuring customer
satisfaction in summer courses. Quality Assurance in Education, 13(1), 53.
McDougall, G. H. G., & Levesque, T. J. (1994). A revised view of service quality dimensions:
An empirical investigation. Journal of Professional Services Marketing, 11(1), 189.
McDougall, G. H. G., & Levesque, T. 1. (2000). Customer satisfaction with services: Putting
perceived value into the equation. The Journal of Services Marketing, 14(5), 392.
- 113 --. .' ~

McAlexander, J. H., Kaldeberg, D. O. & Koening, H. F. (1994). Service quality measurement.
Journal of Health Care Marketing, 14(3), 34-40.
Ministry of Education (1997). Afilfure tertiary education policy for New Zealand: Tertiary
review: Overview. Wellington: Ministry of Education.
Ministry of Education (2004). Tertiary Education Strategy. Wellington: Ministry of
Education.
Ministry of Education (Ed.) (2005). The New Zealand International Education Sector - Trends
from 1999 to 2004. Retrieved From:
http://www.minedu.govt.nz/web/downloadable/dll 0947 vllnz-ie-trends-report--1999---2004.
rulf· Ministry of Education (Ed.) (2006). OCED Thematic Review ofTertialY Education Wellington:
Ministry of Education. Retrieved From:
http://educationcounts.edcentre.govt.nz/publications/downloads/oecd-thematic-report.pdf
Molenaar, N. J. (1982). Response effects in 'formal' characteristics of questions. In W.
Dijkstra & J. V. d. Zouwen (Eds.). Response Behaviour and the Survey Interview. New York:
Academic Press.
Mundfrom, D. J., Shaw, D. G., & Ke, T. L. (2005). Minimum sample size recommendations
for conducting factor analyses. International Journal of Testing, 5(2), 159-168.
Mustafa, S. T., & Chiang, D. (2006). Dimensions of quality in higher education: How
academic performance affects university students' teacher evaluations. Journal of American
Academy of Business, Cambridge, 8(1), 294.
Victoria University of Wellington, Department of Education (1996). New Zealand annual
review of education. Wellington: Department of Education, Victoria University of Wellington.
Nguyen, N., & LeBlanc, G. (1998). The mediating role of corporate image on customers'
retention decisions: an investigation in financial services. The International Journal of Bank
Marketing, 16(2), 52.
- 114-

Nguyen, N., & LeBlanc, G. (2001). Image and reputation of higher education institutions in
students' retention decisions. The International Journal of Educational Management, J5( 6/7),
303-311.
Oldfield, B. M., & Baron, S. (2000). Student perceptions of service quality in a UK university
business and management faculty. Quality Assurance in Education, 8(2), 85.
Oliver, R. L. (1981). Measurement and Evaluation of Satisfaction Processes in Retail Settings.
Journal of Retailing, 57(3), 25-48.
Oliver R. L. (1993) A conceptual model of service quality and service satisfaction.
Compatible goals, different concepts. In T.A. Swartz, D. E. Bowen and S.W. Brown (Eds.),
Advances in service marketing and management: research and practice Vol. 2 Greenwich CT:
JAI.
Olshavsky, R. W. (1985). Perceived quality in consumer decision making: An integrated
theoretical perspective. In R. T. Rust & R. L. Oliver (Eds.), Service Quality: New Directions
in Theory and Practice. Thousand Oaks: Sage Publications.
Pace, C. R., & Kur, G. D. (1998). College student experiences questionnaire (4th ed.). Centre
for Postsecondary Research and Planning, Indiana University School of Education:
Bloomington.
Palacio, A. B., Meneses, G. D., & Perez, P. J. P. (2002). The configuration of the university
image and its relationship with the satisfaction of students. Journal of Educational
Administration, 40(4/5),486-505.
Parasuraman, A., Zeithaml, V. A., & Berry, L. L. (1985). A conceptual model of service
quality and its implications for future research. Journal of Marketing, 49(4),41-50.
Parasuraman, A., Zeithaml, V. A., & Berry, L. L. (1988). SERVQUAL: A multiple-item scale
for measuring consumer perceptions of service quality. Journal of Retailing, 64(1), 12-37.
- 115-

Parasuraman, A., Zeithan11, V. A., & Beny, L. L. (1994). Reassessment of expectations as a
cOlnparison standard in measuring service quality: Implications for fmiher research. Journal
of Marketing, 58(1),111-124.
Rathmell, 1. M. (1966). What Is Meant by Services? Journal of Marketing, 30(4), 32-36.
Rust, R. T., & Oliver, R. L. (1994). Service quality: Insights and managerial implications from
the frontier. In R. T. Rust & R. L. Oliver (Eds.), Service quality: New Directions in theolY and· .. -
~_,,~~ __ ... ~_+~"':_""' __ L~
practice (pp. 1-19): Thousand Oaks: Sage Publications.
Rust, R. T., Zahorik, A. J., & Keiningham, T. L. (1995). Return on quality (ROQ): Making
service quality financially accountable. Journal of Marketing, 59(2), 58-70.
Sahney, S., Banwet, D. K., & Karunes, S. (2004). A SERVQUAL and QFD approach to total
quality education: A student perspective. International Journal of Productivity and
Pelformance Management, 53(112), 143-166.
Scott, D. (2005). How long do people spend in tertiary education? Wellington: Ministry of
Education.
Segar, A. (2001,2/26/03). Predictors of student gains: The College Student Experience
Questionnaire (CSEQ) at Elizabethtown College, Spring 2001. Retrieved from:
http://www2.etown.edu/collegelife/Assessment/CSEQ/Summary.htm
Shostack, G. L. (1977). Breaking free from product marketing. Journal of Marketing, 41(2),
73-80.
Smith, A. M. (1995). Measuring service quality: Is SERVQUAL now redundant? Journal of
Marketing Management, 11,257-276.
Soutar, G., & McNeil, M. (1996). Measuring service quality in a tertiary institution. Journal of
Educational Administration, 34(1), 72.
Steenkamp, J. E. M. (1989). Product quality: An investigation into the concept and how it is
perceived by consumers. Assen, The Netherlands: Van Gorcum.
- 116-

. - . : .. :<a_d...;..~;~a .~'~"-i
~--·-""j""-:-=-'-'-~I I
' .. !
,. ·,-1
Stewart, D. W. (1981). The application and Inisapplication of factor analysis in Inarketing
research. Journal of Marketing Research, 18( 1), 51-62.
Sureshchandar, G. S., Chandrasekharan, R., & Anantharaman, R. N. (2002). The relationship
between service quality and customer satisfaction - A factor specific approach. The Journal of
Services Marketing, 16(4),363-379.
Tam, M. (2006). Assessing quality experience and learning outcomes. Quality Assurance in
Education, 14(1), 75-87.
Tellis, G .. J. and Gaeth, G .. J. (1990). Best value, price-seeking, and price aversion: the impact
of information and learning on consumer choices. Journal of Marketing, 54(2), 34-46
Tertiary Sector Performance Analysis and Reporting (2004). Tertiary Education Strategy
2002-2007- Baseline Monitoring Report, Ministry of Education. Wellington: Ministry of
Education. Retrievable from:
http://educationcounts.edcentre.govt.nz/publications/ downloads/published-baseline-report -we
b-version.pdf
Tse, D. K., & Wilton, P. C. (1988). Models of consumer satisfaction formation: An extension.
JMR, Journal of Marketing Research, 25(2),204-212.
Ueltschy, L., C., & Krampf, R., F. (2001). Cultural sensitivity to satisfaction and service
quality measures. Journal of Marketing Theory and Practice, 9(3), 14-31.
Van Dyke, T. P., A., K. L., & Prybutok, V. R. (1997). Measuring information systems service
quality: Concerns on the use of the SERVQUAL questionnaire. MIS Quarterly, 21(2),
195-208 ..
Westbrook, R. A. (1987). Product/consumption-based affective responses and postpurchase
processes. JMR, Journal of Marketing Research, 24(3), 258-270.
Yi, Y. (1990). Cognitive and affective priming effects of the context for print advertisements.
Journal of Advertising, 19(2), 40-48.
- 117-

Yuille, J. c., & Catchpole, M. J. (1977). The role of imagery in models of cognition. Journal
of MentalImagelY 1, 171-180.
Zeithaml, V. A. (1988). Consumer perceptions of price, quality, and value: a means-end model
and synthesis of evidence. Journal of Marketing. 52(3),2-20.
Zeithaml, V. A., Berry, L. L., & Parasuraman, A. (1996). The behavioral consequences of
service quality. Journal of Marketing. 60(2), 31-46.
- 118 -

Appendices Appendix 1: Cover Letter
10/07/2006
Dear students,
Commerce Division
PO Box. 84. lincoln University. Canterbury 8150, New Zealand
Telephone 643325·2811 Fac!>imile 643325·3847
www.tincoln.ac.nz
I am a Master's Degree studerit at Lincoln ,University in Christchurch. My research project involves asking people about their perceptions of their university~xperienceil1 New Zealand. You are invited to participate in this survey. .
. ,- .. I ask your help with my project. Attached is a brief questiolmaire. which should only take about 10 to 15 minutes, and your answers will be completelyanonymous and confidential. This research is completely voluntary in nature. However, in ordei·to qualify forthis research, you must be a 200 level or 300 level student studying a commerce degree and at least 18 years old. This research is for my postgraduate research only; and it does not relate to Teaching and Learning Service's Subject or Lecturer evaluations. This research has been reviewed and approved by the Lincoln University Human Ethics Committee.
Please return the completed questionnaire in the enclosed postage-paid envelope. 1 \\lm be pleased to discuss allY concerns you have about your participation in the research. I can be contacted by telephoning (03) 3513568, or by [email protected]. You can also contact my supervisors Mr. Michael D. Clemes andior Mr. Christopher Gan. Mr. Michael D. Clemes can be contacted at (03) 3252811 (ext 8364) or c1emesuv]jncoln.ac.nz and Mr. Christopher Gan can be contacted at (03) 3282811 (ext 8155) or ganc1011incoln.ac.l1Z.
Again, your assistance will contribute greatly to the success of my research. Each and every response is important and I appreciate your \villingness to help. Thank you vcry much.
Yours sincerely,
Betty Kao Master of Commerce and Management Student
• A(coumilli) • Busi;,.,ss M;tnitgement & en'" • £conomks • Fin~nce • Marketing· P'(lpertySt(!d!es
- 119 -

"::"_"_.- .. __ -,\.-_·c
,,-• .-_~~:-...... ,--,:~",:r-_"'_ -, ... _"C--:_-_-_1o£.~" ... ",: .. _-"':
-'- --."--.. ~". -~ - --,
0- •• _ ~ __ ~ • - _ •
~ ... _ .. _ ..... '_r_o._- .' ....... "',
-"": ... :-'::.."': .... : .. .: .. :.-~ -~-::: .... :~ :.:' _-_-.... " _._-_-_-_-.... _~..J
L. _____ ,
:...~ .. ~~~-.,-----.. -~-.. -... -
Appendix 2: Questionnaire
A SURVEY OF UNIVERSITY STUDENTS' ACADEMIC EXPERIENCES IN HIGHER EDUCATION
QUESTIONNAIRE FOR POSTGRADUATE RESEARCH
ll1is questionnaire is for postgraduate research only and it does not relate to Teaching and Leanling Services's Subject or Lecturer Evaluations.
This questionnaire contains section A to E. Please answer all the questions in each section. Below is a series of statements that pertain to your overall university experiences at Lincoln University. On a scale of 1 (strongly agree) to 7 (strongly disagree), please indicate your responses.
Section A Strongly Strongly Not Agree Disagree Applicable
Lecturers and support staff (e.g. tutors) are polite and courteous 1 2 3 4 5 6 7 N/A 2 I have the opportunity to participate in class discussions 2 3 4 5 6 7 N/A 3 I feel comfortable approaching and talking to lecturers 2 3 4 5 6 7 N/A 4 Lecturers have extensive knowledge of their subjects 2 3 4 5 6 7 N/A 5 Lecturers have good teaching ability 2 3 4 5 6 7 N/A
6 Classes are well prepared and organised 2 3 4 5 6 7 N/A 7 Lecturers and support staff are concerned about student welfare and interests 2 3 4 5 6 7 N/A 8 Lecturers and support staff are willing to help with students' concerns 2 3 4 5 6 7 N/A 9 Marked assignments are returned from lecturers and/or support staff 2 3 4 5 6 7 N/A
at a promised time 10 Lecturers provide convenient office hours 2 3 4 5 6 7 N/A
11 I can contact lecturers with minimum difficulty 2 3 4 5 6 7 N/A 12 Administration staff are courteous 2 3 4 5 6 7 N/A 13 Administration staff are sympathic and reassuring when helping students 2 3 4 5 6 7 N/A 14 Administration staff solve my problems at a promised time 2 3 4 5 6 7 N/A
15 Overall, the quality of the interactions with all employees involved 2 3 4 5 6 7 N/A in Lincoln University is excellent
- 120 -
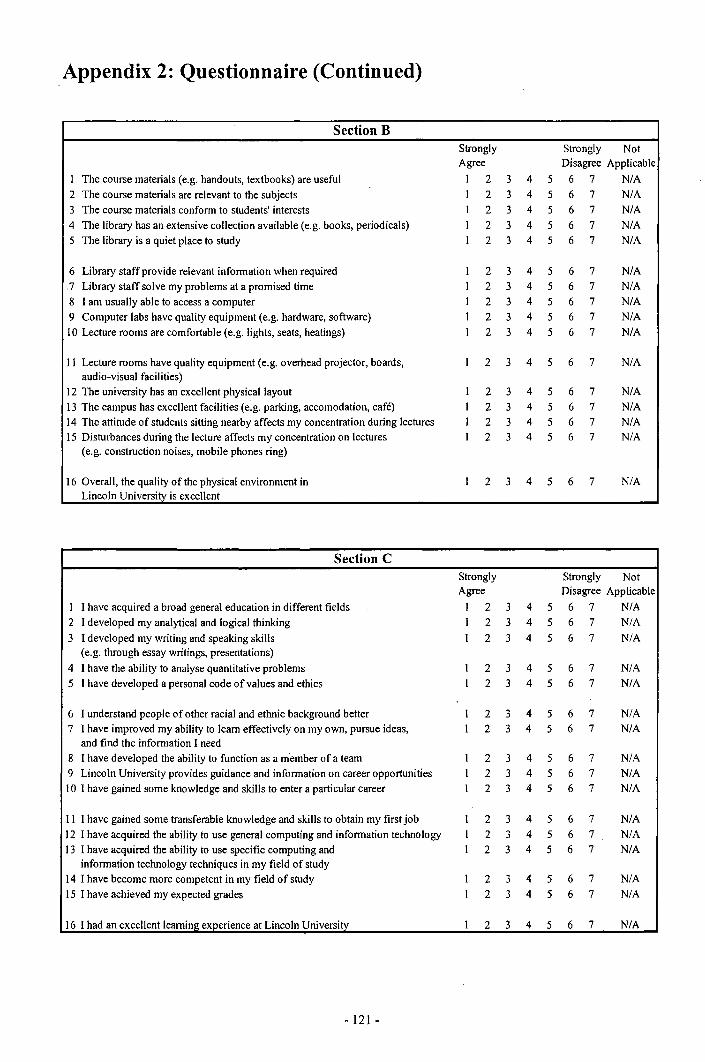
....
"~.'.~-<-~."'-.<'.~-"-"-'-' Appendix 2: Questionnaire (Continued)
.o.- .... -:o-' .. : .. --.~_~-~-.,
Section B Strongly Strongly Not Agree Disagree Applicable
The course materials (e.g. handouts, textbooks) are useful I 2 3 4 5 6 7 N/A 2 The course materials are relevant to the subjects 2 3 4 5 6 7 N/A 3 The course materials confonn to students' interests 2 3 4 5 6 7 N/A 4 The library has an extensive collection available (e.g. books, periodicals) 2 3 4 5 6 7 N/A
-.. ..:;~ .... -... -... --=-.:--_J_ 5 The library is a quiet place to study 2 3 4 5 6 7 N/A
------------"_-....... • ___ L' ...... _--.-." •• _,
6 Library staff provide relevant infonnation when required 2 3 4 5 6 7 N/A ..-' ..... -.--- ... -"-~,,-:.~- "-~ ... ' .7 Library staff solve my problems at a promised time 2 3 4 5 6 7 N/A ~-": ............. ---..... ...: ... ,.: ...
8 I am usually able to access a computer 2 3 4 5 6 7 N/A 9 Computer labs have quality equipment (e.g. hardware, software) 2 3 4 5 6 7 N/A 10 Lecture rooms are comfortable (e.g. lights, seats, heatings) 2 3 4 5 6 7 N/A
11 Lecture rooms have quality equipment (e.g. overhead projector, boards, 2 3 4 5 6 7 N/A ~ -" -~ -' .. -- '"-- - ....... audio-visual facilities)
12 The university has an excellent physical layout 2 3 4 5 6 7 N/A ...,:.::-...:. -~ -:..~~-~=-- ":.'-:<.
13 The campus has excellent facilities (e.g. parking, accomodation, cafe) 2 3 4 5 6 7 N/A 14 The attitude of students sitting nearby affects my concentration during lectures 2 3 4 5 6 7 N/A 15 Disturbances during the lecture affects my concentration on lectures 2 3 4 5 6 7 N/A
(e.g. construction noises, mobile phones ring)
16 Overall, the quality of the physical environment in 2 3 4 5 6 7 N/A Lincoln University is excellent
Section C Strongly Strongly Not
- ~ - - - -- .. --- Agree Disagree Applicable I have acquired a broad general education in different fields I 2 3 4 5 6 7 N/A
2 I developed my analytical and logical thinking 2 3 4 5 6 7 N/A 3 I developed my writing and speaking skills 2 3 4 5 6 7 N/A
(e.g. through essay writings, presentations) 4 I have the ability to analyse quantitative problems 2 3 4 5 6 7 N/A
:' - ~. --" -;.. ~",--;."""-'.:. -.. , 5 I have developed a personal code of values and ethics 2 3 4 5 6 7 N/A
6 I understand people of other racial and ethnic background better 2 3 4 5 6 7 N/A 7 I have improved my ability to learn effectively on my own, pursue ideas, 2 3 4 5 6 7 N/A
and find the infonnation I need 8 I have developed the ability to function as a member of a team 2 3 4 5 6 7 N/A 9 Lincoln University provides guidance and infonnation on career opportunities 2 3 4 5 6 7 N/A 10 I have gained some knowledge and skills to enter a particular career 2 3 4 5 6 7 N/A
~ ... _~-'.:."' ... ~..:~~ ... >._.,...._ ... ...:;l
4 ... .:.:: ... :~>-_...:_-...;...,·.:--: ... II I have gained some transferable knowledge and skilIs to obtain my first job 2 3 4 5 6 7 N/A 12 I have acquired the ability to use general computing and infonnation technology 2 3 4 5 6 7 N/A 13 I have acquired the ability to use specific computing and 2 3 4 5 6 7 N/A
infonnation technology techniques in my field of study 14 I have become more competent in my field of study 2 3 4 5 6 7 N/A 15 I have achieved my expected grades 2 3 4 5 6 7 N/A
16 I had an excelIent learning experience at Lincoln University 2 3 4 5 6 7 N/A
,,-. .. -: .. -"' ... "'\,.,~ .. T'b--... - ..... ~,..
- 121 -

,,' :
t--~_;'':~!-.;<l'.~~o(_~a'')
!".:_~ .. ~_.::.r..:.;.~~& ...... :.
.... _f'.- ......... • :~_-_-_-_.
~:c:.::.':<_-::-.:.-.:.,:t:::,.
-J.-!-'-!_"~'J';-=~'
.... ". '. w, '. _." __ .". _. ~
- - ... --- - <-,-,~. ,-.--
Appendix 2: Questionnaire (Continued)
Section D
Lincoln University provides excellent service quality 2 The quality of Lincoln University could be considered superior
when compared to other universities 3 Attending Lincoln University is a satisfying experience 4 Overall, I am satisfied with my decision to study at Lincoln University
5 My feelings toward Lincoln University can best be characterised as ...
6 Overall, I thought that the quality of Lincoln University was ...
7 I have always had a good impression of Lincoln University 8 In my opinion, Lincoln University has a good image in the minds of students 9 In general, I believe that Lincoln University always
fulfills the promises it makes to students 10 Lincoln University has a good reputation 11 The tuition fee is reasonable, given the quality of education 12 Lincoln University provides good value for money
What is your gender?
2 What is your age?
Section E o Male
018-24 033-40
Strongly Agree
1 2 3 I 2 3
2 3 2 3
Very Dissatisfied
2 3 Poor
2 3
Strongly Agree
1 2 3 2 3 2 3
2 3 2 3 2 3
Strongly Not Disagree Applicable
4 5 6 7 N/A 4 5 6 7 N/A
4 5 6 7 N/A 4 5 6 7 N/A
Very Satisfied
4 5 6 7 Excellent
4 5 6 7
Strongly Not Disagree Applicable
4 5 6 7 N/A 4 5 6 7 N/A 4 5 6 7 N/A
4 5 6 7 N/A 4 5 6 7 N/A 4 5 6 7 N/A
o Female
025-32 041+
3 What is your ethnicity? o NZ European 0 NZ Maori 0 Pacific Islander o European 0 Asian o Other (Please Specify)
4 What is your major? o Accounting o Business Management o E-Commerce o Economic o International Business o Property Studies o Tourism Management
5 What is your year of study? o 2nd Year (200 level)
Very Unlikely
6 How likely is it that you would go to Lincoln University 1 2 if you could start over again?
7 8
How likely are you to choose Lincoln University if you do future studies? 2 How likely are you to recommend Lincoln University to family and friends? 2
o Agnbusiness o Computing o Finance o Hospitality Management o Marketing o Supply Chain Management
o 3rd Year (300 level)
Very Likely
3 4 5 6 7
3 4 5 6 7 3 4 5 6 7
fJ'/ian/tyou very mucli for your time. Wisliing you a very goocf cfay!
- 122-

Appendix 3: Data Imputation
Table 23A: Separate T-Tests Results
aOI a02 a03 a04 a05 a06 a07 a08 a09 al0 all a12 a13 a14 a15 t -1.28 -0.46 -0.33 -0.45 -0.36 0.10 -0.95 -0.80 -0:48 0.84 1.11 -0.19 0.20 -0.13
df 12.75 12.39 13.19 13.01 13.44 12.71 11.40 12.25 9.50 11.77 14.05 11.42 10.81 11.67 P(2-tail) 0.22 0.65 0.75 0.66 0.72 0.92 0.36 0.44 0.64 0.42 0.29 0.85 0.84 0.90
a14 # Present 211 211 211 211 211 211 211 211 208 211 211 211 210 211 210 # Missing 12 12 12 12 12 12 II 12 10 II 10 10 10 0 II
Mean(Present) 2.38 2.66 2.57 2.21 2.73 2.53 3.03 2.62 2.65 2.82 2.60 2.75 2.86 3.00 2.87 Mean(Missing) 2.75 2.83 2.67 2.33 2.83 2.50 3.36 2.92 2.90 2.55 2.40 2.80 2.80 2.91
t 0.29 -0.77 -0.82 -0.70 0.27 -0.17 0.92 0.67 1.29 0.41 0.69 -0.64 -0.15 -0.01 -0.35 df 13.79 11.91 12.68 12.57 13.75 12.23 11.23 12.44 12.54 10.88 11.17 13.74 11.42 7.59 12.05
P(2-tail) 0.77 0.45 0.43 0.50 0.79 0.87 0.38 0.51 0.22 0.69 0.50 0.53 0.88 0.99 0.73 b7 # Present 211 211 211 211 211 211 211 211 206 211 210 209 209 203 209
# Missing 12 12 12 12 12 12 11 12 12 11 II 12 11 8 12 Mean(Present) 2.40 2.65 2.56 2.21 2.74 2.53 3.07 2.65 2.69 2.82 2.60 2.74 2.86 3.00 2.87 :..L~: .. ~::....,! .:-:~=."-"
.. jJ'_ • ...r:-~~J_~_.-.r_~
MeanCMissing) 2.33 3.00 2.83 2.42 2.67 2.58 2.73 2.42 2.25 2.64 2.36 2.92 2.91 3.00 3.00 t 0.00 -2.31 -0.94 -0.51 -0.36 -0.54 -1.16 -0.45 0.90 -1.72 -0.69 -0.39 -0.71 -0.01 -1.45
df 15.25 15.23 14.87 15.10 15.52 15.07 15.54 15.39 14.53 14.90 14.02 16.46 15.39 15.05 14.00 P(2-tail) 1.00 0.04 0.36 0.62 0.72 0.60 0.26 0.66 0.38 0.11 0.50 0.70 0.49 0.99 0.17
ell # Present 208 208 208 208 208 208 207 208 204 207 207 206 206 197 207 # Missing 15 15 15 15 15 15 15 15 14 15 14 15 14 14 14
Mean(Present) 2.40 2.60 2.54 2.21 2.73 2.51 3.02 2.63 2.69 2.75 2.57 2.74 2.84 2.99 2.84 Mean(Missing) 2.40 3.60 3.00 2.40 2.87 2.73 3.47 2.80 2.36 3.60 2.86 2.87 3.07 3.00 3.43
t 1.24 1.64 -0.63 -0.46 0.07 1.23 -1.74 -0.02 -0.08 -1.24 0.72 -0.36 -0.15 -0.47 0.61 df 17.01 15.91 14.65 14.60 15.26 15.51 14.25 15.76 13.51 13.95 16.61 13.70 12.90 13.93 15.53
P(2-tail) 0.23 0.12 0.54 0.65 0.94 0.24 0.10 0.98 0.94 0.23 0.48 0.72 0.89 0.65 0.55 SPSQ # Present 209 209 209 209 209 209 208 209 205 208 207 207 207 197 207
# Missing 14 14 14 14 14 14 14 14 13 14 14 14 13 14 14 Mean(Present) 2.42 2.70 2.56 2.21 2.74 2.55 3.00 2.64 2.66 2.77 2.60 2.74 2.86 2.98 2.88 Mean(Missing) 2.14 2.21 2.79 2.36 2.71 2.21 3.71 2.64 2.69 3.36 2.43 2.93 2.92 3.21 2.71
bOl b02 b03 b04 b05 b06 b07 b08 b09 blO bll bl2 bl3 b14 bl5 b16 t 1.68 2.74 0.38 1.13 2.72 0.61 -0.88 -0.60 1.58 -0.87 0.65 0.12 0.52 0.56 0.78 1.17
df 14.54 14.46 13.08 12.32 14.64 15.94 8.56 12.17 13.02 12.64 11.99 12.49 14.15 12.02 12.51 13.18 P(2-tail) 0.11 0.02 0.71 0.28 0.02 0.55 0.40 0.56 0.14 0.40 0.53 0.91 0.61 0.59 0.45 0.26
a14 # Present 211 211 211 210 210 208 203 209 210 210 211 211 210 207 210 211 # Missing 12 12 11 II 12 12 8 12 12 12 12 12 12 12 12 12
Mean(Present) 2.54 2.44 3.00 2.88 3.34 2.71 2.85 3.03 2.97 3.26 2.76 2.96 3.42 3.00 2.90 2.98 Mean(Missing) 2.17 1.83 2.91 2.55 2.50 2.58 3.13 3.33 2.42 3.58 2.50 2.92 3.25 2.75 2.58 2.67
t 0.62 0.53 -0.03 3.62 1.85 1.54 -0.69 0.26 -0.45 -0.20 -0.25 0.72 0.70 1.37 0.35 df 12.50 12.53 12.02 13.40 11.53 10.27 11.19 12.24 11.75 11.80 11.55 12.25 10.65 12.38 11.90
P(2-tail) 0.55 0.60 0.98 0.00 0.09 0.15 0.50 0.80 0.66 0.85 0.80 0.49 0.50 0.19 0.73 b7 # Present 211 211 210 210 211 211 211 210 210 210 211 211 210 208 210 211
# Missing 12 12 12 11 11 9 0 II 12 12 12 12 12 11 12 12 Mean(Present) 2.53 2.42 2.99 2.91 3.34 2.72 2.86 3.03 2.95 3.27 2.74 2.95 3.43 3.01 2.92 2.97 Mean(Missing) 2.33 2.25 3.00 2.00 2.55 2.33 3.36 2.83 3.50 2.83 3.08 3.08 2.64 2.33 2.83
t -0.74 -0.98 -1.17 -0.77 -0.51 -0.11 0.10 -1.94 -1.52 -1.03 -0.70 -1.93 -1.56 -1.50 -0.38 -1.70 df 16.04 16.53 15.98 14.63 14.02 11.88 10.79 14.50 15.31 15.18 15.41 15.35 14.31 12.56 14.05 15.87
P(2-tail) 0.47 0.34 0.26 0.45 0.62 0.91 0.93 0.07 0.15 0.32 0.50 0.07 0.14 0.16 0.71 0.11 ell # Present 208 208 207 207 208 208 200 207 207 207 208 208 208 206 208 208
# Missing 15 15 15 14 14 12 11 14 15 15 15 15 14 13 14 15 Mean(Present) 2.50 2.39 2.97 2.85 3.28 2.70 2.87 2.99 2.89 3.25 2.73 2.90 3.36 2.94 2.88 2.93 Mean(Missing\ 2.73 2.67 3.33 3.14 3.57 2.75 2.82 3.93 3.60 3.73 3.00 3.67 4.14 3.85 3.07 3.47
t -1.26 -0.07 -0.59 0.59 -0.55 -0.36 -0.15 0.83 -0.11 -0.18 0.56 -0.12 -0.40 -1.13 0.45 -0.10 df 15.30 14.75 14.03 14.53 14.21 13.07 13.31 15.08 13.83 14.24 14.81 14.36 14.91 14.50 14.79 14.02
P(2-tail) 0.23 0.95 0.56 0.56 0.59 0.72 0.88 0.42 0.91 0.86 0.58 0.90 0.69 0.28 0.66 0.93 SPSQ # Present 209 209 208 207 208 207 198 207 208 208 209 209 208 205 208 209
# Missing 14 14 14 14 14 13 13 14 14 14 14 14 14 14 14 14 Mean(Present) 2.50 2.41 2.98 2.88 3.28 2.70 2.86 3.07 2.94 3.27 2.76 2.95 3.40 2.96 2.90 2.96 MeanCMissing) 2.86 2.43 3.21 2.64 3.57 2.85 2.92 2.71 3.00 3.36 2.57 3.00 3.57 3.43 2.71 3.00
- 123 -
)
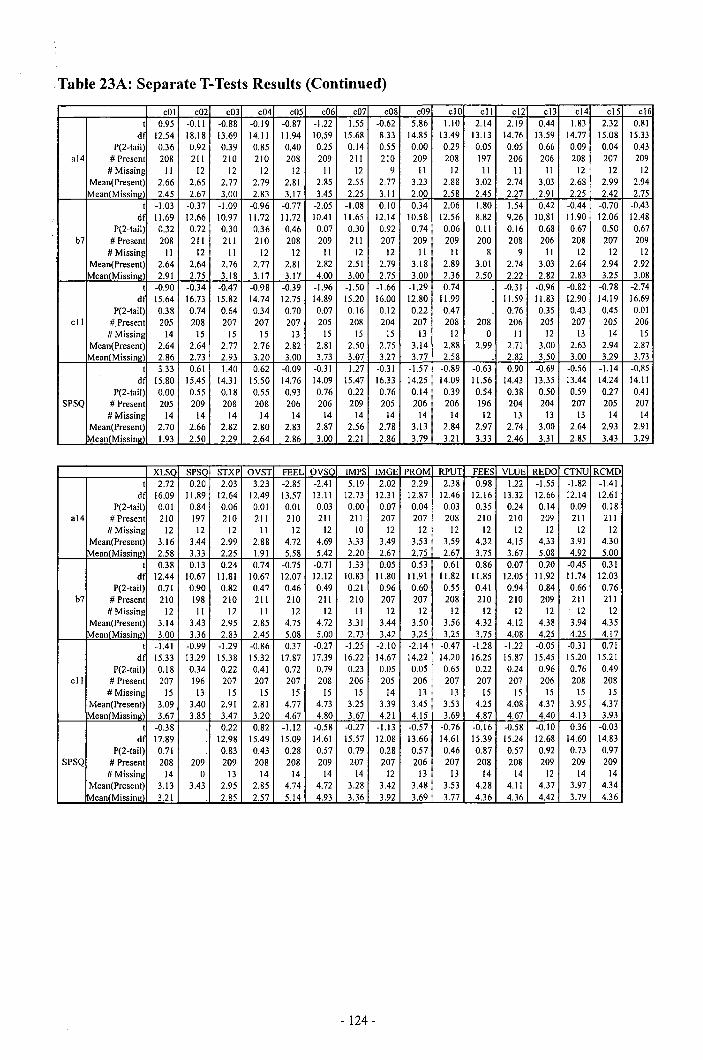
,Table 23A: Separate T-Tests Results (Continued) ' .. - ~~
cOl cO2 c03 c04 c05 c06 c07 c08 c09 clO ell c12 cl3 c14 c15 cl6 t 0.95 -0.11 -0.88 -0.19 -0.87 -1.22 1.55 -0.62 5.86 1.10 2.14 2.19 0.44 1.83 2.32 0.81
df 12.54 18.18 13.69 14.11 11.94 10.59 15.68 8.33 14.85 13.49 13.13 14.76 13.59 14.77 15.08 15.33 P(2-tai1) 0.36 0.92 0.39 0.85 0.40 0.25 0.14 0.55 0.00 0.29 0.05 0.05 0.66 0.09 0.04 0.43
a14 # Present 208 211 210 210 208 209 211 210 209 208 197 206 206 208 207 209 # Missing 11 12 12 12 12 11 12 9 11 12 11 11 11 12 12 12
Mean(Present) 2.66 2.65 2.77 2.79 2.81 2.85 2.55 2.77 3.23 2.88 3.02 2.74 3.03 2.68 2.99 2.94 Mean(Missing) 2.45 2.67 3.00 2.83 3.17 3.45 2.25 3.11 2.00 2.58 2.45 2.27 2.91 2.25 2.42 2.75
t -1.03 -0.37 -1.09 -0.96 -0.77 -2.05 -1.08 0.10 0.34 2.06 1.80 1.54 0.42 -0.44 -0.70 -0.43 df 11.69 12.66 10.97 11.72 11.72 10.41 11.65 12.14 10.58 12.56 8.82 9.26 10.81 11.90 12.06 12.48
P(2-tail) 0.32 0.72 0.30 0.36 0.46 0.07 0.30 0.92 0.74 0.06 0.11 0.16 0.68 0.67 0.50 0.67 b7 # Present 208 211 211 210 208 209 211 207 209 209 200 208 206 208 207 209
# Missing 11 12 11 12 12 11 12 12 11 11 8 9 11 12 12 12 Mean(Present) 2.64 2.64 2.76 2.77 2.81 2.82 2.51 2.79 3.18 2.89 3.01 2.74 3.03 2.64 2.94 2.92 Mean(Missing\ 2.91 2.75 3.18 3.17 3.17 4.00 3.00 2.75 3.00 2.36 2.50 2.22 2.82 2.83 3.25 3.08
t -0.90 -0.34 -0.47 -0.98 -0.39 -1.96 -1.50 -1.66 -1.29 0.74 -0.31 -0.96 -0.82 -0.78 -2.74 .';..'_"'-,:._-:~. ~7_"_'-:_
:.,....-:-:-b_ • .:-..;~:>..-_"'..:.~~FJ
df 15.64 16.73 15.82 14.74 12.75 14.89 15.20 16.00 12.80 11.99 11.59 11.83 12.90 14.19 16.69 P(2-tail) 0.38 0.74 0.64 0.34 0.70 0.07 0.16 0.12 0.22 0.47 0.76 0.35 0.43 0.45 0.01
ell #,Present 205 208 207 207 207 205 208 204 207 208 208 206 205 207 205 206 # Missing 14 15 15 15 13 15 15 15 13 12 0 11 12 13 14 15
Mean(Present) 2.64 2.64 2.77 2.76 2.82 2.81 2.50 2.75 3.14 2.88 2.99 2.71 3.00 2.63 2.94 2.87 Mean(Missing) 2.86 2.73 2.93 3.20 3.00 3.73 3.07 3.27 3.77 2.58 2.82 3.50 3.00 3.29 3.73
t 3.33 0.61 1.40 0.62 -0.09 -0.31 1.27 -0.31 -1.57 -0.89 -0.63 0.90 -0.69 -0.56 -1.14 -0.85 df 15.80 15.45 14.31 15.50 14.76 14.09 15.47 16.33 14.25 14.09 11.56 14.43 13.35 13.44 14.24 14.11
P(2-tail) 0.00 0.55 0.18 0.55 0.93 0.76 0.22 0.76 0.14 0.39 0.54 0.38 0.50 0.59 0.27 0.41 SPSQ # Present 205 209 208 208 206 206 209 205 206 206 196 204 204 207 205 207
# Missing 14 14 14 14 14 14 14 14 14 14 12 13 13 13 14 14 Mean(Present) 2.70 2.66 2.82 2.80 2.83 2.87 2.56 2.78 3.13 2.84 2.97 2.74 3.00 2.64 2.93 2.91 Mean(Missing) 1.93 2.50 2.29 2.64 2.86 3.00 2.21 2.86 3.79 3.21 3.33 2.46 3.31 2.85 3.43 3.29
XLSO SPSO STXP OVST FEEL OVSO IMPS IMGE PROM RPUT FEES VLUE REDO CTNU RCMD t 2.72 0.20 2.03 3.23 -2.85 -2.41 5.19 2.02 2.29 2.38 0.98 1.22 -1.55 -1.82 -1.41
df 16.09 11.89 12.64 12.49 13.57 13.11 12.73 12.31 12.87 12.46 12.16 13.32 12.66 12.14 12.61 P(2-tail) 0.01 0.84 0.06 0.01 0.01 0.03 0.00 0.07 0.04 0.03 0.35 0.24 0.14 0.09 0.18
a14 # Present 210 197 210 211 210 211 211 207 207 208 210 210 209 211 211 # Missing 12 12 12 11 12 12 10 12 12 12 12 12 12 12 12
Mean(Present) 3.16 3.44 2.99 2.88 4.72 4.69 3.33 3.49 3.53 3.59 4.32 4.15 4.33 3.91 4.30 Mean(Missinl!" 2.58 3.33 2.25 1.91 5.58 5.42 2.20 2.67 2.75 2.67 3.75 3.67 5.08 4.92 5.00
t 0.38 0.13 0.24 0.74 -0.75 -0.71 1.33 0.05 0.53 0.61 0.86 0.07 0.20 -0.45 0.31 df 12.44 10.67 11.81 10.67 12.07 12.12 10.83 11.80 11.91 11.82 11.85 12.05 11.92 11.74 12.03
P(2-tail) 0.71 0.90 0.82 0.47 0.46 0.49 0.21 0.96 0.60 0.55 0.41 0.94 0.84 0.66 0.76 b7 # Present 210 198 210 211 210 211 210 207 207 208 210 210 209 211 211
# Missing 12 11 12 11 12 12 11 12 12 12 12 12 12 12 12 Mean(Present) 3.14 3.43 2.95 2.85 4.75 4.72 3.31 3.44 3.50 3.56 4.32 4.12 4.38 3.94 4.35
Mean(Missinl!'\ 3.00 3.36 2.83 2.45 5.08 5.00 2.73 3.42 3.25 3.25 3.75 4.08 4.25 4.25 4.17 t -1.41 -0.99 -1.29 -0.86 0.37 -0.27 -1.25 -2.10 -2.14 -0.47 -1.28 -1.22 -0.05 -0.31 0.71
df 15.33 13.29 15.38 15.32 17.87 17.39 16.22 14.67 14.22 14.20 16.25 15.87 15.45 15.20 15.21 P(2-tai1) 0.18 0.34 0.22 0.41 0.72 0.79 0.23 0.05 0.05 0.65 0.22 0.24 0.96 0.76 0.49
ell # Present 207 196 207 207 207 208 206 205 206 207 207 207 206 208 208 # Missing 15 13 15 15 15 15 15 14 13 13 15 15 15 15 15
Mean(Present) 3.09 3.40 2.91 2.81 4.77 4.73 3.25 3.39 3.45 3.53 4.25 4.08 4.37 3.95 4.37 Mean(Missing) 3.67 3.85 3.47 3.20 4.67 4.80 3.67 4.21 4.15 3.69 4.87 4.67 4.40 4.13 3.93
t -0.38 0.22 0.82 -1.12 -0.58 -0.27 -1.13 -0.57 -0.76 -0.16 -0.58 -0.10 0.36 -0.03 df 17.89 12.98 15.49 15.09 14.61 15.57 12.08 13.66 14.61 15.39 15.24 12.68 14.60 14.83
P(2-tai1) 0.71 0.83 0.43 0.28 0.57 0.79 0.28 0.57 0.46 0.87 0.57 0.92 0.73 0.97 SPSQ # Present 208 209 209 208 208 209 207 207 206 207 208 208 209 209 209
# Missing 14 0 13 14 14 14 14 12 13 13 14 14 12 14 14 Mean(Present) 3.13 3.43 2.95 2.85 4.74 4.72 3.28 3.42 3.48 3.53 4.28 4.11 4.37 3.97 4.34
Mean(Missing) 3.21 2.85 2.57 5.14 4.93 3.36 3.92 3.69 3.77 4.36 4.36 4.42 3.79 4.36
- 124-

~
..... N VI
~'\ I
~ . "
Appendix 3: Data Imputation Table 24A: Estimated Means Results
Summary of Estimated Means
Interaction aOl a02 a03 a04 a05 a06 a07 a08 a09 All Values 2.40 2.67 2.57 2.22 2.74 2.53 3.05 2.64 2.67 Quality
EM 2.40 2.67 2.57 2.22 2.74 2.53 3.05 2.64 2.65 Physical bOl b02 b03 b04 b05 b06 b07 b08 b09
Environment All Values 2.52 2.41 2.99 2.86 3.30 2.70 2.86 3.05 2.94 Quality EM 2.52 2.41 2.99 2.86 3.29 2.71 2.86 3.04 2.94
Outcome cOl cO2 c03 c04 c05 c06 c07 c08 c09
Quality All Values 2.65 2.65 2.78 2.79 2.83 2.88 2.54 2.79 3.17 EM 2.67 2.65 2.78 2.79 2.84 2.87 2.54 2.80 3.17
Sat, SQ, XLSQ SPSQ STXP OVST FEEL OVSQ IMPS IMGE PROM FTAT, All Values 3.13 3.43 2.95 2.83 4.77 4.73 3.28 3.44 3.49 RCMD EM 3.14 3.40 2.95 2.83 4.77 4.73 3.27 3.45 3.50
--- ---
Summary of Estimated Means FEEL recode OVSQ recode REDO recode CNTU recode RCMD recode
All Values 3.23 3.27 3.63 4.04 3.66 EM 3.23 3.27 3.62 4.04 3.66
------- ----
al0 all a12 a13 a14 a15 2.81 2.59 2.75 2.86 3.00 2.87 2.81 2.60 2.75 2.86 2.99 2.87
bl0 bll b12 b13 b14 b15 b16 3.28 2.75 2.96 3.41 2.99 2.89 2.96 3.28 2.75 2.96 3.41 2.99 2.89 2.96
cIO cll cI2 c13 cI4 cI5 cI6 2.87 2.99 2.72 3.02 2.65 2.96 2.93 2.89 3.02 2.75 3.03 2.67 2.97 2.93
RPUT FEES VLUE REDO CTNU RCMD 3.54 4.29 4.12 4.37 3.96 4.34 3.54 4.31 4.14 4.38 3.96 4.34

~/
....... N 0'\
h
;i I. l~ .!" I~ .
~f
Appendix 4: Correlation Matrix Table 25A : Correlation Matrix
aOI a02 a03 a04 a05 a06 a07 aOI 1.000 0.503 0.497 0.543 0.595 0.565 0.538 a02 0.503 1.000 0.559 0.425 0.371 0.443 0.435 a03 0.497 0.559 1.000 0.537 0.481 0.441 0.476 a04 0.543 0.425 0.537 1.000 0.654 0.639 0.527 a05 0.595 0.371 0.481 0.654 1.000 0.681 0.617 a06 0.565 0.443 0.441 0.639 0.681 1.000 0.591 a07 0.538 0.435 0.476 0.527 0.617 0.591 1.000 a08 0.608 0.492 0.521 0.572 0.564 0.626 0.719 a09 0.432 0.297 0.292 0.390 0.424 0.512 0.445 alO 0.288 0.251 0.278 0.361 0.409 0.433 0.520 all 0.447 0.534 0.457 0.443 0.445 0.505 0.484 a12 0.499 0.440 0.370 0.444 0.425 0.398 0.518 a13 0.516 0.433 0.404 0.404 0.451 0.452 0.469 al4 0.432 0.328 0.333 0.321 0.397 0.445 0.499 bOl 0.438 0.353 0.387 0.476 0.434 0.518 0.434 b02 0.501 0.400 0.390 0.481 0.466 0.564 0.453 b03 0.417 0.391 0.360 0.421 0.458 0.520 0.566 b04 0.167 0.213 0.170 0.207 0.178 0.246 0.332 b05 0.175 0.171 0.142 0.242 0.205 0.277 0.347 b06 0.391 0.319 0.315 0.410 0.363 0.357 0.425 b07 0.404 0.315 0.335 0.370 0.345 0.382 0.432 b08 0.287 0.269 0.298 0.300 0.272 0.358 0.347 b09 0.249 0.207 0.320 0.380 0.283 0.339 0.386 bl0 0.244 0.246 0.232 0.356 0.369 0.417 0.359 bll 0.173 0.247 0.222 0.314 0.309 0.396 0.335 b12 0.254 0.330 0.218 0.293 0.213 0.252 0.361 bl3 0.156 0.197 0.273 0.192 0.224 0.221 0.369 b14 0.038 0.142 0.053 0.041 0.135 0.093 0.212 bl5 0.112 0.179 0.155 0.071 0.139 0.140 0.258 cOl 0.391 0.377 0.297 0.303 0.317 0.344 0.308 cO2 0.441 0.412 0.464 0.454 0.459 0.414 0.478 c03 0.423 0.375 0.423 0.358 0.341 0.345 0.420 c04 0.314 0.318 0.437 0.392 0.404 0.374 0.388 c05 0.336 0.265 0.339 0.322 0.367 0.343 0.459 c06 0.290 0.334 0.329 0.298 0.355 0.292 0.347 c07 0.351 0.421 0.427 0.324 0.359 0.366 0.359 c08 0.354 0.344 0.417 0.317 0.329 0.313 0.474 c09 0.217 0.261 0.324 0.354 0.266 0.296 0.418 cl0 0.212 0.269 0.295 0.279 0.172 0.263 0.369 ell 0.239 0.351 0.317 0.334 0.255 0.279 0.408 c12 0.310 0.283 0.283 0.365 0.330 0.351 0.379 cl3 0.264 0.219 0.320 0.409 0.395 0.374 0.437 c14 0.273 0.324 0.383 0.400 0.362 0.414 0.476 c15 0.269 0.329 0.287 0.238 0.310 0.278 0.414
a08 a09 alO all 0.608 0.432 0.288 0.447 0.492 0.297 0.251 0.534 0.521 0.292 0.278 0.457 0.572 0.390 0.361 0.443 0.564 0.424 0.409 0.445 0.626 0.512 0.433 0.505 0.719 0.445 0.520 0.484 1.000 0.491 0.376 0.522 0.491 1.000 0.394 0.465 0.376 0.394 1.000 0.571 0.522 0.465 0.571 1.000 0.531 0.459 0.363 0.521 0.520 0.395 0.343 0.477 0.456 0.452 0.381 0.427 0.432 0.441 0.394 0.383 0.450 0.414 0.379 0.494 0.496 0.401 0.361 0.374 0.252 0.213 0.144 0.184 0.277 0.220 0.201 0.254 0.399 0.345 0.365 0.428 0.449 0.301 0.376 0.407 0.348 0.293 0.293 0.329 0.342 0.300 0.360 0.286 0.350 0.309 0.413 0.315 0.326 0.324 0.260 0.295 0.294 0.209 0.208 0.241 0.274 0.308 0.280 0.206 0.090 0.048 0.205 0.140 0.171 0.239 0.123 0.139 0.278 0.251 0.196 0.246 0.460 0.356 0.331 0.448 0.364 0.301 0.183 0.339 0.402 0.258 0.343 0.363 0.365 0.339 0.317 0.358 0.301 0.344 0.301 0.286 0.363 0.290 0.339 0.436 0.388 0.335 0.406 0.401 0.341 0.248 0.319 0.307 0.281 0.203 0.257 0.294 0.332 0.154 0.340 0.355 0.386 0.239 0.389 0.427 0.410 0.223 0.364 0.418 0.447 0.309 0.383 0.398 0.333 0.318 0.233 0.298
t~ ~. ~
~ , ,',,\ P I,·
~~ ~ ~ '::l
~~. ~ ~ ~
~ ~
a12 a13 a14 bOI b02 b03 b04 b05 b06 b07 b08 0.499 0.516 0.432 0.438 0.501 0.417 0.167 0.175 0.391 0.404 0.287 0.440 0.433 0.328 0.353 0.400 0.391 0.213 0.171 0.319 0.315 0.269 0.370 0.404 0.333 0.387 0.390 0.360 0.170 0.142 0.315 0.335 0.298 0.444 0.404 0.321 0.476 0.481 0.421 0.207 0.242 0.410 0.370 0.300 0.425 0.451 0.397 0.434 0.466 0.458 0.178 0.205 0.363 0.345 0.272 0.398 0.452 0.445 0.518 0.564 0.520 0.246 0.277 0.357 0.382 0.358 0.518 0.469 0.499 0.434 0.453 0.566 0.332 0.347 0.425 0.432 0.347 0.531 0.520 0.456 0.432 0.450 0.496 0.252 0.277 0.399 0.449 0.348 0.459 0.395 0.452 0.441 0.414 0.401 0.213 0.220 0.345 0.301 0.293 0.363 0.343 0.381 0.394 0.379 0.361 0.144 0.201 0.365 0.376 0.293 0.521 0.477 0.427 0.383 0.494 0.374 0.184 0.254 0.428 0.407 0.329 1.000 0.798 0.764 0.318 0.339 0.357 0.286 0.324 0.417 0.412 0.314 0.798 1.000 0.765 0.355 0.346 0.336 0.246 0.259 0.415 0.437 0.299 0.764 0.765 1.000 0.326 0.310 0.378 0.250 0.306 0.358 0.391 0.335 0.318 0.355 0.326 1.000 0.753 0.699 0.307 0.295 0.349 0.367 0.318 0.339 0.346 0.310 0.753 1.000 0.638 0.300 0.330 0.399 0.401 0.343 0.357 0.336 0.378 0.699 0.638 1.000 0.417 0.298 0.324 0.328 0.324 0.286 0.246 0.250 0.307 0.300 0.417 1.000 0.506 0.401 0.347 0.357 0.324 0.259 0.306 0.295 0.330 0.298 0.506 1.000 0.652 0.554 0.335 0.417 0.415 0.358 0.349 0.399 0.324 0.401 0.652 1.000 0.823 0.446 0.412 0.437 0.391 0.367 0.401 0.328 0.347 0.554 0.823 1.000 0.410 0.314 0.299 0.335 0.318 0.343 0.324 0.357 0.335 0.446 0.410 1.000 0.321 0.282 0.302 0.308 0.287 0.324 0.338 0.401 0.471 0.369 0.565 0.337 0.407 0.392 0.402 0.353 0.407 0.349 0.359 0.433 0.395 0.483 0.306 0.307 0.278 0.384 0.343 0.423 0.410 0.343 0.386 0.347 0.345 0.336 0.300 0.272 0.290 0.285 0.389 0.420 0.438 0.421 0.348 0.223 0.297 0.247 0.319 0.341 0.259 0.452 0.429 0.352 0.348 0.275 0.333 0.077 0.080 0.043 0.156 0.098 0.145 0.132 0.093 0.071 0.061 0.051 0.140 0.135 0.142 0.241 0.200 0.250 0.229 0.122 0.137 0.\08 0.129 0.327 0.343 0.264 0.326 0.347 0.423 0.326 0.302 0.350 0.291 0.229 0.467 0.436 0.334 0.425 0.400 0.441 0.307 0.341 0.436 0.504 0.251 0.345 0.280 0.274 0.374 0.351 0.457 0.350 0.224 0.357 0.346 0.310 0.315 0.352 0.212 0.402 0.363 0.340 0.154 0.194 0.387 0.355 0.294 0.351 0.249 0.252 0.329 0.326 0.409 0.289 0.265 0.387 0.373 0.268 0.279 0.261 0.263 0.241 0.255 0.399 0.215 0.141 0.230 0.196 0.341 0.282 0.291 0.167 0.383 0.447 0.335 0.188 0.228 0.352 0.381 0.268 0.406 0.298 0.340 0.343 0.312 0.407 0.241 0.200 0.329 0.350 0.288 0.333 0.295 0.328 0.257 0.259 0.359 0.350 0.299 0.353 0.319 0.239 0.331 0.245 0.277 0.217 0.227 0.341 0.403 0.280 0.340 0.310 0.241 0.413 0.317 0.328 0.223 0.242 0.358 0.309 0.289 0.410 0.376 0.306 0.343 0.305 0.232 0.315 0.365 0.322 0.263 0.245 0.442 0.377 0.309 0.297 0.274 0.226 0.290 0.335 0.288 0.265 0.292 0.432 0.380 0.388 0.403 0.349 0.380 0.377 0.389 0.384 0.321 0.276 0.371 0.352 0.300 0.337 0.287 0.288 0.313 0.318 0.387 0.220 0.172 0.239 0.247 0.198

-N -.....l
~
~: ~ ~ ~ ~
S ~ ' ... ~
~ ~ ',.
1 t~
Appendix 4: Correlation Matrix Table 25A : Correlation Matrix (Continued)
b09 blO bIl bl2 bl3 bl4 bl5 cOl aOI 0.249 0.244 0.173 0.254 0.156 0.038 0.112 0.391 a02 0.207 0.246 0.247 0.330 0.197 0.142 0.179 0.377 a03 0.320 0.232 0.222 0.218 0.273 0.053 0.155 0.297 a04 0.380 0.356 0.314 0.293 0.192 0.041 0.071 0.303 a05 0.283 0.369 0.309 0.213 0.224 0.135 0.139 0.317 a06 0.339 0.417 0.396 0.252 0.221 0.093 0.140 0.344 a07 0.386 0.359 0.335 0.361 0.369 0.212 0.258 0.308 a08 0.342 0.350 0.326 0.294 0.274 0.090 0.171 0.278 a09 0.300 0.309 0.324 0.209 0.308 0.048 0.239 0.251 a10 0.360 0.413 0.260 0.208 0.280 0.205 0.123 0.196 all 0.286 0.315 0.295 0.241 0.206 0.140 0.139 0.246 a12 0.321 0.337 0.306 0.336 0.297 0.077 0.140 0.327 a13 0.282 0.407 0.307 0.300 0.247 0.080 0.135 0.343 a14 0.302 0.392 0.278 0.272 0.319 0.043 0.142 0.264 bOI 0.308 0.402 0.384 0.290 0.341 0.156 0.241 0.326 b02 0.287 0.353 0.343 0.285 0.259 0.098 0.200 0.347 b03 0.324 0.407 0.423 0.389 0.452 0.145 0.250 0.423 b04 0.338 0.349 0.410 0.420 0.429 0.132 0.229 0.326 b05 0.401 0.359 0.343 0.438 0.352 0.093 0.122 0.302 b06 0.471 0.433 0.386 0.421 0.348 0.071 0.137 0.350 b07 0.369 0.395 0.347 0.348 0.275 0.061 0.108 0.291 b08 0.565 0.483 0.345 0.223 0.333 0.051 0.129 0.229 b09 1.000 0.453 0.473 0.372 0.445 0.108 0.124 0.327 b10 0.453 1.000 0.597 0.487 0.491 0.066 0.150 0.300 bl1 0.473 0.597 1.000 0.562 0.531 0.106 0.228 0.410 b12 0.372 0.487 0.562 1.000 0.633 0.197 0.252 0.541 bl3 0.445 0.491 0.531 0.633 1.000 0.241 0.255 0.356 b14 0.108 0.066 0.106 0.197 0.241 1.000 0.641 0.200 b15 0.124 0.150 0.228 0.252 0.255 0.641 1.000 0.204 cOl 0.327 0.300 0.410 0.541 0.356 0.200 0.204 1.000 cO2 0.393 0.286 0.418 0.436 0.388 0.184 0.195 0.583 c03 0.295 0.275 0.432 0.323 0.461 0.134 0.141 0.472 c04 0.432 0.322 0.396 0.335 0.398 0.173 0.077 0.508 c05 0.362 0.251 0.319 0.368 0.349 0.093 0.126 0.464 c06 0.376 0.319 0.393 0.396 0.427 0.099 0.086 0.444 c07 0.406 0.280 0.387 0.373 0.343 0.144 0.128 0.403 c08 0.363 0.272 0.289 0.345 0.306 0.111 0.206· 0.428 c09 0.417 0.250 0.272 0.389 0.416 0.217 0.220 0.349 cl0 0.423 0.241 0.314 0.388 0.394 0.235 0.161 0.350 ell 0.402 0.350 0.312 0.292 0.275 0.149 0.134 0.284 cl2 0.430 0.332 0.412 0.349 0.293 0.134 0.091 0.366 el3 0.467 0.351 0.341 0.334 0.314 0.102 0.106 0.284 c14 0.475 0.392 0.511 0.381 0.453 0.179 0.112 0.395 cl5 0.317 0.239 0.294 0.314 0.331 0.185 0.203 0.342
cO2 c03 0.441 0.423 0.412 0.375 0.464 0.423 0.454 0.358 0.459 0.341 0.414 0.345 0.478 0.420 0.460 0.364 0.356 0.301 0.331 0.183 0.448 0.339 0.467 0.345 0.436 0.280 0.334 0.274 0.425 0.374 0.400 0.351 0.441 0.457 0.307 0.350 0.341 0.224 0.436 0.357 0.504 0.346 0.251 0.310 0.393 0.295 0.286 0.275 0.418 0.432 0.436 0.323 0.388 0.461 0.184 0.134 0.195 0.141 0.583 0.472 1.000 0.581 0.581 1.000 0.634 0.602 0.584 0.589 0.410 0.415 0.541 0.498 0.497 0.453 0.350 0.287 0.460 0.404 0.425 0.475 0.452 0.449 0.406 0.367 0.577 0.608 0.458 0.461
r. ,
~ ~ ~ ~
.~ . ~ t, , f t
c04 cOS c06 c07 c08 c09 clO cll cl2 c13 cl4 el5 0.314 0.336 0.290 0.351 0.354 0.217 0.212 0.239 0.310 0.264 0.273 0.269 0.318 0.265 0.334 0.421 0.344 0.261 0.269 0.351 0.283 0.219 0.324 0.329 0.437 0.339 0.329 0.427 0.417 0.324 0.295 0.317 0.283 0.320 0.383 0.287 0.392 0.322 0.298 0.324 0.317 0.354 0.279 0.334 0.365 0.409 0.400 0.238 0.404 0.367 0.355 0.359 0.329 0.266 0.172 0.255 0.330 0.395 0.362 0.310 0.374 0.343 0.292 0.366 0.313 0.296 0.263 0.279 0.351 0.374 0.414 0.278 0.388 0.459 0.347 0.359 0.474 0.418 0.369 0.408 0.379 0.437 0.476 0.414 0.402 0.365 0.301 0.363 0.388 0.341 0.281 0.332 0.386 .0.410 0.447 0.333 I
0.258 0.339 0.344 0.290 0.335 0.248 0.203 0.154 0.239 0.223 0.309 0.318 0.343 0.317 0.301 0.339 0.406 0.319 0.257 0.340 0.389 0.364 0.383 0.233 0.363 0.358 0.286 0.436 0.401 0.307 0.294 0.355 0.427 0.418 0.398 0.298 0.315 0.351 0.279 0.282 0.406 0.333 0.331 0.413 0.343 0.297 0.403 0.337 0.352 0.249 0.261 0.291 0.298 0.295 0.245 0.317 0.305 0.274 0.349 0.287
1
0.212 0.252 0.263 0.167 0.340 0.328 0.277 0.328 0.232 0.226 0.380 0.288 0.402 0.329 0.241 0.383 0.343 0.257 0.217 0.223 0.315 0.290 0.377 0.313 0.363 0.326 0.255 0.447 0.312 0.259 0.227 0.242 0.365 0.335 0.389 0.318 0.340 0.409 0.399 0.335 0.407 0.359 0.341 0.358 0.322 0.288 0.384 0.387 0.154 0.289 0.215 0.188 0.241 0.350 0.403 0.309 0.263 0.265 0.321 0.220 0.194 0.265 0.141 0.228 0.200 0.299 0.280 0.289 0.245 0.292 0.276 0.172 0.387 0.387 0.230 0.352 0.329 0.353 0.340 0.410 0.442 0.432 0.371 0.239 0.355 0.373 0.196 0.381 0.350 0.319 0.310 0.376 0.377 0.380 0.352 0.247 0.294 0.268 0.341 0.268 0.288 0.239 0.241 0.306 0.309 0.388 0.300 0.198 0.432 0.362 0.376 0.406 0.363 0.417 0.423 0.402 0.430 0.467 0.475 0.317 0.322 0.251 0.319 0.280 0.272 0.250 0.241 0.350 0.332 0.351 0.392 0.239 0.396 0.319 0.393 0.387 0.289 0.272 0.314 0.312 0.412 0.341 0.511 0.294 0.335 0.368 0.396 0.373 0.345 0.389 0.388 0.292 0.349 0.334 0.381 0.314 0.398 0.349 0.427 0.343 0.306 0.416 0.394 0.275 0.293 0.314 0.453 0.331 0.173 0.093 0.099 0.144 0.111 0.217 0.235 0.149 0.134 0.102 0.179 0.185 0.077 0.126 0.086 0.128 0.206 0.220 0.161 0.134 0.091 0.106 0.112 0.203
1 0.508 0.464 0.444 0.403 0.428 0.349 0.350 0.284 0.366 0.284 0.395 0.342 0.634 0.584 0.410 0.541 0.497 0.350 0.460 0.425 0.452 0.406 0.577 0.458 I
0.602 0.589 0.415 0.498 0.453 0.287 0.404 0.475 0.449 0.367 0.608 0.461 I
1.000 0.611 0.464 0.579 0.503 0.356 0.358 0.399 0.504 0.513 0.574 0.3981 0.611 1.000 0.537 0.473 0.586 0.344 0.347 0.334 0.422 0.488 0.493 0.341 ' 0.464 0.537 1.000 0.445 0.474 0.385 0.325 0.274 0.240 0.277 0.357 0.286 0.579 0.473 0.445 1.000 0.501 0.320 0.307 0.375 0.548 0.483 0.548 0.472 0.503 0.586 0.474 0.501 1.000 0.449 0.449 0.461 0.470 0.443 0.439 0.339 0.356 0.344 0.385 0.320 0.449 1.000 0.646 0.485 0.392 0.481 0.438 0.361 0.358 0.347 0.325 0.307 0.449 0.646 1.000 0.648 0.506 0.509 0.523 0.387 0.399 0.334 0.274 0.375 0.461 0.485 0.648 1.000 0.510 0.448 0.582 0.451 0.504 0.422 0.240 0.548 0.470 0.392 0.506 0.510 1.000 0.713 0.537 0.337 0.513 0.488 0.277 0.483 0.443 0.481 0.509 0.448 0.713 1.000 0.583 0.361 0.574 0.493 0.357 0.548 0.439 0.438 0.523 0.582 0.537 0.583 1.000 0.637 0.398 0.341 0.286 0.472 0.339 0.361 0.387 0.451 0.337 0.361 0.637 1.000

~
...-tv 00
~ ~ ~ ~ L
~
Appendix 5: Anti-Image Correlation Matrix Table 26A: Anti-Image Correlation Matrix
aOl a02 a03 a04 a05 a06 a07 a08 a09 al0 all aOl 0.926 -0.074 -0.035 0.002 -0.223 -0.078 -0.040 -0.238 -0.029 0.018 0.041 a02 -0.074 0.939 -0.284 0.001 0.109 -0.117 -0.046 -0.065 0.062 0.105 -0.257 a03 -0.035 -0.284 0.936 -0.218 -0.112 0.076 -0.036 -0.095 0.120 0.047 -0.111 a04 0.002 0.001 -0.218 0.919 -0.257 -0.239 0.006 -0.065 -0.030 -0.011 0.052 a05 -0.223 0.109 -0.112 -0.257 0.920 -0.285 -0.208 0.081 0.011 0.014 0.036 a06 -0.078 -0.117 0.076 -0.239 -0.285 0.937 -0.036 -0.132 -0.185 -0.052 -0.055 a07 -0.040 -0.046 -0.036 0.006 -0.208 -0.036 0.945 -0.395 0.047 -0.307 0.120 a08 -0.238 -0.065 -0.095 -0.065 0.081 -0.132 -0.395 0.928 -0.166 0.177 -0.107 a09 -0.029 0.062 0.120 -0.030 0.011 -0.185 0.047 -0.166 0.917 -0.092 -0.138 al0 0.018 0.105 0.047 -0.011 0.014 -0.052 -0.307 0.177 -0.092 0.894 -0.380 all 0.041 -0.257 -0.111 0.052 0.036 -0.055 0.120 -0.107 -0.138 -0.380 0.923 a12 -0.047 -0.095 0.138 -0.233 -0.019 0.227 0.005 -0.088 -0.115 0.008 -0.110 a13 -0.094 -0.012 -0.084 0.086 0.015 -0.047 0.000 -0.052 0.079 0.056 -0.020 a14 -0.009 0.065 -0.054 0.176 -0.045 -0.161 -0.083 0.130 -0.086 -0.036 -0.020 bOl -0.082 -0.041 -0.051 -0.151 0.072 0.036 0.116 0.053 -0.151 -0.122 0.140 b02 -0.167 0.032 0.001 -0.031 -0.010 -0.090 -0.024 0.110 0.024 0.041 -0.214 b03 0.119 -0.030 0.073 0.041 -0.053 -0.073 -0.153 -0.160 0.099 0.011 -0.003 b04 0.074 -0.036 0.026 0.031 -0.035 0.015 -0.025 0.000 0.016 0.019 0.053 b05 0.162 0.075 0.043 0.084 0.040 -0.104 -0.102 -0.050 0.037 0.113 -0.011 b06 -0.096 -0.062 0.025 -0.108 -0.112 0.158 -0.015 0.145 -0.159 0.015 -0.131 b07 -0.017 0.034 -0.024 0.062 0.098 -0.058 0.053 -0.184 0.111 -0.133 0.135 b08 0.010 -0.046 -0.034 0.061 0.098 -0.093 -0.016 -0.027 0.026 0.061 -0.048 b09 -0.115 0.087 -0.073 -0.153 0.117 0.024 -0.027 0.029 -0.019 -0.065 0.092 blO 0.028 -0.008 0.060 -0.060 -0.114 -0.026 0.109 -0.027 0.006 -0.188 0.028 bll 0.205 0.046 0.070 0.072 -0.083 -0.149 -0.012 O.oI8 -0.032 0.111 -0.100 b12 -0.124 -0.129 0.104 -0.190 0.180 0.049 -0.092 0.013 0.149 0.090 -0.007 b13 0.082 0.090 -0.156 0.200 -0.045 0.083 0.003 -0.006 -0.127 -0.095 0.097 b14 0.036 -0.056 0.178 0.017 -0.157 -0.002 -0.068 0.042 0.187 -0.135 -0.119 bl5 0.030 0.002 -0.148 0.069 0.081 0.024 -0.034 -0.043 -0.217 0.091 0.101 cOl -0.157 -0.099 0.014 0.071 0.015 -0.091 0.137 0.097 -0.001 -0.025 0.145 cO2 -0.014 0.020 -0.029 -0.106 -0.161 0.104 -0.002 0.029 -0.024 0.021 -0.150 c03 -0.298 -0.011 -0.053 -0.133 0.100 0.048 -0.089 0.159 -0.021 0.231 -0.086 c04 0.192 0.039 -0.070 0.039 -0.025 -0.055 0.056 -0.157 0.084 -0.050 0.078 cOS 0.033 0.091 0.017 0.125 0.024 -0.088 -0.113 0.070 -0.055 0.018 -0.026 c06 -0.018 -0.120 0.025 -0.059 -0.143 0.148 0.081 -0.020 -0.145 -0.101 0.060 c07 -0.018 -0.120 -0.094 0.133 -0.018 -0.074 0.058 0.066 -0.024 0.000 -0.055 c08 -0.031 0.028 -0.108 0.065 0.012 0.077 -0.100 0.020 -0.032 -0.092 -0.027 c09 0.064 0.029 -0.013 -0.167 0.017 0.014 -0.018 -0.035 0.022 -0.017 -0.036 clO -0.062 0.016 -0.090 0.072 0.192 -0.127 -0.020 0.093 -0.085 0.095 0.016 ell 0.053 -0.102 0.033 -0.033 -0.024 ·0.029 -0.002 0.032 0.172 -0.091 0.011 c12 -0.009 0.008 0.092 0.016 0.019 0.024 0.080 -0.108 -0.001 -0.136 0.028 cl3 0.025 0.090 0.041 -0.077 -0.179 0.039 -0.059 -0.006 0.093 0.078 -0.160 c14 0.143 0.023 -0.029 -0.057 0.105 -0.054 0.033 -0.191 0.055 -0.118 0.092 cIS 0.008 -0.063 0.055 0.139 -0.115 0.085 -0.116 0.077 -0.172 0.094 0.000
i: ~ ~ ~ { ~ .~. X
} ,~ ): - ~
a12 a13 a14 bOl b02 b03 b04 b05 b06 b07 b08 -0.047 -0.094 -0.009 -0.082 -0.167 0.119 0.074 0.162 -0.096 -0.017 0.010 -0.095 -0.012 0.065 -0.041 0.032 -0.030 -0.036 0.075 -0.062 0.034 -0.046 0.138 -0.084 -0.054 -0.051 0.001 0.073 0.026 0.043 0.025 -0.024 -0.034
-0.233 0.086 0.176 -0.151 -0.031 0.041 0.031 0.084 -0.108 0.062 0.061 -0.019 O.oI5 -0.045 0.072 -0.010 -0.053 -0.035 0.040 -0.112 0.098 0.098 0.227 -0.047 -0.161 0.036 -0.090 -0.073 O.oI5 -0.104 0.158 -0.058 -0.093 0.005 0.000 -0.083 0.116 -0.024 -0.153 -0.025 -0.102 -0.015 0.053 -0.016
-0.088 -0.052 0.130 0.053 0.110 -0.160 0.000 -0.050 0.145 -0.184 -0.027 -0.115 0.079 -0.086 -0.151 0.024 0.099 0.016 0.037 -0.159 0.111 0.026 0.008 0.056 -0.036 -0.122 0.041 0.011 0.019 0.113 0.015 -0.133 0.061
-0.110 -0.020 -0.020 0.140 -0.214 -0.003 0.053 -0.011 -0.131 0.135 -0:048 0.912 -0.463 -0.339 0.078 -0.048 0.055 -0.018 -0.099 0.038 0.066 -0.058
-0.463 0.904 -00408 -0.076 0.059 0.037 -0.117 0.153 -0.085 -0.030 0.082 -0.339 -0.408 0.899 -0.019 0.055 -0.069 0.125 -0.111 0.110 -0.126 -0.062 0.078 -0.076 -0.019 0.912 -0.435 -00408 -0.015 -0.072 0.045 -0.010 -0.020
-0.048 0.059 0.055 -00435 0.925 -0.220 -0.021 -0.100 0.013 -0.061 -0.086 0.055 0.037 -0.069 -00408 -0.220 0.927 -0.099 0.075 0.016 0.034 0.057
-0.018 -0.117 0.125 -0.015 -0.021 -0.099 0.934 -0.253 0.002 0.001 -0.155 -0.099 0.153 -0.111 -0.072 -0.100 0.075 -0.253 0.890 -0.372 0.008 0.044 0.038 -0.085 0.110 0.045 0.013 0.016 0.002 -0.372 0.877 -0.682 -0.042 0.066 -0.030 -0.126 -0.010 -0.061 0.034 0.001 0.008 -0.682 0.875 -0.098
-0.058 0.082 -0.062 -0.020 -0.086 0.057 -0.155 0.044 -0.042 -0.098 0.902 0.010 0.047 -0.042 0.023 0.092 -0.020 0.007 -0.120 -0.122 0.141 -0.380 0.142 -0.183 -0.035 -0.062 0.016 -0.004 -0.004 -0.035 0.026 -0.044 -0.218
-0.075 -0.011 0.112 -0.073 0.051 -0.032 -0.072 0.037 0.038 -0.106 0.070 -0.018 O.oI8 -0.003 0.040 0.006 0.034 -0.027 -0.124 -0.051 0.017 0.150 -0.084 0.115 -0.083 -0.008 0.059 -0.173 -0.070 0.008 -0.065 0.085 -0.040 -0.022 -0.036 0.116 -0.095 0.120 0.051 0.051 -0.087 0.105 -0.078 -0.014 0.051 0.004 -0.071 0.000 -0.122 0.011 -0.074 0.123 -0.108 0.115 -0.023 0.031 -0.066 -0.008 0.123 -0.056 -0.145 -0.049 -0.070 -0.080 0.140 -0.021
-0.053 -0.082 0.115 -0.055 0.115 -0.037 0.025 -0.135 0.232 -0.323 0.045 0.034 0.088 -0.041 0.018 0.114 -0.109 -0.127 -0.003 0.026 -0.044 -0.121 0.059 -0.194 0.122 -0.152 -0.068 0.176 0.189 0.104 -0.143 0.117 0.018
-0.163 0.146 0.041 0.004 0.026 -0.074 -0.087 0.030 -0.056 -0.045 0.113 0.111 -0.053 -0.055 0.173 -0.012 -0.134 0.063 0.043 0.030 0.098 -0.217 0.029 -0.094 0.189 -0.010 -0.157 0.101 0.044 -0.065 0.127 -0.152 0.086
-0.120 0.168 -0.085 -0.090 0.111 -0.035 0.006 0.039 0.081 -0.072 -0.019 0.061 -0.046 -0.068 0.003 0.010 -0.006 -0.066 -0.036 0.020 -0.071 0.094
-0.016 0.049 -0.004 0.031 -0.034 -0.004 -0.162 0.073 0.006 -0.001 0.096 -0.146 0.042 0.034 0.099 0.080 -0.161 0.044 -0.059 -0.083 -0.002 -0.033 -0.030 -0.003 -0.012 0.030 -0.073 -0.014 -0.003 0.130 -0.157 0.124 0.031 0.063 -0.048 0.080 -0.004 0.058 0.031 0.037 -0.075 0.043 -0.046 -0.205 0.045 0.075 -0.231 -0.019 -0.155 0.201 -0.047 0.076 -0.061 0.134 0.112
-0.054 0.002 0.048 -0.005 0.021 -0.132 0.051 0.048 0.055 -0.042 -0.005,

-N \0
;~ '0'
"
;~t J: '~
Appendix 5: Anti-Image Correlation Matrix Table 26A : Anti-Image Correlation Matrix (Continued)
b09 blO bll b12 b13 b14 bI5 cOl cO2 c03 c04 aOl -0.115 0.028 0.205 -0.124 0.082 0.036 0.030 -0.157 -0.014 -0.298 0.192 a02 0.087 -0.008 0.046 -0.129 0.090 -0.056 0.002 -0.099 0.020 -0.011 0.039 a03 -0.073 0.060 0.070 0.104 -0.156 0.178 -0.148 0.014 -0.029 -0.053 -0.070 a04 -0.153 -0.060 0.072 -0.190 0.200 0.017 0.069 0.071 -0.106 -0.133 0.039 a05 0.117 -0.114 -0.083 _i>·l~Q. -0.045 -0.157 0.081 0.015 -0.161 0.100 -0.025 a06 0.024 -0.026 -0.149 0.049 0.083 -0.002 0.024 -0.091 0.104 0.048 -0.055 a07 -0.027 0.109 -0.012 -0.092 0.003 -0.068 -0.034 0.137 -0.002 -0.089 0.056 a08 0.029 -0.027 0.018 0.013 -0.006 0.042 -0.043 0.097 0.029 0.159 -0.157 a09 -0.019 0.006 -0.032 0.149 -0.127 0.187 -0.217 -0.001 -0.024 -0.021 0.084 al0 -0.065 -0.188 0.111 0.090 -0.095 -0.135 0.091 -0.025 0.021 0.231 -0.050 all 0.092 0.028 -0.100 -0.007 0.097 -0.119 0.101 0.145 ---=0.I50 -0.086 0.078 a12 0.010 0.142 -0.075 -0.018 -0.084 -0.022 0.051 0.031 -0.053 0.034 0.059 a13 0.047 -0.183 -0.011 0.018 0.115 -0.036 0.004 -0.066 -0.082 0.088 -0.194 a14 -0.042 -0.035 0.112 -0.003 -0.083 0.116 -0.071 -0.008 0.115 -0.041 0.122 bQL_ _ Q,-Q2,l _-=Q.Og~ -=-0.073 _ _Q&!Q- _:-9.,Q0_~ ~O~ . 0.000. ~~ ---=9.g~_ _Q-,-Ql~ _~t~~, b02 0.092 0.016 0.051 0.006 0.059 0.120 -0.122 -0.056 0.115 0.114 -0.068 b03 -0.020 -0.004 -0.032 0.034 -0.173 0.051 0.011 -0.145 -0.037 -0.109 0.176 b04 0.007 -0.004 -0.072 -0.027 -0.070 0.051 -0.074 -0.049 0.025 -0.127 0.189 b05 -0.120 -0.035 0.037 -0.124 0.008 -0.087 0.123 -0.070 -0.135 -0.003 0.104
cOS 0.033 0.091 0.017 0.125 0.024
-0.088 -0.113 0.070
-0.055 0.Q18
-0.026 -0.163 0.146 0.041 0.004 0.026
-0.074 -0.087 0.030
p09 __ . , _:-Q.J1_7 _ _ Q·Q72. __ Q.QJ..8_ _:0~9?J .:-0,065 _ __ Q,) 05 __ :<LlO~ __ ~O-"Q89 . ,J)·n2 ._Q.0_2_~ _.:9·11) __ -O,-Q~~. b07 0.141 -0.044 -0.106 0.017 0.085 -0.078 0.115 0.140 -0.323 -0.044 0.117 -0.045 b08 -0.380 -0.218 0.070 0.150 -0.040 -0.014 -0.023 -0.021 0.045 -0.121 0.018 0.113 b09 0.925 -0.016 -0.197 0.097 -0.100 -0.015 0.029 -0.007 -0.040 0.254 -0.099 -0.065 blO -0.016 0.932 -0.266 -0.171 -0.164 0.069 -0.014 0.001 0.124 0.059 -0.011 -0.011 bl1 -0.197 -0.266 0.902 -0.235 -0.011 0.178 -0.207 -0.036 0.009 -0.151 -0.019 0.164 b12 0.097 -0.171 -0.235 0.891 -0.436 -0.004 -0.042 -0.274 -0.032 0.228 0.071 -0.102 b13 -0.100 -0.164 -0.011 -0.436 0.888 -0.099 0.Q18 0.173 -0.036 -0.272 -0.107 0.132 b14 -0.015 0.069 0.178 -0.004 -0.099 0.578 -0.679 -0.087 0.099 -0.005 -0.139 0.055 b15 0.029 -0.014 -0.207 -0.042 0.018 -0.679 0.642 0.009 -0.133 -0.001 0.172 -0.041 cOl -0.007 0.001 -0.036 -0.274 0.173 -0.087 0.009 0.925 -0.252 -0.078 -0.160 -0.005 cO2 -0.040 0.124 0.009 -0.032 -0.036 0.099 -0.133 -0.252 0.930 -0.001 -0.219 -0.149 c03 0.254 0.059 -0.151 0.228 -0.272 -0.005 -0.001 -0.078 -0.001 0.897 -0.241 -0.245 c04 -0.099 -0.011 -0.019 0.071 -0.107 -0.139 0.172 -0.160 -0.219 -0.241 0.923 -0.186 cOS -0.065 -0.011 0.164 -0.102 0.132 0.055 -0.041 -0.005 -0.149 -0.245 -0.186 0.924 c06 0.004 0.024 -0.180 -0.058 -0.066 -0.056 0.142 -0.072 0.035 0.014 -0.058 -0.293 c07 -0.145 0.065 0.019 -0.087 -0.038 -0.010 0.009 0.070 -0.060 -0.070 -0.065 0.051 c08 0.022 -0.025 0.058 -0.039 0.108 0.141 -0.156 -0.106 0.025 0.023 -0.100 -0.188 c09 -0.050 0.111 0.069 0.Q15 -0.154 0.018 -0.089 -0.113 0.164 0.122 -0.043 0.013 c10 -0.086 0.054 0.006 -0.045 -0.052 -0.198 0.160 0.036 -0.228 -0.002 0.081 0.100 ell -0.026 -0.182 0.089 0.031 0.185 0.085 -0.112 0.107 0.042 -0.168 -0.057 0.104 c12 -0.033 0.033 -0.166 -0.023 0.061 -0.086 0.115 -0.068 -0.032 -0.132 0.016 0.040 c13 0.010 -0.035 0.113 -0.046 -0.006 0.162 -0.141 0.059 0.157 0.152 -0.130 -0.206 c14 -0.057 -0.007 -0.244 0.070 -0.064 -0.154 0.207 -0.009 -0.164 -0.217 0.034 -0.068 el5 -0.055 -0.008 0.136 -0.096 0.067 0.040 -0.081 -0.032 -0.027 -0.049 -0.018 0.088
:~ .t ~ , ','-
c06 c07 c08 c09 cl0 ell el2 c13 c14 cIS -0.018 -0.018 -0.031 0.064 -0.062 0.053 -0.009 0.025 0.143 0.008 -0.120 -0.120 0.028 0.029 0.016 -0.102 0.008 0.090 0.023 -0.063 0.025 -0.094 -0.108 -0.013 -0.090 0.033 0.092 0.041 -0.029 0.055
-0.059 0.133 0.065 -0.167 0.072 -0.033 0.016 -0.077 -0.057 0.139 -0.143 -0.018 0.012 0.017 0.192 -0.024 0.019 -0.179 0.105 -0.115 0.148 -0.074 0.077 0.014 -0.127 0.029 0.024 0.039 -0.054 0.085 0.081 0.058 -0.100 -0.018 -0.020 -0.002 0.080 -0.059 0.033 -0.116
-0.020 0.066 0.020 -0.035 0.093 0.032 -0.108 -0.006 -0.191 0.077 -0.145 -0.024 -0.032 0.022 -0.085 0.172 -0.001 0.093 0.055 -0.172 -0.101 0.000 -0.092 -0.017 0.095 -0.091 ~~ 0.078 -0.118 0.094 0.060 -0.055 -0.027 -0.036 0.016 0.011 0.028 -0.160 1-- 0.092 0.000 0.111 0.029 -0.120 0.061 -0.016 -0.146 -0.030 0.063 0.045 -0.054
-0.053 -0.094 0.168 -0.046 0.049 0.042 -0.003 -0.048 0.075 0.002 -0.055 0.189 -0.085 -0.068 -0.004 0.034 -0.012 0.080 -0.231 0.048
_J!J})_ ~~ --=M~ 0.003_ ~Q1L ~.099 __ QJ>~9_ _ -O.QQj _ ---=9.QJ~ -=-MQi -0.012 -0.157 0.111 0.010 -0.034 0.080 -0.073 0.058 -0.155 0.021 -0.134 0.101 -0.035 -0.006 -0.004 -0.161 -0.014 0.031 0.201 -0.132 0.063 0.044 0.006 -0.066 -0.162 0.044 -0.003 0.037 -0.047 0.051 0.043 -0.065 0.039 -0.036 0.073 -0.059 0.130 -0.075 0.076 0.048
_ 0.03.9_ _O~I _QJlJLt __ OJll'L _0.006 -0.08.L -0.157 _Q~943_ -=Q.Q6L __Q,Q5~ 0.098 -0.152 -0.072 -0.071 -0.001 -0.002 0.124 -0.046 0.134 -0.042
-0.217 0.086 -0.019 0.094 0.096 -0.033 0.031 -0.205 0.112 -0.005 0.004 -0.145 0.022 -0.050 -0.086 -0.026
I
-0.033 0.010 -0.057 -0.055 0.024 0.065 -0.025 0.111 0.054 -0.182 0.033 -0.035 -0.007 -0.008
-0.180 0.019 0.058 0.069 0.006 0.089 -0.166 0.113 -0.244 0.136 -0.058 -0.087 -0.039 0.015 -0.045 0.031 -0.023 -0.046 0.070 -0.096 -0.066 -0.038 0.108 -0.154 -0.052 0.185 0.061 -0.006 -0.064 0.067 -0.056 -0.010 0.141 0.018 -0.198 0.085 -0.086 0.162 -0.154 0.040 0.142 0.009 -0.156 -0.089 0.160 -0.112 0.115 -0.141 0.207 -0.081
-0.072 0.070 -0.106 -0.113 0.036 0.107 -0.068 0.059 -0.009 -0.032 0.035 -0.060 0.025 0.164 -0.228 0.042 -0.032 0.157 -0.164 -0.027 0.014 -0.070 0.023 0.122 -0.002 -0.168 -0.132 0.152 -0.217 -0.049
-0.058 -0.065 -0.100 -0.043 0.081 -0.057 0.016 -0.130 0.034 -0.018 -0.293 0.051 -0.188 0.013 0.100 0.104 0.040 -0.206 -0.068 0.088 0.902 -0.203 -0.105 -0.134 -0.092 0.007 0.185 0.070 0.066 0.038
-0.203 0.935 -0.164 -0.005 0.189 -0.021 -0.231 -0.047 -0.095 -0.158 -0.105 -0.164 0.951 -0.087 -0.083 -0.090 -0.095 0.015 0.025 0.076 -0.134 -0.005 -0.087 0.938 -0.345 -0.066 0.045 -0.117 0.014 -0.079 -0.092 0.189 -0.083 -0.345 0.893 -0.369 -0.114 -0.193 -0.011 -0.001 0.007 -0.021 -0.090 -0.066 -0.369 0.918 -0.116 0.115 -0.200 -0.082 0.185 -0.231 -0.095 0.045 -0.114 -0.116 0.920 -0.466 0.095 0.066 0.070 -0.047 0.015 -0.117 -0.193 0.115 -0.466 0.900 -0.265 0.003 0.066 -0.095 0.025 0.014 -0.011 -0.200 0.095 -0.265 0.911 -0.396 0.038 -0.158 0.076 -0.079 -0.001 -0.082 0.066 0.003 -0.396 0.923

,Appendix 6: Factor Extraction Table
Table 27 A: Eigenvalues and the Explained Percentage of variance by the Factors
Component Initial Eigenvalues Extraction Sums of Squared Loadings Total 1% of Varian eel Cumulative % Total 1% of Varian eel Cumulative %
1 16.349 37.157 37.157 16.349 37.157 37.157 2 2.908 6.608 43.766 2.908 6.608 43.766 3 2.175 4.943 48.709 2.175 4.943 48.709 4 1.837 4.174 52.883 1.837 4.174 52.883 5 1.646 3.740 56.623 1.646 3.740 56.623 6 1.462 3.323 59.945 1.462 3.323 59.945 7 1.300 2.954 62.899 1.300 2.954 62.899 8 1.138 2.587 65.487 1.138 2.587 65.487 9 1.062 2.413 67.900 1.062 2.413 67.900
10 1.003 2.280 70.180 1.003 2.280 70.180 11 0.924 2.100 72.280 12 0.877 1.994 74.275 13 0.762 1.733 76.007 14 0.712 1.617 77.624 15 0.701 1.592 79.217 16 0.646 1.469 80.686 17 0.612 1.391 82.076 18 0.578 1.313 83.390 19 0.527 1.199 84.588 20 0.502 1.140 85.728 21 0.454 1.031 86.759 22 0.442 1.005 87.764 23 0.433 0.985 88.749 24 0.397 0.903 89.652 25 0.368 0.836 90.488 26 0.352 0.800 91.288 27 0.349 0.794 92.082 28 0.323 0.734 92.816 29 0.311 0.706 93.522 30 0.300 0.682 94.204 31 0.279 0.635 94.839 32 0.256 0.582 95.421 33 0.245 0.557 95.977 34 0.231 0.525 96.503 35 0.213 0.485 96.988 36 0.200 0.455 97.442 37 0.196 0.445 97.887 38 0.176 0.399 98.286 39 0.144 0.328 98.614 40 0.143 0.326 98.939 41 0.138 0.315 99.254 42 0.128 0.290 99.544 43 0.112 0.254 99.798 44 0.089 0.202 100.000
- 130-

Appendix 7: Rotated Factor Tables Table 28A: Rotated Component Matrices with VARIMAX Rotation
1 2 3 4 5 6 7 8 9 10 a04 0.753 aOl 0.701 a05 0.700 a03 0.694 a06 0.666 a08 0.653 a02 0.621 a07 0.516 all 0.432 c14 0.685 c07 0.638 -e12 0.601 c04 0.597 0.464 c15 0.589 c03 0.549 cO2 0.506 0.416 c13 0.478 0.405 b10 0.731 b11 0.722 b13 0.636 b12 0.574 b09 0.539 b08 0.472 a14 0.819 a12 0.784 a13 0.760 c06 0.709 cOS 0.697 c08 0.587 cOl 0.489 b06 0.792 b07 0.762 b05 0.745 c10 0.769 c09 0.711 c11 0.461 0.607 b04 0.404 0.409 bOl 0.721 b03 0.699 ,
b02 0.413 0.664 a09 0.404 b14 0.888 b15 0.851 a10 0.661 Extraction Method: Principal Component Analysis. Rotation Method: Varimax with Kaiser Normalization. a Rotation converged in 20 iterations.
- 131 -

"·_"',r_ -_";'~'::~t ..:}~-... " .,,:.,..:,. __ l:"_~:""-_-"':.b::"'~_~
--.. -;.-~-- ... ---... -,'--' ..
, Table 29A: Pattern matrix with OBLIMIN Rotation
1 2 3 4 5 6 7 8 9 a04 0.764 a03 0.720 a05 0.640 a01 0.633 I
a02 0.616 a06 0.574 a08 0.559 a07 c10 0.785 c09 0.701 ell 0.620 c13 b04 b06 0.830 b07· 0.809 bOS 0.769 b14 0.946 b1S 0.890 a14 0.874 al2 0.822 al3 0.797 a09 alO 0.621 all blO -0.751 bll -0.719 bl3 -0.564 b09 -0.509 bl2 -0.476 b08 -0.441 bOI -0.754 b03 -0.720 b02 -0.696 cl4 -0.566 c07 -0.531 cIS -0.518 cl2 -0.468
,
c04 -0.462 c03 -0.424 cO2 c06 cOS c08 cOl Extraction Method: Principal Component Analysis. Rotation Method: Oblimin with Kaiser Normalization. a Rotation converged in 20 iterations.
- 132-
10
-0.445
-0.735 -0.730 -0.607 -0.401

,Appendix 8: Questionnaire Items with Orthogonal (VARIMAX)
Rotation
Table 30A: VARIMAX Rotated Component Matrix with Variables Item Components No. Item Name
a04 Lecturer~' I<.nowledge' .•.. ' .•. ' : '.' a01. . A(:~demic staffarepolite':a~d~~Urteous a05' Lecturers'tt!a.cb1lg'ability',.,,~:· a03 ~hidentsfeeiC:6irifohablehl.ll"t6letturers· ii06" . Preparation and organisati()n of classes> a08 : Uct~~ers and supporfstaffare willing to 'helpc . a02 .. :~ Oppp~tunity: top~iciIJate in·classdiscussi()~
- AcaqeinicstaA'ar~c(ii:tcerile4about' , , aOt -- student\yelfareandinterests all' Minirrium ~~ri~~ctdifficult:Y6ft~ctu~ers-"~ cl4
c07
e12 c04 cl5 c03 c02 e13
Become more competent in one's field of study Ability learn effectively on oneself, pursue ideas, and fmd the required information Gained general IT skills Ability to analyse quantitative problems Achieved ones' own expected grades Developed writing and speaking skills Developed analytical and logical thinking Gained specific IT skills
~1O' Comfort~Ql~ leCwt'erooITiS'. -". bIt QualitY eq~ipment' inlectu~eJ:o~ms .' -.. ' ~".. •. . ' .... Ii 13 C~mpus' facilities·:(e;g~parking,accorriodatjon;. cafe) , 612 - Theuniversityhas,anexc~llenf physicatlayout :. b(>9' , Qu~iityequiprilePtin 9~~puter l~bs : - c,
b08 coniptiterAcc~ssibiJiiv.: -,' a 14 Administration staff are courteous a 12 Administration staff are sympathic and reassuring
-
a 13 Administration statT so lve my pro blems at a promised time c06' Understand-peopteof(jtb~racjal( .'.-'
• 0.75 0.70 0.70
•. 0.69 .. .,' '0.6'7
0.65
2 4 ."
.',
0.621 - '" . . .... :'-~ -'~.
0.5~: . •... c_
0;43 0.68
0.64
0.60 0.60 0.59 0.55 0.51 0.48
.
'0.731
_;',
0.72 I" . ,.Ie 0:64. ~,- '
.0.57 ..... I·
\' '0.54 0.41 ..... .
0.82 0.78 0.76
5 6
c-,
. c , ..
.;
0.46
0.42
I'
··c
.
, . I, 0.71 andethhicbackgro\l~a.~tter~.:::," ... '. ~"'''' .... .
~05 ,\ rieveloliedPt(r~nalco~~,ofyaluesa~d e~hics: .... .' cOS' Abi1ityt~furi~tionas a member of a' team,' ......•... "~>.",
.. O!70. "
cOl Acquired ab~oadg~neral eduClltidnin diff~rentfieid~'" . b06 Relevant infonnation provided when required b07 Problems solved at a promised time b05 Quiet library to study cJ 0, Gatnedsome kIl6rrJedge.~dskiJls f~raPat1i~ularcarc:er:-: c09·, G~i~apcean4'in~onnati()noncare€:ropportunitiesat:W1iversitY, al', G~in~'kn~wl¥~~"~~~'SkiIlS for firstjo1;l b04 .... Extensive Book collection in library .' bO I Useful course materials b03 Relevant course materials b02 Interesting course materials a09 Prompt Return of the works
'. b14 Attitude' of studerit~ sitting nearby biS' Disturbancesdunrtgtbe.lecture . , .
0.41
a 10 Lecturer's Office Hours \
0.$9' bA9
Extraction Method: Principal Component Analysis. Rotation Method: Varimax with Kaiser Nonnalization. a Rotation converged in 20 iterations.
- 133 -
0.79 0.76 0.74
.
:
7
-'I"',
'; I'
0.40 I' . ...
" ..
. '1
.
.
I', '.
:',1:
", I'
"
' .. ,. ..: .'
.-' .....
!'.,< c::;·
.'c..:,
...
,,' .,'
,
:
'.
, .... '.'
0.72 0.70 0.66 0.40
9 10
I
.... ...... ' -"
"~.', . I,
',' ..
I
.• 1, ',' ",.: '., .,.
': ... .... '.'
Q.89 ,< ..•. 0.85 .",
0.66

Appendix 9: Multicollinearity Statistics Table 31A: Pearson Correlation Matrix, Modell
a15 IT1 IT2 IT3 IT4
a 15: Interaction Pearson Correlation 1 0.769 0.678 0.448 0.627 Sig. (2-tailed) 0.000 0.000 0.000 0.000
Quality N 220 220 220 220 220
IT1: Academic Pearson Correlation 0.769 1 0.627 0.507 0.703
Staff Sig. (2-tailed) 0.000 0.000 0.000 0.000 N 220 223 223 223 223
IT2: Pearson Correlation 0.678 0.627 1 0.393 0.486 Administration Sig. (2-tailed) 0.000 0.000 0.000 0.000
staff N 220 223 223 223 223 IT3: Academic Pearson Correlation 0.448 0.507 0.393 1 0.469
Staff Sig. (2-tailed) 0.000 0.000 0.000 0.000 Availability N 220 223 223 223 223
IT4: Course Pearson Correlation 0.627 0.703 0.486 0.469 1
Content Sig. (2-tailed) 0.000 0.000 0.000 0.000 N 220 223 223 223 223
Table 32A: Pearson Correlation Matrix, Model 2
b16 PEl PE2 PE3 b16: Physical Pearson Correlation 1 0.598 0.784 0.299 Environment Sig. (2-tailed) 0.000 0.000 0.000
Quality N 220 220 220 220
PEl: Pearson Correlation 0.598 1 0.579 0.125 Sig. (2-tailed) 0.000 0.000 0.062 Libraray N 220 223 223 223
PE2: Physical Pearson Correlation 0.784 0.579 1 0.236 Sig. (2-tailed) 0.000 0.000 0.000 Appealings N 220 223 223 223
PE3: Social Pearson Correlation 0.299 0.125 0.236 1
Factors Sig. (2-tailed) 0.000 0.062 0.000 N 220 223 223 223
Table 33A: Pearson Correlation Matrix, Model 3
c16 OCI OC2 OC3
c16: Outcome Pearson Correlation 1 0.656 0.777 0.593 Sig. (2-tailed) J 0.000 0.000 0.000
Quality N 217 217 217 217
OC 1: Personal Pearson Correlation 0.656 1 0.724 0.539 Sig. (2-tailed) 0.000 0.000 0.000 Development N 217 223 223 223
OC2: Academic Pearson Correlation 0.777 0.724 1 0.633 Sig. (2-tailed) 0.000 0.000 0.000 Development N 217 223 223 223
OC3: Career Pearson Correlation 0.593 0.539 0.633 1 Sig. (2-tailed) 0.000 0.000 0.000 Opportuni ties N 217 223 223 223
- 134-
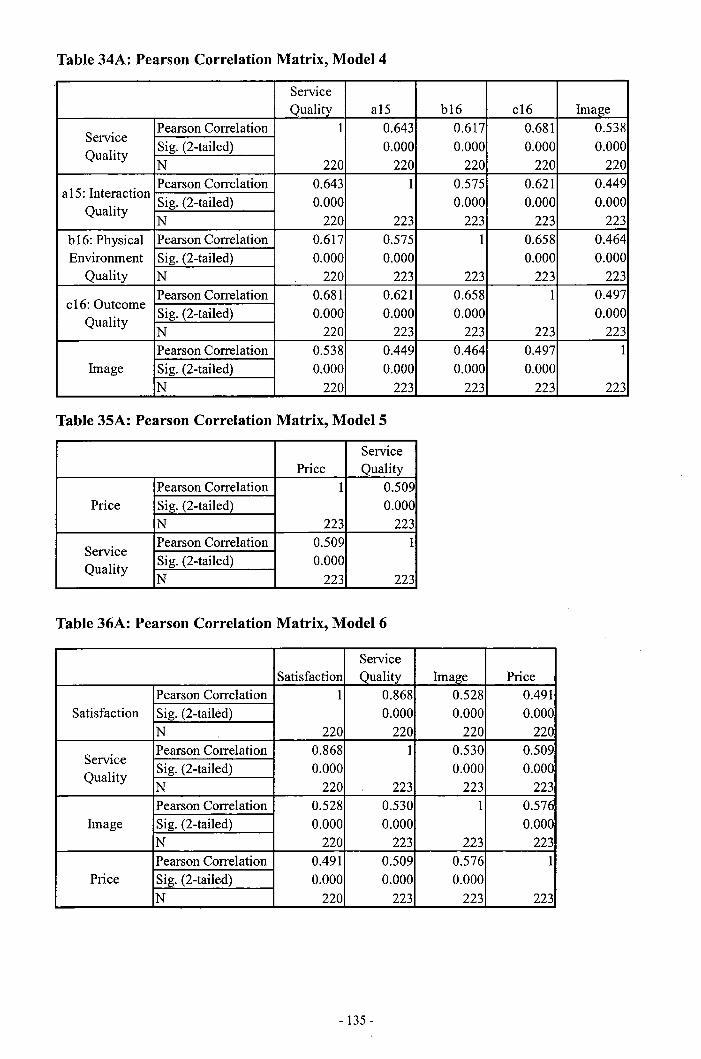
;.; .-"".,..;"~ ~j:.-;-,--: ..... :....-~,.;-~~ ~':':,..j..._~_~1 .~~:~-:'~:j
Table 34A: Pearson Correlation Matrix, Model 4
Service Quality a15
Service Pearson Correlation 1 0.643 Sig. (2-tailed) 0.000 Quality N 220 220
a15: Interaction Pearson Correlation 0.643 1 Sig. (2-tailed) 0.000 Quality N 220 223
b16: Physical Pearson Correlation 0.617 0.575 Environment Sig. (2-tailed) 0.000 0.000
Quality N 220 223
c16: Outcome Pearson Correlation 0.681 0.621 Sig. (2-tailed) 0.000 0.000 Quality N 220 223 Pearson Correlation 0.538 0.449
Image Sig. (2-tailed) 0.000 0.000 N 220 223
Table 35A: Pearson Correlation Matrix, Model 5
Service Price Quality
Pearson Correlation 1 0.509 Price Sig. (2-tailed) 0.000
N 223 223
Service Pearson Correlation 0.509 1
Quality Sig. (2-tailed) 0.000 N 223 223
Table 36A: Pearson Correlation Matrix, Model 6
Service Satisfaction Quality
Pearson Correlation 1 0.868 Satisfaction Sig. (2-tailed) 0.000
N 220 220
Service Pearson Correlation 0.868 1 Sig. (2-tailed) 0.000 Quality N 220 223 J
Pearson Correlation 0.528 0.530 Image Sig. (2-tailed) 0.000 0.000
N 220 223 Pearson Correlation 0.491 0.509
Price Sig. (2-tailed) 0.000 0.000 N 220 223
- 135 -
b16 c16 Image 0.617 0.681 0.538 0.000 0.000 0.000
220 220 220 0.575 0.621 0.449 0.000 0.000 0.000
223 223 223 1 0.658 0.464
0.000 0.000 223 223 223
0.658 1 0.497 0.000 0.000
223 223 223 0.464 0.497 1 0.000 0.000
223 223 223
Image Price 0.528 0.491 0.000 0.000
220 220 0.530 0.509 0.000 0.000
223 223 1 0.576
0.000 223 223
0.576 1 0.000
223 223

Table 37 A: Pearson Correlation Matrix, Model 7
Future Attendance Satisfaction
Future Pearson Correlation 1 0.574
Attendance Sig. (2-tailed) 0.000 N 223 221 Pearson Correlation 0.574 1
Satisfaction Sig. (2-tailed) 0.000 N 221 221
Table 38A: Pearson Correlation Matrix, Model 8
Recommend Satisfaction Pearson Correlation 1 0.644
Recommend Sig. (2-tailed) 0.000 N 222 222 Pearson Correlation 0.644 1
Satisfaction Sig. (2-tailed) 0.000 N 222 223
Table 39A: Multicollinearity Statistics
Collinearity Statistics Dependent Independent 1I(1-R2) Condition
Model Variables Variables Tolerance VIF Index
a15: Academic Staff 0.375 2.670 6.693
1 Interaction Admin Staff
2.924 0.601 1.664 7.853
Quality Academic Staff Availability 0.715 1.399 8.818 Course Content 0.466 2.146 12.812
b16: Physical Library Atmosphere 0.665 1.505 5.111 2 Environment Physical Appealings 2.907 0.638 1.566 7.801
Quality Social Factors 0.945 1.058 8.909
c 16: Outcome Personal Developement 0.456 2.191 8.089
3 Quality
Academic Development 2.695 0.373 2.683 9.154 Career Opportunities 0.559 1.788 12.763 Interaction Quality 0.548 1.824 7.113
4 Service Physical Environment Quality 2.331 0.479 2.086 8.905 Quality Outcome Quali ty 0.448 2.233 9.438
) Image 0.714 1.401 10.561 5 Price Service Quality 1.344 1.000 1.000 6.216
Service Quality 0.656 1.523 7.085 6 Satisfaction Image 4.132 0.592 1.690 8.913
Price 0.612 1.633 9.137
7 Future
Satisfaction 1.484 1.000 1.000 5.155 Attendance
8 Recommend Satisfaction 1.698 1.000 1.000 5.122
- 136-

,Appendix 10: Scatter Plots
Figure 9A: Residual Scatter Plots Dependent Variable: al5
···-····-l
o
o o
o
Regression Slandardized Predicled Value
Dependent Variable: cJ 6
3-0" i i 21
:;; 1...1 '" II i ~:l
o
o
~ '2~' cr; .3J o
L-------r---~----_.I~--~~~._--~--~_,~----~
o
: :J :>: I ~ I
~ "I o .21 ~
Regression Slandardized Predicled Value
Dependent Variable: Total Price
Q'O .g . '. g g g 0000 0
.00 00 0 og g ~ 0 0 0 0.0 . 000 0 00 0 00 0 0
opgog &,ggt>g 00000
0 '0 0 . 0 00 00'0 0 0 0 0 o 0 og &,g gog .g gOo
o g 0 00 0 00 o 0 g 8
~ J ~ LI -. ______ ~ __ 'I ____ ~~ __ _.----------._----~--~~
·2
Regression Slandardized Predicled Value
Dependent Variable: Tolal Future Auendance
Jl------·----:····------··--··-·-·-··-~···--·--·· ---I ~ 2~ 0 0 0 0 '0 0 'i,
"0 I 0 00' 0 0 ~ i 0 co°q) 00 i ] 1-1 8 ~ 0 0 0 0 ~ 0 0 o. 0 0 0 I
ll)~ : : 0 ~ ~ ~ ~ ~ ~ ~ ~ ~ : 0 0 0 0.1
iii I 0 0 0 0 '0 0 0 0 '0 0 I g oil 0 0 ~ 0 ~ 0 ~ 0 0 0 0 I .~ i 0 o'~ ~ 0 0 0 I
j .2~ 0 0 0 I ~ i
I ·2
Regression Standardized Predieled Value
- 137 -
.J
·2
o
o
o
Dependent Variable: bl6
Regression Slandardi7.ed Predicled Value
Dependent Variable: Total Service Quality
o
Dependent Variable: Total Satisfaction
Regression Slandardi7.ed Predicled Value
Dependent Variable: RCMD_recode
o o
() '0 :0
COo
o o
o '. 0·' o
o o o o
o o o
o o. o
o o q) o o o 0 o
o o o o
o o o o o o· o
o o o o o o 0'0 o o o '0
o o o
Regression Slandardi7.ed Predicled Value
o
o
o
o·
o o
o I
·1
I
I i I
i
I I I
I
I

• : :- I
~_~_"..F.~~.:.!'~i-~';;"~
-= .: ~ -~ - -- --,
,Appendix 11: Normality Plots
Figure lOA: Residual Scatter Plots
30
25
i 21l
§" 15 u.
>. u c C,) :> C'
J:
>. u
III
25
20
c I~ g . ~ u.
>. u g
10
30
ff 211 U:
-.1
Dependent Variable: al5
-2
Regression Standardized Residual
Dependent Variable: cl6
-2
Regression Standardized Residual
Dependent Variable: Total Price
-2
Regression Standardized Residual
Dependent Variable: Total Future Attendance
-2 -I
Regression Standardized Residual
M",.n = 9.97E-I~ Sld.Dev. = 0.991 N=120
Mean = 2.16E-17 Sid. Dov. = 0.99.1 1'=217
Mean = -1.%E-16 SId. Dov. = 0.998 ~=223
Mcan=7.25E·16 SilL Dev. = 0.99~ 1'=l2I
>. u c C,) ::s ffl U:
>. u c C,) ::s C' ~
U.
>. u c C,) ::s
30
ff 20 U:
10
25
i 211
ff 15 u: Ifl
- 138 -
Dependent Variable: bl6
Regression Standardized Residual
Dependent Variable: Total Service Quality
-.1 -2
Regression Standardized Residual
Dependent Variable: Total Satisfaction
.J -2
Regression Standardized Residual
Dependent Variable: RCMD_recode
•• 1 -2
Regression Standardized Residual
Mean=-1.9IE-16 Sld.Dev. = 0.99.1 N=22U
Mean = IAE·15 SId. [kv. = 0.991 1'=121
Mcan=-I.72E·15 Sid. Dev. = 0.993 N=220
Me,," = I.2~E-15 Sid. Dev. =0.'19~ N=lll
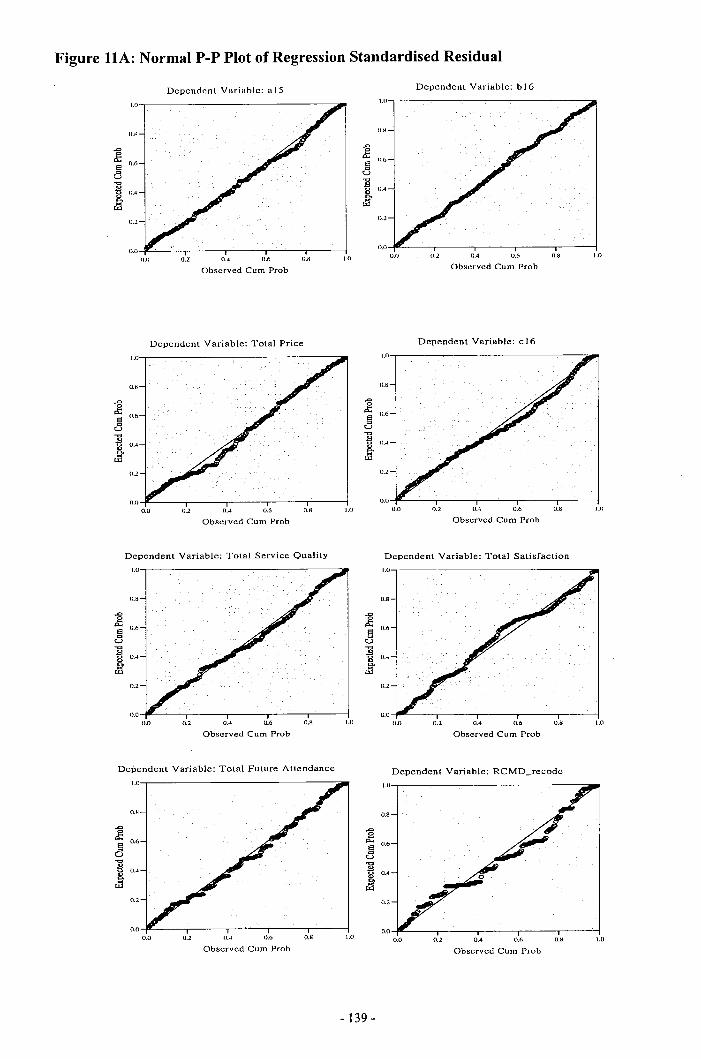
Figure IIA: Normal P-P Plot of Regression Standardised Residual
Dependent Variable: a 15 Dependent Variable: b16
1.0 1.0
O.H o.~
£ 0.6 e a "<::I B 0.4 g,
.0
J: 0.6 e a 1 0.4
~ ~ ~
U.2 0.2
0.0
1.0 U.O 0.2 0.4 0.6 O.S 1.0
Observed Cum Prob Observed Cum Prob
Dependent Variable: Total Price Dependent Variable: e 16
I.U-..--------------------- 1.0
O.S 0.8
.0
J: 0.6 ~
U -c 2 004 g, ~
U.2 0.2
O.o-i''--------y-----.----.----.--'------j 0.0
0.0 0.2 0.6 0.8 1.0 O.U 0.2 004 0.6 O.S 1.0
Observed Cum Prob Observed Cum Prob
Dependent Variable: Total Service Quality Dependent Variable: Total Satisfaction I.U--,--,--------,------,-------__ 1.0
0.8 0.8
£ 0.6 e a -c 2
0.4 g, ~
0.2 0.2
U.o-JI~~~__.__---_r_---..__~-__,,......:..--___1
0.0 0.2 004 U.6 0.8 1.0 0.2 0.4 0.6 U.S 1.0
Observed Cum Prob Observed Cum Prob
Dependent Variable: Total Future Attendance Dependent Variable: RCMD_reeode I.U-..--------------------:::~ \.0
0.8 U.8
..c g Po< 0.6 e a "<::I B U.4 ~ ~ ~
.0
J: 0.6 e a -c
~ 004 Co ~
0.2 0.2
0.0 0.2 004 0.6 0.8 1.0 U.U 0.2 0.4 U.6 0.8 1.0
Observed Cum Prob Observed Cum Prob
- 139 -

,Appendix 12: Analysis of Variance Results
Table 40A: Students' Perceptions of Satisfaction and Pertaining Constructs GENDER MAJOR
Variable Gender Frequency Mean F Siu. Male 116 3.252 0.124 0.725
Service Quality Female 107 3.303 Total 223 3.276 Male 116 3.051 0.348 0.556
Satisfaction Female 107 2.954 Total 223 3.004 Male 116 3.446 0.010 0.922
Image Female 107 3.430 Total 223 3.438 Male 116 4.187 0.025 0.874
Price Female 107 4.224 Total 223 4.205
Future Male 116 3.987 1.989 0.160
Attendance Female 107 3.669 Total 223 3.835
" ~.J".:-~:-::..,.~..r :'~~~~:".I·' ~:",~:"-"':,,"' ___ ~_L_.;. .... a~ __ I
Variable Major Frequency Mean F Sig. Accounting 34 3.333 0.504 0.899 Agribusiness 6 3.689 Business Management 34 3.351 Computing 6 2.956 Finance 51 3.388
Service Economics 8 3.000
Quality Hospitality Management 10 2.980 International Business 8 3.542 Marketing 22 3.103 Property Studies 17 3.165 Supply Chain Management 15 3.378 Tourism Management 12 2.983 Total 223 3.276 Accounting 34 2.912 0.584 0.841
Male 116 3.828 2.044 0.154 Agribusiness 6 3.389
Recommend Female 107 3.477 Business Management 34 3.108
Total 223 3.659 Computing 6 2.833 Finance 5 I 3.131
AGE Economics 8 2.792 Variable Aue Frequency Mean F Siu.
18-24 157 3.282 0.017 0.895 Service Quality 25+ 66 3.261
Total 223 3.276 18-24 157 2.986 0.126 0.723
Satisfaction 25+ 66 3.050 Total 223 3.004 18-24 157 3.462 0.216 0.643
Image 25+ 66 3.382 Total 223 3.438 18-24 157 4.304 1.743 0.188
Price 25+ 66 3.970 Total 223 4.205
Future 18-24 157 3.813 0.088 0.76
Attendance 25+ 66 3.886 Total 223 3.835 18-24 157 3.618 0.268 0.605
Recommend 25+ 66 3.758 Total 223 3.659
Satisfaction Hospitality Management 10 2.600 International Business 8 3.500 Marketing 22 2.923 Property Studies 17 2.985 Supply Chain Management IS 3.130 Tourism Management 12 2.500 Total 223 3.004 Accounting 34 3.226 1.192 0.294 Ab'libusiness 6 3.458 Business Management 34 3.584 Computing 6 3.060 Finance 51 3.338 Economics 8 2.594
Image Hospitality Management 10 3.150 International Business 8 4.156 Marketing 22 3.619 Property Studies 17 3.846 Supply Chain Management 15 3.555 Tourism Management 12 3.500
ETHNICITY Total 223 3.438 Variable Ethnicitv Frequency Mean F Sig.
Western 87 3.034 7.283 0.007 Service Quality Asian 136 3.431
Total 223 3.276 Western 87 2.602 16.353 0.000 •
Satisfaction Asian 136 3.262 Total 223 3.004 Western 87 3.380 0.345 0.557
Image Asian 136 3.475 Total 223 3.438 Western 87 3.727 11.435 0.001·
Price Asian 136 4.511 Total 223 4.205
Future Western 87 3.486 6.244 0.013 •
Attendance Asian 136 4.057 Total 223 3.835 Western 87 3.172 10.458 0.001 •
Accounting 34 4.176 1.327 0.211 Agribusiness 6 3.750 Business Management 34 4.029 Computing 6 4.833 Finance 51 4.480 Economics 8 2.563
Price Hospitality Management 10 3.800 International Business 8 4.938 Marketing 22 4.147 Property Studies 17 4.029 Supply Chain Management 15 4.833 Tourism Management 12 4.042 Total 223 4.205 Accounting 34 3.515 0.788 0.652 Agribusiness 6 4.135 Business Management 34 3.794
Recommend Asian 136 3.971 Total 223 3.659
YEAR OF STUDY
Variable Year Frequency Mean F Sig.
Computing 6 3.250 Finance 51 4.104
Future Economics 8 3.688
Attendance Hospitality Management 10 4.150 International Business 8 4.750
200 level 91 3.409 2.313 0.130 Service Quality 300 level 132 3.185
Total 223 3.276 200 level 91 3.110 1.133 0.288
Satisfaction 300 level 132 2.932 Total 223 3.004 200 level 91 3.466 0.083 0.774
Image 300 level 132 3.419 Total 223 3.438 200 level 91 4.129 0.298 0.586
Price 300 level 132 4.258 Total 223 4.205
Future 200 level 91 4.113 4.271 0.040 •
Attendance 300 level 132 3.643 Total 223 3.835 200 level 91 3.945 3.775 0.053 •
Recommend 300 level 132 3.462 Total 223 3.659
Marketing 22 3.477 Property Studies 17 3.647 Supply Chain Management 15 4.233 Tourism Management 12 3.500 Total 223 3.835 Accounting 34 3.471 0.763 0.677 Agribusiness 6 3.500 Business Management 34 3.618 Computing 6 3.167 Finance 51 4.059 Economics 8 3.125
Recommend Hospitality Management 10 3.800 International Business 8 4.500 Marketing 22 3.227 Property Studies 17 3.353 Supply Chain Management 15 4.067 Tourism Management 12 3.333 Total 223 3.659
- 140-

T~ble 41A: Students' Perceptions of the Primary Dimensions of Service Quality GENDER MAJOR
Variable Gender Frequency Mean F Sig.
Interaction Male 116 2.895 0.089 0.766
Quality Female 107 2.849 Total 223 2.873
Variable Maior Frequency Mean F Si~.
Accounting 34 2.820 1.214 0.279 Agribusiness 6 3.500 Business Management 34 2.824 Computing 6 2.167
Physical Male 116 2.957 0.010 0.921 Environment Female 107 2.972
Quality Total 223 2.964
Finance 51 2.860
Interacti on Economics 8 2.625
Quality Hospitality Management 10 2.800 International Business 8 4.000
Outcome Male 116 2.931 0.000 0.990
Quality Female 107 2.933 Total 223 2.932
Marketing 22 2.864 Property Studies 17 3.000 Supply Chain Management 15 2.867 Tourism Management 12 2.583
Age Total 223 2.873 Variable Age Frequency Mean F Sig. Accounting 34 2.941 0.960 0.484
Interaction 18-24 157 2.904 0.368 0.545
Quality 25+ 66 2.801 Total 223 2.873
Agribusiness 6 3.667 Business Management 34 2.941 Computing 6 2.833 Finance 51 3.176
Physical 18-24 157 2.962 0.002 0.962 Physical Economics 8 2.500 Environment 25+ 66 2.970 Environment Hospitality Management 10 2.500
Quality Total 223 2.964
Outcome 18-24 157 2.942 0.029 0.865
Quality 25+ 66 2.909 Total 223 2.932
Quality International Business 8 3.250 Marketing 22 2.955 Property Studies 17 2.765 Supply Chain Management 15 3.133 Tourism Management 12 2.500 Total 223 2.964
ETHNICITY Accounting 34 2.853 0.789 0.651 Variable Ethnicitv Frequency Mean F Sig. Agribusiness 6 3.167
Interaction Westem 87 2.721 2.506 0.115
Quality Asian 136 2.971 Total 223 2.873
Physical Westem 87 2.701 7.904 0.005 Environment Asian 136 3.132
Business Management 34 3.029 Computing 6 3.167 Finance 51 2.940
Outcome Economics 8 2.250
Quality Hospitality Management 10 2.600 International Business 8 3.375
Quality Total 223 2.964 Marketing 22 2.773
Outcome Westem 87 2.792 1.634 0.203
Quality Asian 136 3.022 Total 223 2.932
Property Studies 17 3.059 Supply Chain Management 15 3.467 Tourism Management 12 2.494 Total 223 2.932
YEAR OF STUDY Variable Year Frequency Mean F Sig.
Interaction 200 level 91 3.052 3.752 0.054
Quality 300 level 132 2.750 Total 223 2.873
Physical 200 level 91 3.055 0.985 0.322 Environment 300 level 132 2.902
Quality Total 223 2.964
Outcome 200 level 91 3.196 6.420 0.012
Quality 300 level 132 2.750 Total 223 2.932
- 141 -

Table 42A: Students' Perceptions of Sub-dimensions of Service Quality
GENDER AGE Variable Gender Frequency Mean F Sig. Variable Age Frequency Mean F Sig.
Academic Staff Male 116 2.672 1.451 0.230 Academic Staff 18-24 157 2.562 0.931 0.336 Female 107 2.524 25+ 66 2.692 Total 223 2.601 Total 223 2.601
Administration Male 116 2.828 0.280 0.597 Administration 18-24 157 2.868 0.000 0.999 Staff Female 107 2.912 Staff 25+ 66 2.869
Total 223 2.868 Total 223 2.868 Academic Staff Male 116 2.856 1.864 0.174 Academic Staff 18-24 157 2.827 0.130 0.719 Availability Female 107 3.062 Availability 25+ 66 2.758
Total 223 2.955 Total 223 2.806 Course Content Male 116 2.742 2.497 0.115 Course Contelit 18-24 157 2.646 0.000 0.997
Female 107 2.542 25+ 66 2.646 Total 223 2.646 Total 223 2.646
Library Male 116 2.856 1.568 0.212 Library 18-24 157 2.916 0.539 0.464 Atmosphere Female 107 3.062 Atmosphere 25+ 66 3.048
Total 223 2.955 Total 223 2.955 Physically Male 116 3.069 0.008 0.929 Physically 18-24 157 3.030 0.528 0.468 Appealing Female 107 3.057 Appealing 25+ 66 3.143
Total 223 3.063 Total 223 3.063 Social Male 116 3.078 2.816 0.095 Social 18-24 157 2.962 0.164 0.686 Factors Female 107 2.789 Factors 25+ 66 2.885
Total 223 2.939 Total 223 2.939 Personal Male 116 2.758 0.240 0.625 Personal 18-24 157 2.815 0.557 0.456 Development Female 107 2.817 Development 25+ 66 2.716
Total 223 2.786 Total 223 2.786 Academic Male 116 2.753 0.171 0.680 Academic 18-24 157 2.742 0.113 0.738 Development Female 107 2.702 Development 25+ 66 2.697
Total 223 2.728 Total 223 2.728 Career Male 116 2.946 0.893 0.346 Career 18-24 157 3.007 0.007 0.933 Opportunities Female 107 3.082 Opportunities 25+ 66 3.021
Total 223 3.011 Total 223 3.0\ I
ETHNICllY YEAR OF STUDY
Variable Ethnicity Frequency Mean F Sig. Variable Year Frequency Mean F Sig. Academic Staff Western 87 2.558 0.311 0.578 Academic Staff 200 level 91 2.770 5.353 0.022
Asian 136 2.628 300 level 132 2.484 Total 223 2.601 Total 223 2.601
Administration Western 87 2.736 1.802 0.181 Administration 200 level 91 2.983 1.447 0.230 Staff Asian 136 2.953 Staff 300 level 132 2.789
Total 223 2.868 Total 223 2.868 Academic Staff Western 87 2.975 2.390 0.124 Academic Staff 400 level 91 2.932 1.426 0.234 Availability Asian 136 2.699 Availability 500 level 132 2.720
Total 223 2.806 Total 223 2.806 Course Content Western 87 2.695 0.384 0.536 Course Content 200 level 91 2.916 13.115 0.000
Asian 136 2.615 300 level 132 2.460 Total 223 2.646 Total 223 2.646
Library Western 87 2.853 0.999 0.319 Library 200 level 91 2.917 0.150 0.699 Atmosphere Asian 136 3.020 Atmosphere 300 level 132 2.981
Total 223 2.955 Total 223 2.955 Physically Western 87 3.067 0.002 0.966 Physically 200 level 91 3.169 1.551 0.214 Appealing Asian 136 3.061 Appealing 300 level 132 2.990
Total 223 3.063 Total 223 3.063 Social Western 87 2.759 2.829 0.094 Social 200 level 91 2.890 0.223 0.638 Factors Asian 136 3.055 Factors 300 level 132 2.973
Total 223 2.939 Total 223 2.939 Personal Western 87 2.763 0.096 0.757 Personal 200 level 91 3.065 15.789 0.000 * Development Asian 136 2.801 Development 300 level 132 " 2.593
Total 223 2.786 Total 223 2.786 Academic Western 87 2.523 7.477 0.007 Academic 200 level 91 2.973 11.580 0.001 * Development Asian 136 2.860 Development 300 level 132 2.560
Total 223 2.728 Total 223 2.728 Career Western 87 2.630 19.692 0.000 *** Career 200 level 91 3.0\ I 0.000 1.000 Opportunities Asian 136 3.255 Opportunities 300 level 132 3.011
Total 223 3.011 Total 223 3.011
- 142 -

MAJOR
Vmiable Maior Frequency Mean F Sill. Variable Major FreQuenc\, Mean F Si~.
Accounting 34 2.636 1.465 0.147 Accounting 34 3.319 0.579 0.845 Agribusiness 6 2.704 Agribusiness 6 3.250 Business Management 34 2.650 Business Management 34 3.044 Computing 6 1.815 Computing 6 2.694 Finance 51 2.666 Finance 51 3.116
Academic Economics 8 2.111
Staff Hospitality Management 10 2.389 International Business 8 3.250
Physical Economics 8 2.562 Hospitality Management 10 2.967 Appealing International Business 8 3.083
Marketing 22 2.343 Marketing 22 3.063 Property Studies 17 2.732 Property Studies 17 2.912 Supply Chain Management 15 2.889 Supply Chain Management 15 3.167 Tourism Management 12 2.417 Tourism Management 12 2.750 Total 223 2.601 Total 223 3.063 Accounting 34 3.045 0.889 0.552 Accounting 34 2.632 1.107 0.357 A"rribusiness 6 2.867 Agribusiness 6 3.417 Business Management 34 2.911 Business Management 34 2.676 Computing 6 2.222 Computing 6 3.417
"-.~'-'--C-_: "'~:':-'~-L~ ____ "!.:-'-~ Finance 51 2.876 Finance 51 3.038
Administration Economics 8 2.583
Staff Hospitality Management 10 2.995 International Business 8 3.792
.~:: ..... ~ .. _-_;:._a.:: ......... -~: .... ~ Social
Economics 8 3.063
Factors Hospitality Management 10 2.400 International Business 8 3.000
Marketing 22 2.803 Marketing 22 3.250 Property Studies 17 2.627 Property Studies 17 3.118 Supply Chain Management 15 2.822 Supply Chain Management 15 3.433 Tourism Management 12 2.528 Tourism Management 12 2.542 Total 223 2.868 Total 223 2.939 Accounting 34 2.941 1.644 0.088 Accounting 34 3.059 0.693 0.745 Agribusiness 6 3.833 Agribusiness 6 3.125 Business Management 34 2.818 Business Management 34 2.683 Computing 6 2.667 Computing 6 2.792 Finance 51 2.608 Finance 51 2.766
Academic Staff Economics 8 1.750
Availability Hospitality Management 10 2.300 International Business 8 3.625
Personal Economics 8 2.594
Development Hospitality Management 10 2.750 International Business 8 2.656
Marketing 22 2.909 Marketing 22 2.614 Property Studies 17 3.235 Property Studies 17 2.926 Supply Chain Management 15 2.800 Supply Chain Management 15 2.867 Tourism Management 12 2.583 Tourism Management 12 2.479 Total 223 2.806 Total 223 2.786 Accounting 34 2.806 1.170 0.310 Accounting 34 2.816 0.995 0.452 Agribusiness 6 3.500 Agribusiness 6 3.095 Business Management 34 2.527 Business Management 34 2.705 Computing 6 2.167 Computing 6 2.635 Finance 51 2.538 Finance 51 2.730
Course Economics 8 2.208
Content Hospitality Management 10 2.750 International Business 8 2.688
Academic Economics 8 2.250
Development Hospitality Management 10 2.357 International Business 8 2.960
Marketing 22 2.507 Marketing 22 2.788 Property Studies 17 2.691 Property Studies 17 2.687 Supply Chain Management 15 2.950 Supply Chain Management 15 3.121 Tourism Management 12 2.792 Tourism Management 12 2.333 Total 223 2.646 Total 223 2.728 Accounting 34 3.061 0.951 0.492 Accounting 34 2.843 1.135 0.335 Abrribusiness 6 3.278 Agribusiness 6 3.056 Business Management 34 2.860 Business Management 34 3.002 Computing 6 2.167 Computing 6 3.390 Finance 51 3.019 Finance 51 3.235 Economics 8 2.250
Library Hospitality Management 10 3.053 International Business 8 3.703
Career Economics 8 2.833
Opportunities Hospitality Management 10 2.468 International Business 8 2.750
Marketing 22 2.894 Marketing 22 2.821 Property Studies 17 2.961 Property Studies 17 3.177 Supply Chain Management 15 3.153 Supply Chain Management 15 3.467 Tourism Management 12 2.632 Tourism Management 12 2.639 Total 223 2.955 Total 223 3.011
:.._..i-_~_O-.. "' __ .. _ .. "'_L ... -"': ... ""
- 143 -