Embed Size (px)
Citation preview
An Empirical Approach to Site Assessment for
Vapor Intrusion Presented by:
Helen Dawson, HydrogeologistSusan Griffin, Toxicologist
USEPA Region 8Denver, CO
NSAS Conference 2007

An Empirical Approach to Site Assessment for Vapor Intrusion
OutlineVapor Intrusion Assessment Issues
EPA’s Empirical Vapor Intrusion Database
Billings PCE Site Case Study

Vapor Intrusion Assessment Issues
Multiple potential subsurface and exposure scenarios
Spatial and temporal variability
Indoor and ambient air sources

Vapor Intrusion PathwayPotential Scenarios
Generic CSM
T. McAlary

1108.2
30
29
23
13
73
5.8 15
7.1 5.91815
120
14
73
1447
6.95.9
5.7
22
15
21815.9
175.6
37
84
15
22
9.3
11
12
8.4
515.4
10
31
18
1315
6.646
7.1
91
39
2357
5272
22
20382233
REDFIELD1478 & 1488 SO. KRAMERIA
52 µg/m34 µg/m3
Indoor Air Spatial Variability

Spatial (and Temporal) VariabilityGroundwater
Soil Gas
Sub-Slab

Background Indoor Air Conc. Literature Review
0.5
4
0.02
155 7
0.5
0.01
0.2 0.1
209
5.2
0.4
2294
1.10.3
0.001
0.01
0.1
1
10
100
1000
10000
Car
bon
tetr
achl
orid
e
Chl
orof
orm
1,1-
Dic
hlor
oeth
ylen
e
Met
hyle
ne c
hlor
ide
Tetr
achl
oroe
thyl
ene
1,1,
1-Tr
ichl
oroe
than
e
Tric
hlor
oeth
ylen
e
Viny
l chl
orid
e
Indo
or A
ir C
onc.
(ug/
m3)
90th Percentile
10E-6 RBC
21 studies compiled Dawson, 2007

Background Indoor Air ConcentrationsTetrachloroethylene (ug/m3)
Reference Sample Dates N %Detect RL 25% 50% 75% 90% 95% 98% Max
Sheldon et al, 1992 1990 4 100 0.28 1.7 3.1 11 17
Clayton et al 1999 1995 - 1997 370 58 1.6 <1.6 1.9 4.1 7.0 9.1 13 660
US EPA 2003 1994-1998 70 96 0.35 0.77 1.5 3.6 8.5 18 26 33
Sexton et al 2004 1999 292 98 0.6 3.8
Foster et al (2002); Kurtz (PC 2005) 1998 - 2001 427 63 0.68 <0.68 0.9 1.7 4.3 7.5 12 42
Kurtz & Folkes 2002 1998 - 2001 282 70 0.68 <0.68 1.0 1.9 4.5 6.5 9.6 440
NYSDOH 2004 1997 - 2003 406 56 0.25 <0.25 0.3 1.1 2.8 3.9 9.0 51
Zhu et al, 2005 2002 - 2003 75 83 0.03 0.5 1.4 3.3 9.2
Median 1 2 4 8 12 42
H. Dawson (2007)
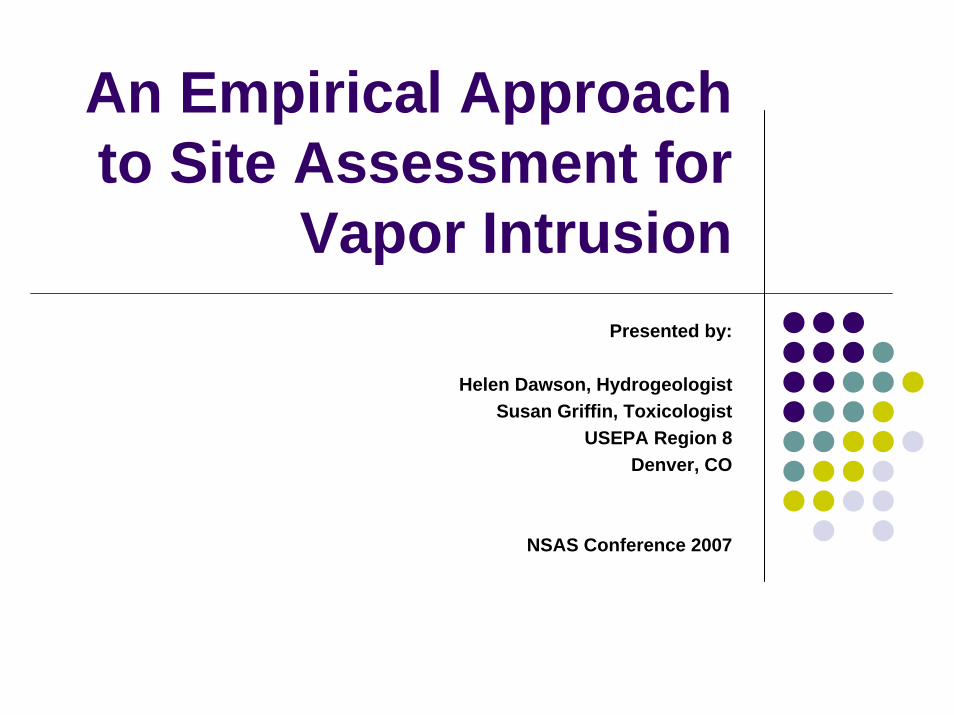
EPA’s Empirical Database of Vapor Intrusion Sites
43 Total sites (33 CHC, 12 PHC)
36 sites with paired indoor air / groundwater14 sites with paired indoor air / subslab19 sites with paired indoor air / soil gas
2570 paired measurements (2500 CHC, 70 PHC)
1143 paired indoor air / groundwater1549 paired indoor air / subslab186 paired indoor air / soil gas

Filterable Spreadsheet Database
Site Characteristics:Site, chemical, medium, building type, foundation type, soil type, etc...
Data quality:> DL, source “strength”, data consistency

What does the database show us?
Sub-slab – indoor air attenuation
Groundwater – indoor air attenuation

Sub-Slab / Indoor Air AttenuationSubslab Attenuation
Stat DatabaseMin 3.5E-05
25% 1.4E-0350% 2.8E-0375% 7.2E-0395% 2.9E-02Max 2.3E+00
Indoor Air vs Sub-Slab Concentration
1.E-03
1.E-02
1.E-01
1.E+00
1.E+01
1.E+02
1.E+03
1.E+04
1.E+00 1.E+01 1.E+02 1.E+03 1.E+04 1.E+05 1.E+06
Sub-Slab Concentration (ug/m3)
Indo
or A
ir C
once
ntra
tion
(ug/
m3)
EPA Data (IA>DL)Alpha = 1.0Alpha = 0.1EPA Data Alpha = 95%EPA Data Alpha = 75%EPA Data Alpha = 50%EPA Data Alpha = 25%
SubslabAttenuation Factors
1.0E-05
1.0E-04
1.0E-03
1.0E-02
1.0E-01
1.0E+00
1.0E+01
Dat
abas
e
Sub
slab
AF
Max
95th %
Mean
50th %
Min

Groundwater / Indoor Air Attenuation
Groundwater Attenuation Factors
1.0E-07
1.0E-06
1.0E-05
1.0E-04
1.0E-03
1.0E-02
1.0E-01
1.0E+00
Dat
abas
e
Gro
undw
ater
AF
Max
95th %
Mean
50th %
Min
Indoor Air vs Groundwater Vapor Concentration
1.E-03
1.E-02
1.E-01
1.E+00
1.E+01
1.E+02
1.E+03
1.E+04
1.E+01 1.E+02 1.E+03 1.E+04 1.E+05 1.E+06 1.E+07 1.E+08
Groundwater Vapor Concentration (ug/m3)
Indo
or A
ir C
once
ntra
tion
(ug/
m3)
EPA Data (IA>DL)
Alpha = 1.0
Alpha = 0.001
EPA Data Alpha = 95%
EPA Data Alpha = 75%
EPA Data Alpha =50%
EPA Data Alpha = 25%
Grounwater AttenuationStat DatabaseMin 4.8E-07
25% 2.6E-0550% 8.5E-0575% 2.3E-0495% 1.1E-03Max 2.1E-02

What does the database show us?Typical range of attenuation factors:
Groundwater/indoor air: ~ 0.001 (95%); ~ 0.0001 (50%)Sub-slab/indoor air: ~ 0.03 (95%); ~ 0.003 (50%)
For a given source concentration (groundwater or subslab) indoor air concentrations vary over two to three orders of magnitude.
Indoor source (background concentration) influence is significant.
For a given pair of indoor and subsurface samples, attenuation factors for the chemicals analyzed are similar.
Coarser-grained vadose zone materials lead to generally higher indoor air impacts.

Case Study: Billings PCE Site
Billings PCE Site Boundary

Adverse Health Effects of PCEDepression of respiration and cardiac arrhythmias (> 1,000,000 ppb)Reproductive and developmental effects (>300,000 ppb)Liver and kidney toxicity (>100,000 ppb for exposures ranging from days to months, > 10,000 ppb for exposures lasting several years or more)Neurological effects such as dizziness, mood changes, sleepiness (> 10,000 ppb)

Adverse Health Effects of PCEPCE exposure is associated with liver and kidney tumors in mice and rats after a lifetime of exposure
EPA considers PCE to be a probable carcinogen in humans
EPA assumes that there is no threshold for a carcinogen and assesses risk based on the probability of a person coming down with cancer (e.g., a 1 in 100,000 chance).
EPA evaluates the potential for both cancer and non-cancer effects in a community and selects the most sensitive endpoint

Groundwater Investigation

Sub-Slab & Indoor Air Investigation
A
A’
B
B’

Center Line of Plume
Depth of Basement
160023,000
20382105
919575
469
273
Sand and gravel
A
A’

2nd Street Depth of Basement
189 469
31410-278 2
Sand and gravelB
B’
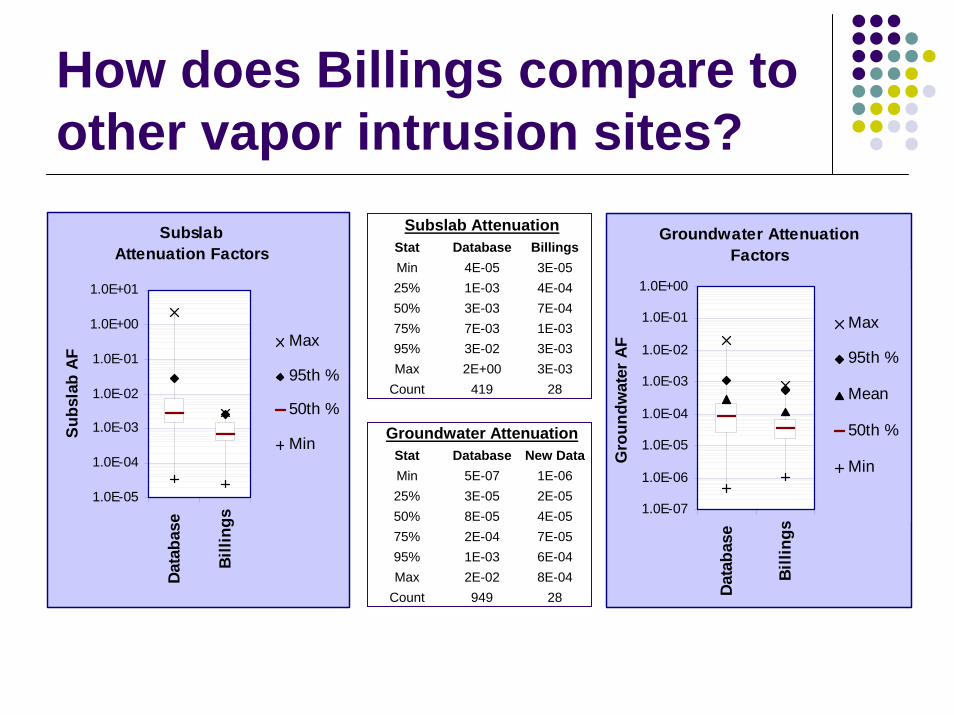
How does Billings compare to other vapor intrusion sites?
SubslabAttenuation Factors
1.0E-05
1.0E-04
1.0E-03
1.0E-02
1.0E-01
1.0E+00
1.0E+01
Data
base
Billi
ngs
Subs
lab
AF
Max
95th %
50th %
Min
Groundwater Attenuation Factors
1.0E-07
1.0E-06
1.0E-05
1.0E-04
1.0E-03
1.0E-02
1.0E-01
1.0E+00
Data
base
Billi
ngs
Gro
undw
ater
AF
Max
95th %
Mean
50th %
Min
Subslab AttenuationStat Database BillingsMin 4E-05 3E-0525% 1E-03 4E-0450% 3E-03 7E-0475% 7E-03 1E-0395% 3E-02 3E-03Max 2E+00 3E-03
Count 419 28
Groundwater AttenuationStat Database New DataMin 5E-07 1E-0625% 3E-05 2E-0550% 8E-05 4E-0575% 2E-04 7E-0595% 1E-03 6E-04Max 2E-02 8E-04
Count 949 28

OSWER VAPOR INTRUSION GUIDANCEGeneric Screening Level Concentrations ( Revised November 2006)
Selected Parameters Value SymbolEnter Exposure Scenario Residential ScenarioEnter Target Risk for Carcinogens 1.00E-04 CR_GEnter Target Hazard Quotient for Non-Carcinogens 1 HQ_GEnter Average Groundwater Temperature (oC) 15 Tgw
Target Indoor Air Conc. @ R=0.0001 or
HQ=1Toxicity
Basis
Target Sub-Slab
or Soil GasConc. @
R=0.0001 or HQ=1
Target Ground
Water Conc. @ R=0.0001
or HQ=1
Target Ground Water Conc.
< MCL?Cia, target Csg Cgw Cgw<MCL?
CASN Chemical Name (ug/m3) C/NC (ug/m3) (ug/L) Yes/No (MCL)127184 Tetrachloroethylene 41 C 412 96 No (5)
Notes:(1) Inhalation Pathway Exposure Parameters (RME): Units Symbol Value Symbol Value
Exposure Scenario Residential CommercialAveraging time for carcinogens (yrs) Atc_R 70 Atc_C 70Averaging time for non-carcinogens (yrs) Atnc_R 30 Atnc_C 25Exposure duration (yrs) ED_R 30 ED_C 25Exposure frequency (days/yr) EF_R 350 EF_C 250Exposure time m3/day ET_R 24 ET_C 8
(2) Generic Attenuation Factors:Source Medium of VaporsGroundwater ( - ) AFgw_R 0.001 AFgw_C 0.001Sub-Slab or Soil Gas ( - ) Afss_R 0.1 Afss_C 0.1
Unit Risk Factor
Reference Conc.
Target Indoor Air Conc. for
Carcinogens
Target Indoor Air Conc. for
Non-Carcinogen
sURF RfC Cia,c Cia,nc
(µg/m3)-1 (mg/m3) (ug/m3) (ug/m3)5.90E-06 2.00E-01 41 209

Bilings PCE Site: Subslab Attenuation
Indoor Air vs Sub-Slab Concentration
1.E-01
1.E+00
1.E+01
1.E+02
1.E+03
1.E-01 1.E+00 1.E+01 1.E+02 1.E+03 1.E+04 1.E+05 1.E+06 1.E+07
Sub-Slab Concentration (ug/m3)
Indo
or A
ir C
once
ntra
tion
(ug/
m3)
Building Alpha
Alpha = 1.0
Alpha = 0.1
EPA 95% Alpha = 0.03
Billings 95% Alpha = 0.003
RBC 10E-4

Billings PCE Site: Groundwater Alpha
Indoor Air vs Groundwater Concentration
1.E+00
1.E+01
1.E+02
1.E+03
1.E+01 1.E+02 1.E+03 1.E+04 1.E+05
Groundwater Concentration (ug/L)
Indo
or A
ir C
once
ntra
tion
(ug/
m3)
Building Alpha
EPA 95% Alpha = 0.001
EPA 50% Alpha ~ 0.0001
RBC 10E-4
Sand/ cobbles under buildingSilt/clay under building
Billings PCE SiteData Analysis & Interpretation
Multiple lines of evidenceGroundwater plume defined
Indoor air and sub-slab sampling indicate vapor intrusion pathway is complete
Paired indoor air and subslab data attenuation factors fall within the range of attenuation factors in EPA’s vapor intrusion database.
Site specific attenuation factors used to define area with unacceptable risks.
Evaluate remedial options.