Embed Size (px)
Citation preview
Sensors 2015, 15, 22941-22955; doi:10.3390/s150922941
sensors ISSN 1424-8220
www.mdpi.com/journal/sensors
Article
An Electrochemical Impedance Spectroscopy-Based Technique to Identify and Quantify Fermentable Sugars in Pineapple Waste Valorization for Bioethanol Production
Claudia Conesa 1,*, Eduardo García-Breijo 2, Edwin Loeff 2, Lucía Seguí 1, Pedro Fito 1 and
Nicolás Laguarda-Miró 2,*
1 Instituto de Ingeniería de Alimentos para el Desarrollo (IIAD), Universitat Politècnica de València,
Camí de Vera s/n, 46022 Valencia, Spain; E-Mails: [email protected] (L.S.);
[email protected] (P.F.) 2 Centro de Reconocimiento Molecular y Desarrollo Tecnológico (IDM), Unidad Mixta Universitat
Politècnica de València, Universitat de València, Camí de Vera s/n, 46022 Valencia, Spain;
E-Mails: [email protected] (E.G.-B.); [email protected] (E.L.)
* Authors to whom correspondence should be addressed; E-Mails: [email protected] (C.C.);
[email protected] (N.L.-M.); Tel.: +34-963877007 (ext. 83626) (C.C.);
+34-963877007 (ext. 71848) (N.L.-M.); Fax: +34-963877189 (N.L.-M.).
Academic Editor: Alexander Star
Received: 1 July 2015 / Accepted: 8 September 2015 / Published: 11 September 2015
Abstract: Electrochemical Impedance Spectroscopy (EIS) has been used to develop a
methodology able to identify and quantify fermentable sugars present in the enzymatic
hydrolysis phase of second-generation bioethanol production from pineapple waste. Thus,
a low-cost non-destructive system consisting of a stainless double needle electrode associated
to an electronic equipment that allows the implementation of EIS was developed. In order to
validate the system, different concentrations of glucose, fructose and sucrose were added to
the pineapple waste and analyzed both individually and in combination. Next, statistical data
treatment enabled the design of specific Artificial Neural Networks-based mathematical
models for each one of the studied sugars and their respective combinations. The obtained
prediction models are robust and reliable and they are considered statistically valid (CCR%
> 93.443%). These results allow us to introduce this EIS-based technique as an easy, fast,
non-destructive, and in-situ alternative to the traditional laboratory methods for enzymatic
hydrolysis monitoring.
OPEN ACCESS
Sensors 2015, 15 22942
Keywords: bioethanol; saccharification; electrochemical impedance spectroscopy;
fermentable sugars; pineapple waste
1. Introduction
The search for sustainable and environmentally friendly energy sources alternative to fossil fuels is
raising the investigation of agro-industrial wastes as potential inputs for second-generation bioethanol
production. In this sense, pineapple is generating a growing interest as its world production is steadily
increasing and has reached 24 million tons in 2014 [1]. Nowadays, around 33% of its production is being
processed, mainly by canning and juice industry [2] and its industrial waste (crown, pulp and peel),
representing about 50% (W/W) of the total processed fruit [3], cannot be neglected. In addition, its
bio-chemical composition reinforces the interest in this waste as a potential source for bioethanol
production because of its high content of cellulose and hemicellulose [4–6].
In order to produce bioethanol from lignocellulosic biomass, it is necessary to hydrolyze cellulose
(polymer of D-glucose units linked by β-1,4-glycosidic bonds) and hemicellulose (polymer of pentoses,
hexoses and uronic acids) into fermentable sugars [7]. This is the most complex phase in the bioethanol
production process and can be performed by chemical or enzymatic hydrolysis. The enzyme-based
saccharification is more efficient than the chemical hydrolysis, showing higher selectivity and lower
energy costs. On the contrary, it is particularly complex due to the mechanism of the enzymatic hydrolysis
and the relationship between the enzyme and the substrate structure [8].
Nowadays, there are several complex laboratory techniques for the identification and quantification
of sugars generated during enzymatic hydrolysis processes, such as gas chromatography, high performance
liquid chromatography, and enzymatic methods, even though the latter are generally applied for the
quantification of a single type of sugar [9,10]. These techniques are very precise and considered as a
reference but they are slow, expensive, destructive, and require skilled labor to be conducted.
Over the last few years, several electrochemical-based techniques have been raising and nowadays
they are showing promising results for the identification of chemical compounds in an easy, rapid,
non-destructive, and online way. In this regard, EIS is one of the most remarkable ones. This technique
allows the analysis of the properties of the materials by a successive application of alternate electric
signals at different frequencies (sinusoidal voltage or current) in the test sample, the subsequent registration
of the current or voltage responses within an electrochemical cell and the calculation of the impedance
value for each signal [11,12]. EIS has been successfully applied in several fields such as medicine [13–15],
materials science and engineering [16–18], water [19] and environmental engineering [20]. EIS has also
been widely applied in food engineering: study of salt levels in food products [21–24] quality control of
fish [25–27] and meat products [28,29], and novel food processes [30,31].
In these electrochemical techniques, an appropriate statistical treatment of the obtained data
becomes fundamental because of its large size. In this sense, Principal Components Analysis (PCA) and
Partial Leasts Squares (PLS) are quite usual and efficient but nowadays Artificial Neural Networks
(ANNs) have been raised as very promising and alternative methods to conduct sample classifications
and pattern recognition [32]. These methods are called neural networks because of their similarity to the
Sensors 2015, 15 22943
way the human brain processes information [33]. ANNs, as a biological brain, have a set of neurons
linked together in a complex way and are able to treat information in a multifunctional process.
In addition, ANNs are able to learn in their training process in order to improve themselves and find the
optimal conditions to work showing high flexibility and adaptive capacity. In addition, ANNs are being
used in a wide range of applications such as electronic noses [34,35] and tongues [36,37] and they are
showing very interesting prediction models in several fields such as water [38], food [39] and the
environment [40,41].
According to this, the aim of the present work is to study the suitability of EIS-based techniques to
identify and quantify fermentable sugars present in the enzymatic saccharification process of pineapple
wastes for bioethanol production by an optimized prediction system.
2. Experimental Section
2.1. Raw Material and Sample Preparation
Pineapple fruits selection (MD-2 cultivar, Extra Sweet or Golden Sweet) was based on external factors
such as the absence of injuries, ripeness and weight. In order to prepare the samples, pineapples were
first washed in a sodium hypochlorite solution (0.1%) for 5 min. Next, the crown was removed, and the
pulp was separated from the rest of the fruit by using a pineapple cutter. Peel and core (waste) were cut
into smaller pieces and grinded in a blender (Solac Inox Professional 1000 W Mixer). The resulting
product was then frozen and kept at −22 °C until the experiments were conducted.
2.2. Electrochemical Impedance Spectroscopy Equipment
EIS measurements were carried out using a system developed by the Group of Electronic Development
and Printed Sensors (GED + PS) belonging to the Centro de Reconocimiento Molecular y Desarrollo
Tecnológico (IDM) at the Universitat Politècnica de València (UPV). This system consists of a device
called AVISPA (Advanced Voltammetry, Impedance Spectroscopy & Potentiometry Analyzer) (Figure 1)
associated with a specific software application that is able to apply different sinusoidal voltage signals
with amplitudes up to 1 Vpp and frequency sweep from 0.01 Hz to 10 MHz using up to 32 current scales.
The hardware consists of an Altera Cyclone II EP2C5T144C8N Field Programmable Gate Array
(FPGA), clocked at 100 MHz, a 12-bit THS5661A Digital-to-Analog Converter (DAC), two identical
ADS6125 12-bit Analog-to-Digital Converters (ADC), and various analog blocks to adapt signals to the
required levels. It also contains hardware to be able to select 32 current scales, by means of various shunt
resistors, to increase the sensitivity of the current measurement.
The user can configure, by means of the software, the start and end frequency, the number of
frequencies of the sweep and the amplitude of the sine wave to be generated. The user also has the option
to fix the currents scale, or let the software choose the appropriate current scale at each measurement
dynamically: if the values are below 20% or above 80% of the full range of the ADC, the software selects
a higher or lower shunt resistor, respectively.
Once the measurement is started, the software calculates the digital values to be sent to the DAC,
using a previously generated calibration file, and sends the data to a memory block inside the FPGA.
Once the FPGA receives the last byte, it starts to generate the signal and acquire the data of the two ADCs
Sensors 2015, 15 22944
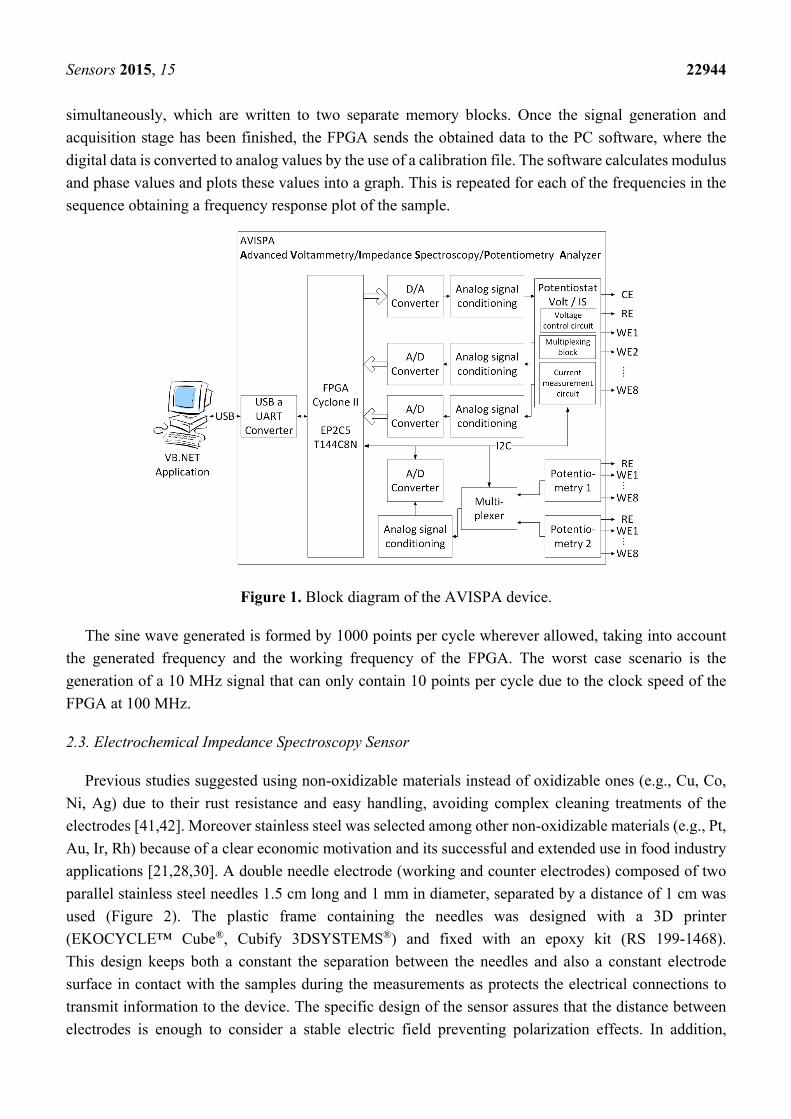
simultaneously, which are written to two separate memory blocks. Once the signal generation and
acquisition stage has been finished, the FPGA sends the obtained data to the PC software, where the
digital data is converted to analog values by the use of a calibration file. The software calculates modulus
and phase values and plots these values into a graph. This is repeated for each of the frequencies in the
sequence obtaining a frequency response plot of the sample.
Figure 1. Block diagram of the AVISPA device.
The sine wave generated is formed by 1000 points per cycle wherever allowed, taking into account
the generated frequency and the working frequency of the FPGA. The worst case scenario is the
generation of a 10 MHz signal that can only contain 10 points per cycle due to the clock speed of the
FPGA at 100 MHz.
2.3. Electrochemical Impedance Spectroscopy Sensor
Previous studies suggested using non-oxidizable materials instead of oxidizable ones (e.g., Cu, Co,
Ni, Ag) due to their rust resistance and easy handling, avoiding complex cleaning treatments of the
electrodes [41,42]. Moreover stainless steel was selected among other non-oxidizable materials (e.g., Pt,
Au, Ir, Rh) because of a clear economic motivation and its successful and extended use in food industry
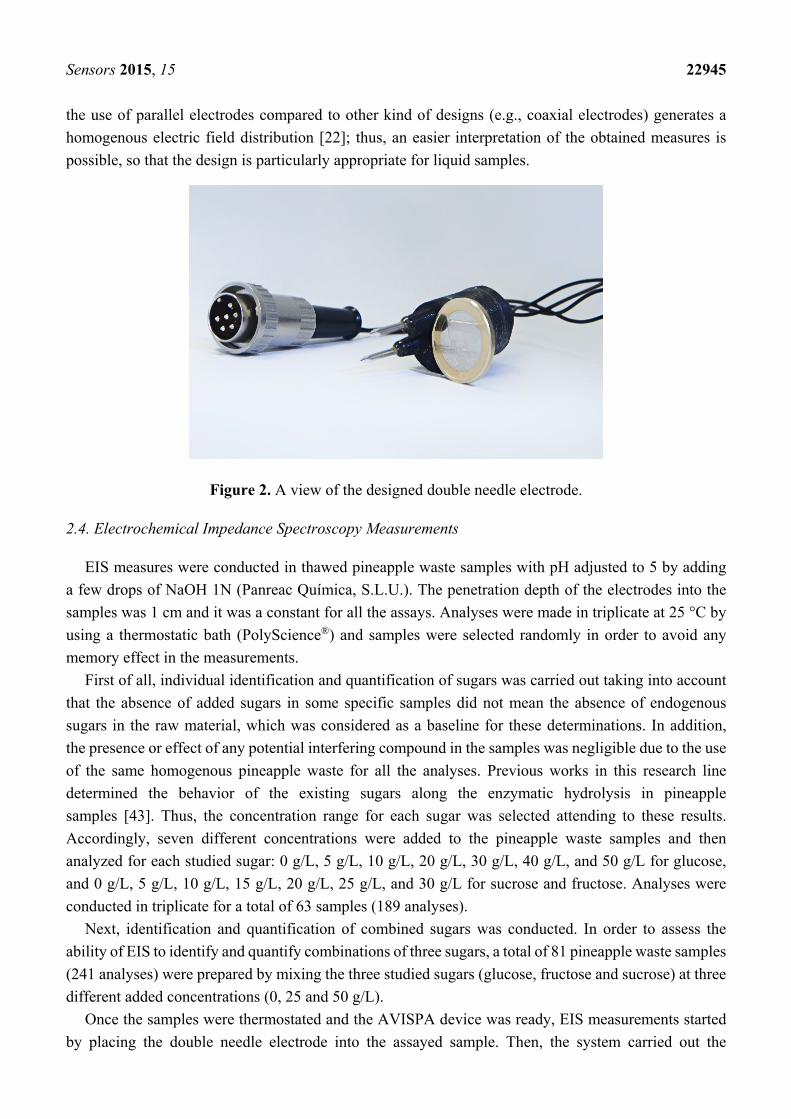
applications [21,28,30]. A double needle electrode (working and counter electrodes) composed of two
parallel stainless steel needles 1.5 cm long and 1 mm in diameter, separated by a distance of 1 cm was
used (Figure 2). The plastic frame containing the needles was designed with a 3D printer
(EKOCYCLE™ Cube®, Cubify 3DSYSTEMS®) and fixed with an epoxy kit (RS 199-1468).
This design keeps both a constant the separation between the needles and also a constant electrode
surface in contact with the samples during the measurements as protects the electrical connections to
transmit information to the device. The specific design of the sensor assures that the distance between
electrodes is enough to consider a stable electric field preventing polarization effects. In addition,
Sensors 2015, 15 22945
the use of parallel electrodes compared to other kind of designs (e.g., coaxial electrodes) generates a
homogenous electric field distribution [22]; thus, an easier interpretation of the obtained measures is
possible, so that the design is particularly appropriate for liquid samples.
Figure 2. A view of the designed double needle electrode.
2.4. Electrochemical Impedance Spectroscopy Measurements
EIS measures were conducted in thawed pineapple waste samples with pH adjusted to 5 by adding
a few drops of NaOH 1N (Panreac Química, S.L.U.). The penetration depth of the electrodes into the
samples was 1 cm and it was a constant for all the assays. Analyses were made in triplicate at 25 °C by
using a thermostatic bath (PolyScience®) and samples were selected randomly in order to avoid any
memory effect in the measurements.
First of all, individual identification and quantification of sugars was carried out taking into account
that the absence of added sugars in some specific samples did not mean the absence of endogenous
sugars in the raw material, which was considered as a baseline for these determinations. In addition,
the presence or effect of any potential interfering compound in the samples was negligible due to the use
of the same homogenous pineapple waste for all the analyses. Previous works in this research line
determined the behavior of the existing sugars along the enzymatic hydrolysis in pineapple
samples [43]. Thus, the concentration range for each sugar was selected attending to these results.
Accordingly, seven different concentrations were added to the pineapple waste samples and then
analyzed for each studied sugar: 0 g/L, 5 g/L, 10 g/L, 20 g/L, 30 g/L, 40 g/L, and 50 g/L for glucose,
and 0 g/L, 5 g/L, 10 g/L, 15 g/L, 20 g/L, 25 g/L, and 30 g/L for sucrose and fructose. Analyses were
conducted in triplicate for a total of 63 samples (189 analyses).
Next, identification and quantification of combined sugars was conducted. In order to assess the
ability of EIS to identify and quantify combinations of three sugars, a total of 81 pineapple waste samples
(241 analyses) were prepared by mixing the three studied sugars (glucose, fructose and sucrose) at three
different added concentrations (0, 25 and 50 g/L).
Once the samples were thermostated and the AVISPA device was ready, EIS measurements started
by placing the double needle electrode into the assayed sample. Then, the system carried out the
Sensors 2015, 15 22946
procedure described in Section 2.2 in order to instantly show the modulus and phase of the signal on the
PC screen and compile the data into the corresponding file for further analyses.
2.5. Statistical Analysis
PCAs were carried out with data obtained from the samples in order to assess the feasibility of the
EIS technique to discriminate among different sugar concentrations both individually and in combination.
PCAs were performed using just the specific impedance modulus and phase data obtained in the
frequency range in which the sensor showed the highest sensitivity. In addition, PLS analyses were also
carried out to create predictive models for each studied sugar from their respective EIS measurements.
According to the literature and previous studies in this research line, PLS prediction models were created
using two series of the experimental data (66% of the data for the calibration set). The model was then
validated with the remaining series of experimental data (34% for the validation set) [41,44]. The
accuracy was given by the root mean square error of prediction (RMSEP) and the coefficient of
determination (R2). All multivariate analyses were performed using SOLO© (Eigenvector Research, Inc.,
Manson, WA, USA).
A commercial ANN software (Alyuda Neurointelligence 2.2©, Alyuda Research Inc., Los Altos, CA,
USA) was used throughout this study in order to create alternative, flexible and more adaptive predictive
models to PLS [35,38,39]. Multi-layer feed forward neural networks and a single hidden layer ANN
structure were selected and on-line back propagation training algorithms were used for fitting the network.
The optimal network topology was selected by developing several artificial neural network structures
in order to determine the number of neurons of the hidden layer. Similarly, several trials suggested the
selection of logistic-type transfer functions for the output layer neurons and hyperbolic tangent-type
functions for the hidden nodes. Random data division was used by Alyuda Neurointelligence 2.2© in
order to select the samples for training (70%), validation (15%) and test (15%) data [38–40]. In addition,
overfitting was avoided by using proportional number of nodes in the network architecture [45], cross
validation and early-stopping in the training phase, so that the difference between training and validation
mean square errors was minimal. As described before, the accuracy of the model was given by the root
mean square error of prediction (RMSEP) and the coefficient of determination (R2) in the case of
numerical prediction models. On the other hand, when classification models were developed, the accuracy
of the model was given by the correct classification rate (CCR%) and the confusion matrix.
3. Results and Discussion
3.1. Individual Identification and Quantification of Sugars
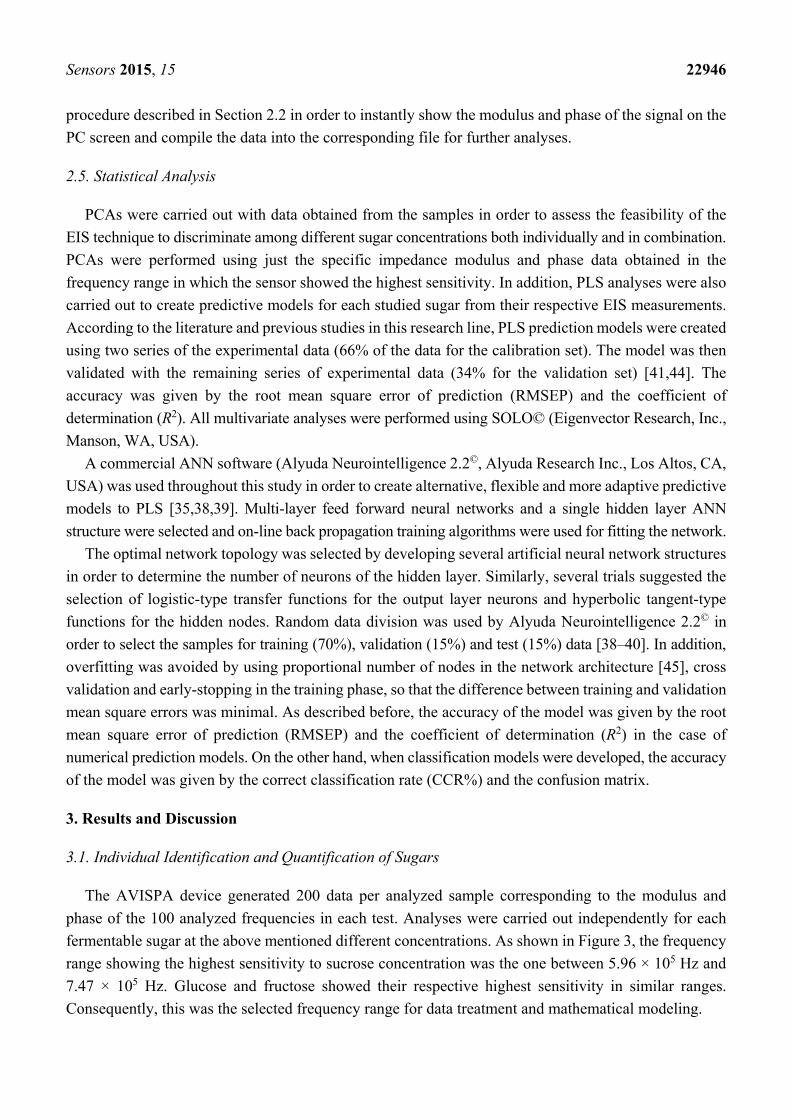
The AVISPA device generated 200 data per analyzed sample corresponding to the modulus and
phase of the 100 analyzed frequencies in each test. Analyses were carried out independently for each
fermentable sugar at the above mentioned different concentrations. As shown in Figure 3, the frequency
range showing the highest sensitivity to sucrose concentration was the one between 5.96 × 10⁵ Hz and
7.47 × 10⁵ Hz. Glucose and fructose showed their respective highest sensitivity in similar ranges.
Consequently, this was the selected frequency range for data treatment and mathematical modeling.
Sensors 2015, 15 22947
(a) (b)
Figure 3. Averaged phase values of the impedance spectra of different sucrose concentration
measurements for (a) the entire analyzed frequency range and (b) the selected range for data
treatment (5.96 × 10⁵ Hz–7.47 × 10⁵ Hz).
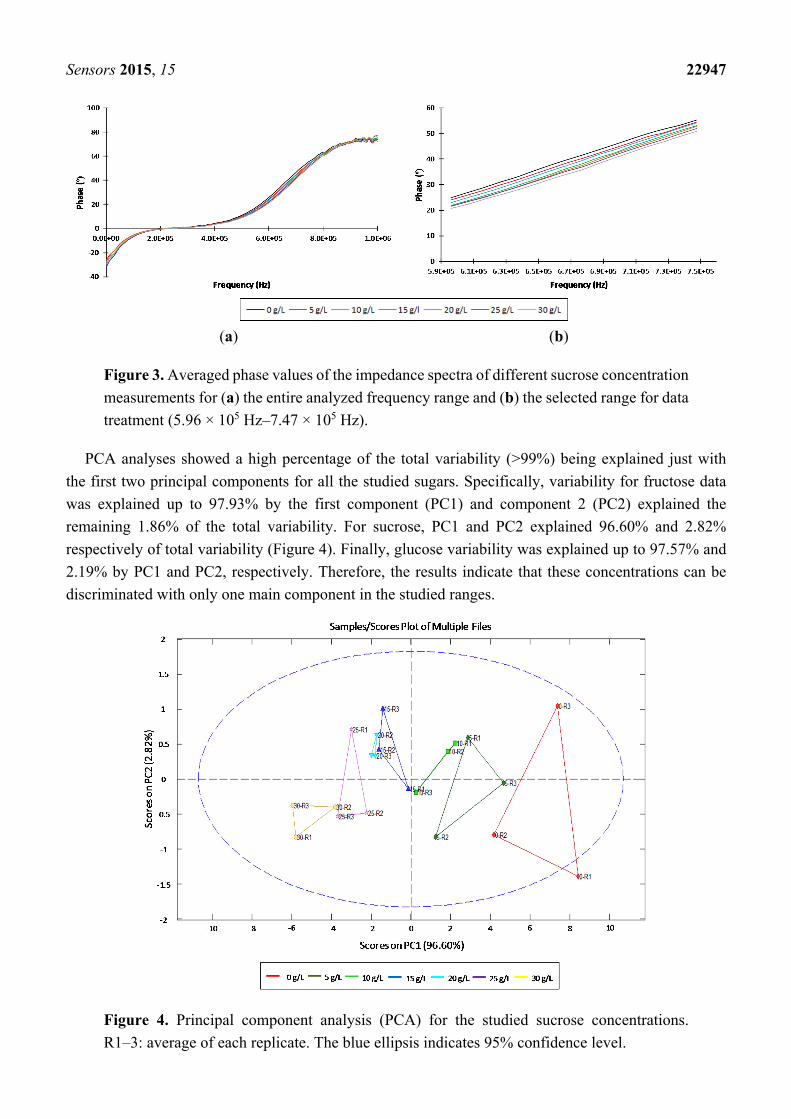
PCA analyses showed a high percentage of the total variability (>99%) being explained just with
the first two principal components for all the studied sugars. Specifically, variability for fructose data
was explained up to 97.93% by the first component (PC1) and component 2 (PC2) explained the
remaining 1.86% of the total variability. For sucrose, PC1 and PC2 explained 96.60% and 2.82%
respectively of total variability (Figure 4). Finally, glucose variability was explained up to 97.57% and
2.19% by PC1 and PC2, respectively. Therefore, the results indicate that these concentrations can be
discriminated with only one main component in the studied ranges.
Figure 4. Principal component analysis (PCA) for the studied sucrose concentrations.
R1–3: average of each replicate. The blue ellipsis indicates 95% confidence level.
Sensors 2015, 15 22948
Since PCA analysis showed that EIS analyses with the double needle sensor can discriminate
different concentrations of glucose, fructose and sucrose, a PLS analysis was performed to predict these
concentrations from EIS measures.
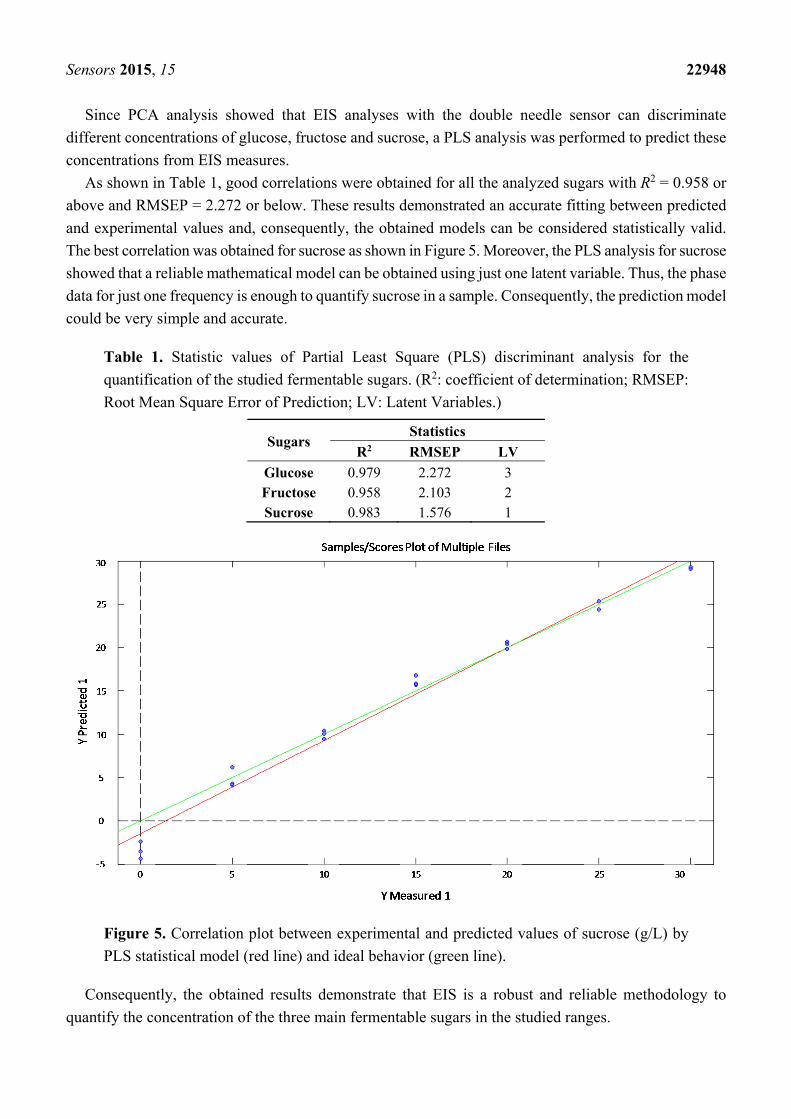
As shown in Table 1, good correlations were obtained for all the analyzed sugars with R2 = 0.958 or
above and RMSEP = 2.272 or below. These results demonstrated an accurate fitting between predicted
and experimental values and, consequently, the obtained models can be considered statistically valid.
The best correlation was obtained for sucrose as shown in Figure 5. Moreover, the PLS analysis for sucrose
showed that a reliable mathematical model can be obtained using just one latent variable. Thus, the phase
data for just one frequency is enough to quantify sucrose in a sample. Consequently, the prediction model
could be very simple and accurate.
Table 1. Statistic values of Partial Least Square (PLS) discriminant analysis for the
quantification of the studied fermentable sugars. (R2: coefficient of determination; RMSEP:
Root Mean Square Error of Prediction; LV: Latent Variables.)
Sugars Statistics
R2 RMSEP LV
Glucose 0.979 2.272 3 Fructose 0.958 2.103 2 Sucrose 0.983 1.576 1
Figure 5. Correlation plot between experimental and predicted values of sucrose (g/L) by
PLS statistical model (red line) and ideal behavior (green line).
Consequently, the obtained results demonstrate that EIS is a robust and reliable methodology to
quantify the concentration of the three main fermentable sugars in the studied ranges.
Sensors 2015, 15 22949
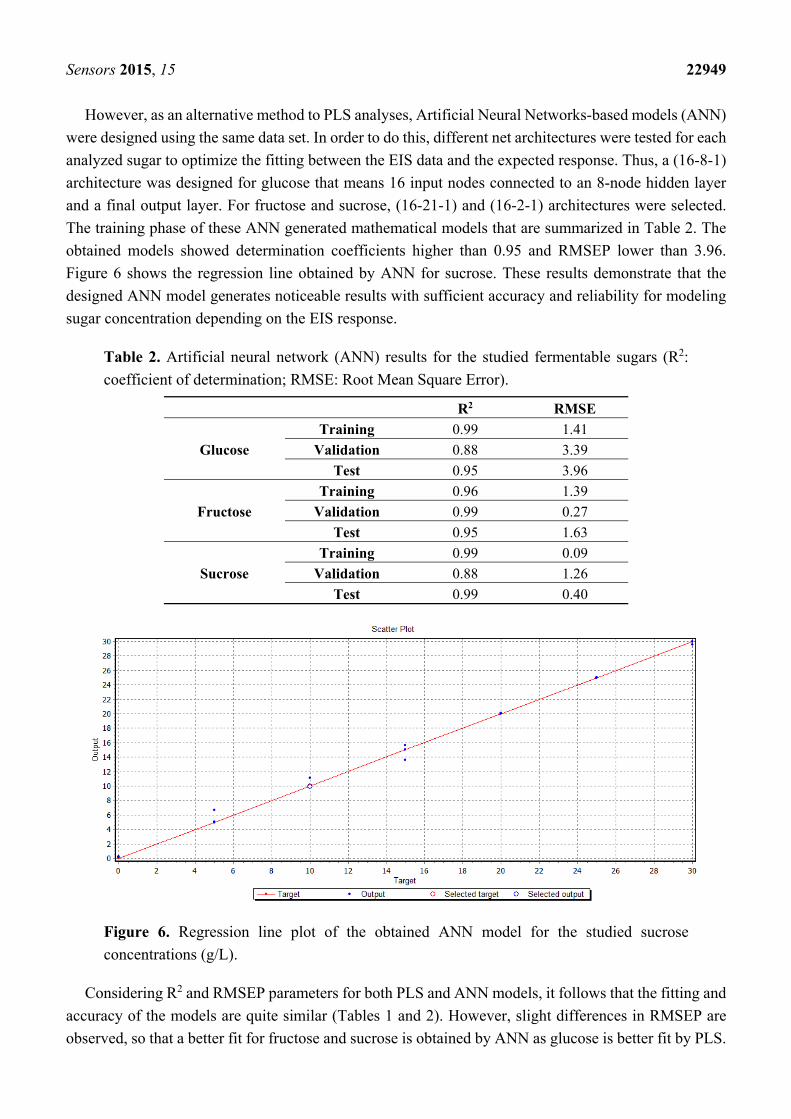
However, as an alternative method to PLS analyses, Artificial Neural Networks-based models (ANN)
were designed using the same data set. In order to do this, different net architectures were tested for each
analyzed sugar to optimize the fitting between the EIS data and the expected response. Thus, a (16-8-1)
architecture was designed for glucose that means 16 input nodes connected to an 8-node hidden layer
and a final output layer. For fructose and sucrose, (16-21-1) and (16-2-1) architectures were selected.
The training phase of these ANN generated mathematical models that are summarized in Table 2. The
obtained models showed determination coefficients higher than 0.95 and RMSEP lower than 3.96.
Figure 6 shows the regression line obtained by ANN for sucrose. These results demonstrate that the
designed ANN model generates noticeable results with sufficient accuracy and reliability for modeling
sugar concentration depending on the EIS response.
Table 2. Artificial neural network (ANN) results for the studied fermentable sugars (R2:
coefficient of determination; RMSE: Root Mean Square Error).
R2 RMSE
Glucose
Training 0.99 1.41
Validation 0.88 3.39
Test 0.95 3.96
Fructose
Training 0.96 1.39
Validation 0.99 0.27
Test 0.95 1.63
Sucrose
Training 0.99 0.09
Validation 0.88 1.26
Test 0.99 0.40
Figure 6. Regression line plot of the obtained ANN model for the studied sucrose
concentrations (g/L).
Considering R2 and RMSEP parameters for both PLS and ANN models, it follows that the fitting and
accuracy of the models are quite similar (Tables 1 and 2). However, slight differences in RMSEP are
observed, so that a better fit for fructose and sucrose is obtained by ANN as glucose is better fit by PLS.
Sensors 2015, 15 22950
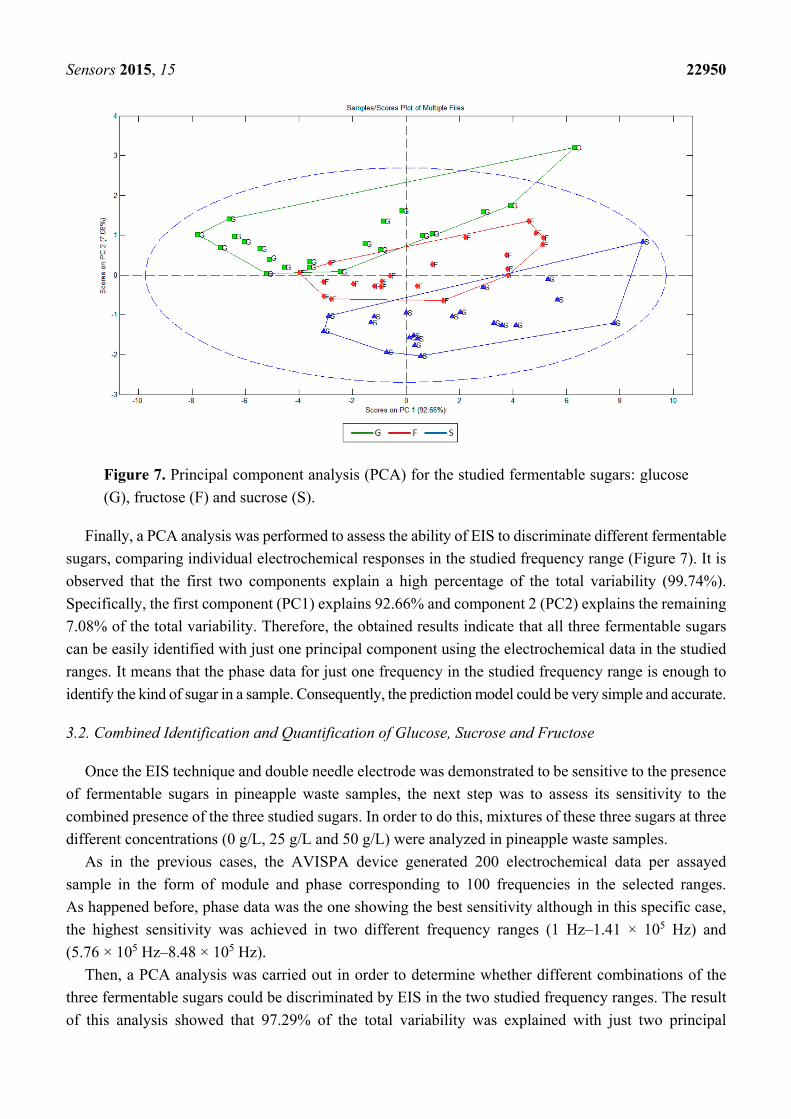
Figure 7. Principal component analysis (PCA) for the studied fermentable sugars: glucose
(G), fructose (F) and sucrose (S).
Finally, a PCA analysis was performed to assess the ability of EIS to discriminate different fermentable
sugars, comparing individual electrochemical responses in the studied frequency range (Figure 7). It is
observed that the first two components explain a high percentage of the total variability (99.74%).
Specifically, the first component (PC1) explains 92.66% and component 2 (PC2) explains the remaining
7.08% of the total variability. Therefore, the obtained results indicate that all three fermentable sugars
can be easily identified with just one principal component using the electrochemical data in the studied
ranges. It means that the phase data for just one frequency in the studied frequency range is enough to
identify the kind of sugar in a sample. Consequently, the prediction model could be very simple and accurate.
3.2. Combined Identification and Quantification of Glucose, Sucrose and Fructose
Once the EIS technique and double needle electrode was demonstrated to be sensitive to the presence
of fermentable sugars in pineapple waste samples, the next step was to assess its sensitivity to the
combined presence of the three studied sugars. In order to do this, mixtures of these three sugars at three
different concentrations (0 g/L, 25 g/L and 50 g/L) were analyzed in pineapple waste samples.
As in the previous cases, the AVISPA device generated 200 electrochemical data per assayed
sample in the form of module and phase corresponding to 100 frequencies in the selected ranges.
As happened before, phase data was the one showing the best sensitivity although in this specific case,
the highest sensitivity was achieved in two different frequency ranges (1 Hz–1.41 × 10⁵ Hz) and
(5.76 × 10⁵ Hz–8.48 × 10⁵ Hz).
Then, a PCA analysis was carried out in order to determine whether different combinations of the
three fermentable sugars could be discriminated by EIS in the two studied frequency ranges. The result
of this analysis showed that 97.29% of the total variability was explained with just two principal
Sensors 2015, 15 22951
components as PC1 and PC2 explained 77.78% and 19.51% of the variability. Therefore, these results
indicate that mixtures of the three studied sugars can be discriminated with just two principal components.
Next, PLS analyses were performed to generate a mathematical model able to predict concentrations
of combined fermentable sugars. In order to do this, different PLS were conducted to check the capability
of the system to detect and quantify each fermentable sugar from different mixtures of sugars in
pineapple waste samples. The obtained results (R2 > 0.841 RMSEP < 8.23) indicate that PLS modeling
for the combination of fermentable sugars is slightly lower than the ones shown in the previous cases.
However, these results are not far from those obtained in other scientific studies in similar fields [39,41].
Therefore, ANN models were studied as an alternative to improve accuracy of the ones obtained
by PLS. In this specific case, (11-38-9) was the selected ANN architecture to predict the combined
concentration of the three fermentable sugars in pineapple waste samples.
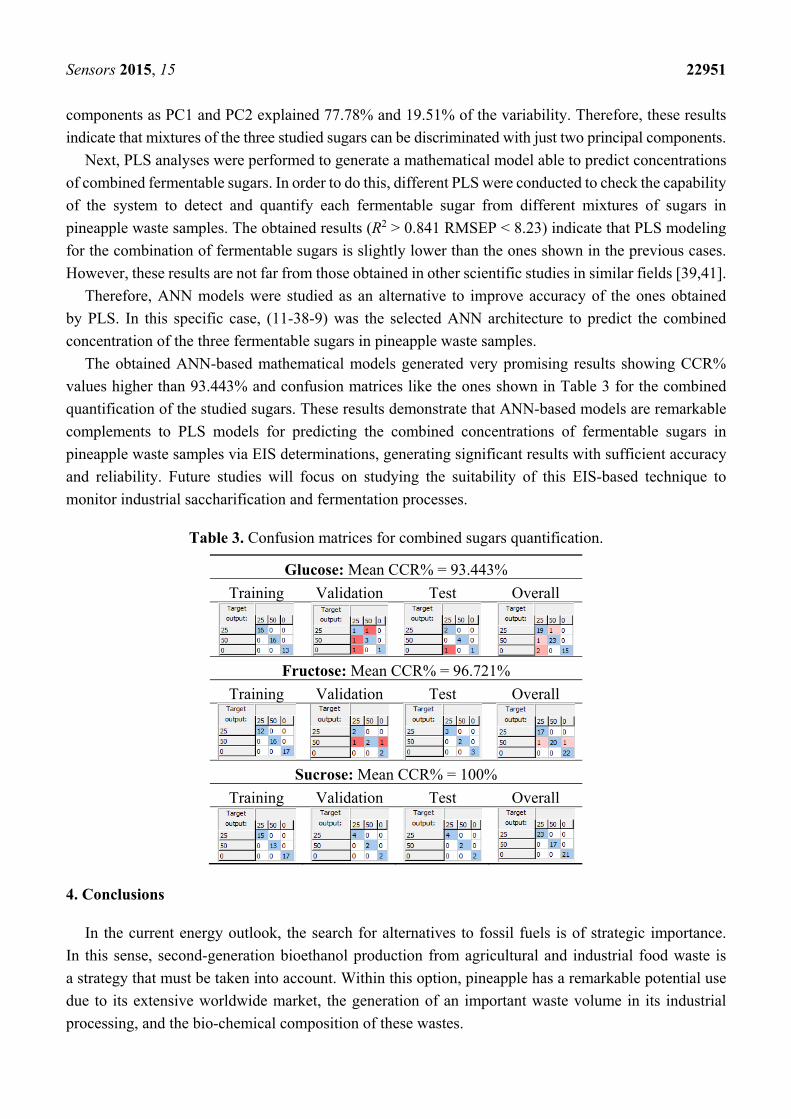
The obtained ANN-based mathematical models generated very promising results showing CCR%
values higher than 93.443% and confusion matrices like the ones shown in Table 3 for the combined
quantification of the studied sugars. These results demonstrate that ANN-based models are remarkable
complements to PLS models for predicting the combined concentrations of fermentable sugars in
pineapple waste samples via EIS determinations, generating significant results with sufficient accuracy
and reliability. Future studies will focus on studying the suitability of this EIS-based technique to
monitor industrial saccharification and fermentation processes.
Table 3. Confusion matrices for combined sugars quantification.
Glucose: Mean CCR% = 93.443%
Training Validation Test Overall
Fructose: Mean CCR% = 96.721%
Training Validation Test Overall
Sucrose: Mean CCR% = 100%
Training Validation Test Overall
4. Conclusions
In the current energy outlook, the search for alternatives to fossil fuels is of strategic importance.
In this sense, second-generation bioethanol production from agricultural and industrial food waste is
a strategy that must be taken into account. Within this option, pineapple has a remarkable potential use
due to its extensive worldwide market, the generation of an important waste volume in its industrial
processing, and the bio-chemical composition of these wastes.
Sensors 2015, 15 22952
This work introduces an EIS-based methodology for monitoring and managing the concentration of
sugars in the most complex phase for second generation bioethanol production: the enzymatic
hydrolysis. In order to do this, an AVISPA device has been used as it is able to generate and receive EIS
signals from an especially designed double needle sensor made of stainless steel. Statistical treatment of
the data allowed to build reliable and robust ANN-based mathematical models (mean CCR% > 93.443%)
to identify and quantify the main fermentable sugars (glucose, fructose and sucrose) in pineapple waste
samples both individually and jointly. Furthermore, this methodology is easy, rapid, non-destructive,
and in-situ. Thus, it can be considered as a promising alternative to the traditional laboratory techniques
for enzymatic hydrolysis monitoring and management in second-generation bioethanol production not
just from pineapple wastes but also from many other lignocellulosic sources.
Acknowledgments
Financial support from the Spanish Government and European FEDER funds
(MAT2012-38429-C04-04) and FPI-UPV Program are gratefully acknowledged.
Author Contributions
C.C. and L.S. carried out the electrochemical measurements, E.L. developed the electronic device
and the sensor, E.G.-B. participated in the data analysis and interpretation, and P.F. participated in the
coordination of the study. N.L.-M. conceived and also coordinated the study. Finally, C.C. and N.L.-M.
wrote the manuscript. All authors read and approved the final manuscript.
Conflicts of Interest
The authors declare no conflict of interest.
References
1. FAOSTAT—Food and Agriculture Organization of the United Nations. Statistics Division.
Available online: http://faostat.fao.org (accessed on 1 March 2015).
2. Reinhardt, A.; Rodriguez, L.V. Industrial processing of pineapple—Trends and perspectives.
Acta Hortic. 2009, 822, 323–328.
3. Ketnawa, S.; Chaiwut, P.; Rawdkuen, S. Pineapple wastes: A potential source for bromelain
extraction. Food Bioprod. Process. 2012, 90, 385–391.
4. Nigam, J.N. Continuous ethanol production from pineapple cannery waste. J. Biotechnol. 1999, 72,
197–202.
5. Tanaka, K.; Hilary, Z.D.; Ishizaki, A. Investigation of the utility of pineapple juice and
pineapple waste material as low-cost substrate for ethanol fermentation by Zymomonas mobilis.
J. Biosci. Bioeng. 1999, 87, 642–646.
6. Ruangviriyachai, C.; Niwaswong, C.; Kosaikanon, N.; Chanthai, S.; Chaimart, P. Pineapple Peel Waste
for Bioethanol Production. J. Biotechnol. 2010, 150, 10.
7. Scheller, H.V.; Ulvskov, P. Hemicelluloses. Annu. Rev. Plant Biol. 2010, 61, 263–289.
Sensors 2015, 15 22953
8. Yang, B.; Dai, Z.; Ding, S.Y.; Wyman, C.E. Enzymatic Hydrolysis of Cellulosic Biomass. Biofuels
2011, 2, 421–450.
9. Sánchez-Mata, M.C.; Cámara-Hurtado, M.; Díez-Maqués, C. Identification and quantification of
soluble sugars in green beans by HPLC. Eur. Food Res. Technol. 2002, 214, 254–258.
10. Karkacier, M.; Erbas, M.; Uslu, M.K.; Asku, M. Comparison of Different Extraction and Detection
Methods for Sugars Using Amino-Bonded Phase HPLC. J. Chromatogr. Sci. 2003, 4, 1331–333.
11. Bard, A.J.; Faulkner, L.R. Electrochemical Methods: Fundamentals and Applications, 2nd ed.;
John Wiley & Sons Inc.: New York, NY, USA, 2001; p. 833.
12. Barsoukov, E.; Macdonald, J.R. Impedance Spectroscopy: Theory, Experiment and Applications,
2nd ed.; John Wiley & Sons Inc.: Hoboken, NJ, USA, 2005; p. 595.
13. McRae, D.A.; Esrick, M.A. The dielectric parameters of excised EMT-6 tumors and their change
during hyperthermia. Phys. Med. Biol. 1992, 37, 2045–2058.
14. Piccoli, A.; Pillon, L.; Dumler, F. Impedance vector distribution by sex, race, body mass index, and
age in the United States: Standard reference intervals as bivariate Z scores. Nutrition 2002, 18,
153–167.
15. Nescolarde, L.; Piccoli, A.; Román, A.; Núñez, A.; Morales, R.; Tamayo, J.; Doñate, T.; Rosell, J.
Bioelectrical impedance vector analysis in hemodialysis patients. Relation between oedema and
mortality. Physiol. Meas. 2004, 25, 1271–1280.
16. Pan, L.K.; Huang, H.T.; Sun, C.Q. Dielectric relaxation and transition of porous silicon. J. Appl. Phys.
2003, 94, 2695–2700.
17. Prabakar, K.; Mallikarjun, S.P. Complex impedance spectroscopy studies on fatigued soft and hard
PZT ceramics. J. Alloy. Compd. 2007, 437, 302–310.
18. Cen, J.; Vukas, M.; Barton, G.; Kavanagh, J.; Coster, H.G.L. Real time fouling monitoring with
Electrical Impedance Spectroscopy. J. Membr. Sci. 2015, 484, 133–139.
19. Houssin, T.; Follet, J.; Follet, A.; Dei-Cas, E.; Senez, V. Label-free analysis of water-polluting
parasite by electrochemical impedance spectroscopy. Biosens. Bioelectron. 2010, 25, 1122–1129.
20. Rosborg, B.; Pan, J. An electrochemical impedance spectroscopy study of copper in a
bentonite/saline groundwater environment. Electrochimica Acta 2008, 53, 7556–7564.
21. García-Breijo, E.; Barat, J.M.; Torres, O.L.; Grau, R.; Gil, L.; Ibáñez, J.; Alcañiz, M.; Masot, R.;
Fraile, R. Development of a puncture electronic device for electrical conductivity measurements
throughout meat salting. Sens. Actuators A Phys. 2008, 148, 63–67.
22. Masot, R.; Alcañiz, M.; Fuentes, A.; Schmidt, F.C.; Barat, J.M.; Gil, L.; Baigts, D.; Martínez-Máñez, R.;
Soto, J. Design of a low-cost non-destructive system for punctual measurements of salt levels in
food products using impedance spectroscopy. Sens. Actuators A Phys. 2010, 158, 217–223.
23. Karásková, P.; Fuentes, A.; Fernández-Segovia, I.; Alcañiz, M.; Masot, R.; Barat, J.M.
Development of a low-cost non-destructive system for measuring moisture and salt content in
smoked fish products. Procedia Food Sci. 2011, 1, 1195–1201.
24. Alcañiz, M.; Vivancos, J.L.; Masot, R.; Ibañez, J.; Raga, M.; Soto, J.; Martínez Máñez, R. Design
of an electronic system and its application to electronic tongues using variable amplitude pulse
voltammetry and impedance spectroscopy. J. Food Eng. 2012, 111, 122–128.

Sensors 2015, 15 22954
25. Fernández-Segovia, I.; Fuentes, A.; Aliño, M.; Masot, R.; Alcañiz, M.; Barat, J.M. Detection of
frozen-thawed salmon (Salmo salar) by a rapid low-cost method. J. Food Eng. 2012, 113,
210–216.
26. Fuentes, A.; Masot, R.; Fernández-Segovia, I.; Ruiz-Rico, M.; Alcañiz, M.; Barat, J.M.
Differentiation between fresh and frozen-thawed sea bream (Spaurus aurata) using impedance
spectroscopy techniques. Innov. Food Sci. Emerg. 2013, 19, 210–217.
27. Pérez-Esteve, E.; Fuentes, A.; Grau, R.; Fernández-Segovia, I.; Masot, R.; Alcañiz, M.;
Barat, J.M. Use of impedance spectroscopy for predicting freshness of sea bream (Sparus aurata).
Food Control 2014, 35, 360–365.
28. Labrador, R.H.; Masot, R.; Alcañiz, M.; Baigts, D.; Soto, J.; Martinez-Mañez, R.; García-Breijo, E.;
Gil, L.; Barat, J.R. Prediction of NaCl, nitrate and nitrite contents in minced meat by using a
voltammetric electronic tongue and an impedimetric sensor. Food Chem. 2010, 122, 865–870.
29. De Jesús, C.; Hernández-Coronado, G.; Girón, J.; Barat, J.M.; Pagan, M.J.; Alcañiz, M.; Masot, R.;
Grau, R. Classification of unaltered and altered dry-cured ham by impedance spectroscopy:
A preliminary study. Meat Sci. 2014, 98, 695–700.
30. Rizo, A.; Fuentes, A.; Fernández-Segovia, I.; Masot, R.; Alcañiz, M.; Barat, J.M. Development of
a new salmon salting-smoking method and process monitoring by impedance spectroscopy.
LWT-Food Sci. Technol. 2013, 51, 218–224.
31. Wu, L.; Ogawa, Y.; Tagawa, A. Electrical impedance spectroscopy analysis of eggplant pulp and
effects of drying and freezing–thawing treatments on its impedance characteristics. J. Food Eng.
2008, 87, 274–280.
32. Bishop, C.M. Neural Networks for Pattern Recognition; Oxford University Press: New York, NY,
USA, 1995; p. 504.
33. Grossberg, S. Adaptive pattern classification and universal recoding. II. Feedback, expectation,
olfaction, illusions. Biol. Cybern. 1973, 23, 187–202.
34. Llobet, E.; Hines, E.L.; Gardner, J.W.; Bartlett, P.N.; Mottram, T.T. Fuzzy ARTMAP based
electronic nose data analysis. Sens. Actuators B Chem. 1999, 61, 183–190.
35. Brezmes, J.; Cabre, P.; Rojo, S.; Llobet, E.; Xilanova, X.; Correig, X. Discrimination between
different samples of olive oil using variable selection techniques and modified fuzzy artmap neural
networks. IEEE Sens. J. 2005, 5, 463–470.
36. Moreno-Barón, L.; Cartas, R.; Merkoçi, A.; Alegret, S.; del Valle, M.; Leija, L.; Hernandez, P.R.;
Muñoz, R. Application of the wavelet transform coupled with artificial neural networks for
quantification purposes in a voltammetric electronic tongue. Sens. Actuators B Chem. 2006, 113,
487–499.
37. Gil, L.; Barat, J.M.; Baigts, D.; Martínez-Máñez, R.; Soto, J.; Garcia-Breijo, E.; Aristoy, M.C.;
Toldrá F.; Llobet, E. Monitoring of physical-chemical and microbiological changes in fresh pork
meat under cold storage by means of a potentiometric electronic tongue. Food Chem. 2011, 126,
1261–1268.
38. Ibáñez Civera, J.; Garcia Breijo, E.; Laguarda Miró, N.; Gil Sánchez, L.; Garrigues Baixauli, J.;
Romero Gil, I.; Masot Peris, R.; Alcañiz Fillol, M. Artificial neural network onto eight bit
microcontroller for Secchi depth calculation. Sensor Actuat B Chem. 2011, 156, 132–139.
Sensors 2015, 15 22955
39. García-Breijo, E.; Garrigues, J.; Gil, L.; Laguarda-Miró, N. An Embedded Simplified Fuzzy
ARTMAP Implemented on a Microcontroller for Food Classification. Sensors 2013, 13,
10418–10429.
40. Laguarda-Miró, N.; Werner Ferreira, F.; García-Breijo, E.; Ibañez-Civera, J.; Gil-Sánchez, L.;
Garrigues-Baixauli, J. Glyphosate detection by voltammetric techniques. A comparison between
statistical methods and an artificial neural network. Sens. Actuators B Chem. 2012, 171–172,
528–536.
41. Martínez Gil, P.; Laguarda-Miró, N.; Soto Camino, J.; Masot Peris, R. Glyphosate detection with
ammonium nitrate and humic acids as potential interfering substances by pulsed voltammetry
technique. Talanta 2013, 115, 702–705.
42. Sierra, E.V.; Méndez, M.A.; Sarria, V.M.; Cortés, M.T. Electrooxidation of glyphosate on nickel
and copper electrodes. Quim. Nova 2008, 31, 220–226.
43. Conesa, C.; Bernat-Senent, I.; Seguí, L.; Fito, P. Pretratamiento con microondas para la obtención
de bioetanol a partir de los residuos industriales de piña: Una propuesta de mejora de la hidrólisis
enzimática. In Libro de Resúmenes, Proceedings of IX Congreso Iberoamericano de Ingeniería de
Alimentos, Valencia, Spain, 13–16 January 2014. (In Spanish)
44. Hastie, T.; Tibshirani, R.T.; Friedman. J. The Elements of Statistical Learning, 2nd ed.; Springer:
Stanford, CA, USA, 2009; p. 764.
45. Del Brío, B.M.; Molina, A.S. Redes Neuronales y Sistemas Borrosos, 2nd ed.; Ra-Ma: Madrid,
Spain, 2001; p. 399. (In Spanish)
© 2015 by the authors; licensee MDPI, Basel, Switzerland. This article is an open access article
distributed under the terms and conditions of the Creative Commons Attribution license
(http://creativecommons.org/licenses/by/4.0/).