Embed Size (px)
Citation preview

An Automated Method for Delineating aReference Region Using Masked VolumewisePrincipal-Component Analysis in 11C-PIB PET
Pasha Razifar1,2, Henry Engler3, Anna Ringheim4, Sergio Estrada4, Anders Wall4, and Bengt Langstrom4,5
1Michigan and CT Research, GE Healthcare, Waukesha, Wisconsin, 2Uppsala Applied Science Lab, GE Healthcare, Uppsala, Sweden,3Department of Medical Science, Uppsala University, Uppsala, Sweden, 4Uppsala Imanet, GE Healthcare, Uppsala, Sweden,5Department of Biochemistry and Organic Chemistry, Uppsala University, Uppsala, Sweden
Kinetic modeling using a reference region is a common methodfor the analysis of dynamic PET studies. Available methods foroutlining regions of interest representing reference regions areusually time-consuming and difficult and tend to be subjective;therefore, MRI is used to help physicians and experts to defineregions of interest with higher precision. The current work intro-duces a fast and automated method to delineate the referenceregion of images obtained from an N-methyl-11C-2-(49-methyla-minophenyl)-6-hydroxy-benzothiazole (11C-PIB) PET study onAlzheimer disease patients and healthy controls using a newly in-troduced masked volumewise principal-component analysis.Methods: The analysis was performed on PET studies from 22Alzheimer disease patients (baseline, follow-up, and test/reteststudies) and 4 healthy controls, that is, a total of 26 individualscans. The second principal-component images, which illustratethe kinetic behavior of the tracer in gray matter of the cerebellarcortex, were used as input data for automatic delineation of thereference region. To study the variation associated with the man-ual and proposed automatic methods, we defined the referenceregion repeatedly. Results: As expected, the automatic methodshowed no variation whereas the manual method varied signifi-cantly on repetition. Furthermore, the automatic method wassignificantly faster, more robust, and less biased. Conclusion:The automatic method is helpful in the delineation of the refer-ence region of 11C-PIB PET studies of the human brain and ismuch faster and more precise than manual delineation.
Key Words: positron emission tomography; masked volume-wise principal-component analysis; automatic delineation; refer-ence region; Alzheimer disease
J Nucl Med Technol 2009; 37:38–44DOI: 10.2967/jnmt.108.054296
PET is an excellent tool for providing informationabout tissue that differs between healthy controls (HCs) andpatients with Alzheimer disease (AD). This imaging technique
is increasingly being used for early diagnosis of severalneurologic disorders such as AD. Our group and others haveused PET with the amyloid imaging agent N-methyl-11C-2-(49-methylaminophenyl)-6-hydroxy-benzothiazole (11C-PIB)for in vivo studies of amyloid deposition in the brains of ADpatients (1–6). These studies have shown that 11C-PIB mayimprove our knowledge and understanding of the diseaseand may be used to evaluate potential therapeutic drugs.
Besides being used for analyses of activity distributionand standardized uptake values, dynamic PET data canbe further processed and modeled using different kineticmodeling techniques to extract quantitative values of adesired physiologic, biochemical, or pharmacologic entity(7–10). Kinetic models need either the determination of thetime course of a plasma input function or the definition of areference region void of specific binding.
The regions of interest (ROIs) of the target and referencetissues are usually outlined manually on early and latesummation images, depending on the tracer used. Whenavailable, MRI scans are used for partial-volume correctionand for the definition of ROIs (11). However, knowledge ofthe kinetic behavior of the administered tracer is necessaryto sum the images of relevant frames in the sequence of thestudy in which the particular signal is proportionally larger.Experience has shown that the summation tends to reduceboth the contrast between different parts of the brain andthe differences between regions with different kineticbehaviors. Therefore, the manual outlining of ROIs is bothtime-consuming and prone to errors, depending on whodraws them.
Moreover, images generated in such PET studies areinherently noisy because of limitations in the amount of theadministered tracer and technical considerations such ascounting-rate limitations, scanning time, applied corrections,and the chosen reconstruction algorithm. A high magnitudeof noise, correlation between the elements of the images inconjunction with the high level of nonspecific binding to thetarget, and a sometimes small difference in target expressionbetween pathologic and healthy regions are factors that makethe analysis of PET data difficult (12,13).
Received May 14, 2008; revision accepted Jan. 7, 2009.For correspondence or reprints contact: Pasha Razifar, Uppsala Applied
Science Lab (UASL), GE Healthcare, GEMS PET Systems AB, Husbyborg,SE-752 28 Uppsala, Sweden.
E-mail: [email protected] ª 2009 by the Society of Nuclear Medicine, Inc.
38 JOURNAL OF NUCLEAR MEDICINE TECHNOLOGY • Vol. 37 • No. 1 • March 2009
by on April 3, 2019. For personal use only. tech.snmjournals.org Downloaded from

Previously, we showed that application of principal-component analysis to dynamic PET images, such as theuse of masked volumewise principal-component analysis(MVW-PCA) in 11C-PIB PET studies, generates imageswith improved signal-to-noise ratio and improved diagnos-tic values (14,15). Compared with images generated usingmethods such as summation or modeling, MVW-PCAimages contain more detailed anatomic information, withhigher quality, precision, contrast, and visualization. Wehave shown that MVW-PCA can be used as a multivariateanalysis technique that, without modeling assumptions, canseparate the data into images reflecting different compo-nents that may correlate with some kinetic information,such as blood flow or tracer accumulation.
The aim of this study was to use MVW-PCA to introducea new, fast, and automated method for defining andoutlining the reference region in brain 11C-PIB PET studiesof AD patients and HCs.
MATERIALS AND METHODS
ParticipantsData from 22 AD scans (2 · 11) and 4 HC scans (total of 26
scans) were used in this study. The scans were recruited fromvarious studies performed at Uppsala Imanet in collaboration withseveral research groups. Scans from 7 AD patients and 4 HCswere selected randomly from a study performed in collaborationwith Karolinska University Hospital Huddinge and University ofPittsburgh School of Medicine (4). Follow-up scans from these7 patients were also used (6). Furthermore, we included the test/retest scans of 4 AD patients studied by Uppsala Imanet andKarolinska University Hospital Huddinge (6).
RadiotracerThe radiotracer 11C-PIB was produced according to the stan-
dard good manufacturing process at Uppsala Imanet. The synthe-sis was done according to Mathis et al. (3).
Manual Delineation of Reference RegionConventional Method. The method used to define the ROI re-
presenting the reference region was based on a visual comparisonof the early and late summations of the dynamic 11C-PIB PET data.
In the late-summation images, the threshold bar was drawndown until small hot spots (4–10 pixels) were visible in whitematter when a rainbow white color map was applied. The externalborder of the cerebellum was drawn using the early summation,with the late summation used for comparison (Fig. 1). The internalborder of the cerebellum was drawn by following the contour ofthe uptake of the white matter seen in the late summation (4). Boththe external and the internal borders of the cerebellum can beoutlined differently, depending on who draws the ROI. Therefore,it was necessary to improve this method to avoid subjectivedifferences in the way the ROI was drawn.
Optimized Manual Method. To standardize the outlining of thereference region, we used summation images representing the first6 min of the sequence. These images were similar to images basedon the unidirectional influx rate constant, K1, which were almostidentical to the blood flow images. These images containedsufficient anatomic information for positioning of the ROI (16).
The slice in which the cerebellum was most clearly seen at thelevel of the pons was chosen for each subject. The external borderof the cerebellum was determined semiautomatically using theisocontour function in which the maximum value of the pixelwithin the ROI could be modified manually (Fig. 2A). The definedROI was imported into the corresponding slice in the late sum-mation, at 40–60 min (Fig. 2B).
Subsequently, the threshold bar was drawn down until small hotspots (4–10 pixels) were seen in the white matter. Next, 40% ofthe activity measured in the hot spot was calculated, and valuesbelow this cutoff were excluded (Fig. 2C). This procedure wasapplied to visually eliminate the areas with uptake 40% lower thanthe highest uptake registered in the white matter. The idea of usinga 40% cutoff was based on empirically performed examinations ofmany patients (6) that showed this cutoff to improve the precisionof definition.
A new ROI was drawn representing the external border of thefirst ROI and the internal border against the white matter. Theimported ROI was removed from the image (Fig. 2D).
FIGURE 1. Manual definition of reference region. Sum imagesof AD patient are generated using early (A) and late (B)summation of dynamic 11C-PIB PET images, which are usedto delineate ROI representing reference region (C).
FIGURE 2. Optimized manual method for definition of refer-ence region. Sum images of AD patient in Figure 1 aregenerated using early (A) and late (B) summation of dynamic11C-PIB PET images. Next, 40% cutoff is performed (C), andnew ROI defining cerebellum is drawn manually (D).
AUTOMATED DELINEATION OF REFERENCE REGION • Razifar et al. 39
by on April 3, 2019. For personal use only. tech.snmjournals.org Downloaded from

Our experience showed that this procedure was a good ap-proach for excluding from the defined ROI as many pixels aspossible representing the cerebellar medulla.
Using this method, we required about 10–15 min to outline areference region. The time varied depending on who performedthe outlining procedure.
Automated Definition and Delineation of ReferenceRegion
MVW-PCA. MVW-PCA was introduced as a novel approachfor the application of principal-component analysis to dynamichuman PET images (14). This method uses a noise-prenormalizeddataset that represents the whole brain as a single variable in eachframe after the background has been removed (masked) and beforeprincipal-component analysis has been applied. These images
represent different kinetic behaviors of the administered tracer andcontain anatomic information that is more detailed and of higherquality than the information from images generated using sum-mation or modeling. Moreover, compared with parametric imagesand summed images, MVW-PCA images have an improvedsignal-to-noise ratio and improved visual contrast between ana-tomic structures representing the affected and unaffected tissues inthe human brain.
Figures 3 and 4 illustrate the results from applying MVW-PCAto images generated from a PET study on 1 AD patient and 1 HC,respectively, using 11C-PIB. The first 3 principal componentsillustrate 3 different kinetic behaviors of administered 11C-PIB inthe brain of the patient and the HC. MVW-PC1 corresponds tothe most predominant kinetic behavior of the tracer in differentregions, such as the frontal cortex in the AD patient and the
FIGURE 3. MVW-PCA application ondynamic 11C-PIB PET images of ADpatient. Images from components 1–3are shown in different views. MVW-PC1(A–C) corresponds to kinetics of tracer inregions affected by Ab-amyloid depositsas frontal cortex, anterior cingulate cor-tex, and temporal cortex. In MVW-PC2(D–F), delineated cortical areas are de-void of amyloid. Projection planes wereselected to illustrate cerebellum. InMVW-PC3 (G–I), kinetic behavior oftracer in blood was extracted and majorblood vessels are seen.
FIGURE 4. MVW-PCA application ondynamic 11C-PIB PET images of HC.Images from components 1–3 are shownin different views. MVW-PC1 (A–C) cor-responds to kinetics of tracer in regionswith 11C-PIB retention as thalamus. InMVW-PC2 (D–F), white matter is ex-tracted and delineated. In MVW-PC3(G–I), kinetic behavior of tracer in bloodwas extracted and major blood vesselsare seen.
40 JOURNAL OF NUCLEAR MEDICINE TECHNOLOGY • Vol. 37 • No. 1 • March 2009
by on April 3, 2019. For personal use only. tech.snmjournals.org Downloaded from

thalamus in the HC. MVW-PC2 images illustrate additional in-formation by extracting cortical areas in AD patients and whitematter in HCs. Finally, MVW-PC3 images illustrate the kineticbehavior of the administered tracer in blood vessels.
Automated Delineation of Reference Region. After MVW-PCAhad been applied to the whole dataset for each patient, MVW-PC2images were used as input data. These images contained infor-mation about regions in which the tracer kinetics were differentfrom those in regions visualized in MVW-PC1 images, such as thecerebellar cortex These images were used as input data for aprogram developed in-house for automatic definition of the cere-bellum using Matlab 7.0 (The MathWorks) with installed statisticaland image-processing toolboxes. Because MVW-PC2 images ofHCs illustrate white matter, inverted weighting factors should beused to generate MVW-PC2 images in which the gray matter ofcerebellum is illustrated before a dataset is used. Weighting factorsfor the generation of MVW-PC2 images are controlled automati-cally as well.
The algorithm consists of the following steps:
• Use MVW-PC2 images as input data to outline referenceregion (Fig. 5A).
• Create binary images of the MVW-PC2 images slicewiseusing the method of Otsu (17) (Fig. 5B).
• Select the object with an area totaling more than 250 pixels(empirically chosen) in each image (Fig. 5C).
• Fill the holes within the selected region in each slice bysetting the zero-labeled 4-connected-neighbor pixels to 1.
• Save the coordinates of the pixels representing the selectedarea for each slice.
• Import the pixels representing the selected region into theoriginal dynamic PET images and calculate the mean valuesof the pixels within the defined region.
• Plot the time–activity curves for the regions defined in eachslice using the dynamic PET images for further exploration.
• Define edge pixels by removing interior pixels. This optionsets a pixel to 0 if all its 4-connected neighbors are 1, thusleaving only the boundary pixels. Save the coordinates(Fig. 5D).
• Import edge pixels representing the outlined regions intoMVW-PC3 images for further exploration and control.
As a result, the cerebellum was automatically outlined in theMVW-PC2 image, and the ROI was imported into the correspond-ing MVW-PC3 image to ensure visually that the ROI covered no
FIGURE 5. Illustration of automatic definition of ROI repre-senting cerebellum, using MVW-PC2 image (A), binary image(B), selected area representing reference region (C), and edgepixels imported into MVW-PC3 image for further exploration (D).
FIGURE 6. Time–activity curves plotted using arbitrarily cho-sen reference region of AD patient (Fig. 5) generated byautomatic method (red line) and manual method (blue line).
FIGURE 7. Illustration of automatic definition of ROI repre-senting cerebellum using MVW-PC2 image (A and C); definedROI was imported into corresponding slice in MVW-PC3 image(B and D) for 2 arbitrarily chosen AD patients.
AUTOMATED DELINEATION OF REFERENCE REGION • Razifar et al. 41
by on April 3, 2019. For personal use only. tech.snmjournals.org Downloaded from
blood vessels. Different statistical measurements such as the meanand SD of the pixels within the ROI were calculated, and time–activity curves were plotted automatically when the procedure wasperformed.
Repetitive Definition of Reference RegionData for performing repetitive delineation of the reference
region were collected from a test/retest human brain 11C-PIB PETstudy included in a follow-up study by our group (6). Thecerebellum was outlined consecutively 3 times both manuallyand automatically for each patient. Mean, SD, and coefficient ofvariance were calculated for each attempt, and statistical compar-isons were performed. In this study, Graph Pad Prism, version 4.03(Graph Pad Software, Inc.), was used to perform all statisticalanalysis and graphic illustrations.
Computerized Reorientation and CoregistrationMVW-PC2 images were reoriented and coaligned on corre-
sponding MRI scans using a computerized reorientation programcalled the computerized brain atlas, which was developed byAndersson and Thurfjell (18), for comparison. This procedure wasperformed to investigate the precision of the proposed method.
RESULTS
The different steps are shown in Figure 5, which illus-trates the results from the automated procedure to delineatethe reference region, using MVW-PCA on an arbitrarilychosen AD patient. The time–activity curves obtained usingimages generated with the automated and manual methodsshow that almost identical results were obtained by the
2 methods (Fig. 6). Moreover, automatic definition anddelineation of the reference region worked well for bothHCs and AD patients (Figs. 7 and 8).
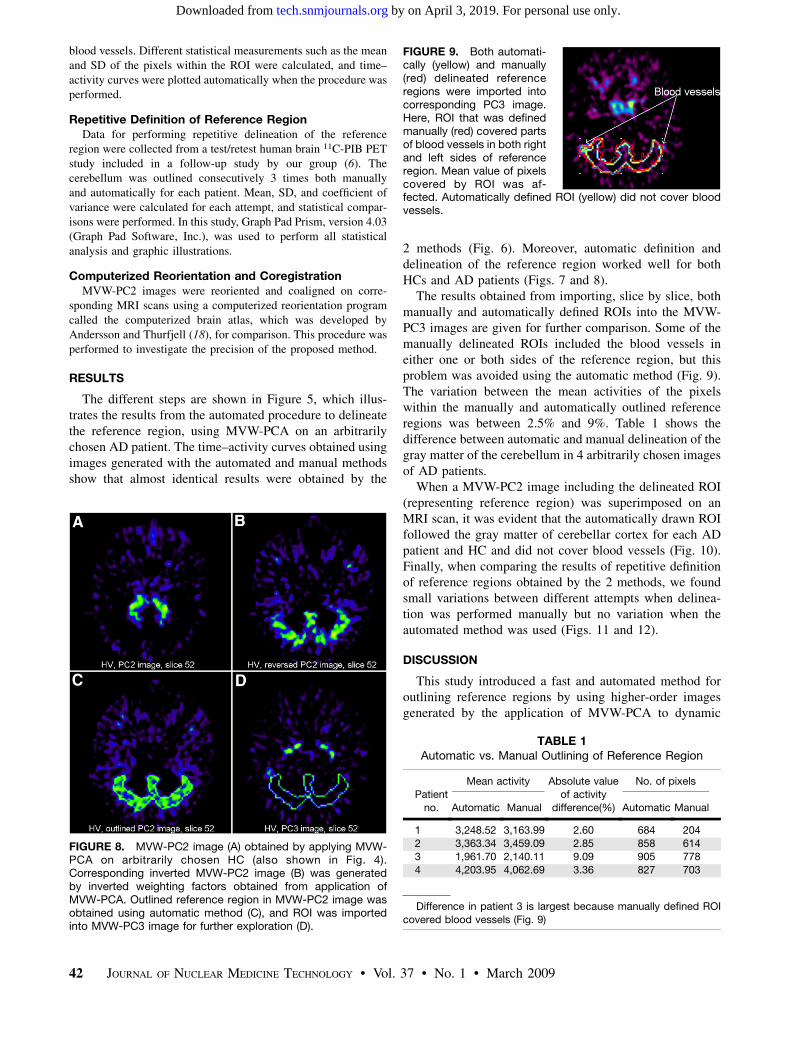
The results obtained from importing, slice by slice, bothmanually and automatically defined ROIs into the MVW-PC3 images are given for further comparison. Some of themanually delineated ROIs included the blood vessels ineither one or both sides of the reference region, but thisproblem was avoided using the automatic method (Fig. 9).The variation between the mean activities of the pixelswithin the manually and automatically outlined referenceregions was between 2.5% and 9%. Table 1 shows thedifference between automatic and manual delineation of thegray matter of the cerebellum in 4 arbitrarily chosen imagesof AD patients.
When a MVW-PC2 image including the delineated ROI(representing reference region) was superimposed on anMRI scan, it was evident that the automatically drawn ROIfollowed the gray matter of cerebellar cortex for each ADpatient and HC and did not cover blood vessels (Fig. 10).Finally, when comparing the results of repetitive definitionof reference regions obtained by the 2 methods, we foundsmall variations between different attempts when delinea-tion was performed manually but no variation when theautomated method was used (Figs. 11 and 12).
DISCUSSION
This study introduced a fast and automated method foroutlining reference regions by using higher-order imagesgenerated by the application of MVW-PCA to dynamic
FIGURE 8. MVW-PC2 image (A) obtained by applying MVW-PCA on arbitrarily chosen HC (also shown in Fig. 4).Corresponding inverted MVW-PC2 image (B) was generatedby inverted weighting factors obtained from application ofMVW-PCA. Outlined reference region in MVW-PC2 image wasobtained using automatic method (C), and ROI was importedinto MVW-PC3 image for further exploration (D).
FIGURE 9. Both automati-cally (yellow) and manually(red) delineated referenceregions were imported intocorresponding PC3 image.Here, ROI that was definedmanually (red) covered partsof blood vessels in both rightand left sides of referenceregion. Mean value of pixelscovered by ROI was af-fected. Automatically defined ROI (yellow) did not cover bloodvessels.
TABLE 1Automatic vs. Manual Outlining of Reference Region
Patient
no.
Mean activity Absolute valueof activity
difference(%)
No. of pixels
Automatic Manual Automatic Manual
1 3,248.52 3,163.99 2.60 684 204
2 3,363.34 3,459.09 2.85 858 6143 1,961.70 2,140.11 9.09 905 778
4 4,203.95 4,062.69 3.36 827 703
Difference in patient 3 is largest because manually defined ROI
covered blood vessels (Fig. 9)
42 JOURNAL OF NUCLEAR MEDICINE TECHNOLOGY • Vol. 37 • No. 1 • March 2009
by on April 3, 2019. For personal use only. tech.snmjournals.org Downloaded from

11C-PIB PET images of the human brain. As shown inFigures 3 and 4, application of MVW-PCA to dynamic 11C-PIB PET images of AD patients and HCs generates 3 dif-ferent datasets separated into 3 uncorrelated components.These separations are based on the different kinetic behav-iors of 11C-PIB in the brain tissues of AD patients and HCs.
MVW-PC2 images contain information about the kineticbehavior of 11C-PIB in the gray matter of the cerebellarcortex in AD patients and white matter in HCs. This infor-mation is used to create the proposed automated method,which can help the analyst, even an experienced one, todelineate the reference region of human 11C-PIB PET stud-ies. Information obtained from MVW-PC3 images, whichshow the kinetic behavior of the tracer in blood, is used toensure that outlined ROIs representing cerebellum do notinclude the blood vessels near the cerebellum.
Notably for HCs, MVW-PC2 images contained informa-tion about the kinetics of 11C-PIB in white matter instead ofgray matter; hence, new images that showed the gray matterof the cerebellum were generated using inverted MVW-PC2 weighting factors (Fig. 8).
Despite our good experience using the optimized manualapproach to delineate the cerebellum, our experiencedanalyst had some difficulty defining the contours of thecerebellum manually because summation tended to reducethe contrast between different parts of the brain and dampenthe differences between regions such as white and graymatter in AD patients and HCs. However, the automaticmethod appears to have solved these problems in this dataset.
In contrast to the automated method, some of the man-ually defined ROIs included the blood vessels in both theright and the left sides of the reference region (Fig. 9). Themean value of the pixels covered by each ROI is affected,as are the statistical measurements used to compare these 2
methods (Fig. 10). The manual outlining of ROIs is time-consuming and prone to errors, depending on who drawsthem. Manual delineation of the cerebellum for each ADpatient and HC took about 10–15 min, versus 17 s when theautomated method was used.
The results obtained using the proposed automatedmethod were outstanding and showed none of the variabil-ity observed with the manual method. Furthermore, ourautomated method was significantly faster, more robust,and less biased than the manual empiric method becausestudies analyzed with the manual approach were more likelyto include vessels in the regions being sampled and one wouldexpect more variability in the dataset. Only a few secondswere required to delineate each reference region excludedfrom blood vessels, to calculate and plot the time–activitycurve, and to generate images containing the outlined ROI,without relying on MRI scans.
Further evidence of the accuracy of this method wasprovided by fused images, which showed that the outlinedarea in MVW-PC2 images followed the gray matter of thecerebellar cortex for each AD patient and HC in this studyand that the defined region did not contain blood vessels.This finding shows the robustness and precision of theautomatic method.
CONCLUSION
The automatic method is helpful in the delineation of thereference region of 11C-PIB PET studies of the human brainand is much faster and more precise than manual delineation.
ACKNOWLEDGMENTS
We thank Dr. Lennart Thurfjell for helping with regis-tration of the PET and MRI scans.
FIGURE 10. MRI scan of AD patient (A),fused image using same MRI slicecorresponding MVW-PC2 image (B),and MRI scan with delineated ROI (rep-resenting reference region) superim-posed (C) are shown.
FIGURE 11. Diagramshowing mean activity con-centration, with statisticalvariation of pixel valueswithin ROIs positioned intest and retest PET studieson AD patient, when refer-ence region is repeatedlydefined us ing manua lmethod. Pat. 5 patient.
FIGURE 12 . Diag ramcomparing correlation varia-tion (coefficient of variance)of mean pixel values of ROIspositioned in test and retestPET studies on AD patient,when reference region isdefined manually and re-peatedly. Pat. 5 patient.
AUTOMATED DELINEATION OF REFERENCE REGION • Razifar et al. 43
by on April 3, 2019. For personal use only. tech.snmjournals.org Downloaded from

REFERENCES
1. Klunk WE, Debnath ML, Pettegrew JW. Development of small molecule probes
for the beta-amyloid protein of Alzheimer’s disease. Neurobiol Aging.
1994;15:691–698.
2. Klunk WE, Wang Y, Huang GF, Debnath ML, Holt DP, Mathis CA. Uncharged
thioflavin-T derivatives bind to amyloid-beta protein with high affinity and
readily enter the brain. Life Sci. 2001;69:1471–1484.
3. Mathis CA, Wang Y, Holt DP, Huang GF, Debnath ML, Klunk WE. Synthesis
and evaluation of 11C-labeled 6-substituted 2-arylbenzothiazoles as amyloid
imaging agents. J Med Chem. 2003;46:2740–2754.
4. Klunk WE, Engler H, Nordberg A, et al. Imaging brain amyloid in Alzheimer’s
disease with Pittsburgh Compound-B. Ann Neurol. 2004;55:306–319.
5. Price JC, Klunk WE, Lopresti BJ, Lu X, Hoge JA, Ziolko SK, et al. Kinetic
modeling of amyloid binding in humans using PET imaging and Pittsburgh
compound-B. J Cereb Blood Flow Metab. 2005;25:1528-1547.
6. Engler H, Forsberg A, Almkvist O, et al. Two-year follow-up of amyloid
deposition in patients with Alzheimer’s disease. Brain. 2006;129:2856–
2966.
7. Patlak CS, Blasberg RG, Fenstermacher JD. Graphical evaluation of blood-to-
brain transfer constants from multiple-time uptake data. J Cereb Blood Flow
Metab. 1983;3:1–7.
8. Gjedde A, Reith J, Dyve S, et al. Dopa decarboxylase activity of the living
human brain. Proc Natl Acad Sci USA. 1991;88:2721–2725.
9. Cunningham VJ, Jones T. Spectral analysis of dynamic PET studies. J Cereb
Blood Flow Metab. 1993;13:15–23.
10. Logan J. Graphical analysis of PET data applied to reversible and irreversible
tracers. Nucl Med Biol. 2000;27:661–670.
11. Engler H, Lundberg PO, Ekbom K, et al. Multitracer study with positron
emission tomography in Creutzfeldt-Jakob disease. Eur J Nucl Med Mol
Imaging. 2003;30:85–95.
12. Razifar P, Lubberink M, Schneider H, Langstrom B, Bengtsson E, Bergstrom M.
Non-isotropic noise correlation in PET data reconstructed by FBP but not by
OSEM demonstrated using autocorrelation function. BMC Med Imaging.
2005;5:3.
13. Razifar P, Sandstrom M, Schneider H, et al. Noise correlation in PET, CT,
SPECT and PET/CT data evaluated using autocorrelation function. BMC Med
Imaging. 2005;5:5.
14. Razifar P, Axelsson J, Schneider H, Langstrom B, Bengtsson E, Bergstrom M. A
new application of pre-normalized principal component analysis for improve-
ment of image quality and clinical diagnosis in human brain PET studies:
clinical brain studies using [11C]-GR205171, [11C]-L-deuterium-deprenyl, [11C]-
5-hydroxy-L-tryptophan, [11C]-L-DOPA and Pittsburgh compound-B. Neuro-
image. 2006;33:588–598.
15. Razifar P, Axelsson J, Schneider H, Langstrom B, Bengtsson E, Bergstrom M.
Volume-wise application of principal component analysis on masked dy-
namic PET data in sinogram domain. IEEE Trans Nucl Sci. 2006;53:2759–
2768.
16. Blomquist G, Ringheim A, Estrada S, et al. Influx and net accumulation of PIB
compared with CBF in a rhesus monkey. Eur J Nucl Med. 2005;32(suppl
1):S263.
17. Otsu NA. A threshold selection method from grey-level histograms. IEEE Trans
Syst Man Cybern. 1979;1:62–66.
18. Andersson JL, Thurfjell L. Implementation and validation of a fully automatic
system for intra- and inter-individual registration of PET brain scans. J Comput
Assist Tomogr. 1997;21:136–144.
44 JOURNAL OF NUCLEAR MEDICINE TECHNOLOGY • Vol. 37 • No. 1 • March 2009
by on April 3, 2019. For personal use only. tech.snmjournals.org Downloaded from

Doi: 10.2967/jnmt.108.054296Published online: February 17, 2009.
2009;37:38-44.J. Nucl. Med. Technol. Pasha Razifar, Henry Engler, Anna Ringheim, Sergio Estrada, Anders Wall and Bengt Långström
C-PIB PET11Volumewise Principal-Component Analysis in An Automated Method for Delineating a Reference Region Using Masked
http://tech.snmjournals.org/content/37/1/38This article and updated information are available at:
http://tech.snmjournals.org/site/subscriptions/online.xhtml
Information about subscriptions to JNMT can be found at:
http://tech.snmjournals.org/site/misc/permission.xhtmlInformation about reproducing figures, tables, or other portions of this article can be found online at:
(Print ISSN: 0091-4916, Online ISSN: 1535-5675)1850 Samuel Morse Drive, Reston, VA 20190.SNMMI | Society of Nuclear Medicine and Molecular Imaging
is published quarterly.Journal of Nuclear Medicine Technology
© Copyright 2009 SNMMI; all rights reserved.
by on April 3, 2019. For personal use only. tech.snmjournals.org Downloaded from