Embed Size (px)
Citation preview

AN ASSESSMENT O F THE TROPHIG STATUS O F D E E R , LOO
L Y N N SINGLETON JERRY THIELEN
DAN K R U G E R
J u l y , 1980
Washington S t a t e Department of Ecology Water and Wastewater o n i t o r i n g Sect ion
Olympia WA 98504
D.O.E. 80-9

ABSTRACT
The t r o p h i e s t a t u s o f Deer, Loon, and Diamond l a Spokane, Washington, was evaluated during t h e 19 Sampling occurred bi-weekly from May t o November a l s o u t i l i z e d where poss ib le t o etermine i f wat i n any of t h e l akes .
The r e s u l t s ind ica ted t a t a17 t h r e e l akes a r e m n u t r i e n t and chlorophyl a concentra t ions be1 ow f o r eu t roph ic waters . 17 t h r e e lakes l imne t ic anoxia. Loon Lake experience t h r e e lakes w i t h t h e bottom nine meter October. The mean n u t r i e n t concentra t ions and t ne t i c anoxia appeared unchanged from condi t ions DOE study. Loon Lake a l s o had t h e lowest mean s t h r e e and was t h e only l a k e t o have a s i g n i f i c a n c l a r i t y from t h e p r i o r survey.
The 1978 phytoplankton numbers i n Loon and Deer l ake n i f i c a n t inc reases from t h e 1971-1972 seasons . The e s composi t i on appeared t o change from domination by t h e B a c i l l a r i o t o domination b y Cyanophyta i n both Loon and Diamond lakes . Deer co-dominated by t h e Chlorophyta and Cyanophyta, a ch vious co-domination b y , t h e Bac i l l a r iophyta and Chlor phytoplankton changes may only be an a r t i f a c t due t o t i o n techniques used i n t h e previous DOE s t
The water qua1 i t y of Diamond Lake appears t o s ludge beds p resen t from p r i o r log r a f t i n g pr a r e a s were no t sampled i n t h i s study; however c o l l e c t e d by the E P i n d i c a t e they a r e very product ive s i t e s . Thi examination before t h e t r o p h i c s t a t e of Diamo adequately.

ABSTRACT
TABLE OF CONTE
LIST OF TABLES
GLOSSARY
DESCRIPTION OF STUDY AREA Deer Lake Loon Lake Diamond Lake
Phys ica l Parameters Chemical Parameters B i o l o g i c a l Parameters
RESULTS AND DISCUSSIO Phys ica l Parameters
Transparency Temperature
Chemical Parameters D i sso l ved Oxygen P H N u t r i e n t s
B i o l o g i c a l Parameters Phytop lankton Ch lo rophy l l a Phytop? ank ton Standing Crop
Deer Lake
Diamond Lake B a c t e r i a
CONCLUSIONS AND RECO
LITERATURE CITED
PPENDIX C

Figure 1 .
~ i g u t e 2.
Figure 3.
Figure 4.
Figure 5.
Figure 6a.
Figure 6b.
Figure 7.
Figure 8.
Figure 9a.
Figure 9b.
Figure 10.
Figure 1 1 .
Figure 1 2 .
Figure 13.
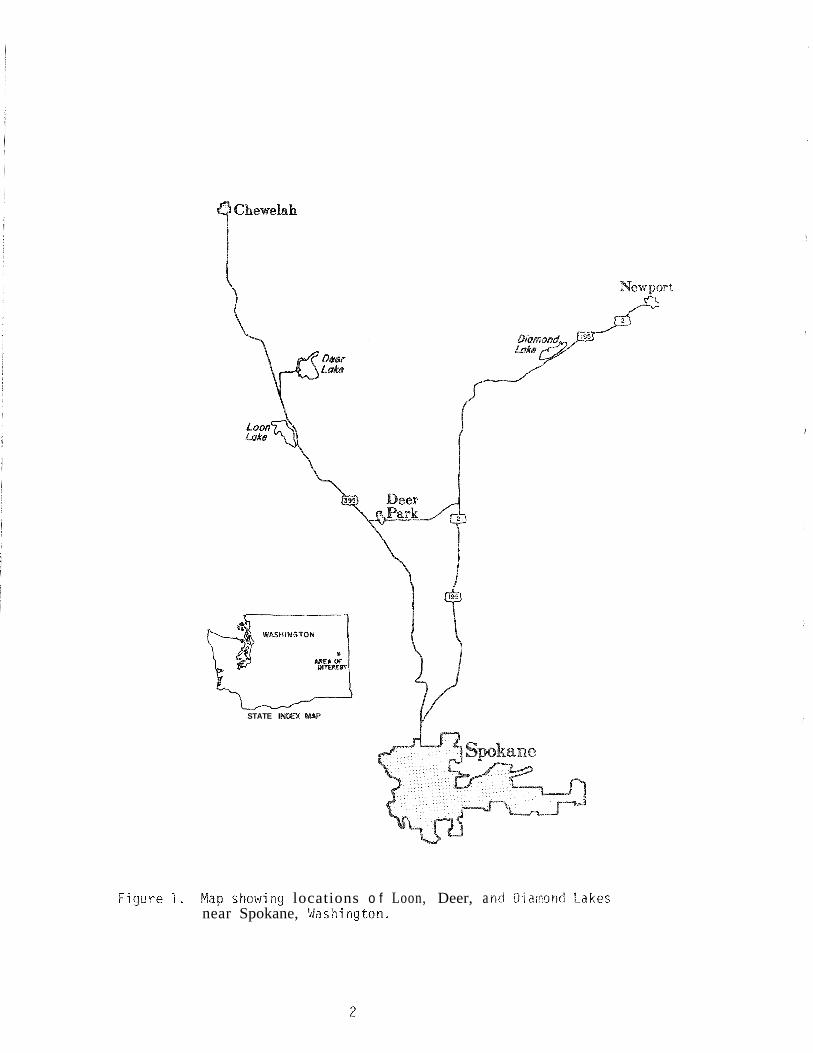
ap showing locations of Loon, Deer, and Lakes near Spokane, Washington ........................ 2
wing location of DOE water qu on Deer Lake during 1978.,.............-v.a.m. 4
Map showing locations of DOE water quality s t sampled on Loon Lake during 1978 ...................... 5
Map showing location of DOE water quality s ta t ion ................... sampled on Diamond Lake during 1 78 7
Isol ines depicting temperature ("6) conditions a t ....... Deer Lake during 1978 DOE water qua1 i t y study.. 10
Is01 ines depicting temperature ( O C ) conditions a t s tat ion 1 , Loon Lake, during 1978 DOE water quality study ................................................. 11
Is01 i nes depicting temperature ("C) condi Lions a t s ta t ion 2 , Loon Lake, during 1978 DOE water study ................................................. 1 2
Isolines depicting temperature ('6) conditions a t Diamond Lake during 1978 DOE water quality stu 13
Is01 ines depicting dissolved oxygen (mg/L) conditions a t Deer Lake during 1978 DOE water quality study ...... 1 5
Is01 i nes depicting dissolved oxygen (mg/L) conditions a t s ta t ion I , Loon Lake, during 1978 DOE water quality study ......................................... 16
Is01 ines depicting dissolved oxygen (mg/L) conditions a t s tat ion 2 , Loon Lake, during 7978 DOE water quality study ...................................*.... 17
Isolines depicting dissolved oxygen (mg/L) co a t Diamond Lake during 1978 DOE water quality 18
3 3 Phytoplankton cell volume (pm /ml x 10 ) by a t Deer Lake during the 1978 DOE water 2 4
3 3 Phytoplankton cell volume (pm /ml x 10 ) a t s ta t ion 2 , Loon Lake, during the 1978 DOE water quality study ............................,......**.-..
3 3 cel l volume (pm / m l x 10 ) by a t Diamond Lake during the 1978 DOE water quality study 28

r iss f i E w 5


Acre-foot. The volume of water required t of 1 0 cubic fee t , or 325,
. Small, simp a l ly aquatic, w b u t lack roots
A1 gal bloom. umber of part icular a1 in which the algae clo the water notic
Anaerobic. Con i t ions characterized by t
t part of a water body to w f f i c ien t intensity to maint
A uifer . A rock formation that i s water bearin 3-
Bathymetric. Relating to the measurement of water de lake.
. The organisms living i
eep, s teep-wal 1 ed asin in the s i glacial erosion.
Closed lake. lake, usually in an a r i not have a surface out le t .
Compensation 1 eve1 . The dept a t which oxygen productio synthesis balances oxyge uptake by respi
Consumers. Organi sms t t are unable to ma that feed upo
Coulee. A short
Crater lake. lake that occupies the cra ter of an -
. The acceleration of the of a lake as a resul
. Organisms, mostly bacteria or f organic material into i t s inorga
Dimictic. A term applie to a lake which u thermal circulat ion o r overturn, each
Drainage basin. The area by, or contributin lake, or other water body.


INTRODUCTION
Deer, Loon, an Diamond lakes a r e located north of Spokane, (Figure 1 ) . I i s feared t h a t these once 01 igo t rophic lakes going n u t r i e n t enrichment r e su l t i ng from heavy r ec r ea t i o development. Increased domestic usage has the po ten t ia l t i a l l y increasing n u t r i e n t loading t o a system, thereby acce eu t rophica t ion . The in f lux of nu t r i en t s may o r i g i n a t e from several sources; however, the primary source appears t o be l eacha te from s e p t i c tank systems used by the r e s iden t s on t he lakes . The responsible and concerned property owners of Deer, Loon, and Diamond lakes sewering p ro j ec t s f o r t h e i r respec t ive lakes hoping t o slow cul t u r a l eu t rophica t ion . In response t o these needs, the Eastern Regional Off ice of the Washington S t a t e Department of Ecolog requested the Water and Wastewater Monitoring Section t o con comprehensive s tudy of the t h r ee lakes .
The goals of t h e study were t o : (1 ) determine t h e cu r r en t water condi t ions and t roph ic s t a t u s of each lake; ( 2 ) d e t e c t possible c from condi t ions reported in a previous DOE s tudy (Bishop, 1973); and ( 3 ) make recommendations regarding the sewering p r i o r i t y of each 9
DESCRIPTION OF THE STUDY AREA
Deer Lake
Deer Lake (Stevens County) i s located approximately 32 miles north of Spokane, Washington (Figure 1 ) . Ac t iv i ty on t he lake i s seasonal ( f i s h - ing, swimming, boa t ing) , with t he shore1 ine densely populated with approximately 500 homes (Bort leson, et aZ., 1976). About 85 percent a r e occupied seasonal ly . The major i ty of homes u t i l i z e on- s i t e wastewater disposal systems (Shoemaker, 1976). Inflow t o t he l ake i s from several i n t e rmi t t en t streams or! g i n a t i ng i n the surrounding mountainous t e r r a i n . The i n t e rmi t t en t outflow i s con t ro l led by a low weir w i t h f lashboards (Bort leson, et aZ., 1976). No demographic da ta a r e ava i l ab l e f o r growth a t t he lake; however, t he annual growth r a t e f o r Steve s County between 1970 and 1980 was approximately f i v e percent.
Eighty- three percent of t he drainage basin i s f o r e s t ed o r Agricul tural uses and suburban development account f o r only four percent each, with the l ake sur face comprising the remaining nine percent (Dion, et aZ., 1976).
tbrphometric data f o r t he l ake a r e l i s t e d in Table 1 (Bort leson, e t nZ., 7976).
STATE I
locations o f Loon, Deer, a near Spokane,

orphometric Data f o r Deer Lake ( e l e v a t i o
Dra i nage Area Surface Area
a ke Vol ume ean Depth
Maximum Depth 75 f e e t Length of Shore1 i ne 45,000 f e e t
For the s tudy, a s i n g l e sampling s t a t i o n was l oca t e i n the deepest pa r t of t he lake (Figure 2 ) .
Loon Lake -
Loon Lake (Stevens County) i s located approximately 28 miles north of Spokane, Washington, near t he town of Loon Lake (Figure 1 ) . The pre- dominant rec rea t iona l a c t i v i t i e s on t he l ake occur during the warmer months of the yea r (May t o September) which include f i sh ing , swimming, and boating. There a r e approximately 600 nearshore homes, two r e s o r t s / marinas, and a t r a i l e r cour t located on the l ake (Bort leson, e t a l . , l974) , a1 1 of which u t i l i z e s e p t i c systems (Kennedy, 1978).
Several i n t e rmi t t en t streams cons t i t u t e the inflow whi 1 e outflow i s con t ro l led by gages a t a weir located on the nor theas t corner of the lake (Bort leson, e t aZ., 1974). Seventy-one percent of the drainage basin i s f o r e s t ed o r uncul t ivated. Agricul tural and suburban develop- ment account f o r 13 percent and four percent , r espec t ive ly , with the lake sur face comprising the remaining 1 2 percent (Dion, e t a l . , 1976). Florphometric da ta a r e presented i n Table 2 (Bort 'leson, e t aZ., 1974).
Table 2. Morphometric Data f o r Loon Lake (e leva t ion 2,381 f e e t ) .
Drainage Area Surface Area Lake Volume Mean Depth Maximum Depth Length of Shorel ine
7,730 ac res 51,500 ac r e- f ee t 46 f e e t I00 f e e t 47,800 f e e t
Figure 3 dep ic t s the loca t ion of the two sampli
Diamond Lake
Diamond Lake (Pend Oreil l e County) i s located e a r Newport approximately 45 miles north of Spokane, Washington. Recreational periods a t i e s a r e simi 1 a r t o the previously mentioned lakes . Approximately 360 homes a r e located on o r near t he shore . Only on- s i t e wastewater d i s - posal i s ava i l ab l e a t present (Daly, 1980). Acce ted populatio

F E F I' Figure 2. Map showing l o
s ta t ion sample ake during 1978.

Figure 3. Map showing l oca t i ons o f DOE water q u a l i t y 2000
s t a t i o n s sampled on Loon Lake during 1978. FEET
0 - in ions

w i s from two butaries with ty-ei g h t perce rainage basi n ultural uses a
two percent, respectively, with ing seven percent (Dion, e t aZ. may be found in Table 3 (Bortleson, e l nZ,, 1976).
al l measurements a t three-meter o bottom. A11 samples were col lec te
d Metho& ~ ; I Y > the Exar~rriimticin of Methods ,%r iYi.remirul AnirZysia of V L I ~ PF ( i d
P h sical Para 1
erature ("C) a jurnhos/cmj we n sits with a

0
F E F T
F i g u r e 4. Map showing l o c a t i o n o f DOE water q u a l i t y s t a t i o n sampled on Diamond Lake d u r i n g 1978.


Phys ica l Parameters
Transparency
The mean secchi d i s k depths observed a t t he t h r e e lakes, pas t (Bishop, 1973) and present , a r e g i ven i n Ta generated u s i n g data ob ta ined f rom o n l y tho bo th s tud ies . The d e c l i n e o f 1 . 2 meters i n decrease found t o be s i g n i f i c a n t (S tuden t ' s T Th is decrease i n water c l a r i t y may i n d i c a t e a a l g a l p roduc t i on .
Table 4. Mean secchi d i s k depths (m) and number o f observat ions f n ) made d u r i n g 1978 and p r i o r seasons (Bishop, 1973). Values were c a l - c u l a t e d us ing a l l s t a t i o n s f rom o n l y those months common t o bo th s tud ies .
Temperature
The t h r e e lakes e x h i b i t e d s i m i l a r seasonal thermal regimes w i t h t h e s t r a t i f i c a t i o n process hav ing a1 ready begun by t h e f i r s t sampling i n May. A d i s t i n c t meta l imnion was present by e a r l y J u l y . The most apparent s t r a t i f i c a t i o n occur red f rom y t o l a t e August, a f t e r which coo l i n g temperatures brought a t r a t i f i c a t i o n . F a l l t u r n o v e r was completed by mid-November when homothermic con- d i t i o n s e x i s t e d th roughout t h e water column o f each l a k e (F igures 5, 6a, 6b, and 7 ) . Temperature p r o f i l e s p resen t a t each sampling may be found f o r a l l s t a t i o n s i n Appendix B.
The i s o l i n e graphs presented i n F igures 5 th rough 10 may pose i n t e r p r e t i v e problems f o r those unaccustomed t o them. The graphs d e p i c t changes i n t h e water column f rom t h e su r face (0 meters) t o t h e bot tom o f t h e l a k e a t one l o c a t i o n over t ime. They a l s o pro- v i d e an es t ima te o f t h e c o n c e n t r a t i o n a t any depth and t ime as t h e i n d i v i d u a l l i n e s d e l i n e a t e zones o f equal temperature o r oxygen concen t ra t i on . For example, t h e temperature p r o f i l e i n F igu re 5 shows t h a t t h e g r e a t e s t range i n temperature was p resen t i n e a r l y August. The water f rom t h e s u r f a c e t o s i x meters ranges f rom l e s s than 23 degrees t o 21 degrees. A t s i x meters and elow, t h e tem- p e r a t u r e f a l l s r a p i d l y w i t h i n c r e a s i n g depth. The d e c l i n e slows a t 12 meters and t h e bot tom water i s seven degrees o r l e s s . I n Novem- ber, f o l l o w i n g f a l l t u rnove r , t h e temperature o f t h e e n t i r e water column i s uniform. These qraphs a r e in tended t o supp ly t h e reader w i t h a v i s u a l means t o f o l l o w changing c o n d i t i o n s over t ime.

Figure 5.

F i g u r e 6a. Is01 i nes d e p i c t i n g temperatur s t a t i o n 1, Loon Lake, d u r i n g s tudy .


Figure 7 . I so l i ne s depict ing temperature ( " C ) condi t ions a t Diamond Lake during 1978 DOE water q u a l i t y s tudy.


Figure 8. Is01 ines depicting dissolved oxygen (mg/L) condi Lions a t Deer Lake during 1978 DOE water quali ty study.


F i g u r e 9b. I s o l i nes d e p i c t i n g d i s s o l v e d oxygen (mg/k) con a t s t a t i o n 2, Loon Lake, d u r i n g 1978 DOE w s tudy .

Figure 10, Isolines
18
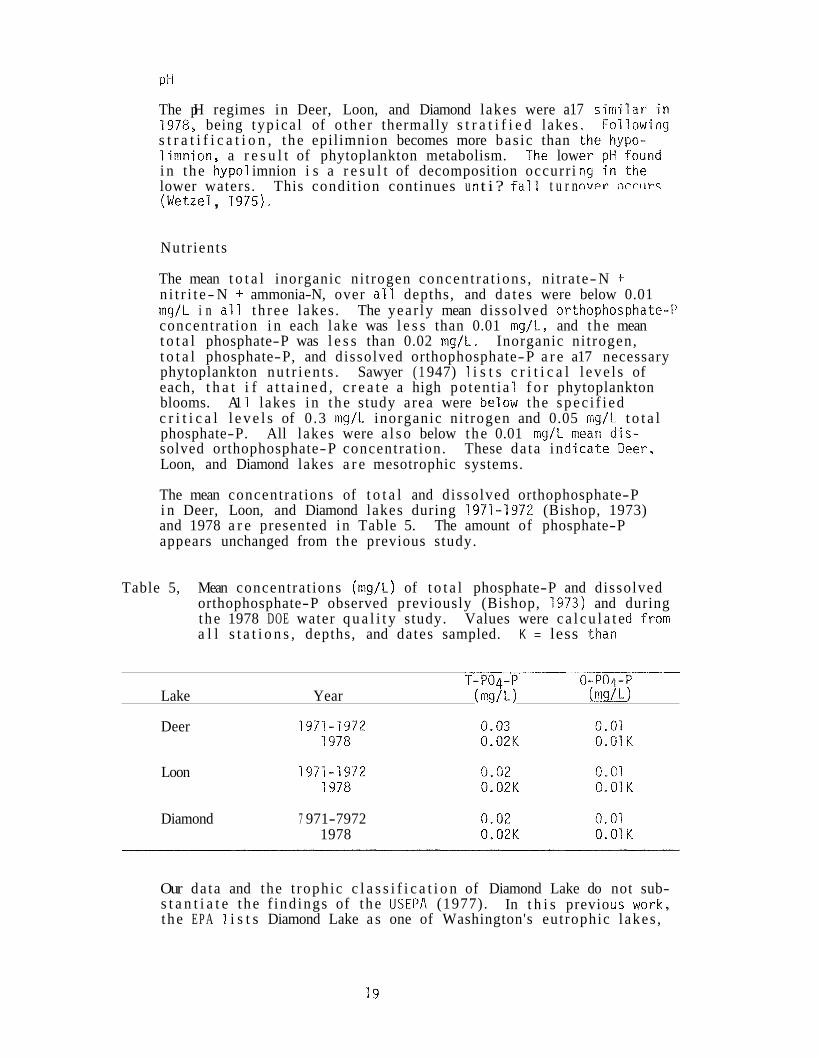
The pH regimes in Deer, Loon, and Diamond lakes were a17 simi 1978, being typ ica l of o the r thermally s t r a t i f i e d lakes s t r a t i f i c a t i o n , t he epil imnion becomes more bas ic than limnion, a r e s u l t of phytoplankton metabolism. The low i n t he hypo1 imnion i s a r e s u l t of decomposition occurr i lower waters. This condi t ion continues u t i ? f a l l t u r n (Wetzel , 1975).
Nutr ients
The mean t o t a l inorganic ni t rogen concen t ra t ions , n i t ra te-N + n i t r i t e - N + ammonia-N, over a l l depths, and da tes were below 0.01 mg/L i n a l l t h r ee lakes . The year ly mean dissolved or tho concentra t ion i n each lake was l e s s than 0.01 mg/L, and t he mean t o t a l phosphate-P was l e s s than 0.02 mg/L. Inorganic ni t rogen, t o t a l phosphate-P, and dissolved orthophosphate-P a r e a17 necessary phytoplankton nu t r i en t s . Sawyer ( 1 947) 1 i s t s c r i t i c a l l eve l s of each, t h a t i f a t t a i n e d , c r e a t e a high po ten t ia f o r phytoplankton blooms. A1 1 lakes i n t he study area were belo the spec i f i ed c r i t i c a l l e v e l s of 0 .3 mg/L inorganic ni t rogen and 0.05 mg/L t o t a l phosphate-P. All lakes were a l s o below the 0.01 mg/L solved orthophosphate-P concentra t ion. These da ta i n Loon, and Diamond lakes a r e mesotrophic systems.
The mean concentra t ions of t o t a l and dissolved orthophosphate-P i n Deer, Loon, and Diamond lakes during 1971-1972 (Bishop, 1973) and 1978 a r e presented i n Table 5. The amount of phosphate-P appears unchanged from t he previous study.
Table 5, Mean concentra t ions (mg/L) of t o t a l phosphate-P and dissolved orthophosphate-P observed previously (Bishop, 1973) and during t he 1978 DOE water q u a l i t y study. Values were c a l c u l a t e a l l s t a t i o n s , depths, and dates sampled. K = less dh
Lake Year (mg/ 'L ) ( m d ~ ) Deer
Loon
Diamond 7 971-7972 1978
Our da ta and the t roph ic c l a s s i f i c a t i o n of Diamond Lake do not sub- s t a n t i a t e t he f ind ings of t he USEPA (1977). In t h i s previo t he E P A 1 i s t s Diamond Lake a s one of Washington's eutrophic l akes ,

s ta te l i e s entirely

Table 6. The euphot ic zone depths (in) and monthly mean chlorophyll a (vg/L) from Deer, Loon, and Diamond Lakes, DOE s tudy, 1978.
Euphotic Zone Chl orophyl 1 - a Lake Date Depth (m) tv g/L
Deer 5/15 6/ 07 6/ 28 7/18 8/ 01 8 /15 8/ 29 9/12 9/ 27
1 O/3l 11/14
Loon
Diamond
Ilo Data 17 1 7 1 8 1 6 1 6 1 6 17 17 1 7
9
Monthly Mean Chlorophyll - a
No Data 1 7 17 17 1 8 1 5 1 5 1 5 14 13
Monthly Mean Chl orophyl l - a
No Data 1 5 14 1 5 14 14 14 14 14 14
Monthly Mea Chl orophyl 1 - a
0.60 1 .30 1 . 9 3 7 .ti 1 .3 1 .O7 0.83 0.70 1 - 2 3 7 - 67
1 .31
0.50 1 . I 5 0.81 2.44 2.04 1 .42 1.34 1 .O7 1.83 1.67
1.48
Plo Data 1 .82 0 .45 t . I 3 1 - 3 0 1 ,O8 0.83 1 .35 0.63 2.68
1 . 4

I
11 s / m I j and biovol urne concentr
Dominance i3ioval ume Dominance ( % ) (l irn3/m~ x lo3) ( ~1-
Bacil l a r i o p h y t a 59.8 13.1
10.1
22.1

smal l s i z e o f t h e predominant organisms, pe rcen t o f t h e biovolume. The B a c i l l a r i t h e predominant d i v i s i o n compr is ing 58.5 served biovolume. F i g u r e 11 presents po phy top lank ton d i v i s i o n s exper ienced d u r i
The 1978 phy top lank ton community was som bo th compos i t ion and numbers f rom t h a t o 1972 (Bishop, 1973). An a n a l y s i s o f v a r i n d i c a t e s a s i g n i f i c a n t d i f f e r e n c e e x i s t s b e t c e l l s / m l observed on any sampling i n 1971-197 observed i n 1978. For comparat ive purposes, d e n s i t i e s f o r bo th s t u d i e s (Tab le 8) were d e t those months common t o bo th s tud ies . The pre p l a n k t o n d i v i s i o n s h i f t e d f rom t h e Ch lorophyt i n 1971-1972 t o t h e Cyanophyta i n 1978. B1 from 0.6 percent i n 1971-1972 t o 27.8 perce season. The " o t h e r " category, c o l 1 e c t i v e l y Chrysophyta, go1 den a1 gae; Cryptophyta, phyta, euglenoids; and t h e Pyrrophyta, r s i m i l a r l y i n 1978.
a r y o f t h e phytoplankton t o t a l d i v i s i o n a l dominance (%) observ
1973) and 1978 seasons. Values were ca l cQ la ted from o n l y those months common to- both studies.
Numbers ( c e l l s/ml) D i v i s i o n a l Dominance (%)
Bac i l l a r i ophy ta Chlorophyta Cyanophyta Others
Loon Lake
The phy top lank ton community was w e l l es pu lses o f Dinobryon divergens and sever e s t month ly dens i t y , 1135 c e l l s / m l , was s imul taneous pulses o f t h e B a c i l l a r i o p h erotonensis and CycZoteZZa sp., and t h e dominant ly Gleocystis ampla, occurred. were observed i n August; however, domin Cyanophyta when Aphanothece nidulans an became p r e v a l e n t . Maximum ce9 1 vo9 umes t h e aforementioned increases i n t h e diatoms August 's c e l l volumes were n o t exceedin smal l s i z e o f t h e blue-greens. The mea d e n s i t y , 466.1 c e l l s/ml , was dominated

F i g u r e 1 1 .


Diamond Lake
The phytoplankton comuni ty of Dia lished by the i n i t i a l sampling i n the majority of the species observ of the large, red alga GZenodini marily r sponsible f o r the highest S 534.0 um /ml x lo3, observed in t h a t thei r greatest when the blue-g A. niduluns were ominant on July spectively. The ean numerical s highest in July when densities re overall mean monthly numerical s t was dominated by the Cyanophyta w to the to ta l . The Pyrrophyta acc of the numerical density, b u t bec contributed 63.2 percent of the o (Table 1 1 ) . Figure 13 depicts t h during the 1978 season.
Numbers Dominance B'ovolurne 3 Domi na nc D i v i s i o n (ce l l s/ml ) ( % ) (urn / m l x 10 ) ('XI
Bac i l l a r i ophy ta 51.2 20.0 7.1 14.2
Chl orophyta 20.4 8.0 1 . I
Cyanophy t a 134.2 52.5 2 12.4
Chrysophyta 34.6 13.5 .5
Cryptophyta 2.9 1.1
Total 55.
The lowest phytoplankton concentration August 28 and September 11. This i s a that time of year and the lake type ( G probable cause of these low values i s the populations due to sampling error. uniformly distr ibuted throughout the e migrational patterns and buoyancy di f f tend to concentrate organisms of varyi 1967 ) . The sampl ing procedure i s desi a t e nor eliminate the ef fects of phyto I t i s , however, possible that overesti tion could occur i f samples were obtai sparse areas. I t appears that t


Previous work
As w i t h t h e o t Diamond Lake h Table 12 shows
summer.
months comon t o both studies.
Numbers (cel l s/ml)
Some general t rends i n t h e phyt kes of t he study. t he mean monthly numer om what was observed p
(Bishop, 1973). These a
ing 1971-1972 (Bishop, 19


LITERATURE CITE
American Pub1 i c Hea l th Assoc ia t i on , 1975. Standard Methods for the E m i - nat ion o f Water and Wasteuater, 14 th e
Bishop, R. A., 7973. Loon, Deer and Diamond Lakes Water Quality Stzdy, S t a t e o f Wash., Dept. Ecology Rept. 73-03
Bor t leson, G. C., G. T, Higg ins , and G. W. Hi l l , 197 Lakes i n Washington, Part 2, Water Suppl Ecology, 145 pp.
Bor t leson, G. C . , G. T. H igg ins , J . B. Data on Selected Lakes i n k sh ing ton , p t . 3, Wash. St . Dept. Ecology, 143 pp.
Daly, I., 1980. Personal co u n i c a t i o n . Diamon
Dion, PI. P., 1978. Primer on Lakes i n Washington, Wash. St . Dept. Ecology, 55 pp,
Dion, N. P . , G. C. Bo r t l eson , J . B. McConnell, Reconnaissance Data on Lakes i n Washington, Wash. S t . Dept. Ecology, 267 pp.
Gibbons, H. L., 1980. Personal c o m u n i c a t i o n , Dept.
H a l l , D. J., W. E. Cooper, and E. E. Werner, 1 t o t h e p r o d u c t i o n dynamics and s t r u c t u r e o f f a t e r animal communities, Limnol. Oceanogr. 15, 839-928 pp.
Hutchinson, G. E., 1957. A Treat i se on LimnoZogy, I , Geography, Physics and Chemistry, John Wi ley an Sons, New Vork, 1
Hutchinson, G. E., 1967. A Treat i se on Lirmzology, 1T. Introduction t o Lake Biology and the Limno-plankton, John Wi ley and Sons,
Kennedy, M. A. , 1978, Wastewater E%lcili i e s Plan for Loon Lake, MA, U t i l i t y D i s t r i c t No. 7 , Stevens Co.,
P a t r i c k , R. and 6. \.I. Reimer, 1966. The Diatoms of the United S ta tes , P h i l , Acad. o f !.la t. Sc i . onogr. 13, Vol . I, Pa.,
P a t r i c k , R. and C. Reimer, 1975. !?'he Diatoms o f the United S ta tes . Acad. o f Nat. Sc i onogr. 13, Vol. 11, P
Po r te r , K. G. , 1977. The p lant- an imal i Amer. Scien. 65: 1 59-1 69 pp. r
Presco t t , G . W . , 1962, Algae o f the Western Great Lakes Area, Iowa, 977 pp.
Rodhe, W., 1969. C r y s t z a t i o n of e u t r o p h i c a t i o Europe, I n Eutrophic n, Causes, Consequences and Correctives, 50- 74, Nat. Acad. o f Sci . , . D.C., 661 pp.

7. Fertil i z a t i s England Water .J
er and Sewerage Fae { t i e s Plan for Deer Lake.
5 0 , Fresh-wxter Algae of the United S ta tes , F 9 7
hemieal Analysis of Vater and Wastes,
l e County, Washington, E
ogy, 1977. Washington S ta t e Water Quali by Standards, 33 P P .

Several members of the Department of Ecology s t a f f ha in t h i s study since i t s inception. Thanks a re given to his help in the sampl ing and the members of the Olympia Laboratory f o r the water analyses. The cartoqraphic sec the f ine graphics work presented here, and Bob James pro processing and re t r i eva l , The phytoplankton identif icat ion tion provided by Harry Gibbons, Ph .D. (Washington Sta te most beneficial . Appreciation i s extended to John f i e ld work and time spent reviewing the manuscript fo r her help in the manuscript preparation.


APPENDIX A
WATER QUA1 I T Y DATA


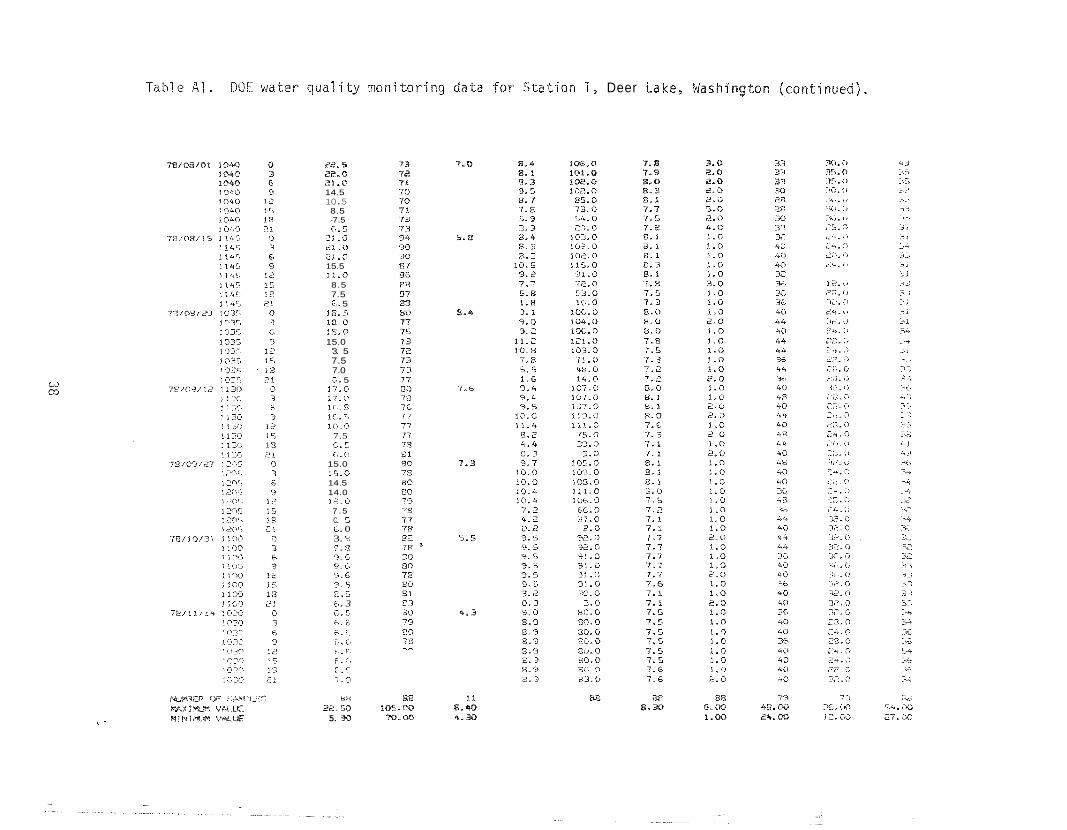
Table A1 . DOE water qua1 i t y mon i to r ing data f o r S t a t i o n 1, Deer Lake, Washington.
DEPARTMENT OF ECOLQGV
DF-FRO l DEER L A E < E A T W I D L A K E
DATES' 7R/05/01 TO 7 S / + i / 3 0 S T f P E I MINOR D A f IN: UPPCR C i X ~ b W I A S T W r T CUB BASIN: CM-J ILLE
LATITJMI: 48 M 28.0 Uf7.'ATION ,FELT): 2 4 t Z k A T f R C L k m : LOhCITUPE: 117 35 18.0 C M XVT /: ST E K I G %-C:CuT:
AGENCY: 21 540000 STATE: WAWINGTDN F T A TYPE:
TERtCINAL 1ST L E V LEV X@ L E V 4T t I L E J 5 T I i LEV LTti L E V S T R E W M I L T S FILES M I L C S M I L E L M I U S : f i L f ;
- -- lo. n :0. G 10.4
7.8 C.. 5 G . 3 6.9 5 . 3 18.5 17.5 14.C 10.5 a. 0 7.0 6 . 5 E.0
LW. 5 12.3 17.5 13.5 13 . i 7 . ; 7.0 C.0 LY . 5 LW. 2 rYj. 1 13.5
a t i o n I , Deer L
22. 22 * 21-0 14.5 10.5 8.5 -7.5 E.. 5 2: -0 21 .O ar - 0 15.5 11.0 8.5 7.5 E.. 5
15.5 ra,o 10.0 15.0
'3. 5 7.5 7.0 c.. 5
17.0 17.3 :r,.o IC,, 5 10.0 7.5 f.. i E,.O
15.0 15.0 14.5 14.0 12.0 7 . 5 C.. I; C.. 0 3. C a. 0 3.c 3. h 3.6 3. S 0.5 6 . . 3 C..6 6. C. i.. F, 6.. C . b. O E ' ( . 6 ° F 7. 0
Pa 22. 5.
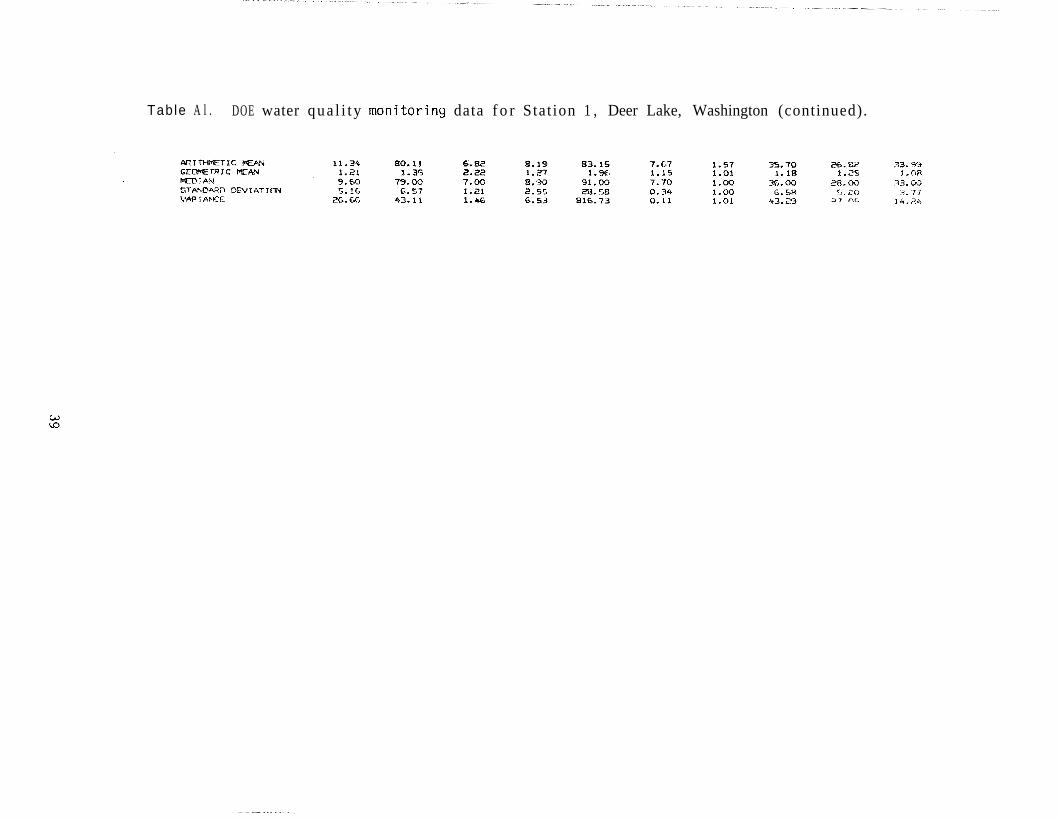
Table A l . DOE water qua l i ty m o n i t ~ r i n g data f o r Stat ion 1 , Deer Lake, Washington (continued).

r qua1 i t y mon i to r i ng da t o n

Tab7 e A1 . DOE w a t e r qua1 i t y mon i to r ing d a t a f o r S t a t i o n 1 , Deer Lake, a s h i n g t o n ( c o n t i n u e d ) .


Table A2. DOE water q u a l i t y mon i to r ing data f o r S t a t i o n Loon Lake,
ENT Of= ECOL
AGENCY a1 UFFICE OF W X R PROCR WATER OUBLIN €WENT D I V I S I ( M
WATER b WASTEWATU: WNITDRING SECTION
LOONO + L A M E AT NORTHWEST END
LATIT t iET : 413 02 55.0 ELEVATICN (FEET): 2 x 1 WATFR CLASS: LC LONGITLh-E: 117 37 54.0 COLQTY: STEVTNS SIIGM:XT : 23-59 100
AGCNCV: 21 5340030 STATE: WASI-iI NGTJN STA TYPE: LAKE
TERiCINW 1ST LEV L E V 3P0 LEV 4TH LEV STH LEV €,TI-( LE'J CTREAY W I L r S WILES M I L E S M I L E S MILCC M I L E S
ashington.
W 1 r3 00095 W 7 8 003GO 00301 00400 00070 00'300 00'315 00410 WATER CONDJCTW TRANSrliR DISZM .LET) DO P H TURI?IF)ITY HARDIKST, CCI-C ILiM W .AM .I>E
DEPTtf TEMP @ 2 5 C %CCHI OXYGEN PERCENT STmO TURUMTTER TOT C a C 0 3 DIG-Ca(07 i Cafn3 =TEES DCG-~C P l I C R O f 4 l f f i MClERS m g / l SATLIRATN U N I T S NTU m i ) / l m g / l m g / l - - - - ------ - - - - - - - . - -- - - - - -. - . - -- . - . - .- --- - - . - - - - - - -
0 11.5 1 C.h 5.5 10.6 108.0 8.3 1.0 C& 3 11.5 154 11.1 111.0 8.4 I. 0 r .g 5 10.0 155 12.4 120.0 8.3 1.0 - ,j ?.
'3 7.5 154 11.0 lC0.0 8.2 2.0 :.'it 12 7.5 I55 10.0 31.0 8.0 1.0 (A 15 6. 5 155 9.2 82.0 7.3 1.0 r.6 1 8 6.0 155 7.5 6G. 0 7.7 1.0 r;; 21 6.0 153 7.3 64.0 7.7 1.0 6.9 0 1'3. 5 ? 82 8.5 101.0 8.0 1.0 72 FS?. 0 F.2 3 18.5 177 8.5 33.0 8.0 1.0 72 G4.O 7 5 6 lC.O 173 8. 8 517.0 8. 2 1.0 75 F . 4 . 0 70 9 11.1 173 9.0 8'3.0 8.2 1.0 78 62.0 f.r I2 5.5 176 7.'3 1.0 €2.0 i .a E.3 ' 77.0 15 7.2 173 7.5 68.0 7.7 1.0 88 60.0 70 1 X 6 .5 172 6.3 X, . 0 7.5 1.0 3 5 60.9 -. , L 2 1 6.5 175 5.5 43.0 7.4 1.0 80 SC.. 0 7 1 0 a?. 5 lE.3 9.2 116.0 8.3 1.0 Edi 58. G 67 3 cW.0 153 8.8 lOG.0 8.4 1.0 EL! 5.z. 9 67 6 ID. 5 157 3.2 107.0 8.5 2.0 58 1~4. 0 i.i: 9 12.5 155 '3.4 'x. o 8.5 2.0 €2 %..0 c n
12 4.0 : 55 13.7 82.0 8. ? 1.0 f i l 52.0 <.A 7.5 157 7.0 158 t . 5 ICO
Z i 5 153 21 .O 152 20 .5 1 52 13.0 14'3 '3.0 150 8.0 1 Fn' 7.0 151 7.0 $57

. DOE water q u a l i t y monitoring da ta f o ion 1 , Loon L ashington ( c o n t i n u e
-0 -8 -0 - 0
64.0 €4.0 64.0 64. 0 60. 0 64.0 E.O. 0 5r.. 0 a j . :: I C . 0 2 4 . 0 20. 0 LC.. 0 i.',. 0 GO. G 6.0.0 Sf.. 0 60. o ,- >,.. 0 3. (7 6-. CJ 7i.. 0 4 3 . 0 6 4 . 0 60.0 6.4. 0 E.O. 0 64.0 L4. 0 66.0 6 4 . 0 72.0 64. 0 64. G GO. 0 (4. 0 C i , . 0 c.n. (i
tL .0 a. 0 G 4 . 0 64.0 60.0

Table A2. DOE water qua1 i t y monitoring da ta f o r S t a t i o n 1 , Loon Lake, Washington (con t inued) .
--- OFFICE OF WTCR PRDGR ER GUALITY NT DIVISIlIlPI
& WASTEWAT LWlNG SECTION
4 L A K E AT N C i R T H W E S T END
DATES t 78f05/0 2. TfX 78f 1 f f 30 S T m E T MI"CO D A S I N : UTPER CDLCMDIA BTORET SUB BAC.IF.1: COLV1ILL-E
LPTIT'LPr: 4 R 02 55.0 ELLEVAT I CN ( FECT ) : 233 1 WATrR CLASP: L O N G I T I S : 1 1 7 3 7 54.0 CM NTY: S T E M P G SCGWZNT:
AGEP.I':'t: 21 540000 STATE: WASH I NGTOI4 STA TYPC:
TERV:UK I S T L r V ?NU I EV 3fD I f V 4 T I I L r J 5:H L E V ETH LEV s w r A r MILES MILES MILCS MILEL MILFS MILES
OO€~?Q 0% 15 00C-10 00W5 0OGC.S DATE ' NITRATE N I T R I T E AMMUNIA KJCLDCd R T O T A L Fl?rIn TIME M0T1-I T W3-F: T NO2 N T Nt13-N N I T P K l - N PI XXPI RUC. PI-CT.1'IRCIS A SI'ECTFi(? CCL IT ORM
Tf l METERS ng/l ~ g / 1 mg/l T mg/l t4 1 n g / 1 P mg/1 P ug/l / L O o i r , 1 :.IT
0 0 . 0 2 X 3 0.0214 6 0. O<?K 9 0 . 0 2 K
1 2 0. OL* ! 5 O . W K 18 0.02 2 1 0.02 0 O . 0 2 K 3 0 . 0 a 1 6 0. W K 3 O . 0 2 K
12 0. OZK 1 S O.O?K I 8 0.O"K 2 1 0.0% 0 0. 0 1 K 3 0 . 0 1 K 6 0 . 0 l U 9 0 . 0 1 K
1 2 O . 0 i K 15 0. 9 i K 1 8 0 . 0 1 K 21 o . ~ ! K 0 L 7 - 0 1 K 3 0.0:u 6 O.0:K '3 0 . 0 1 K -, i '. 0 . 0 1 5 15 0. OIN 1 R 0 . 0 1 N 21 Q. O l K
0 . 0 2 K o.oac 0. O'X 0. oat 0. O L ~ 0.0% 0 . 0 2 H O.O?lf 0. O ? e. 0 1 0. OIK 0 . O l K O.OlK 0 . G l K 0. O I K 0. Or? 0.011< 0 . 0 1 K 0. O i K 0 . 0 1 K 0 .0111 0 . 0 1 K O.Ol i< 0 . 0 1 K O.C11!( 0 . 0 1 K 0 . 0 1 K 0 . 0 1 K 0 . 0 1 1 ( 0. O! I< 0 . 0 1 K 0. O I K

Table A2, DOE water qua1 i t y mon i to r ing d
0. O t K O"O1K 0.01K 0.01K 0. 0 ) K 0. O I K 0.011i 0.011( 0.31K 0. 0iK 0.0JK 0.04 0.04 0.02 0.0lK 0.0lK 0.01K 0.01K O.01K 0.01 K 0.0111 0. 01K 0. O I K O . O ? K 0.011: 0.01K 0. O1K O.01K O.01K 0. 0l 1, 0.01K 0.01K 0.01K 0. O! K 0.0: I: 0.01K 0.0lK O.0lK 0.0IK o.i):t< 0. O! l i 0.0:K 0.GIt' 0.0IK 0.01K 0.0lK 0.01K
73 0. 04 0.0: 0.01 0.90 0.01 0.01 0.
0.02 0. oc? 0.02 0.05 0.03 0.03 0.0; 0.05 0.02 0.02 0.02 0.01 0.01 0.02 0.01 0.02 0.02 0.02 0.01 0.02 0.0,: 0. Or? 0.02 0.03 0.03 0.07 0.02 0.02 0. W 0.02 0.03 0.03 0.03 0. Ck? 0.03 0. 0? 0.03 0.03 o.m> 0. 0c 0.01 0.02 0.02 0.01 0.01 0.01 O.w
713 0. OC. 0.01 0.02 0. BC 0.02 0. Ol 0.
t o n (cont inued) .

Table A3. DOE water qua1 i t y monitoring data f o r S ta t ion 2 , Loon Lake,
DEPARTMENT OF ECOLQCV
AGENCY 2154WQO RL'TRILZ'JAL - - - 01 WFICE CF M T E R PRm,RM?S WATER WALITY MPSI DIVISI TEII & WASTEwaT
Washi ngton .
LmI7NOZ LOON L A K E S OF GRANITE PT RESORT
DATES: 7E3/05/01 TO 7 6 / 1 1 / 3 0 STCPEr PTWW 3CSIN: LPPFR COLUMDIA STORTCT SUB GASIN: COLVILL I I
L:ITITLGT: 40 01 w.0 EI.EVATION (TECT) : 2301 WATER C L G S : LC LO(\>-ITllnE: 1 1 7 3 6 .?).O CGLCIT'/: S T E K f G E X G E N T : 23-53.-100
K E P C Y: 21 540COO STATE: WA!3iINC,TMJ STA TYPE: L A I E
T'RBiVAL 15T LEV 2W I EV 3RD LEV 4Tt1 LEV 5TH LEV 6Tf1 LEV SiPTrW M J L f S B I L E S M I L E S NILES M I L E M I L E S
0001 CI mms 00078 00300 00x101 00400 0070 00300 00 '31~; C+ 1 $3 357' W T L R CCWDGCTW TRNJ'XAI: DISTGLVED W PH 1~URDIDITY I-(kRDP4ESG CAI-CIWi W i < A i 4PK F201 T I M E CEi'TCt T T W C! 25 C SECCHI OXYGFN PTRCEhT STAMMRD TWiCPRTrR TOT C d 0 3 DIS-CaCO3 T C a C W T Ti KETEIC CTC -C MiCRCMI !TG K T E R S mg/i SATLIRrrTN U N I T S NIU mg/ l mg/ l m g i 1
- . - - - . -. - - - -
C.3 i,9 E.? C.4 i8 r.fl i 1 - - I
c.4 is C.G .7C, - - IU - - , C )
ti: :O
r - 6 . c 2 - -
1 " i*; F G 70 (.'.
i8 i .jX I .R , .fl C.? r Sc 6.7 C B 69

DOE water ual i t y mani t o r i n g d a t a f

Table A3, DOE water qua1 i t y monitoring data
t4WlRER OF S A M P L E S MAX 1 NIWl VALLIE ?l! N!r"J-l '.'4L!. E A? 1 TJ IWLT IC WEAN ,-'-" ,r~,,WrT2 1 s &-AN Y?@ &.,*.I S*&.,;.'liF 7 DCV I AT 1 PN L'AR i A?!i 'r
f o r S t a t i on 2, Loon Lake, ashi ngton

LPTITLOr: 4301 53.0 E L E V A T I W ( F E E T ) : 23231 WATER CLASS: L C LW.ITlt?F: 117 36 73.0 C M NTY: STCVChS SLTGCNT: 23-53 100
A C E W Y : 21 540Ct00 STATE: WAS IINGTDN STA TYPE: iAKE
TERVIWAL 1ST L E V LEV X D L E V 4Ri L E V 5TH LEV GTH L E V smrm MILES m n ~ s mrLrs MILES m r t x s MILES
lloo 1 loo 1100 1100
79/06/2e! 1315 1315 1315 13:5 1315 131 5 1315
O.O& O.OL'!< 0.0;_7! 0. o m o. oac 0.021< 0. oa: 0.0;_7( 0.0m 0,os: 9.0;_7( o* oa< O.O2Il( 0.011( 0. o m 0.0,a: n. oac 0.07!< O.OJ< 0. 02< 0.01K 0.01K 0.0:x o.oi1c 0. OlK o. niic 0. Oll! 0.011: 0.011' 0.01K 0.03K 0.O1K
0.oa 0. OLX 0. &?l< 0,OL'K 0.02K 0. 0& 0.02K 0. 0. O'K 0. OZK 0.01 0.01 0. OIK 0. OlK 0.01K 0.0:u 0. 01k 0.01K 0.01K 0.01 0.01K 0-0IK 0.01K 0. OIK 0.0111 0.01X 0.01K 0.01h 0.01K 0.01 a. O l K 0. oln

Table A3. DOE water qua1 i t y monitoring da ta
i. bfli < . \ - I : 0.01K 0.01K 0.011( 0.01K 0.01K 0.011( 0.01K 0.01K 0.0lK 0.01K 0.011< 0.01!( 0.01K 0.01K 0.01K 0.01K 0. OlK 0.011< 0.011; 0.ClK 0.011( 0.011! 0.011< 0.01K 0. OlH 0.011: 0.011( 0.011( 0.01K 0.01K 0.01H 0.01K 0.01K O.OlK 0.01K 0.01K 0.011( 0.0lK 0.01 t< 0.01 O-OlK 0.011( 0.01K 0.01K 0.01K 0.0111 O.OlK 0.011< O . O l K 0.01K 0.011< O.Olt( 0.011: O.Olt( O.01K 0.01K 0.01K 0.01K
f o r S t a t i o n 2 ,
J i l c .I 0.01 0.01 0.01 0.01 0.01 0.02 0.0% 0. O? 0.02 0.02 0.0s 0.03 o.o+ 0.03 0.02 0.02 0.03 0.03 0.03 0. 0? 0.37 0. or? 0.02 0.03 0.03 0. is! 0. (u,
0.03 0.0.' 0. G2 0.04 0.03 0.03 0.03 0.03 0. on 0. 0.04 0. w 0. w 0.0; 0.02 0. 0.02 0.03 0.04 0.02 0.03 0.03 0.03 0. oi? 0.0; 0.93 0.05 0. (3% 0. cia 0. 0.
Loon Lake,
O.O' . ' 0. o> '<
0- <Jli( 0.01K 0.011( O.CI1K 0.01K 0.011( 0.01K 0.01K 0.0:1< 0.01K 0.011< 0.01,( 0.011< 0.01K O.0lK 0.01K 0.01K 0. OlK O . O l K 0. Oil< 0. 31X 0.01K 0.01K 0.01H 0.01K 0.01K 0. 02 0.01 0.011< 0.OlK 0. GI!( 0.01K 0.01Y 0.OiK 0.01K 0.03 K 0.011( 0.0; ti 0.01K 0.011( 0.0:1< 0.011< 0.01K 0.011< 0.01K 0.01 O.Olt( 0.011< 0.0ii( 0.01K 0.01 1', 0.01 0.01 0.01 0.04 0. O? 0. Q I K 0.01K
Washington (con t inued) .

A3. DOE water qua1 i t y monitoring d a t a f o t i o n 2 , Loon Lake, Washington (con t inued) .
0. OIK 0.01K 0.01K 0.0iK 0. OlM 0.01K 0.01K 0. 0iK
1 0 0 0.04 0.01 0.01 0.22 0.01 0.01 0.00

Table A4. DOE water q u a l i t y monitoring da ta f o r S t a t i o n 1 , Diamond Lake, Washington.
AGEhrCY 21540000 RCTRIEVAL - - - 01 MAY 12G0 OFFICE OF WATER PROZRAMS WTCR W A L I T Y MWJAGCMTNT DIVISICN
WATER 8: WASTEWATER MCR4ITORING SECTION
0 X AM-3 1 DIAMOND L A K E MID L A K E OFF PUS AC
AGEPIZY: 21 540CiOO STATE: WASH I NGTON STA TYPE: LAJ<E
T T R F I b W 1ST LTV 2Ml l EV 3RO LEV 4TH LEV 5 T H LEV 6Tl4 L N STF\Z,+M M I L E 3 RILES MILES MILES M I L T S R I L E S
O A T r T W M T I R E
TO - - - - - - - - - - 7C/05/1G 1035
1035 72
1035 1035 1035
78/06/08 1210 1210 1219 1210
10 1210
78/06 /2L-1 i I X ? 1-85 1105 1101; 1105 i lo5
73/07/17 1330 : 1'30 12-Q 1 7 0 1330
METWS K C - C MICRWi- IOS K T E R S mg/ 1 SATURATN M I TS NTLI m g / 1 m g / l mg/ ! ---- --------- - . --------- -- ---.-. --- .- .- . - . - - - - . - - .- - . - - - - - . - . -
0 11.4 6'3 3.7 10.4 104.0 7.7 1.0 27 3 11.4 63 10.7 107.0 7.7 5.0 1035 6 I? . ;?
10.7 106.. 0 7.7 5.0 i i7 9 11.1 71 11.0 10'3.0 7.7 l.M 17 12 8.5 67 9.0 84.0 7.1 1.M ;+ 3
25.0 3 T: 25.0 ,=:a 25.0 7i3 t o . 0 F. F;
25.0 23 22 .0 z.3 23.0 23 I F . . 0 - -, -3 , 1 4 . ?1 27 14.0 i! 3 14.0 31
8.0 23 14.0 3?

DOE w a t e r qua1 i t y m o n i t o r i n g d a t a f o r ion 1, ( c o n t i n u e d ) ,
36 a. 0 40 ta. 0
28.0

Table A4. DOE water qua1 i t y monitoring d a t a f o r S t a t i o n 1, Diamond Lake,
isr LCV MILi-G
4TH LEV M I L E S
6 T t : LEV MILES
ashington (con t inued) .
- - - -. - - - - . - - .
0 0. O'K 3 0. 0,'H 5 0. CP!< '3 6.0%
112 0. BCK 15 0. O?K 0 0 . 0 1 K 3 O . 0 ' K E. O.01K '3 0 . 0 1 K
12 O . O l K i 5 0 . 0 1 0 0 .01K 3 0 . 0 1 u h 0.9: K 3 0.0: K
:> 0. O! K 15 O.01H 0 0.01 K 3 0 .03K E. 0 . 0 1 K 3 0 . O l K
! 2 0 . 0 1 K 1 c. 0.0lit 0 O.@!I< 3 0.C;: 6 G . C I K ? o.O:K
1 2 0 . 0 1 K : 5 0.0:K 0 0 .01K

l i t y m o n i t o r i n g
0 . 0 1 K O . O t K O . 0 l K 0 . 0 1 K C'. O l K CZ?. 0 1 t? 0.0:ii ? O i K L' . c, 1 I< A . "li! n . C i i i < 0.0;ir 0, C! K c . o ; t ? ,:s. O ? I (
0 . 0 l K 0.0ii: 0.0:H 0 . O l K 0. 07 12
O . ? ! l i 0. 3! i< O.O!K 0 . 0 ' K 0. 01 i! 0.0:1\ 0. G1H O . 0 l K o. 0 1 K
GO 0. O'? 0 . 0 1 0.01 0~ :I7 0.01 0. CIC)
0.00
ton ( con t inued) .

APPENDIX R
D isso lved Oxygen and Temperature P r o f i l e s


Figure B 1 . Deer Lake temperature ( " C ) and d i s s o l v e oxygen (mgb-) p r o f i l e s observed during 1978 DOE water qua1 i t y s tudy.


Figure B 2. Loon Lake temperature ("6) an i s so l v@d OxYge p r o f i l e s observed a t s t a t i o n 1 during 1978 DOE water qua1 i t y s tudy.


Figure B 3. Loon Lake temperature ( " C ) and d i s s o l v e Oxygen (mg/L) p r o f i l e s observed a t s t a t i o n 2 during 1978 WE water qua1 i t y study.


F i g u r e B 3. Loon Lake temperature ("C) and d i s s o l v e d oxygen (mg/L) p r o f i l e s observed a t s t a t i o n 2 d u r i n g 1978 DOE water qua1 i t y s tudy (cont inued) .


8 12 16 20 24 28 4 8 12 ' 6 20 i; 7 F - E M ' : ' ( 42 4 6 8 10 12 14 :----: 2 4 6 e l L ' - .I. 5 5 r,
Figure B 4. Diamond Lake temperature ( O C ) and dissolve profiles observed during 1978 DOE water quality study (continued).


APPENDIX C
Phytoplankton Data


3 Table C: . Phytoplankton nuinbers ( c e l l s / m l ) and biovolu (m /ml x l o3 ) obs front Deer Lake, water qua1 i t y s tudy , 1978.
May 15 June 7 June 28 Ju ly 18 August 1 August 1 5 Sgeci e; Nun:ber Val ume Number Volume FIumber Vol ume Number Vol ume Number Vol ume Rumber Vol um
Bacil l a r iophy ta AsterionelZa fomosa QcZoteZZa meneghiniczna Dia toiria s p . F x g i Z ~ r i a crotonensis S t e p ~ r w d - l s c u s s p. TabcZZaricr f snes trata
Division To ta l s
Chl orophyta Ankis trocZesmts f ractus Cosrnariun~ s p . Desmidiu-ii S ? . :iano-plankton S p k e r o c y s t i s Schroeter i
Division To ta l s
Chrys3phyta Diizbryon divergens
Division To ta l s
Cryptophyta Cr~~;pto~orzzs erosa
Division To ta l s
Cyariophyta Aphzocopsa &Zicatissima A? Pard thcce .zidtZans GZcjeocapsa puncta-ta
Division To ta l s
Eugl enophyta I-'haci.ts Sp.
Division To ta l s
Pyrrophyta Cmatiwa h i m d i n e 2 l a
Division To ta l s

I e C 1 . P h y t o p l a n k t o n numbers ( c e l l s/ml ) and b i o v o l urn i n g D water q u a l i t y s tudy , 1978 - Cont inued.
c i l l a r i o p h y t a Ast~rioneijJa firmosa Cg.c?,o tcZ Za menegiziniann: i x ~ t w ~ a sp. FragiZamk crofmzelzsis s"techomdiselns sD. ~a$e~~aria j~enes Lra
D i v i s i o n T o t a l s
l o r o p h y t a Ankistrodesmus frmctus Cosrriarhn Sp. Desw2iz.m sp. Nano- plankton +hccerocg/stis Sckroete~i 40.0
D i v i c i o n T o t a l s ---xxT .Chrysophyta
Dimbrpz divergens 40.0 Div is io t -1 T o t a l s 40.0
Cryp - d :n~??as erosa D i v i s i o n T o t a l s
Cyanophyta i,~karacopsa deZica$issima 1000.0
Glueocapsa punciati-i O i v i s i o n T o t a l s
ug? enophy t a PPaeu; s p *
D i v i s i o n T o t a l s 0.0
r r o p h y t a Cercrtim himdine ZZa
D i v i s i o n T o t a l s 0.0
OVERALL TOTALS 1140.0

3 3 Table C 2 . Phytoplankton numbers (ce11s/mlf and biovolurne (pm /ml x 10 ) observed From Loon Lake,
water q u a l i t y s tudy , 1978.
May 1 5 June 7 June 28 J u l y 18 August 1 5 Species Number Vol ume Number Vo1 ume Number Vo1 ume Number Vol ume Number Vo1 ume
Baci 11 ar iophyta Amphora Sp. AsterioneZZa formosa CycZoteZZa sp. Frogilaria e m tonensis h7avicuZa sp . Syzedra sp . Synedra uZra TabeZZaria fenestratu
Divis ion To ta l s
Chlcrophyia Cosmariwn biocuZatwn E i a k t o t h k gelatinosa GZoeoeystis mpZa Nano-plankton
. Sphuerocystis Schroeteri Division To ta l s
Chrysophyta . Oiiwbryon divergens
Division To ta l s
Cyanophy t a Arabaena c i r c i n a l i s Aphurotheee nidulans Gkeocapsa punctuta
Divis ion To ta l s
Eugl enophyta Pizac~cs sp .
Divis ion To ta l s
Pyrrophyta Caratiwn hirundinel Za CZewdimhn G y m d i n i m
Divis ion To ta l s
OVERALL TOTALS

bl e C 2 . Phy"cp1ankton numbers (cel l s i n l ) and obserited from Loon Lake, IIA dur ina DOE bkater q u a l i t y s tudy, 1978 - Continue
Speci es
Chlorophyta Cosmariwn biocu Zatwn Eiakgtotbix gezatinosa GZoeocystis m p l a :Jane-plankton Sr;herocys t i sSchroe ter i
D i v i s ~ o n T o t a l s
3ixobz*yon divergens Divis ion To ta l s
Eugl enophyta P k e u s s p *
Division To ta l s
y rropny ti! C e r a t i m h i m d i n e l l a Gi.anodiniwn G y m d i t 2 i m
Division T o t a l s

3 3 Table C3. Phytoplankton numbers (cel ' ls /mlJ and biovolume (urn /ml x 10 ) observed from Diamond Lake, :/A during DOE
water qua1 i t y s tudy, 1978.
Flay 16 June 8 June 29 July 1 7 Ju ly 31 Species Number Vol ume Number Vol une Number Volume .Number Vo1 ume Number Volume
Baci l lar iophyta Astzr ioneLh fomosa Cyc7yoteZl~ rneneghiniana MeZosiz-a granu7&ta Sgmdra u l m TabeZlurio fenestrota
Division ~ o t a i s
Chl orophyta Nano-plankton Spkaerocys t i s
Division To ta l s
Chrysophyta Dirwbryon divcrgens
Division Tota ls
Cryptophyta Crypt.omom8 ovata
Division To ta l s
Cyanophy t a Awboena cyZindrica Aphairlw thece niduZans Cmoococctcs p r e s c o t t i i GZoeocapsa prit&ta
Division To ta l s
Pyrrophyta Ceratilm hirundinel La GZcnodiniwz G i j ~ m d i n i m
Division To ta l s
OVERALL TOTALS

C3. Phy top1 an m D i water q u a l i t y s tudy , 9978 - Continued.
c i l l a r i o p h y t a As terioneZZa formosa CycZoSeZZa meneghinhm Me Zosira granulata Syu:e&z alna iX;25eZ Zmia fenestratu
Division To ta l s
Chlorophyta Nano-plankton Sphaeroeystis
i v i s i o n To ta l s
Ghrysophyta D%nobrym divergens
Division To ta l s
ryptophyta Cr:;ptorno.zcrs o?;c~ta
Division To ta l s
iirxzbaena eyZi?zd2Ga Aphcrnotheee n<duZaas Chroococcus presco t t i i Gloeocnpn punctatz
Division To ta l s
Pyrrophyta Ceratiwn kimlzdineZ Za iZenodi7ziun Gymnodinium
i v i s i o n To ta l s