Embed Size (px)
Citation preview

African Journal of Agricultural and Resource Economics Volume 11 Number 4 pages 292-304
An assessment of the effect of a national fertiliser subsidy
programme on farmer participation in private fertiliser markets in
the North Rift region of Kenya
Joyce Mumbua Makau*
Tegemeo Institute of Agricultural Policy and Development, Egerton University, Nairobi, Kenya. E-mail:
Patrick Irungu
Department of Agricultural Economics, University of Nairobi, Nairobi, Kenya. E-mail: [email protected]
Rose Adhiambo Nyikal
Department of Agricultural Economics, University of Nairobi, Nairobi, Kenya. E-mail: [email protected]
Lilian Wambui Kirimi
Tegemeo Institute of Agricultural Policy and Development, Egerton University, Nairobi, Kenya. E-mail:
*Corresponding author
Abstract
This study evaluated the effect of the national fertiliser subsidy on farmer participation in commercial
fertiliser markets in the North Rift region of Kenya. The study used primary data collected from 710
households. A double-hurdle model and descriptive statistics were used to analyse the data. The
results show that the national fertiliser subsidy reduces farmers’ probability of participating in
commercial fertiliser markets by 30%. On average, an additional kilogram of subsidised fertiliser
displaces 0.2 kg of commercial fertiliser from the market. This implies that the national fertiliser
subsidy has a displacement effect on commercial sales. The government therefore should consider
changes in programme design and implementation by distributing subsidised fertiliser to areas with
weak commercial fertiliser distribution networks. In addition, proper targeting of resource-poor
households is recommended if the programme objectives are to be achieved.
Key words: fertiliser subsidy; market participation; Kenya; double-hurdle model; displacement effect
1. Introduction
Fertiliser is one of the very important farm inputs to have received excessive government support in
sub-Saharan Africa (SSA). Such interventions include import and price controls, the institution of
fertiliser subsidies and the establishment of state-owned fertiliser production and distribution systems
(Ariga & Jayne 2010). However, government intervention in fertiliser markets, coupled with poor
investment to facilitate a competitive private fertiliser distribution channel, has been shown to deter
agricultural development in SSA countries (Takeshima & Lee 2012). Furthermore, in most cases the
private sector is negatively affected by government intervention in fertiliser distribution, especially if
public and private distribution channels exist concurrently (Ricker-Gilbert et al. 2011). The level of
market distortion is dependent on the efficiency of administrative processes, the size of the subsidy
programme, targeting, and the timeliness of fertiliser distribution; hence, its effect on private sector
participation is not obvious a priori (Liverpool-Tasie 2014).
AfJARE Vol 11 No 4 December 2016 Makau et al.
293
Kenya introduced its national fertiliser subsidy in 2009 in line with its Vision 2030. The subsidy is
being implemented as a three-tiered fertiliser cost-reduction programme called the “Fertiliser Cost-
Reduction Initiative”. This initiative, popularly known as “the national fertiliser subsidy”, is a state-
driven fertiliser subsidy programme implemented by the Ministry of Agriculture, Livestock and
Fisheries (International Fertilizer Development Corporation [IFDC] 2012). It was pioneered as an
emergency programme in response to high fertiliser prices in 2008. The aim of the programme is to
encourage fertiliser use through the reduction of fertiliser costs and an effective fertiliser supply chain
(Tier 1), blending (Tier 2), and support to local fertiliser manufacturing (Tier 3) (Ndung’u et al. 2009).
In an attempt to address Tier 1, the government procures and distributes fertiliser at subsidised prices
to farmers across the country through National Cereals and Produce Board depots (NCPB) (IFDC
2012). Fertiliser distribution through the NCPB parallels the commercial distribution, thereby
creating a “dual market” scenario.
According to the Ministry of Agriculture, Livestock and Fisheries (2014), the beneficiaries of the
subsidy programme are vetted and registered by the location-level subsidy fertiliser vetting
committee. The beneficiaries obtain an official, stamped form containing the quantity of fertiliser
required based on land size prepared for planting and the crops to be grown. The form is signed and
stamped by both the administrative chief/assistant chief and the ward agricultural officer. The form
is taken to the nearest NCPB depot, where the fertiliser is paid for and collected (Ministry of
Agriculture, Livestock and Fisheries 2014). Although government intervention in the purchase and
supply of subsidised fertiliser was expected to be short term so as not to disrupt the private sector, the
subsidy programme has continued unabated, fuelled mainly by political considerations (Ariga &
Jayne 2010).
Previous studies on the effect of fertiliser subsidies on commercial outlets in SSA have concentrated
on targeted subsidies, whereby the fertiliser is channelled to certain intended beneficiaries (see Xu et
al. (2009), Ricker-Gilbert et al. (2011) and Liverpool-Tasie (2012; 2014) for Zambia, Malawi and
Nigeria respectively). Although these studies have shed some light on the circumstances under which
targeted fertiliser subsidies may promote or suppress private fertiliser markets, they have failed to
examine the effect of non-targeted fertiliser subsidies on farmer participation in commercial markets.
In particular, few studies have empirically taken into account the effect of parallel commercial and
government distribution channels (Xu et al. 2009). This study sought to understand the effect of the
national fertiliser subsidy programme on privately operated fertiliser distribution channels in the
North Rift region of Kenya, one of the country’s grain basket regions that consume approximately
one-half of the country’s subsidised fertiliser. Sections 2 and 3 present the methodology and data
description respectively, while the results, conclusions and recommendations are presented in
sections 4 and 5 respectively.
2. Methodology
2.1 Theoretical framework
This study is anchored on the Agricultural Household Model (AHM). Following Singh et al. (1986),
for any production cycle, the ith household is assumed to maximise a utility function:
𝑈𝑖 = 𝑈𝑖(𝑋𝑎,𝑋𝑚,𝑋𝑙) (1)
where 𝑋𝑎 is an agricultural staple, 𝑋𝑚 is a market-purchased good and 𝑋𝑙 is leisure subject to a cash
income constraint,
𝑝𝑚𝑋𝑚 = 𝑝𝑎(𝑄 − 𝑋𝑎) − 𝑝𝑙(𝐿 − 𝐹) + 𝐸 (2)
AfJARE Vol 11 No 4 December 2016 Makau et al.
294
where 𝑝𝑚 is the price of the market-purchased commodity, 𝑝𝑎 is the price of the staple, 𝑄 is household
production of the staple, (Q-𝑋𝑎) is the marketed surplus, 𝑝𝑙 is market wage, 𝐿 is total labour, 𝐹 is
family labour input (so that, if L-F > 0, then the household hires labour; if L-F < 0, then the household
supplies off-farm labour), and 𝐸 is any non-labour, non-farm income.
The household also faces a time constraint. This is because it cannot allocate more time to leisure,
on-farm production or off-farm employment than the total time available. Therefore,
𝑇 = 𝑋𝑙 + 𝐹 (3)
where T is the total household time. The household also faces a production constraint or production
technology that depicts the relationship between inputs and farm output:
𝑄𝑎 = 𝑄(𝐿, 𝐴, 𝐾) (4)
where 𝐴 is the household’s fixed quantity of land and 𝐾 is its fixed stock of capital. The three
constraints on household behaviour can be collapsed into a single constraint. Substituting the
production constraint into the cash income constraint for 𝑄𝑎 and substituting the time constraint into
the cash income constraint for 𝐹 yields a single constraint:
𝑝𝑚𝑋𝑚 + 𝑝𝑎𝑋𝑎 + 𝑝𝑙𝑋𝑙 = 𝑝𝑙𝑇 + 𝜋 + 𝐸 (5)
where 𝜋 = 𝑝𝑎𝑄(𝐿, 𝐴, 𝐾) − 𝑝𝑙𝐿 is a measure of farm profits. In this equation, the left-hand side shows
total household expenditure on the market-purchased commodity, the household’s purchase of its
own output and the household’s purchase of its own time in the form of leisure. The right-hand side
is a development of Becker’s concept of full income, in which the value of the stock of time owned
by the household is explicitly recorded, as is any labour income (Becker 1965). The extension of the
agricultural household model is the inclusion of a measure of farm profits:
𝑝𝑎𝑄𝑎 − 𝑝𝑙𝐿 (6)
In this case, all labour is valued at the market wage. Equations 1 to 5 reveal that the household can
choose the levels of consumption for an agricultural staple, a market-purchased good and leisure.
Maximising utility subject to the single constraint in equation 5 above yields the following first-order
conditions:
𝜕𝑈 𝜕𝑋𝑚⁄ = 𝜆𝑝𝑚 (7)
𝜕𝑈 𝜕𝑋𝑎⁄ = 𝜆𝑝𝑎 (8)
𝜕𝑈 𝜕𝑋𝑙⁄ = 𝜆𝑝𝑙 (9)
Solving the first-order conditions gives the following input (in this case, fertiliser) demand model:
𝑄𝑝𝑟𝑖𝑣𝑎𝑡𝑒 = 𝑓(𝑄𝑠𝑢𝑏𝑠𝑖𝑑𝑦, 𝑓𝑒𝑟𝑡𝑝𝑟𝑖𝑐, 𝑚𝑎𝑖𝑧𝑒𝑝𝑟𝑖𝑐, 𝐾, 𝐴 𝑍) (10)
where 𝑄𝑝𝑟𝑖𝑣𝑎𝑡𝑒 is the quantity of commercial fertiliser purchased at market price, 𝑄𝑠𝑢𝑏𝑠𝑖𝑑𝑦 is the
quantity of subsidised fertiliser received, 𝑓𝑒𝑟𝑡𝑝𝑟𝑖𝑐 is average price of all commercial inorganic
fertilisers purchased by the household with the exception of foliar feed, 𝑚𝑎𝑖𝑧𝑒𝑝𝑟𝑖𝑐 is the price of

AfJARE Vol 11 No 4 December 2016 Makau et al.
295
output, which in this case is maize, and K, A and Z represent access to credit, land size and household
socioeconomic characteristics respectively that affect the demand for fertiliser.
To estimate the extent to which subsidised fertiliser affects farmers’ demand for commercial fertiliser,
the model in equation 10 can be specified as:
𝑄𝑝𝑟𝑖𝑣𝑎𝑡𝑒𝑖 = 𝛽𝑋𝑖 + 𝛿𝑄𝑠𝑢𝑏𝑠𝑖𝑑𝑦𝑖
+ Ɛ𝑖 (11)
where 𝑄𝑝𝑟𝑖𝑣𝑎𝑡𝑒𝑖 is the amount of fertiliser bought from commercial outlets by the 𝑖𝑡ℎ farmer,
𝑄𝑠𝑢𝑏𝑠𝑖𝑑𝑦𝑖 is the amount of subsidised fertiliser received by the 𝑖𝑡ℎ farmer, Xi is a vector of
explanatory variables that may affect the farmer’s demand for fertiliser from the private sector,
including household demographic and socioeconomic characteristics, 𝛽 and δ are unknown
parameters to be estimated, and Ɛ𝑖 is the error term. Parameter δ estimates the degree to which the
subsidised fertiliser affects the farmer’s demand for commercial fertiliser.
Endogeneity of the quantity of subsidised fertiliser acquired and the corner solution nature of input
demand are the two major problems in estimating the effect of subsidised fertiliser on commercial
fertiliser demand. When a farmer decides not to use fertilisers, as some will, then an observation of
zero fertiliser demanded can be said to be an optimal choice for that farmer, rather than treating it as
unobserved. In addition, the process of vetting for farmers to access subsidised fertiliser is subject to
violations by some local leaders. This is because local leaders determine who is eligible for the
subsidy after farmers report their land sizes and the crops on which they would want to use the
fertiliser. Violation of the vetting process is possible and may be unobserved, and hence could
determine the amount of subsidised fertiliser received. These issues make it impossible to use the
Heckman, LaLonde and Smith models designed for truncation, where the zeros are treated as
unobserved values. Therefore, this study used a double-hurdle model that allows the process that
determines the decision to participate in the private market to be different from that which determines
the extent of participation. A similar approach has been used Ricker-Gilbert et al. (2011) and
Liverpool-Tasie (2014), who estimated the effect of fertiliser subsidy on commercial fertiliser
markets in Malawi and Nigeria respectively.
In order to resolve the problem of endogeneity, this study used farmer’s relationship with the leader
of the subsidy fertiliser vetting committee at the location level as an instrumental variable (IV). There
are several tests for IV strength, including those of Staiger et al. (1997) and Stock and Yogo (2005).
However, non-linear models have no known test for IV strength, hence the test for IV by partial
correlation in the reduced form model (Ricker-Gilbert et al. 2011; Liverpool-Tasie, 2014). A p-value
of 0.001 is evidence of a strong IV. In this study, because households receiving the fertiliser subsidy
have to be vetted by the location-level subsidy fertiliser vetting committee, this was likely to influence
the quantity received. However, it was unlikely that a farmer’s relationship with the leaders of a such
a subsidy fertiliser vetting committee would affect his participation in private fertiliser markets.
Therefore, being related to the leadership of a location-level subsidy fertiliser vetting committee was
consequently excluded from the estimation of equation 10.
For the control function approach and input demand corner solution problems, the study estimated
that:
E(𝑄𝑝𝑟𝑖𝑣𝑎𝑡𝑒|𝑄𝑠𝑢𝑏𝑠𝑖𝑑𝑦, 𝑋𝑖, µ) = 𝐸(𝑄𝑝𝑟𝑖𝑣𝑎𝑡𝑒|𝑄𝑠𝑢𝑏𝑠𝑖𝑑𝑦, 𝑋𝑖, µ) = 𝛷(𝑌𝛽 + µ) (12)
𝑄𝑠𝑢𝑏𝑠𝑖𝑑𝑦 = 𝑋𝜑 + 𝛾 (13)

AfJARE Vol 11 No 4 December 2016 Makau et al.
296
where 𝑄𝑝𝑟𝑖𝑣𝑎𝑡𝑒 and 𝑄𝑠𝑢𝑏𝑠𝑖𝑑𝑦 are as defined above, 𝑌 is a nonlinear function of 𝑄𝑠𝑢𝑏𝑠𝑖𝑑𝑦, and 𝑋𝑖
and µ are excluded factors that may be correlated with 𝑄𝑠𝑢𝑏𝑠𝑖𝑑𝑦. The exclusion means that a subset
of 𝑋, (𝑋𝑖), appears in E(𝑄𝑝𝑟𝑖𝑣𝑎𝑡𝑒|𝑄𝑠𝑢𝑏𝑠𝑖𝑑𝑦, 𝑋, µ).
The control function approach requires an IV that should be uncorrelated with the error term but
correlated with the explanatory variable. This study used farmer’s relationship to the leadership of
the location-level subsidy fertiliser vetting committee as an instrument, since this may influence the
quantity of subsidised fertiliser received.
To assess the factors influencing the amount of subsidised fertiliser received by the ith farmer, a
double-bounded Tobit regression was estimated, following Wooldridge (2008). The generalised
residuals from the regression were constructed as:
𝑔𝑡�̂� = −�̂� 1[𝑄𝑝𝑟𝑖𝑣𝑎𝑡𝑒𝑖 = 0]𝛼(−𝑤𝑖𝛾) + 1[𝑄𝑝𝑟𝑖𝑣𝑎𝑡𝑒𝑖 > 0](𝑄𝑝𝑟𝑖𝑣𝑎𝑡𝑒𝑖 − 𝑤𝑖𝛾) (14)
where 𝛿 and 𝛾 are the Tobit’s maximum likelihood estimates (MLE) and 𝛼 is the inverse Mill’s ratio.
According to Wooldridge (2008), the generalised residuals are used as regressors in the second stage
of analysis, where the double-hurdle model is used.
The first hurdle was the decision to participate in commercial markets or not, while the second hurdle
models the extent of participation. This model assumes that, if the data has zeros, it is because that is
the optimal choice by an economic agent. These zeros are determined by the density f1(. ), such that
(𝑄𝑝𝑟𝑖𝑣𝑎𝑡𝑒𝑖) = 0 = f1(0), and P(𝑄𝑝𝑟𝑖𝑣𝑎𝑡𝑒𝑖) > 0 is determined by 1 − f1(0).
The positive quantities come from the truncated density f2(𝑄𝑝𝑟𝑖𝑣𝑎𝑡𝑒𝑖 |𝑄𝑝𝑟𝑖𝑣𝑎𝑡𝑒𝑖 > 0 =𝑓2(𝑄𝑝𝑟𝑖𝑣𝑎𝑡𝑒𝑖 1 − 𝑓2(0))⁄ , which is multiplied by (𝑄𝑝𝑟𝑖𝑣𝑎𝑡𝑒𝑖) > 0, which is multiplied by
(𝑄𝑝𝑟𝑖𝑣𝑎𝑡𝑒𝑖) > 0 to ensure that total probabilities are equal to one (Wooldridge, 2006). The first hurdle
used the full sample and a probit model was estimated, while in the second hurdle only positive
observations were considered and the study estimated a truncated regression. In both hurdles, the
generalised residuals are included as covariates.
In both hurdles, the average partial effects (APE) were obtained from the margins command in Stata.
The coefficients in the first hurdle were the participation APEs, while those in the second hurdle were
the conditional APEs. The p-values in both hurdles were estimated via bootstrapping at 1 000
repetitions.
3. Data
The data used in this study were collected in a household survey conducted by the Tegemeo Institute
of Agricultural Policy and Development in the North Rift region of Kenya in 2014. The survey
covered two cropping seasons: 2012 to 2013 and 2013 to 2014. The study used a two-stage stratified
cluster sampling technique. In the first stage, 70 rural clusters were selected from the Kenya National
Bureau of Statistics (KNBS) household-based sampling frame (NASSEP V) using the equal
probability selection method (EPSEM). In the second stage, a uniform sample of 20 households in
each cluster was selected from a roster of households in the cluster using the systematic random
sampling method.
During data collection, no allowance was made for the replacement of non-responding households.
Hence, a sample size of 710 households was realised. Table 1 presents a summary of descriptive
statistics of the variables used in the double-hurdle model.

AfJARE Vol 11 No 4 December 2016 Makau et al.
297
Table 1: Descriptive statistics of variables used to assess the effect of the national fertiliser
subsidy on commercial fertiliser market in the North Rift region of Kenya
Variable Mean Standard
deviation Minimum Maximum
Quantity of commercial fertiliser purchased (kilograms) 80.18 3.88 0.00 900
Quantity of subsidised fertiliser received (kilograms) 35.74 4.98 0.00 1500
Male (1/0) 0.82 0.02 0.00 1
Access to credit (1/0) 0.12 0.01 0.00 1
Used improved maize (1/0) 0.97 0.01 0.00 1
Owns a mobile phone (1/0) 0.88 0.01 0.00 1
Owns a bicycle (1/0) 0.18 0.02 0.00 1
Poor household (1/0)1 0.17 0.01 0.00 1
Middle-income household (1/0) 0.50 0.20 0.00 1
Farmer related to leadership of the location-level subsidy
fertiliser vetting committee (1/0) 0.42 0.02 0.00 1
Price of output/90 kg bag 2 580 97.38 758 3 600
Price of fertiliser/kg 73.80 0.51 43.85 150.00
Household size 5.98 0.09 1 14
Years in school 7.65 0.18 0.00 23
Age in years 47.70 0.57 21 94
Land owned (acres) 3.94 0.22 0.00 50.00
Land rented in (acres) 0.42 0.06 0.00 20.00
Distance to the nearest produce market (kilometres) 5.29 0.21 0.01 63.00
Distance to the nearest motorable road (kilometres) 0.55 0.04 0.00 12.00
Distance to the nearest extension service (kilometres) 9.91 0.55 0.01 150.00
Distance to fertiliser seller (kilometres) 8.09 0.31 0.01 60.00
Distance to the nearest NCPB depot (kilometres) 5.07 0.25 0.04 66.00
Distance to the nearest produce market (kilometres) 23.52 0.68 0.99 92.00
Crop income (Kenya shilling) 64 886 5 594 0.00 2 644 677
Total livestock units (TLU)2 1.2 0.03 0.00 4.01
Source: Field survey data
1. Principal component analysis (PCA), which aggregates several assets owned by a household, was used to categorise
the household as either poor or belonging to the middle income grouping (Moser & Felton 2007). 2. Conversion factors used for TLU: cattle = 0.7, sheep = 0.1, goats = 0.1, pigs = 0.2, chicken = 0.01
4. Results and discussion
4.1 Factors influencing the quantity of subsidised fertiliser acquired by households in the North
Rift region of Kenya
Table 2 presents the determinants of the quantity of subsidised fertiliser received by a household. As
shown, being male had a significant effect on the quantity of subsidised fertiliser acquired by the
household. This is consistent with Ricker-Gilbert and Jayne (2009), who found that female-headed
households received less subsidised fertiliser. This is because women farmers in SSA are constrained
by a lack of productive resources and assets, such as low property rights – especially to land. This
gives male-headed households an upper hand when participating in high-investment ventures, which
female-headed households may not do.
Access to credit facilities had a negative but significant effect on the quantity of the subsidised
fertiliser acquired by the household. This was probably because farmers who accessed credit had the
wherewithal to purchase commercial fertiliser from the market. Additionally, the subsidised fertiliser
is often delivered to farmers late, thereby affecting crop performance. Ricker-Gilbert and Jayne
(2009) and Ricker-Gilbert et al. (2011) found in relation to Malawi that a village with an organised
farm credit system received less subsidised fertiliser, while Liverpool-Tasie (2014) found the same
for Nigeria.

AfJARE Vol 11 No 4 December 2016 Makau et al.
298
Table 2: Factors influencing the quantity of subsidised fertiliser received by households in the
North Rift region of Kenya Variables Coefficient† Z-statistic
Male (1/0) 2.84 2.95***
Access to credit (1/0) -2.54 -1.91*
Used improved maize (1/0) 0.71 0.51
Owns a mobile phone (1/0) 0.71 0.61
Owns a bicycle (1/0) -0.49 -0.46
Poor household (1/0) -4.24 -3.24***
Middle-income household (1/0) -3.51 -3.61**
Rich household - -
Farmer related to leadership of the location-level subsidy fertiliser vetting
committee [IV] (1/0) 4.75 3.34***
Price of output/90 kg bag 0.03 0.17
Price of fertiliser/kg
Household size 0.18 1.20
Years in school 0.09 3.07***
Age in years 0.19 2.13**
Land owned (acres) 0.02 1.12
Land rented in (acres) 0.46 1.92*
Distance to the nearest produce market (kilometres) -0.01 -0.13
Distance to the nearest motorable road (kilometres) -0.61 -1.64
Distance to the nearest extension service (kilometres) -0.00 -0.06
Distance to fertiliser seller (kilometres) 0.05 1.35
Distance to the nearest NCPB depot (kilometres) 0.08 0.08
Crop income (Kenya shilling) 7.77 3.10***
Total livestock units -1.10 -2.20**
Source: Field survey data † Coefficients represent average partial effects (APEs)
*, ** and *** represent statistical significance at the 10%, 5% and 1% levels respectively.
Being in poor and middle-income households had a negative but significant effect on the quantity of
subsidised fertiliser acquired by the household. While targeting based on poverty was not the
objective of the national fertiliser subsidy, the significance of poor and middle-income households
receiving smaller quantities of subsidised fertiliser may reflect that the set of farmers that received
subsidised fertiliser included rich households, which increases the displacement effect in the private
market (Liverpool-Tasie, 2014).
The IV had a positive effect on the quantity of subsidised fertiliser received by a household. The
APEs revealed that being in a relationship with the leadership of the fertiliser subsidy vetting
committee increased the quantity of subsidised fertiliser received by 4.8, and this was significant at
1%. This finding highlights the possibility that the vetting process is violated when the committee
identifies subsidy beneficiaries.
Years in schooling of the household head had a positive influence on the quantity of subsidised
fertiliser received by the household. Makhura et al. (2004) found that human capital represented by
the head’s formal education increased the household’s understanding of market dynamics and
therefore improved decisions on market participation. This can be explained by the fact that, as an
individual accesses more education, he/she is empowered with market knowledge that will spur that
individual to participate in the market (Astewel 2010).
The age of the household head had a positive influence on the quantity of subsidised fertiliser acquired
by the household. This finding supports the role of age in resource ownership in a rural setup. Ricker-
Gilbert et al. (2011) found that households with older heads may have strong, long-term networks
with the government officials charged with vetting the beneficiaries of subsidised fertiliser.

AfJARE Vol 11 No 4 December 2016 Makau et al.
299
Rented-in land positively influenced the quantity of subsidised fertiliser received by 0.46 points. This
is evidence that households with access to more land receive significantly more subsidised fertiliser.
Boughton et al. (2007) found that increased access to land enabled farmers to benefit from emerging
market opportunities such as fertiliser subsidy programmes. Ariga and Jayne (2010) found that
households in Kenya that rent land have a higher likelihood of purchasing fertiliser in order to
maximise profit than those who have titled land.
Net crop income was positive and significant at the 5% level. This means that an increase in net crop
income increases the household’s probability of participating in commercial markets. Melesse (2015)
found that if income is invested in farm technology to boost production volumes it may increase the
marketable surplus, thereby increasing households’ market participation in input markets. A plausible
explanation for this effect is that an increase in marketable surplus may translate into increased
household participation in input markets.
As expected, total livestock units (TLU) had a negative but significant effect on the quantity of
subsidised fertiliser acquired by the household. This is because an increase in TLU means more
manure, and therefore households purchase smaller quantities of fertiliser. Minot et al. (2000) found
that each additional animal in Benin reduced the quantity of fertiliser used by 1 kg.
4.2 Determinants of market participation and the extent of participation in commercial
fertiliser markets in the North Rift region of Kenya
4.2.1 Commercial market participation
Table 3 presents the determinants of farmers’ participation in commercial markets. The coefficients
in the first hurdle are the participation APEs, while those in the second hurdle are the conditional
APEs.
The use of improved maize seed increased households’ probability of participating in the commercial
fertiliser market by 0.47 points in the North Rift region. This is indicative of patterns in adoption
behaviour in terms of which farmers adopt improved maize production technologies as a package.
Ouma et al. (2015) found that the use of fertiliser increased the probability of the adoption of
improved maize varieties by 28% in Kenya. Ricker-Gilbert et al. (2013) found that farmers in Malawi
who planted improved varieties of maize used 50 kg more fertiliser than those who did not.
Household ownership of a mobile phone had a positive effect on households’ probability of
participating in fertiliser markets. This is because mobile phone communication provides information
and market linkages that help to lower uncertainties and information asymmetries. Muto and Yamano
(2009) found that mobile phones increased Ugandan households’ probability of participating in
markets as they provide price regardless of distance from the market centres. In this study, owning a
mobile phone increased households’ probability of participating in fertiliser markets by 0.47 points.
Fertiliser price had a negative effect on the probability of the household participating in commercial
fertiliser markets. This is because higher prices hinder households’ participation in fertiliser markets.
It is also an indication that farmers who decide to participate in the commercial fertiliser market pay
attention to input prices. Ricker-Gilbert et al. (2009) and Xu et al. (2009) found that commercial
fertiliser prices had a negative effect on a household’s participation in the private fertiliser market in
Malawi and Zambia respectively.
AfJARE Vol 11 No 4 December 2016 Makau et al.
300
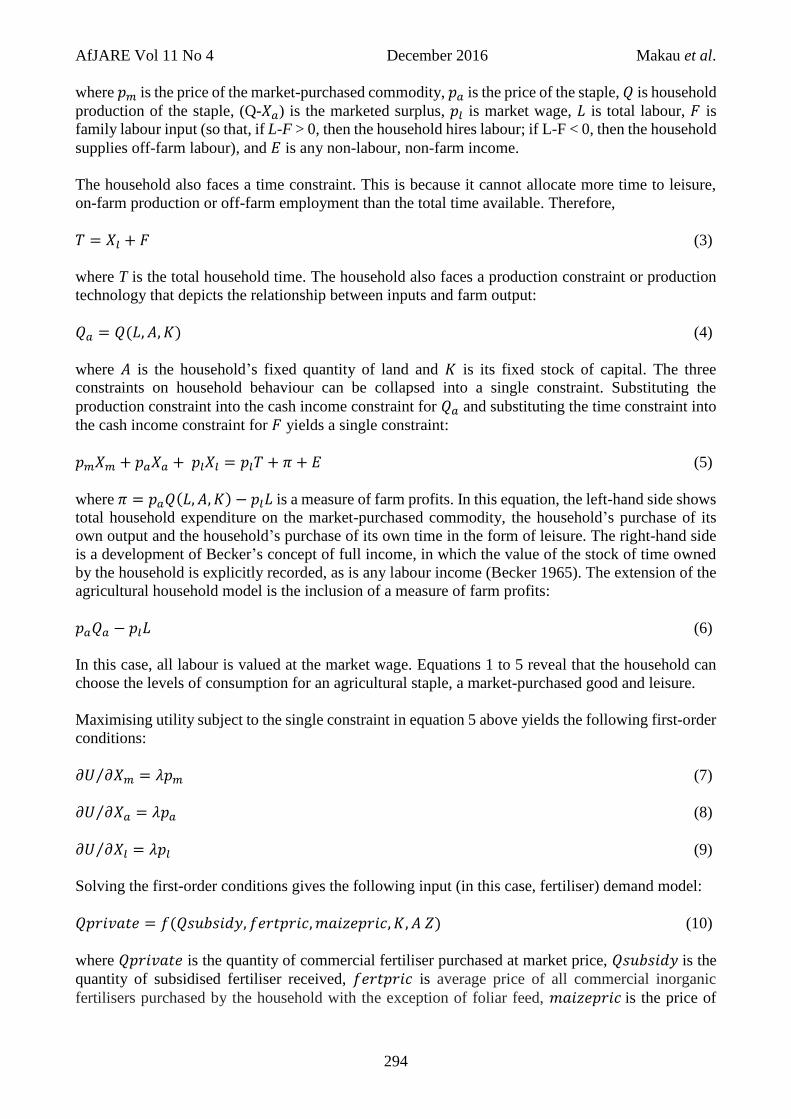
Table 3: Factors influencing farmers’ participation and level of participation in commercial
fertiliser markets in the North Rift region of Kenya
Variable
Hurdle 1† Hurdle 2†
Participation in private
market
Quantity of fertiliser
purchased
Coefficient Z-value Coefficient Z-value
Male (1/0) 0.046 0.693 0.082 0.476
Access to credit (1/0) 0.053 0.722 -0.025 0.843
Used improved maize (1/0) 0.471 0.000*** 0.128 0.362
Owns a mobile phone (1/0) 0.1458 0.000*** 0.592 0.014**
Owns a bicycle (1/0) -0.140 0.286 0.296 0.009**
Poor household (1/0) -0.096 0.542 -0.200 0.126
Middle-income household (1/0) -0.188 0.114 -0.314 0.300
Rich household
Price of output/90 kg bag 0.000 0.192 0.000 0.202
Price of fertiliser/kg -0.007 0.042** -0.023 0.000***
Household size -0 .044 0.025** 0.031 0.087*
Years in school 0.036 0.001*** 0.013 0.216
Age in years -0.003 0.399 -0.000 0.774
Land owned (acres) -0.005 0.558 0.051 0.000***
Land rented in (acres) 0.175 0.004** 0.072 0.019**
Distance to the nearest produce market (kilometres) 0.005 0.472 0.005 0.557
Distance to the nearest motorable road (kilometres) -0.108 0.001*** -0.075 0.046**
Distance to the nearest extension service (kilometres) -0.016 0.001*** -0.003 0.507
Distance to fertiliser seller (kilometres) -0.022 0.000*** 0.004 0.578
Distance to the nearest NCPB depot (kilometres) 0.006 0.000*** 0.005 0.000***
Crop income (Kenya shilling) 1.736 0.030** 1.716 0.000***
Total livestock units -0.032 0.556 -0.202 0.000***
Quantity of subsidised fertiliser acquired (kilograms) -0.291 0.000*** -0.201 0.005***
IMR -0.938 0.062*
Residual 0.167 0.090* 0.482 0.682
Source: Field survey data † Coefficients represent average partial effects (APEs)
*, ** and *** represent statistical significance at the 10%, 5% and 1% levels respectively.
Household size had a negative effect on household decision to participate in commercial fertiliser
markets. This is consistent with previous literature, such as that of Heltberg and Tarp (2001), who
found in Mozambique that the number of people in the household was negatively correlated with
output or input market participation because home consumption increases as households become
larger, and therefore such households are less likely to participate in markets. In the abovementioned
study, a one member increase in household size decreased the household’s probability of participating
in fertiliser markets by 0.04 points.
Years in school of the household head had a positive effect on households’ likelihood of participating
in fertiliser markets. In this study, a one-year increase in years of schooling of the household head
increased the likelihood of a household participating in commercial fertiliser markets by 0.036 points.
The finding is consistent with the findings of Martey et al. (2012) and Lubungu et al. (2012), who
found that formal education is an essential tool for the utilisation of market information dynamics in
Ghana and Zambia respectively.
Distance to the nearest fertiliser sellers and motorable road had a negative and significant effect on
farmers’ participation in commercial fertiliser markets. These findings are consistent with those of
Mukundi (2014), who found that increase in distance to the market was associated with a lower level
of market participation as a result of the increase in marketing costs in Kenya. Ariga and Jayne (2010)
found that households located 10 kilometres away from fertiliser sellers in high-potential areas in
Kenya decreased their probability of participating in fertiliser markets by 0.23 points. In this study,

AfJARE Vol 11 No 4 December 2016 Makau et al.
301
an increase of 10 kilometres to the fertiliser seller decreased the household’s likelihood of
participating in the commercial fertiliser market by 0.22 points.
Nearness to NCPB depot had a positive and significant effect on the probability of a household to
participate in commercial markets. This implies that households living farther away from NCPB
depots are more likely to purchase commercial fertiliser due to the associated transaction and
transport costs in pursuit of subsidised fertiliser. In this study, an increase of 10 kilometres in the
distance to the nearest NCPB depot increased households’ probability of participating in the
commercial fertiliser market by 0.06 points.
The quantity of subsidised fertiliser acquired had a negative but significant effect on farmers’
participation in private fertiliser markets. This implies that the national fertiliser subsidy is
suppressing farmer participation in the commercial fertiliser market, rather than strengthening it. In
this study, 1 kg of subsidised fertiliser was found to decrease households’ probability of participating
in commercial markets by 0.29 points. Ricker-Gilbert et al. (2011) found that 100 kg of subsidised
fertiliser led to a farmer being about 10 percentage points less likely to participate in the commercial
fertiliser market.
4.2.2 Intensity of market participation
The coefficients in the second hurdle in Table 3 show the effect of the selected variables on the
quantity of commercial fertiliser purchased conditional to participation.
Ownership of a mobile phone by the household had a positive effect on households’ quantity of
fertiliser purchased. This is because, as noted earlier, mobile phone communication provides market
information and lower information asymmetries and inefficiencies. Muto and Yamano (2009) found
that mobile phones increased households’ probability of participating in markets, as they provided
price information from the markets centres in Uganda. In this study, owning a mobile phone increased
households’ quantity of fertiliser purchased by 0.6 kg.
Ownership of a bicycle by households had a positive influence on the quantity of commercial fertiliser
purchased. This is because ownership of transport equipment reduces transport costs. This result is
consistent with the findings of Key et al. (2000), who found that ownership of means of transport
lowered the proportional transaction costs, thereby enhancing the intensity of market participation. In
this study, ownership of a bicycle by a household increased the quantity of commercial fertiliser
purchased by 0.3 kg.
As expected, household size had a positive effect on the quantity of commercial fertiliser purchased
by a household. This implies that a large household is more likely to use fertiliser than a small one,
suggesting that fertiliser and family labour are complements in production. The results support the
findings of Deininger and Okidi (1999), who found that large families in Uganda may use fertiliser
to fulfil higher food requirement in cases where the probability of expanding land holding is restricted
by imperfect or missing land markets. Minot et al. (2000) found that each additional family member
raises the quantity of fertiliser used by a household by 0.6 points in Ghana. In this study, each
additional member of a household increased the quantity of fertiliser purchased from commercial
outlets by 0.09 kg.
The size of land owned by a household had a positive effect on the quantity of commercial fertiliser
purchased by a household, as expected. This is because land sizes determine the quantity of inputs
used by a household. The positive relationship between land size and quantity of subsidised fertiliser
implies that wealthier households were more likely to purchase unsubsidised fertiliser than poor
households. These results are consistent with the findings of Liverpool-Tasie (2014) in Nigeria,
namely that larger land holdings indicate a potentially larger quantity of fertiliser needed. Minot et

AfJARE Vol 11 No 4 December 2016 Makau et al.
302
al. (2000) found that each additional hectare is associated with an additional 170 kg of fertiliser on
fertiliser plots in Ghana. In this study, a one hectare increase in size of land owned increased the
quantity of commercial fertiliser acquired by 5 kg, which is a small margin.
Distance to the nearest NCPB depot had a positive effect on the amount of fertiliser purchased by the
household. This implies that, as the distance to the NCPB depot increases, farmers resort to
purchasing fertiliser from commercial markets, which probably are nearer than the NCPB. This is
because the national fertiliser subsidies are distributed via NCPB depots. In this study, a one kilometre
increase in distance to NCPB depot increased the quantity of commercial fertiliser purchased by 0.005
kg. This finding is consistent with Adanikin (2008), who found a positive effect of distance to
fertiliser-selling depots on intensity of the adoption of agricultural technologies in Akure South in
Nigeria.
Total livestock units had a negative effect on quantity of commercial fertiliser acquired by the
household. This is because livestock ownership would mean more manure, hence households are
likely to purchase less commercial fertiliser. In this study, a unit increase in TLU increased the
quantity of commercial fertiliser purchased by household by 0.2 kg. Jaleta et al. (2009) found that, in
Ethiopia, ownership of livestock had a negative effect on households’ participation in the crop and
input markets because it distracted the farmer into an alternative source of income. Minot et al. (2000)
found that each additional animal reduced the quantity of fertiliser used by 1 kg in Benin.
Subsidised fertiliser significantly reduced the quantity of fertiliser purchased from the private
markets. In this study, a 1 kg increase in the quantity of subsidised fertiliser was found to decrease
the quantity of fertiliser purchased from the commercial market by 0.20 kg in the North Rift Valley
region. Ricker-Gilbert and Jayne (2009) found that the fertiliser subsidy in Malawi displaced 0.2 kg
from the private market. Ricker-Gilbert et al. (2011) found that an additional kilogram of subsidised
fertiliser crowded out 0.22 kg of commercial fertiliser.
5. Conclusion and recommendations
In an effort to correct market failures and promote pro-poor agricultural growth, many countries in
sub-Saharan Africa (SSA) are increasingly investing in the distribution of subsidised fertiliser.
However, there are concerns about whether such programmes achieve their intended purpose. In
Kenya, the national fertiliser subsidy programme aims at encouraging fertiliser use, supporting local
fertiliser manufacturers and strengthening fertiliser distribution. This study sought to understand the
effect of this programme on the commercial fertiliser market. A double-hurdle model and control
function approach were used to account for the corner solution nature of fertiliser demand and
endogeneity respectively.
The study found evidence that farmers related to the leadership of location-level subsidy fertiliser
vetting committees received greater amounts of subsidised fertiliser. This means that households’
social networks affected the quantity of subsidised fertiliser received. Furthermore, greater quantities
of subsidised fertiliser went to households with higher land holdings and crop incomes. Using the
rich households as the base category, the poor and middle-income households received 4.2 kg and
3.5 kg disproportionately less subsidised fertiliser respectively. This is an indication that Kenya’s
national fertiliser subsidy does not favour resource-poor households. In addition, the results indicate
that households farther away from produce markets receive less subsidised fertiliser, while those
nearer to a NCPB depot or living further away from the commercial fertiliser sellers receive more
subsidised fertiliser. These results offer evidence that the national fertiliser subsidies do not reach
households in areas with weak infrastructure. The national fertiliser subsidy reduces both the
probability and extent of participation in the private fertiliser market. On average, an additional 1 kg
of fertiliser distributed through the NCPB reduced quantities purchased from the private markets by

AfJARE Vol 11 No 4 December 2016 Makau et al.
303
0.13 kg. This means that, for every ton of subsidised fertiliser distributed by the government, 130 kg
is displaced from the commercial market. This is a clear indication that the national fertiliser subsidy
does not achieve its goal of strengthening the existing fertiliser channels.
Therefore, it is important for the government and policy makers to consider redesigning the current
national fertiliser subsidy programme to involve the private sector in the distribution to minimise
displacement and motivate the stakeholders in the value chain. Once this has been done, proper
administration processes for the distribution of the subsidised fertiliser should be put in place to
ensure that the private sector does not charge commercial prices for the subsidised fertiliser. Although
expensive, if the programme objectives are to be achieved, targeting the beneficiaries is also
recommended to ensure that the households who receive subsidised fertiliser are resource poor.
References
Adanikin FF, 2008. Analysis of factors determining adoption pattern of fertilizer technology among
small scale farmers in Akure South local government area. Unpublished BTech thesis, Ladoke
Akintola University of Technology, Ogbomoso, Nigeria.
Ariga J & Jayne TS, 2010. Factors driving the increase in fertilizer use by smallholder farmers in
Kenya, 1990-2007. In Chuhan-Pole P & Angwafo M (eds.), Yes Africa can: Success stories from
a dynamic continent. Washington DC: The World Bank. Available at
http://siteresources.worldbank.org/AFRICAEXT/Resources/258643-
1271798012256/Kenya_fertilizer_june_2010.pdf (Accessed 15 June 2015).
Astewel T, 2010. Analysis of rice profitability and market chain: The case of Fogera Woreda, South
Gondar Zone, Amhara National Regional State, Ethiopia. MSc thesis, School of Graduate Studies,
Haramaya University, Dire Dawa, Ethiopia.
Becker GS, 1965. A theory of the allocation of time. The Economic Journal 75(299): 493–517.
Boughton D, Mather D, Barrett CB, Benfica R, Danilo A. Tschirley D & Cunguara B, 2007. Market
participation by rural households in a low-income country: An asset-based approach applied to
Mozambique. Department of Agricultural Economics, Michigan State University, East Lansing.
Deininger K & Okidi J, 1999. Capital market access, factor demand, and agricultural development in
rural areas of developing countries: The case of Uganda. Economic Policy Research Centre,
Makerere University, Kampala, Uganda.
Heltberg R & Tarp F, 2001. Agricultural supply response and poverty in Mozambique. Discussion
paper no. 2001/114, World Institute for Development Economics Research (WIDER), United
Nations University, Helsinki, Finland.
International Fertilizer Development Corporation (IFDC), 2012. Kenya fertilizer assessment.
Available at https://ifdcorg.files.wordpress.com/2015/04/kenya-fertilizer-assessment-report-
2012.pdf (Accessed 12 March 2014).
Jaleta M, Gebremedhin B & Hoekstra DA, 2009. Smallholder commercialization: Processes,
determinants and impact. Addis Ababa, Ethiopia: International Livestock Research Institute.
Key N, Sadoulet E & DeJanvry A, 2000. Transactions costs and agricultural household supply
response. American Journal of Agricultural Economics 82(2): 245–59.
Liverpool‐ Tasie LS, 2012. Targeted subsidies and private market participation: An assessment of
fertilizer demand in Nigeria. IFPRI discussion paper No. 1194. International Food Policy Research
Institute (IFPRI), Washington DC.
Liverpool‐ Tasie LS, 2014. Fertilizer subsidies and private market participation: The case of Kano
State, Nigeria. Agricultural Economics 45(6): 663–78.
Lubungu M, Chapoto A & Tembo A, 2012. Smallholder farmers participation in livestock markets:
The case of Zambian farmers. Working paper no. 66, Indaba Agricultural Policy Research
Institute, Lusaka, Zambia.
Makhura MN, Kirsten J & Delgado C, 2004. Transaction costs and smallholder participation in the
maize market in the Northern Province of South Africa. In Friesen DK & Palmer AFE (eds.),

AfJARE Vol 11 No 4 December 2016 Makau et al.
304
Integrated Approaches to Higher Maize Productivity in the New Millennium: Proceedings of the
Seventh Eastern and Southern Africa Regional Maize Conference, 5–11 February 2002, Nairobi,
Kenya. Nairobi: KARI *CIMMYT.
Martey E, Al-Hassan RM & Kuwornu JK, 2012. Commercialization of smallholder agriculture in
Ghana: A tobit regression analysis. African Journal of Agricultural Research 7(14): 2131–41.
Melesse TM, 2015. Agricultural technology adoption and market participation under learning
externality: Impact evaluation on small-scale agriculture from rural Ethiopia. Working paper no.
2015/06, Maastricht School of Management, Maastricht, The Netherlands.
Ministry of Agriculture, Livestock and Fisheries (MoALF), 2014. Subsidy fertilizer distribution
guidelines. Available at http://kenyalaw.org/kenya_gazette/gazette/volume/MTE1NQ--
/Vol.CXVII-No.33 (Accessed 22 April 2014).
Minot N, Kherallah M & Berry P, 2000. Fertilizer market reform and the determinants of fertilizer
use in Benin and Malawi. MSSD discussion paper no. 40. International Food Policy Research
Institute (IFPRI), Washington DC.
Moser C & Felton A, 2007. The construction of the asset index measuring asset accumulation in
Ecuador. CPRC working paper 87, Global Economy and Development, The Brookings Institution
Massachusetts, Washington DC.
Mukundi EN, 2014. Sweet potato marketing among smallholder farmers in Rachuonyo district, Homa
Bay county, Kenya: The role of collective action. Unpublished MSc Thesis, Egerton University,
Njoro, Kenya.
Muto M & Yamano T, 2009. The impact of mobile phone coverage expansion on market
participation: Panel data evidence from Uganda. World Development 37(12): 1887–96.
Ndung’u N, Thugge K & Otieno O, 2009. Unlocking the future potential for Kenya: The Vision 2030.
Paper presented at the CSAE Conference, 22–24 March, Centre for the Study of African
Economies, Oxford.
Ouma J, Bett EK & Mbataru P, 2015. Drivers of adoption of improved maize varieties in moist
transitional zone of Eastern Kenya. Journal of Economics and Sustainable Development 5(25):
147–56.
Ricker-Gilbert J & Jayne TS, 2009. Do fertilizer subsidies affect the demand for commercial
fertilizer? An example from Malawi. Paper delivered at the International Association of
Agricultural Economists Conference, 16–22 August, Beijing, China.
Ricker-Gilbert J, Jayne T & Shively G, 2013. Addressing the “wicked problem” of input subsidy
programs in Africa. Applied Economic Perspectives and Policy 35(2): 322–40.
Ricker-Gilbert J, Jayne, TS & Chirwa E, 2011. Subsidies and crowding out: A double-hurdle model
of fertilizer demand in Malawi. American Journal of Agricultural Economics 93(1): 26–42.
Singh I, Squire L & Strauss J, 1986. Agricultural household models: Extensions, policy and
applications. Baltimore MD: John Hopkins University Press.
Staiger D, Stock JH & Watson MW, 1997. The NAIRU, unemployment and monetary policy. The
Journal of Economic Perspectives 11(1): 33–49.
Stock JH & Yogo M, 2002. Testing for weak instruments in linear IV regression. Technical working
papers no. 284. National Bureau of Economic Research, Cambridge MA.
Takeshima H & Lee HL, 2012. Agricultural inputs subsidy and their developmental impact:
Conventional wisdom. Washington DC: International Food Policy Research Institute (IFPRI).
Wooldridge JM, 2008. Quasi-maximum likelihood estimation and testing for nonlinear models with
endogenous explanatory variables. Department of Economics, Michigan State University, East
Lansing.
Xu Z, Burke WJ, Jayne, TS & Govereh J, 2009. Do input subsidy programs “crowd in” or “crowd
out” commercial market development? Modeling fertilizer demand in a two‐ channel marketing
system. Agricultural Economics 40(1): 79–94.


![2016.09.07 Current challenges pesticide risk assessment · risk assessment = [effect + exposure] assessment Effect and exposure assessment goals are often not defined in a coherent](https://img.dokumen.tips/doc/110x75/5ed2d766efe33375000b2b17/20160907-current-challenges-pesticide-risk-assessment-risk-assessment-effect.jpg)