Embed Size (px)
Citation preview

An interpretation of soil
tests and a method for
assessing nutrient loss
for grazed pastures in
Australia
Making Better Fertiliser Decisions for Grazed Pastures in Australia

Making Better Fertiliser Decisions for Grazed Pastures in Australia
Published by the Victorian Government Department of Primary Industries
© The State of Victoria, Department of Primary Industries, June 2007.
This publication is copyright. No part may be reproduced by any process except in accordance with the provisions of the Copyright Act 1968.Authorised by the Victorian Government1 Spring St, Melbourne, Victoria 3000 AustraliaPrinted by Drouin Commercial Printers
ISBN 978-1-74199-208-3 (hardcopy)ISBN 978-1-74199-143-7 (online)
DisclaimerThis publication may be of assistance to you but the State of Victoria and its employees do not guarantee that the publication is without flaw of any kind or is wholly appropriate for your particular purposes and therefore disclaims all liability for any error, loss or other consequence which may arise from you relying on any information in this publication.

for Grazed Pastures in Australia
Making Better
Fertiliser Decisions
AuthorsCameron J P GourleyAlice R MellandRaquel A Waller Ivor M AwtyAndrew P SmithKen I PeverillMurray C Hannah
For more information contact:Dr Cameron GourleyDepartment of Primary Industries Victoria1301 Hazeldean RoadEllinbank Vic 3821Phone: 03 5624 2222Email: [email protected]
PrefaceFertiliser continues to be a key input for most of Australia’s pasture-based grazing enterprises, with its strong influence on pasture production and profitability. However, excessive fertiliser use or inappropriate application practices can lead to significant nutrient pollution of land, water and air. Producers and their advisors need the best possible information and tools to support better fertiliser decision-making if they are to satisfy the dual goals of profitability and environmental sustainability.
The Better Fertiliser Decisions project (BFD) (2003-2007) was conducted to provide comprehensive information to improve fertiliser decisions for grazing industries. National in scope, the BFD project compiled and interpreted results from pasture-fertiliser experiments and information on nutrient loss processes from all pasture-based grazing regions (Figure 1).
To this end, the BFD project has delivered:
• Soil test – pasture response relationships and critical soil test values for phosphorus (P), potassium (K) and sulfur (S) differentiated at regional, state and national scales, and also by soil characteristics such as soil texture and P buffering index (PBI);
• An interactive database containing all the data submitted on pasture responses to applied nitrogen (N), P, K and S fertiliser;
• The Farm Nutrient Loss Index (FNLI), a decision support tool to assess the risk of nutrient loss from the paddock to the off-farm environment in the format of a user-friendly computer program.
The response relationships are based on a large amount of data collated from an extensive national review of soil test – pasture response experiments conducted over the past 50 years. Sources of this information included peer-reviewed scientific publications, government and industry reports, as well as unpublished data. All experimental data used in the development of the response relationships were standardised and met rigorous quality assurance criteria.
2
18
20
2122
1719
24
23
25
26
16
1415
13
710 8
129
11
2729
28
30
65
43
21
1 South2 Midlands and East Coast3 North East4 North5 North West6 Far North West
7 East Gippsland8 North East9 West Gippsland10 North Central11 Wimmera12 South West
13 South East14 Kangaroo Island15 Lower Murray16 Adelaide Hills
Tasmania
Victoria
South Australia
New South Wales
Queensland
Western Australia
17 South Coastal18 Central and SouthernTablelands19 Southern Slopes and Plains20 North Coastal21 Northern Tablelands22 Northern Slopes and Plains
23 Darling Downs and Burnett24 Coastal South East25 Dry Sub-tropics26 Wet Tropical Coast
27 South Coast28 Great Southern29 South West30 West Midlands

The database serves as a comprehensive resource for information about previous pasture-fertiliser response experiments and provides the capacity to accommodate new data in the future.
The FNLI was developed by collating regionally specific information on nutrient loss processes from scientific publications and existing data, with input from over 90 nutrient management researchers, extension experts and fertiliser company staff. The FNLI uses easily quantifiable inputs such as landscape features, climatic conditions, and pasture and stock management practices to calculate the risk of N and P loss at the paddock scale and evaluate the effects of different management practices.
This booklet presents soil test – pasture response relationships and interpretations for the major P, K and S soil tests used in Australia and a description of the FNLI. The FNLI tool and associated User Manual are included on the accompanying CD. The booklet and information is endorsed by the Fertilizer Industry Federation of Australia, major fertiliser companies in Australia, and Fertcare®, a national accreditation initiative by the Australian fertiliser industry.
3
18
20
2122
1719
24
23
25
26
16
1415
13
710 8
129
11
2729
28
30
65
43
21
1 South2 Midlands and East Coast3 North East4 North5 North West6 Far North West
7 East Gippsland8 North East9 West Gippsland10 North Central11 Wimmera12 South West
13 South East14 Kangaroo Island15 Lower Murray16 Adelaide Hills
Tasmania
Victoria
South Australia
New South Wales
Queensland
Western Australia
17 South Coastal18 Central and SouthernTablelands19 Southern Slopes and Plains20 North Coastal21 Northern Tablelands22 Northern Slopes and Plains
23 Darling Downs and Burnett24 Coastal South East25 Dry Sub-tropics26 Wet Tropical Coast
27 South Coast28 Great Southern29 South West30 West Midlands
Pasture-based grazing regions of Australia, defined by climate, pasture type and irrigation.
Figure 1.
The soil test – pasture response
relationships and FNLI are available via the
Commonwealth Scientific and Industrial
Research Organisation’s (CSIRO) Australian
Soil Resource Information System (ASRIS)
internet site: www.asris.csiro.au

Soil test value
Per
cent
age
of m
axim
um p
astu
re y
ield
95100
Pasture growth notlimited by deficiency
Pasture growthlimited by deficiency
0
A generalised calibration relationship between relative pasture production and soil test value.
Figure 2.
Soil test – pasture response relationshipsSoil test – pasture response calibrations define the relationship between pasture production and soil test value (Figure 2). The relationship allows users to predict the pasture production response if the soil nutrient level is altered by the addition of fertiliser.
Researchers from the pasture-based grazing industries of Australia provided experimental results to develop the newly defined pasture response relationships. Over 3,000 experimental years of research results were compiled, some dating back 50 years, including in excess of 250 experiments involving approximately 1,600 field sites, and more than 48,000 individual pasture yield measures.
Experiments had to meet certain design, data collection and quality criteria to be included in the analysis. This included a zero application (control) and high application treatment of P, K or S.
Only experiments that used the following Australian soil tests: Olsen and Colwell P; Colwell, Skene and exchangeable K; and CPC and KCl-40 S, were analysed, as there were insufficient data to analyse less commonly used tests. It was not possible to develop soil test – pasture response relationships for N as there is no reliable soil test for N. Soil test sample depth was standardised to 10 cm.
Soil test – pasture response relationships were prepared, where possible, for P, K and S, nationally and differentiated by state, region, soil texture, PBI and cation exchange capacity categories. The lack of quality data regarding pasture species, pasture composition, and grazing enterprise meant that soil test – pasture response relationships could not be differentiated by these factors.
The response relationships were compared and statistically significant differences identified. Where no statistical differences occurred, data were pooled to increase the precision of the final response relationship. The pooled national data set provides superior soil test – pasture response relationships for each nutrient. These response relationships are relevant across all grazing regions and livestock enterprises.
4

Soil test value
Per
cent
age
of m
axim
um p
astu
re y
ield
95100
Pasture growth notlimited by deficiency
Pasture growthlimited by deficiency
0
5
How the response relationships were developedPasture production data (kg dry matter/ha) were standardised to percentage yield to allow comparison of differences in pasture productivity between locations, seasons and climatic conditions. For each field experiment, the ‘percentage of maximum pasture yield’ was calculated from the zero and high nutrient treatments based on the following equation:
Percentage maximum pasture yield and initial soil test value for each experiment were then used to define soil test – pasture response relationships. These response relationships can be used to determine the likely pasture response at any particular soil test value. Response relationships were specified to have a zero yield at zero soil test value, and to reach maximum potential yield (100%) at a very high soil test value.
Critical soil test valueA ‘critical soil test value’ is the soil test value where 95% of maximum pasture production occurs (Figure 2). These values were established from the soil test – pasture response relationships. The 95% critical soil test value is a simple, commonly used reference point to define where further applications of nutrients are unlikely to markedly increase pasture production. The confidence interval around the critical value indicates the reliability of the estimate.
Soil testing is used to assess the amount of plant available nutrients in the soil.
As soil test level increases, the additional pasture yield resulting from fertiliser applications becomes smaller.
Soil test – pasture response relationships are based on experiments that measure pasture response to fertiliser over a broad range of soil test values.
Percentage ofmaximum yield
=Maximum pasture yield when
non-limiting nutrient is applied
Pasture yield withno nutrient applied x 100
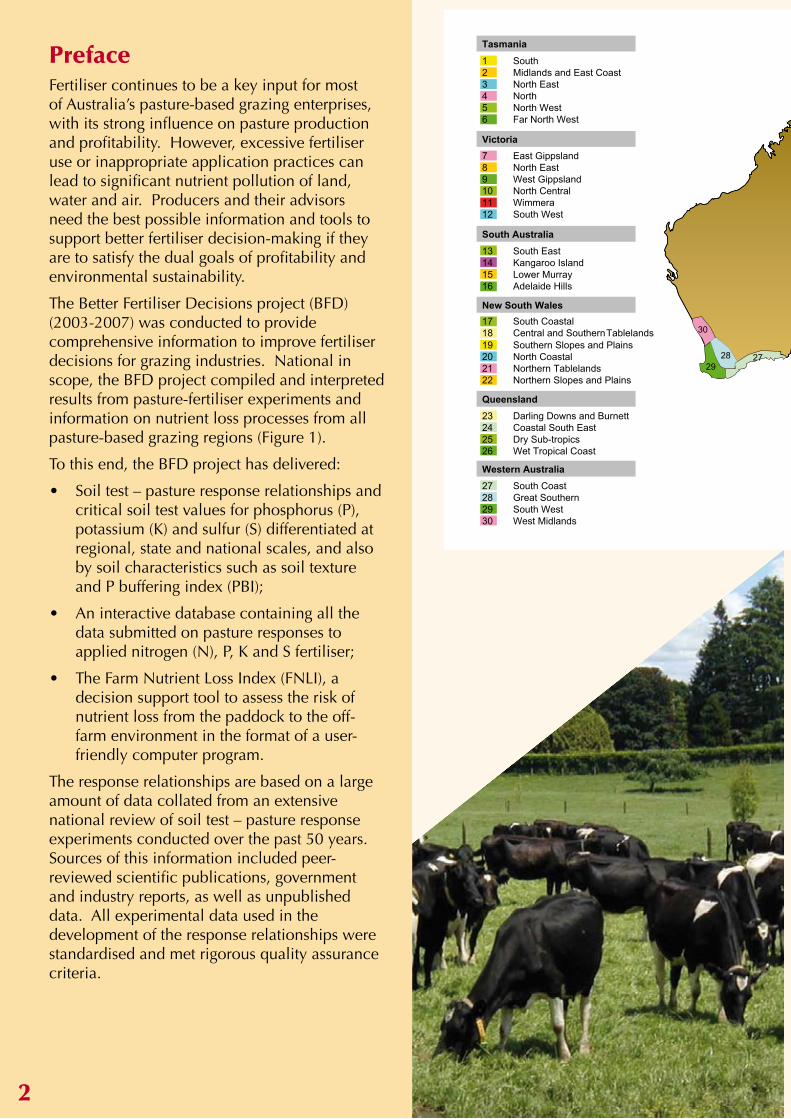
PhosphorusThe bicarbonate extraction procedure of Olsen (Olsen P test), and the further modification by Colwell (Colwell P test) are the two most commonly used P soil tests in Australia. These tests differ in the ratio of soil and extracting solution, and duration of agitation, which affects the release of soil-bound ‘fixed’ P. Hence, the Colwell P test extracts more fixed P than the Olsen P test. As a result it is well recognised that Colwell P tests need to be interpreted in association with an estimate of the soil’s P fixing capacity. While soil texture or other measures have long been used as surrogates for soil P fixing capacity, the recently developed phosphorus buffering index (PBI) is now the national standard for estimating soil P fixing capacity.
Olsen PhosphorusThere were no statistically significant differences between the Olsen P soil test – pasture response relationships when experimental data was differentiated according to state, region, soil texture and PBI categories. Therefore the relationship based on the entire national Olsen P dataset (Figure 3) is recommended to guide fertiliser decisions (Table 1).
Table 1.The critical Olsen P soil test value and equation describing the relationship between Olsen P soil test value and percentage of maximum pasture yield, derived from the national data set.
The relationship between percentage of maximum pasture yield and Olsen P soil test value from nationally collated experiments. The critical Olsen P soil test value at 95% of pasture production is indicated by the dashed line.
Critical value1
Confidence interval2
Number of experiments
Equation3
% maximum yield =15 14 - 17 303 100 × (1 – e 0.202 × Olsen P)
1 Soil test value (mg/kg) at 95% of predicted maximum pasture yield.2 95% chance that this range covers the critical soil test value.3 e = Euler’s constant (approx 2.71828).
Olsen P soil test interpretation should be based on the national collation of experimental data, and not differentiated by soil texture, PBI category, state or regional subsets.
The critical Olsen P soil test value to achieve 95% of maximum pasture production is 15 mg P/kg.
6
Olsen P soil test value (mg P/kg soil)
Per
cent
age
of m
axim
um p
astu
re y
ield
10 15 20 30 40
40
60
80
100
ClayClay loam
Sandy clay loamSandy loam
Sand
95
Figure 3.

Colwell PhosphorusThe Colwell P soil test – pasture response relationship showed significant dependence on PBI, but there were no significant differences between the response relationships when differentiated by state, region or soil texture.
Twelve PBI classes with equal numbers of experimental data were used to derive soil test value – pasture response relationships for Colwell P. The resultant critical Colwell P values and corresponding PBI values were plotted and an equation was derived (Figure 4). This equation enables the critical Colwell P value to be calculated when the PBI of a soil is known. The equation has been used to calculate critical Colwell P values for commonly used PBI categories (Table 2).
Table 2.Predicted critical Colwell P soil test values for standard PBI categories, derived from the national data set.
1 Critical Colwell P value (mg/kg) at the mid-point of PBI category. Values in parenthesis are critical Colwell P values at the lowest and highest PBI values within the category. 2 Insufficient data to derive a response relationship.
Colwell P soil test interpretation should be based on the soil PBI value, as the critical value increases with increasing PBI.
The critical Colwell P value to achieve 95% of maximum pasture production can be estimated from the soil’s PBI category (Table 2) or calculated from the PBI value using the equation (Figure 4).
The relationship between critical Colwell P value and soil P buffering index. The critical Colwell P value is the soil test value predicted to produce 95% of
maximum pasture yield.PBI category Critical value for mid point of
PBI category (range)1
<15 Extremely low 23 (20 – 24)15-35 Very very low 26 (24 – 27)36-70 Very low 29 (27 – 31)
71-140 Low 34 (31 – 36)141-280 Moderate 40 (36 – 44)281-840 High 55 (44 – 64)
>840 Very high n/a2
7
0 100 200 300 400 500 600
30
40
50
60
Phosphorus buffering index
Col
wel
l P c
ritic
al s
oil t
est v
alue
(mg
P/k
g so
il)
= 19.6 +1.1 x PBI0.55Colwell P criticalsoil test value
Figure 4.

PotassiumThe commonly used Colwell, Skene and exchangeable K soil tests are strongly correlated to one another and therefore the national K soil test data were standardised to Colwell K values.
There were no statistical differences in the Colwell K – pasture response relationships when the data were differentiated according to state, region and cation exchange capacity class. However, the Colwell K – pasture response relationship did show significant dependence on soil texture class.
The national data were differentiated into five soil texture classes based on clay percentage to derive Colwell K – pasture response relationships and critical Colwell K values. Figure 5 shows the Colwell K – pasture response relationships for four soil texture classes. There were insufficient data to define a response relationship for the clay texture class. The critical Colwell K values and the equations which describe these relationships are provided in Table 3
Table 3.The critical Colwell K soil test values for four soil texture classes and the equations describing the relationship between Colwell K soil test value and percentage of maximum pasture yield, derived from the national data set.
The relationship between percentage of maximum pasture yield and Colwell K soil test value for four soil texture classes. The critical Colwell K soil test values at 95% of pasture production are indicated by the dashed lines.
Soil texture Critical value1
Confidence interval2
Number of experiments
Equation3
% maximum yield =Sand 126 109-142 50 100 × (1 – e -0.024 × Colwell K)
Sandy loam 139 126-157 122 100 × (1 – e -0.022 × Colwell K)Sandy clay loam 143 127-173 75 100 × (1 – e -0.021 × Colwell K)
Clay loam 161 151-182 194 100 × (1 – e -0.019 × Colwell K)
1 Soil test value (mg/kg) at 95% of predicted maximum pasture yield.2 95% chance that this range covers the critical soil test value.3 e = Euler’s constant (approx 2.71828).
Colwell K soil test interpretation should be based on soil texture, as the critical value increases with increasing clay content.
The critical Colwell K value to achieve 95% of maximum pasture production for each soil texture class is indicated in Table 3.
8
Colwell K soil test value (mg K/kg soil)
Per
cent
age
of m
axim
um p
astu
re y
ield Sand
20406080
100120
20406080
100120
Sandy loam
100 200 300 400 500 100 200 300 400 500
Sandy clay loam Clay loam
Figure 5.

The relationship between percentage of maximum pasture yield and soil test value for CPC S and KCl-40 S tests, derived from the national data set. The critical
S soil test values at 95% of pasture production are indicated by the dashed lines.
Figure 6.
SulfurDue to the historical widespread use of superphosphate, which has generally provided adequate S for plant growth, there have been fewer S experiments conducted compared with P or K. The two main soil S tests used in Australia are CPC (calcium phosphate plus charcoal) and KCl-40 (potassium chloride heated to 40°C for 3 h). The two S tests are not correlated and therefore experimental data could not be pooled.
The use of each S soil test tended to be regionally specific, and most S experiments were conducted on clay loam or sandy loam soils. Therefore there were insufficient data available to investigate whether soil S test – pasture production response relationships differed between soil texture, states or regions.
The S soil test – pasture response relationships for CPC S and KCl-40 S, derived from the national data set, are presented separately (Figure 6 and Table 4).
Table 4.The critical CPC S and KCl-40 S soil test values and equations describing the relationship between CPC S and KCl-40 S soil test value and percentage of maximum pasture yield, derived from the national data set.
Sulfur soil test interpretation should be based on the national relationships developed for the CPC S and KCl-40 S tests.
The critical value to achieve 95% of maximum pasture production for the CPC S soil test is 3 mg/kg, and for the KCl-40 S soil test is 8 mg/kg.
Sulfur test Critical value1
Confidence interval2
Number of experiments
State3 Equation4
% maximum yield =CPC 3 2-4 94 Vic, NSW, Qld 100 × (1 – e -1.014 × CPC S)
KCI-40 8 6-10 37 NSW, SA 100 × (1 – e -0.388 × KCl-40 S)
1 Soil test value (mg/kg) at 95% of predicted maximum pasture yield.2 95% chance that this range covers the critical soil test value.3 Calibration data largely came from the first state indicated for each S test.4 e = Euler’s constant (approx 2.71828).
9
CPC S (mg S/kg soil)
Per
cent
age
of m
axim
um p
astu
re y
ield
53 810 15
20
40
60
8095
100
KCl-40 S (mg S/kg soil)5 10 15

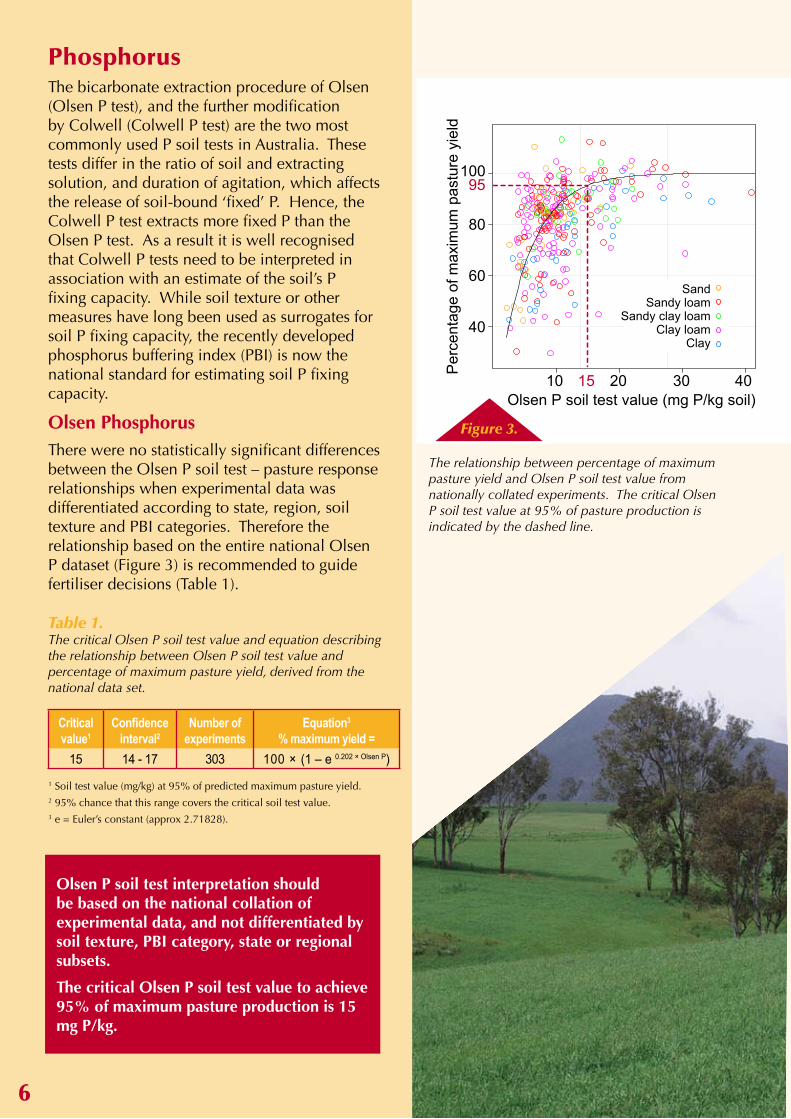
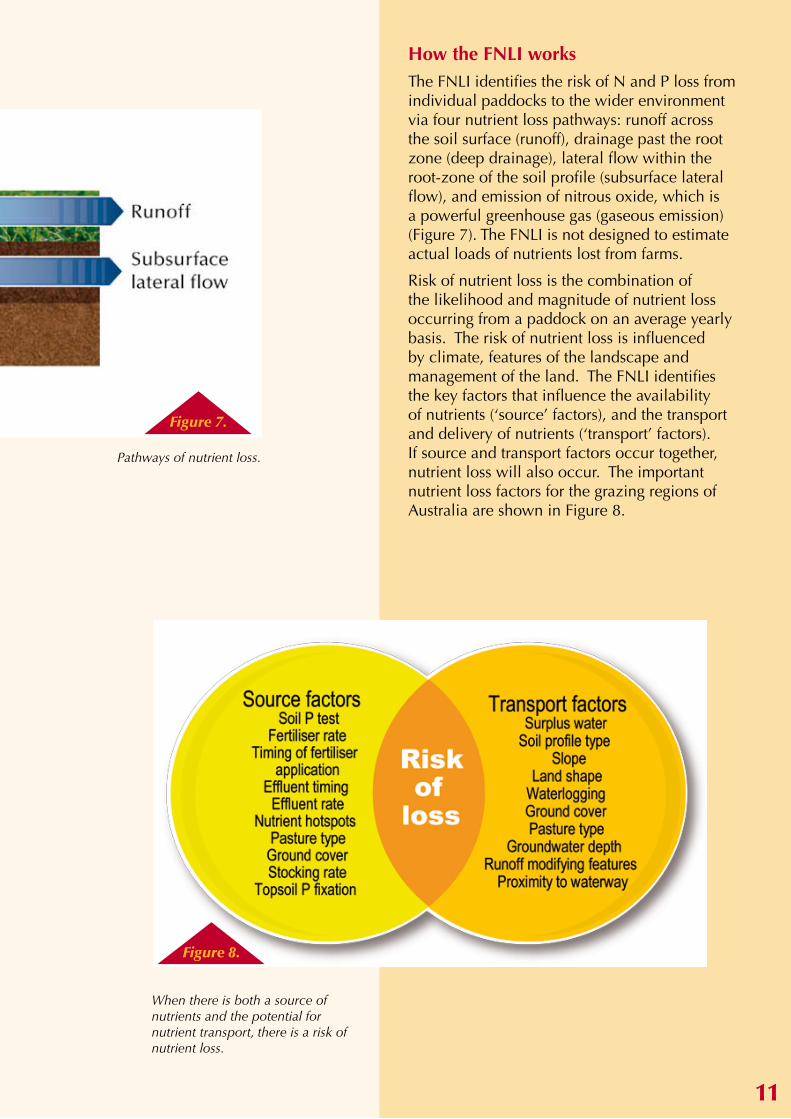
Pathways of nutrient loss.
Nutrient loss from farms to the environmentNutrient loss from farms to the off-farm environment can be costly, cause degradation of waterways and groundwater, and also add to greenhouse gases. The grazing and fertiliser industries in Australia identified a need for a simple and practical tool to help farm advisors identify nutrient loss issues within individual farms.
Understanding the principles of nutrient loss is an important component of integrated nutrient management. The Farm Nutrient Loss Index (FNLI) computer program was developed for nutrient management advisors to use in conjunction with soil fertility testing and nutrient budgeting when giving advice about how to maximise nutrient use efficiency, and minimise negative environmental impacts. The FNLI can also be used to demonstrate the principles of N and P loss from pasture-based grazing systems to the wider environment.
Over 90 nutrient management researchers, extension staff and fertiliser company representatives were consulted in the development of the FNLI. A participatory workshop approach was used to harness regionally-specific scientific knowledge of nutrient loss processes. Focus group meetings and field assessments were conducted to provide technical review and to develop the utility of the FNLI for existing nutrient management advisory services. The FNLI risk outcomes were validated against measured nutrient loss data from 17 field experiments across Australia.
The FNLI User Manual provides supplementary information on how to use the FNLI software, how the FNLI calculates risks, and the scientific principles of nutrient loss that underpin the Index. The FNLI software and User Manual are provided on the CD in this booklet and are available from: www.asris.csiro.au
10
Pathways of nutrient loss.
Figure 7.
How the FNLI worksThe FNLI identifies the risk of N and P loss from individual paddocks to the wider environment via four nutrient loss pathways: runoff across the soil surface (runoff), drainage past the root zone (deep drainage), lateral flow within the root-zone of the soil profile (subsurface lateral flow), and emission of nitrous oxide, which is a powerful greenhouse gas (gaseous emission) (Figure 7). The FNLI is not designed to estimate actual loads of nutrients lost from farms.
Risk of nutrient loss is the combination of the likelihood and magnitude of nutrient loss occurring from a paddock on an average yearly basis. The risk of nutrient loss is influenced by climate, features of the landscape and management of the land. The FNLI identifies the key factors that influence the availability of nutrients (‘source’ factors), and the transport and delivery of nutrients (‘transport’ factors). If source and transport factors occur together, nutrient loss will also occur. The important nutrient loss factors for the grazing regions of Australia are shown in Figure 8.
11
When there is both a source of nutrients and the potential for nutrient transport, there is a risk of nutrient loss.
Figure 8.

12
Farm Nutrient Loss Index ReportFarm InformationFarm name Jones Paddock South 5 State Victoria Enterprise type DairyRegion West Gippsland
Nutrient Loss Pathway Risk Ranking Reasons for high or very high risksP in runoff High Fertiliser timing, Land shape, Surplus waterP in subsurface lateral flow High Fertiliser timing, Surplus waterP in deep drainage MediumN in runoff High Fertiliser timing, Land shape, Surplus waterN in subsurface lateral flow LowN in deep drainage High Fertiliser timing, Surplus water, WatertableN gaseous emission Medium
Land CharacteristicsSlope Hilly 6 - 15%Land shape Converging hillslopeWaterlogged area 1 - 10% Runoff Modifying features No features presentProximity to nearest waterway (m) 40Soil profile type Moderate infiltration but poor drainageGround water < 1.5 m Topsoil P fixation (PBI) > 280 Surplus water score (1,2,4 or 8) 8
Nutrient ManagementP test OlsenSoil P (mg P/kg soil) 16 - 25 Fertiliser P rate (kg P/ha) 25 - 59 annuallyFertiliser N rate (kg N/ha) 30 - 60 per application, 100-250 total per yearHotspots Low < 5% Timing of fertiliser application Apply when high runoff or drainage risk Effluent applied NoEffluent rate -Effluent timing -
Pasture ManagementStocking rate MediumPasture type Shallow rooted perennialsGroundcover (%) 90Irrigation NoFa
rm N
utrie
nt L
oss
Inde
xPa
dd
ock
Rep
ort
To use the FNLI computer program, a series of questions about the paddock of interest need to be answered. Users select the options that best match their paddock characteristics and management. The questions can be readily answered from farm records and observation. For each paddock assessed, the FNLI identifies factors that pose a significant risk of nutrient loss and calculates a risk ranking of N and P loss (low, medium, high or very high) for each loss pathway. A paddock report containing the risk results and inputs can be generated (Figure 9).
The FNLI prepares a report for each paddock showing the input factors, risk rankings and the factors
contributing to high or very high risk outcomes.
Figure 9.

Interpreting FNLI resultsHigh or very high risk rankings indicate that aspects of the grazing system may need to be modified to minimise potential nutrient loss. Where a high or very high risk ranking is indicated, the main contributing factors are listed. These factors are intrinsic features of the landscape, such as surplus water and soil type, or imposed by management, such as stocking rate. Alternative management practices can be tested to check strategies aimed at lowering the risk of nutrient loss.
Since the potential for nutrient loss depends on a combination of characteristics specific to each paddock or land management unit, the appropriate management for each paddock can vary. For example, Paddock A and B both have a very high soil fertility (Figure 10), but have a different risk of nutrient loss because paddock B has a surface drain. The FNLI can help land managers identify the risks of nutrient loss on different parts of their farms, and explore nutrient management options which can minimise nutrient losses.
13
The combinations of transport and source factors across a farm influence the nutrient loss risk.
Figure 10.
Soil P value affectsthe availability of P(source factor)
Risk of P loss in runoff
BB
A AOlsen P (mg/kg) P lossLowMediumHighVery high
B
A
Drainage lines (dashed blue lines) affect the amount ofrunoff (transport factor)
Soil P value affectsthe availability of P(source factor)
Risk of P loss in runoff
BB
A AOlsen P (mg/kg) P lossLowMediumHighVery high
B
A
Drainage lines (dashed blue lines) affect the amount ofrunoff (transport factor)
Soil P value affectsthe availability of P(source factor)
Risk of P loss in runoff
BB
A AOlsen P (mg/kg) P lossLowMediumHighVery high
B
A
Drainage lines (dashed blue lines) affect the amount ofrunoff (transport factor)
Soil P value affectsthe availability of P(source factor)
Risk of P loss in runoff
BB
A AOlsen P (mg/kg) P lossLowMediumHighVery high
B
A
Drainage lines (dashed blue lines) affect the amount ofrunoff (transport factor)
Soil P value affectsthe availability of P(source factor)
Risk of P loss in runoff
BB
A AOlsen P (mg/kg) P lossLowMediumHighVery high
B
A
Drainage lines (dashed blue lines) affect the amount ofrunoff (transport factor)
Soil P value affectsthe availability of P(source factor)
Risk of P loss in runoff
BB
A AOlsen P (mg/kg) P lossLowMediumHighVery high
B
A
Drainage lines (dashed blue lines) affect the amount ofrunoff (transport factor)

SummaryThe BFD project has equipped the Australian grazing and fertiliser industries with refined recommended soil test levels for P, K and S. Jointly, the development of a national nutrient-loss decision support tool (FNLI) enables users to assess the risks of P and N loss, at the paddock and farm scale. This package of new soil test interpretations and the FNLI will assist farm advisors and producers in choosing appropriate soil fertility levels and management practices to improve profitability and environmental outcomes.
14
15
AcknowledgementsThe BFD project team would like to thank the National Network, the Project Steering Committee and the Implementation Committee, for their on-going participation at workshops and meetings, and their enthusiastic and constructive contributions throughout the project.
We would like to acknowledge Professor Jim Scott, Jim Cook and Dion Gallagher from the University of New England, Relational Database Unit for developing the relational database. The development of the national soil test database and subsequent analysis would not have been possible without the considerable efforts of numerous scientists, technical staff and fertiliser company employees from across Australia, who identified and delivered experimental datasets to the BFD project team.
The BFD team would also like to acknowledge the specialist input from participants at the Regional Technical Workshops on nutrient losses from pasture-based grazing land, particularly Scott McDonald, Barrie Bradshaw, Graeme Ward and Fiona Robertson (DPI Victoria) for providing internal review of the FNLI products, Wei Wang (Monash University) for the FNLI software development, Ian Tarbotton (Dexcel, New Zealand) for helping to develop the expert workshop processes and Hemayet Hossain (DPI Victoria) and Ray Wyatt (The University of Melbourne) for their advice on using the Analytical Hierarchy Process. Thanks also to Sally Sceney and Paul Strickland (DPI Victoria) for communications and administration support.
A n I n i t i a t i v e o f t h e N a t u r a l H e r i t a g e T r u s t
National Land & Water Resources Audit

A national network of nutrient management researchers, extension specialists and fertiliser industry respresentatives provided data and knowledge to the Better Fertiliser Decisions project.
16

The Farm Nutrient Loss Index and Better Fertiliser Decisions results can be downloaded from: www.asris.csiro.au
This CD contains: the Farm Nutrient Loss Index software
the Farm Nutrient Loss Index User Manual
the Farm Nutrient Loss Index Paddock Record Sheet
How to install the FNLI The CD will automatically open a menu page if your operating system allows.
Otherwise select ‘StartupScreen.pdf’ from your CD drive.
Follow the prompts to install the FNLI.
To start the program, select the FNLI icon from your desktop.
•
•
•
17
FNLI

A n I n i t i a t i v e o f t h e N a t u r a l H e r i t a g e T r u s t
National Land & Water Resources Audit