Embed Size (px)
Citation preview

Development of tuna fisheries in the Pacific ACP countries (DEVFISH) Project
AN ASSESSMENT OF RECREATIONAL
FISHERY DEVELOPMENT OPTIONS
February, 2009
A report by Brad Gentner, Gentner Consulting Group

Recreational Fishery Development Options February, 2009 _____________________________________________________________________
ii
Table of Contents Executive Summary ..................................................................................................... iii Introduction....................................................................................................................1 Evaluation Methodology................................................................................................1 Hawaii Metrics...............................................................................................................3
Background on the Hawaii Fishery............................................................................4 Hawaiian Angler Expenditures ..................................................................................4 Charter Enterprise Metrics.........................................................................................7 Hawaii Discussion .....................................................................................................9
Tonga Metrics ..............................................................................................................10 Vanuatu Metrics...........................................................................................................15 Comparison Across Sectors .........................................................................................17 Discussion....................................................................................................................18 References....................................................................................................................20 Persons Contacted........................................................................................................21 Appendix A: Terms of Reference ................................................................................22 Currency conversions Currency Unit = United States Dollar (US$): US$1.00 = VUV$109.9989 Conversion provided by FFA = TOP$2.157 Conversions as of February 24, 2009

Recreational Fishery Development Options February, 2009 _____________________________________________________________________
iii
Executive Summary
• Acknowledgements The author would like to acknowledge the contribution
of Peter Philipson in constructing this document. Mr. Philipson supplied the set of tools used in previous studies (Philipson 2006, 2007) so that the calculation of the metrics presented here would be consistent. Additionally Mr. Philipson collected the enterprise data for Vanuatu. The author would also like to thank the charter captains from Tonga and Vanuatu that provided the data for his enterprise
• Study objective This study recognizes that nations wish to develop fishery resources and wish to do so in a way that is sustainable while maximizing the economic return to local communities. This study seeks to add to previous studies examining industrial longlining and purse seining through an examination of recreational fishing, particularly charter fishing, in the region. A full analysis also requires an examination of tourist expenditures. Unfortunately budget limitations precluded the conduct of a tourist survey.
• Evaluation methodology
To achieve the study objective, detailed operational, marketing and financial data was obtained from a small number of firms in Tonga and Vanuatu. This data was used to construct a series of metrics useful for comparing different business types. Due to budget limitations, only four enterprises could be contacted. Also due to budget limitations, it was impossible to conduct tourist surveys. As a result, tourist expenditure data collected in 2006 in Hawaii was used to provide additional information on tourist fishing in a similar island location.
• Evaluation results It is impossible to denominate charter fishing metrics by tonnes of tuna for a number of reasons including lack of harvest data by enterprise; recreational trips being multi-purpose in nature; and recreational catch and release behavior. Instead, metrics are denominated by boat by trip. The analysis shows that charter fishing businesses are legitimate businesses producing good returns for their owners. These businesses can and do indeed provide and significant economic returns to local communities.
• Comparison to other fishery sectors
Because the charter fishing metrics cannot be denominated by tonnes of harvested tuna as in previous studies, it is difficult to make comparisons with industrial fisheries metric denominated on a tonnes of tuna basis. With no data on the total or potential charter fishing effort it is impossible to make comparisons based on a total economic impact basis either. Where comparable to other industrial fisheries metrics, they

Recreational Fishery Development Options February, 2009 _____________________________________________________________________
iv
compare quite favorably in terms of value added ratios and internal rates of return.
• Discussion and recommendations
Barriers to the expansion of tourism fishing exist in each nation examined. Charter fishing is a legitimate business that earns significant returns to the owners and produces significant economic activity in local communities. Charter fishing represents a sustainable way to develop tuna resources that generates local economic activity. Charter fishing, as well as other non-fishing but water based tourism activities, rely on abundant and healthy stocks of tuna and other protected species that can be bycatch in industrial fisheries. As a result, development of tourism fishing and industrial fishing concurrently may be mutually exclusive. A full feasibility study would need to be conducted for each nation in order to make recommendations regarding the ability of each nation to increase tourism fishing activities and address current barriers.

Recreational Fishery Development Options February, 2009 _____________________________________________________________________
1
Introduction The purpose of this study is to extend the analysis of tuna fishery development options to tourism fishing. Specifically, this report will examine the economic benefits accruing to local economies from charter businesses in Tonga and Vanuatu. Because of limited data collection budgets and limited time, a tourist survey could not be conducted. To address this shortfall a case study from Hawaii is included to potentially fill in the gaps for tourists fishermen and to provide a comparison from a region where tourism data is collected more frequently and consistently. Previous efforts have focused on developing longline and purse seine fisheries for tuna (Philipson 2006 and 2007). Oceania offers excellent sportfishing opportunities for tunas, other pelagics, reef fish, and inshore species. Oceania also contains world class diving, whale watching, and other ocean based recreational activities. Across Oceania there are several well developed tourist fisheries. One such fishery is Vanuatu which has a reputation for world class billfish and pelagic fishing. Tonga, further behind Vanuatu in its growth as a fishing tourism destination, is also considered a world class billfish destination. Generally, the businesses in Hawaii, Tonga, and Vanuatu represent legitimate business providing significant returns for their owners and producing significant local economic activity. This is contrary to popularly held notions that charter fishing businesses are run by hobbyists that charter trips to cover personal ownership costs. Tourism businesses in general typically provide high value added ratios as they are labor intensives and not capital intensive. This report begins with a description of the evaluation methodology followed by the Hawaiian case study. The Hawaiian case study is followed by the local case studies for Tonga and Vanuatu. These case studies are followed by comparisons between nations as well as limited comparisons to the previous studies. Finally, potential policy implications are discussed.
Evaluation Methodology This report relies on the methodologies developed in two previous studies both by Philipson (2006; 2007). This series seeks to develop a set of evaluation criteria across three industries that utilize tuna stocks in the region including industrial longline fishing, industrial purse seine fishing, and for-hire recreational fishing providers. This report focuses on developing these evaluation criteria across the for-hire service providers across selected island nations. Across Oceania, there is no universal list of recreational anglers and no list of for-hire recreational fishing businesses. Due to budget constraints, it was impossible to develop such a list for statistical sampling purposes. Instead, selected enterprises were contacted to provide the enterprise level data needed to estimate a series of economic metrics for use in the industry comparisons. Attempts were made to contact as many enterprises across the three island nations selected as possible. These enterprises voluntarily provided their data to the author or to employees of the DEVFISH organization. In cases were multiple firms provided their data, the estimation of the evaluation criteria reflect an average across the firms supplying the data. In other cases, single firms provided the data.

Recreational Fishery Development Options February, 2009 _____________________________________________________________________
2
The averaged data was then entered in to Excel spreadsheet models developed by Philipson (2006, 2007) and augmented and adapted by this author. Because little is know about for-hire recreational fisheries, recent data from Hawaii was used to augment these models. Because of the small sample sizes across these island nations, the data presented here is commercially sensitive. The evaluation criteria developed by Philipson (2006, 2007) are divided into two groups including primary and secondary criteria. As taken directly from Philipson (2006), the primary criteria1 include:
• Value added - Value added is an economic term to express the difference between the value of goods and the cost of materials or supplies used in producing them [intermediate costs]. Value added is thus defined as the gross sales of a firm minus the cost of goods and services purchased from other firms.
• Net local purchases – This is a measure of the local purchases made by the entities analyzed, reduced by an amount representing an estimate of the off-shore content of the products or services purchased.
• Employment earnings - This measure includes expatriates resident in the country and employed by the enterprise, for example Fijian crew on a Cook Island longliner. This is on the basis that the operational model offers these jobs on the local market, although they may not be taken up.
• Balance of payments - This is a composite made up of export sales, reduced by the imported content of local purchases (for example fuel) and direct imports and off shore services (bait, marketing commissions). Any local sales made by the enterprise are treated as an addition to balance of payments on the basis of import substitution.
• EBIDTA (profit) - Earnings before Interest, Depreciation, Taxes and Amortization (EBIDTA) is a measure of the surplus cash generated operationally by an enterprise. It is useful metric to use when comparing results within an industry sector, as is the case in this study, as it eliminates from income measures the expenses of interest, depreciation and amortization which can vary widely between companies as a result of different accounting policies adopted.
The secondary criteria include: • Value added ratio (%) – as defined above, but expressed as a percentage
of sales. • Government revenue- This measure attempts to capture all government
revenue streams that result from the operational model under examination. Indirect government revenue is not included.
• Jobs per trip - as defined above, but expressed on a per trip basis. • IRR (%) – Internal rate of return is the rate of return on the capital that is
invested in the project. This analysis suffers from many of the same challenges as the commercial sectors analyzed in Philipson (2006 and 2007). That is there are no estimates of total recreational
1 These criteria are discussed fully in Appendix B of Philipson (2006). The reader is directed to that publication for full definitions of these criteria.

Recreational Fishery Development Options February, 2009 _____________________________________________________________________
3
effort (number of trips), total recreational harvest, total recreational catch, nor total recreational participation (number of anglers, number of for-hire recreational enterprises). In the commercial case, this made it necessary to denominate all metrics by tonnes of tuna since it was impossible to generate these metrics in total for every sector examined. It is impossible to denominate economic metrics in this report by tonnes of tuna landed, as done in previous reports, for a number of reasons. First, there are no existing catch estimates for the recreational sector. When collecting data from the enterprises, only one operator was able to produce a log of all catch (includes harvested and released fish) and all harvested fish. Second, fishing trips are taken for multiple purposes including harvest of other species besides tunas and the adventure of taking an offshore trip. Tunas are caught during the course of a targeted tuna trip, are caught as bycatch during trolling for other pelagic species, and are caught to use as bait for targeting other pelagic and reef species. Even when specifically targeting tuna, it is possible that other species will be caught, making it difficult to divorce tuna values from other values. Finally, denominating by tuna harvest ignores the contribution to local economies of catch and release fishing and zero catch trips. Catch and release fishing is a growing trend with many anglers spending vast sums to catch and release fish. While catch and release fishing does cause mortality, it provides a growing amount of economic value that can’t be denominated by tonnes of tuna harvested. As a result, the metrics in this report will be estimated for an average enterprise and for an average trip. The analysis of the Hawaii fishery, provided here for context, has been taken from the existing literature on sportfishing in Hawaii and an economic impact analysis conducted specifically for this report. The analysis of the Tongan fishery was conducted using personal interviews conducted at the 5th World Recreational Fishing Conference held in Dania Beach, Florida, in the United States during October 2008 and additional follow-up contacts conducted via email. The Vanuatu section of this report is based on fieldwork conducted by the DEVFISH staff during the period of January 12 – January 16, 2009. Data principally pertain to the 2008 calendar year, with the exception of Hawaii, which is in 2006 dollars.
Hawaii Metrics While enterprise or angler data for Oceania is sparse and difficult to obtain, Hawaii’s recreational fishery has been studied extensively. Hawaii also has a ready made economic impact model available including a purpose built model for use in examining the economic impacts of recreational fishing (Gentner and Steinback, 2008). In many ways, Hawaii is similar to many nations in Oceania. Hawaii is made up of a group of islands just outside the boundaries of Oceania. As such, Hawaii must import most of the goods and many of the services used in day to day life, making its economy more like the economies found in Oceania than any mainland economy. Additionally, Hawaii’s economy is dependent on tourism while having a strong commercial fishing industry. Because Hawaii’s recreational fishery has been studied extensively and is at least superficially similar, recreational fishing for pelagic species in Hawaii will be explored in this section. Below, the metrics introduced earlier in this report will be developed for Hawaii charter boats. Additionally, because data on tourist expenditures could not be collected for this effort, tourist fishing expenditures will be included below. Due to the complexities and potential inappropriateness of using tonnes of harvested tuna to

Recreational Fishery Development Options February, 2009 _____________________________________________________________________
4
denominate these recreational metrics as in other reports, these metrics will be developed at the enterprise level, for each charter trip, and across all trips taken in Hawaii in 2006.
Background on the Hawaii Fishery Two types of fishing are of interest here; charter fishing by non-resident tourists and fishing recreationally from private boats. Both activities are very popular in Hawaii with over 2.7 million fishing trip taken in Hawaii in 2006 (Gentner and Steinback, 2008). Of those trips, 569,812 trips were taken by private boat anglers and 33,034 (Hamilton and Huffman, 1997) trips were taken on charter boats. The remaining trips were taken in the shore fishing mode. Very few tourists participate in the shore fishery. The estimate of private boat trips above includes trips targeting all species. While the majority of private boat trips target pelagic species, NMFS does not produce estimates of effort directed at pelagic species. Recreational fishing in Hawaii is very important economically with anglers spending over $755 million on trip and durable expenditures in 2006 (Gentner and Steinback, 2008). This level of expenditures generated $380.6 million in value added, $253.6 million in income, supported 7,000 jobs, and generated $105.0 million in government revenue in 2006. Because recreational fishing is such an important part of the Hawaiian economy and major part of fishing mortality, Hawaii participates in the Marine Recreational Fishing Statistical Survey (MRFSS). However, because of the nature of the MRFSS in Hawaii, the survey is not currently able to estimate effort in the charter mode. As a result, all estimates of charter effort are taken from Hamilton and Huffman (1997).
Hawaiian Angler Expenditures This section of the report will describe the nature of charter participants and their expenditures. The data presented here comes from a number of sources including Hamilton and Huffman (1997), O’Malley and Glazier (2001), and Gentner and Steinback (2008). The charter patron expenditure data in particular uses the Gentner and Steinback data to run custom estimates of expenditures and impacts for those charter trips that targeted pelagic species. Estimation techniques follow those described in Gentner and Steinback (2008). Charter fishing in Hawaii has been a popular activity since the early 1900’s. Hawaiian charter patrons are primarily white, educated, middle class males from the American mainland (O’Malley and Glazier, 2001). In fact, 84% of all charter patrons are from the American mainland while 7% are from Japan, 3% from Canada, 3% from Hawaii, and 2% from Europe. The majority of the anglers are in their mid 40’s. Most patrons did not come to Hawaii to participate in sportfishing, but came to Hawaii on vacation and included sportfishing as one recreational activity on their vacation (O’Malley and Glazier, 2001). The majority of tourist anglers feel that the most important trip attribute is their relationship and experience with the captain and crew rather than the catch experience. Additionally, 61% of patrons prefer tag and release fishing only, while an additional 25% release most of the fish they catch retaining only trophies or harvesting under special circumstances.

Recreational Fishery Development Options February, 2009 _____________________________________________________________________
5
Some of the release ethic is driven by the nature of the Hawaii charter industry. For most boats, the catch belongs to the boat, and, if the patron wants to keep more than the equivalent of a meal’s worth of fish, the patron must purchase the remainder of the fish they caught from the captain. Also, unlike other sportfishing destinations such as Alaska and San Diego, California, Hawaiian charters do not provide fish processing and shipping services for their patrons. As a result, it is very difficult for a charter patron to deal with a large fish because they have no where to store it while still in Hawaii and no way to process or ship the harvested fish back home. Charter patron expenditures are detailed in Table 1. The methodology in Gentner and Steinback involved producing per person per day expenditures and those estimates are reported in the first column of Table 1. Column two details what the vacationing party’s total expenditures were including days when they were not fishing and column three details the expenditure attributable to only the days spent fishing. The economic impacts in the following columns are based on column three that contains the expenditures attributable to just the fishing portion of their trip. O’Malley and Glazier (2001) also estimated per person per day charter expenditures and those estimates compare favorably to the estimates presented here when adjusted for inflation using the consumer price index. However, the similarity ends there. In the O’Malley and Glazier (2001) study, their respondents had a mean trip length of 11 days with a range of 3-65 days. This was longer than the 9.15 day average visitor stay from the Hawaiian annual visitor survey (DBEDT, 2007). The 2006 National Marine Fisheries Service (NMFS) survey used in Gentner and Steinback (2008) estimated that charter participants only spent four days on average in Hawaii. The estimates from Gentner and Steinback (2008) were used to develop the estimates in Table 1. O’Malley and Glazier (2001) estimated that each party contained three adults and two children for a total of five people traveling together. Gentner and Steinback (2008) estimated that four people traveled together on their trip to Hawaii and only three in the party participated in the fishing portion of the vacation. Hawaiian charter anglers generally spend $3,112 dollars for every day spent fishing when all support activities are included. The most expensive part of their trip is airfare at $958.69 for the whole fishing party followed closely by guide fees at $913.43. Overall, charter fishing in Hawaii generates $102.8 million in expenditures across the charter sector and all the sectors that support a tourist angler’s visit. This level of expenditures supports 989 jobs in Hawaii, generates $53.2 million in value added, and generates $14.3 million in government revenue. These expenditures and impact estimates include the impacts attributable to the charter enterprises, which will be addressed in more detail below.

Recreational Fishery Development Options February, 2009 _____________________________________________________________________
6
Table 1. Charter Patron Expenditures, 2006.
Expenditure Category Expenditure per Person
per Day Trip Total Fishing
Portion Value Added
Government Revenue
Jobs Supported
PRIVATE TRANSPORTATION $40.00 $40.00 $10.39 $5.38 $1.44 0.0001AUTO RENTAL $36.00 $138.60 $36.00 $18.64 $5.00 0.0003GROCERY FOOD $70.07 $1,168.13 $205.31 $106.30 $28.52 0.0020RESTAURANT FOOD $115.24 $1,921.08 $337.65 $174.81 $46.91 0.0032LODGING $158.57 $2,643.47 $464.61 $240.55 $64.55 0.0045PUBLIC TRANSPORTATION $327.20 $1,416.76 $958.69 $496.34 $133.19 0.0092GUIDE FEES $311.75 $913.43 $913.43 $472.91 $126.90 0.0088ICE $4.00 $11.72 $11.72 $6.07 $1.63 0.0001FISHING TACKLE $9.00 $26.37 $26.37 $13.65 $3.66 0.0003GIFTS & SOUVENIRS $50.56 $194.64 $148.13 $76.69 $20.58 0.0014TOTAL PER TRIP $1,122.38 $8,474.18 $3,112.29 $1,611.33 $432.40 0.0299TOTAL ALL TRIPS $102,811,441 $53,228,838 $14,283,768 989

Recreational Fishery Development Options February, 2009 _____________________________________________________________________
7
Table 2 contains the expenditures and economic impacts of private boat anglers in Hawaii. Again, these estimates were derived using the methods described in Gentner and Steinback (2008), but estimated for only those private boat trips targeting pelagic species. Again, expenditures were estimated per person per day and those estimates are included in column one. Those estimates are expanded to boat trips in a similar fashion as the charter estimates above. On average, slightly more than two people fished together in each boat trip Private boat trips targeting pelagic species generated $78.8 million in angler expenditures. On average, private boat anglers spend $138 per person to take a fishing trip with boat fuel dominating their expenditures at $50.83/trip/person. The second highest expenditure is for fishing tackle used on the trip at $18.91/trip/person but that is followed closely by ice expenditures of $18.66/person/per trip. Ice is particularly important for Hawaiian fishermen as they are allowed to sell their catch and will do so if they catch a high valued tuna. Only well handled tuna achieve high prices and appropriate chilling is an important part of harvested fish care. No accounting has been made in this analysis for private boat fish sales. These expenditures generate $40.8 million in value added, generate $10.9 million in government revenue, and support 758 jobs.
Charter Enterprise Metrics The majority of the information presented below is adapted from Hamilton and Huffman (1997). All cost and revenue information is presented in 2006 dollars using the consumer price index to inflate the values from 1997. In 1997, there were 199 vessels taking 166 trips per year on average. On average, these vessels also took 12 personal recreational trips and 15 commercial fishing trips for a total of 193 trips per year. In Hamilton and Huffman’s (1997) study, they divided the charter enterprises into three different categories; owner operated (44%), absent but active owner (36%), and absent and not active owner (21%). Typically, the owner operators and the absent but active owners should be classified as businesses with profit as their motive. However, there is an interesting phenomenon that has arisen in Hawaii due to the relative shortage of dock space. Commercial interests get preference in all state owned and operated marinas. To be classified as a commercial user, a vessel owner must show at least $15,000 in annual revenue. Many absent owners provide charter trips in order to obtain the commercial slip preference. In actuality, this happens infrequently, but is an issue. The metrics presented here are averaged across all ownership types. Charter businesses would produce higher profitability and return estimates if the absent and not active owners were removed from the analysis. The majority of vessels in the Hawaii charter fishery are relatively large (greater than 35 feet in length) vessels that require a slip. Recently, however, there has been growth in the small trailer based charter boat sector. This sector is still relatively small and is not well accepted in the slip based charter community.

Recreational Fishery Development Options February, 2009 _____________________________________________________________________
8
Table 2. Private Boat Trip Expenditures.
Expenditure Category Expenditure per Person
per Day
Trip Total Value Added Government
Revenue Jobs
Supported
PRIVATE TRANSPORTATION $11.99 $28.31 $14.66 $3.93 0.0003AUTO RENTAL $0.32 $0.76 $0.40 $0.11 0.0000GROCERY FOOD $16.39 $38.68 $20.03 $5.37 0.0004RESTAURANT FOOD $3.84 $9.07 $4.69 $1.26 0.0001LODGING $0.96 $2.26 $1.17 $0.31 0.0000PUBLIC TRANSPORTATION $3.03 $7.15 $3.70 $0.99 0.0001BOAT FUEL $50.83 $119.96 $62.11 $16.67 0.0012BOAT RENTAL $0.43 $1.01 $0.52 $0.14 0.0000FISH PROCESSING $0.65 $1.53 $0.79 $0.21 0.0000BAIT $4.65 $10.98 $5.69 $1.53 0.0001ICE $18.66 $44.05 $22.81 $6.12 0.0004FISHING TACKLE $18.91 $44.62 $23.10 $6.20 0.0004TOURNAMENT FEES $6.77 $15.97 $8.27 $2.22 0.0002PARKING $0.33 $0.77 $0.40 $0.11 0.0000GIFTS & SOUVENIRS $0.48 $1.13 $0.58 $0.16 0.0000TOTAL PER TRIP $138.24 $326.25 $168.91 $45.33 0.0031TOTAL ALL TRIPS $78,771,055 $40,782,346 $10,943,797 758
Recreational Fishery Development Options February, 2009 _____________________________________________________________________
9
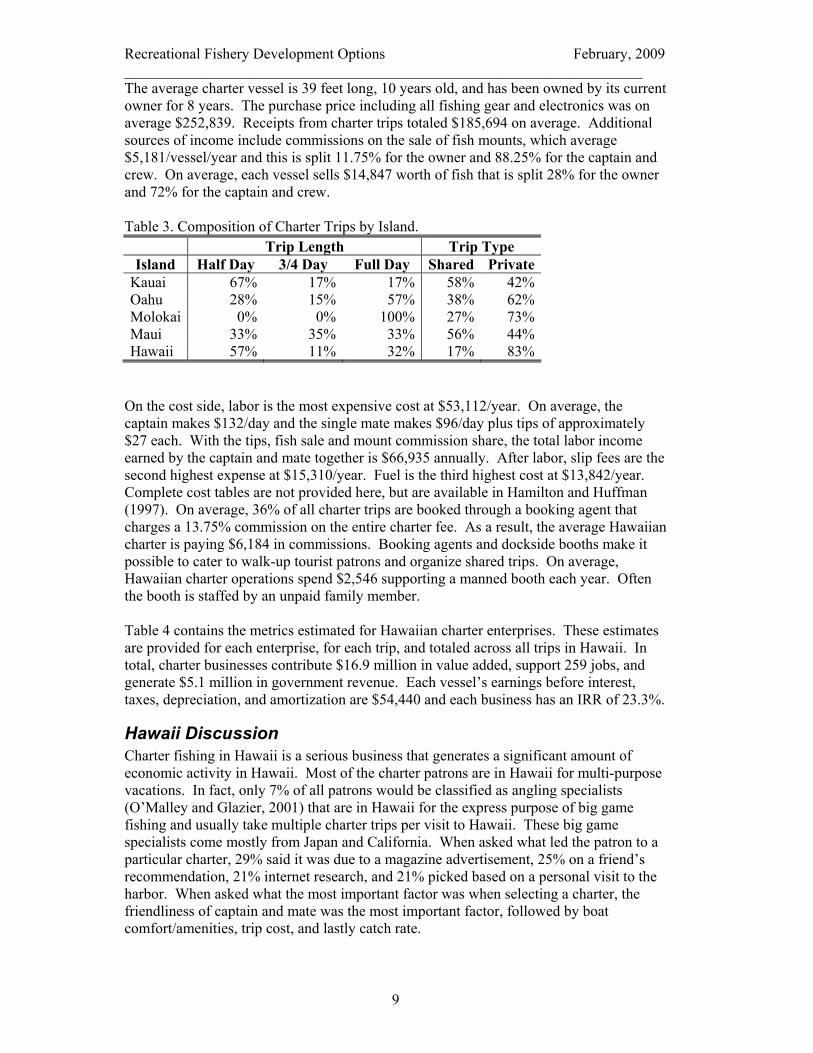
The average charter vessel is 39 feet long, 10 years old, and has been owned by its current owner for 8 years. The purchase price including all fishing gear and electronics was on average $252,839. Receipts from charter trips totaled $185,694 on average. Additional sources of income include commissions on the sale of fish mounts, which average $5,181/vessel/year and this is split 11.75% for the owner and 88.25% for the captain and crew. On average, each vessel sells $14,847 worth of fish that is split 28% for the owner and 72% for the captain and crew. Table 3. Composition of Charter Trips by Island. Trip Length Trip Type Island Half Day 3/4 Day Full Day Shared Private
Kauai 67% 17% 17% 58% 42%Oahu 28% 15% 57% 38% 62%Molokai 0% 0% 100% 27% 73%Maui 33% 35% 33% 56% 44%Hawaii 57% 11% 32% 17% 83%
On the cost side, labor is the most expensive cost at $53,112/year. On average, the captain makes $132/day and the single mate makes $96/day plus tips of approximately $27 each. With the tips, fish sale and mount commission share, the total labor income earned by the captain and mate together is $66,935 annually. After labor, slip fees are the second highest expense at $15,310/year. Fuel is the third highest cost at $13,842/year. Complete cost tables are not provided here, but are available in Hamilton and Huffman (1997). On average, 36% of all charter trips are booked through a booking agent that charges a 13.75% commission on the entire charter fee. As a result, the average Hawaiian charter is paying $6,184 in commissions. Booking agents and dockside booths make it possible to cater to walk-up tourist patrons and organize shared trips. On average, Hawaiian charter operations spend $2,546 supporting a manned booth each year. Often the booth is staffed by an unpaid family member. Table 4 contains the metrics estimated for Hawaiian charter enterprises. These estimates are provided for each enterprise, for each trip, and totaled across all trips in Hawaii. In total, charter businesses contribute $16.9 million in value added, support 259 jobs, and generate $5.1 million in government revenue. Each vessel’s earnings before interest, taxes, depreciation, and amortization are $54,440 and each business has an IRR of 23.3%.
Hawaii Discussion Charter fishing in Hawaii is a serious business that generates a significant amount of economic activity in Hawaii. Most of the charter patrons are in Hawaii for multi-purpose vacations. In fact, only 7% of all patrons would be classified as angling specialists (O’Malley and Glazier, 2001) that are in Hawaii for the express purpose of big game fishing and usually take multiple charter trips per visit to Hawaii. These big game specialists come mostly from Japan and California. When asked what led the patron to a particular charter, 29% said it was due to a magazine advertisement, 25% on a friend’s recommendation, 21% internet research, and 21% picked based on a personal visit to the harbor. When asked what the most important factor was when selecting a charter, the friendliness of captain and mate was the most important factor, followed by boat comfort/amenities, trip cost, and lastly catch rate.

Recreational Fishery Development Options February, 2009 _____________________________________________________________________
10
Table 4. Charter Enterprise Metrics. Metric Type Per Enterprise Per Trip Total All Trips Value Added for Only Charter Firms $84,806 $511 $16,876,394 Value Added Including Support Industries n/a $1,611 $53,228,838 Net Local Purchases $63,601 $383 $12,656,690 Employment Earnings $66,935 $403 $13,320,069 Balance of Payments $149,964 $903 $29,842,783 EBITDA $54,440 $328 $10,833,471 Government Revenue $25,799 $155 $5,133,970 Charter Sector Jobs 2 0.0078 259 Jobs Across All Tourist Support Industries 0.0299 989 Value Added Ratio 45.7% IRR 23.3%
This suggests that a staffed booth and/or booking agent is a very important tool for selling charter trips as this market is dominated by choices potentially made after arriving in Hawaii. It then follows that charter business should focus their marketing on hotel activity desks, sporting good and souvenir stores, hotel concierges, booking booths, and local magazine adds. It would also help to develop an internet presence, advertising in American mainland magazines, and being the featured guide in television shows for US or Japanese markets. Charter businesses would be well served to focus on providing a friendly crew with good humor and a willingness to teach patrons about fishing and the general ocean environment (O’Malley and Glazier, 2001). These anglers are more concerned about having an adventure with a fun and knowledgeable crew than they are about catching fish. However, traveling to distant places to fish is growing in popularity in the US and pelagic fishing is only one of many types of fishing attracting attention. Both reef fishing and light tackle inshore fishing for bonefish and species like giant trevally are on the rise. This class of adventure angler is less concerned about infrastructure than more casual tourists might be. They are more concerned with adventure, fishing quality, and/or variety with adequate infrastructure at a reasonable price. If increasing fishing tourism is a development focus for Oceania, it should focus both on attracting more casual tourists and attracting specialized angling tourist. Regardless of the type of fishing offered, inshore, reef fishing, or pelagic fishing, the revenue and economic impact profile would be very similar to that found in Hawaii.
Tonga Metrics Much less is known about Tongan fisheries than those in Hawaii. Tonga is surrounded by pristine waters that have garnered international acclaim as a top diving, sailing, whale watching, and sportfishing destination. On the sport fishing side, Tonga presents a rare opportunity to catch as many as five species of billfish year round. As far as Tonga’s economy is concerned, the single largest source of hard currency in the country is remittances from Tongans living abroad, followed by tourism. In 2004, over 41,000 tourists visited Tonga. Tonga’s tourism potential is high but its tourism is currently underdeveloped. Tonga’s offshore tuna resources are likewise under utilized

Recreational Fishery Development Options February, 2009 _____________________________________________________________________
11
and there are current plans to expand the skipjack fishery making this analysis particularly timely. Currently, there are five charters in operation in Tonga. Three of these boats do not sell any of their catch, but the other two do sell catch. Only one enterprise was contacted for this effort. The charter operation contacted does not sell catch, and, as such, the metrics below do not contain any revenue from the sale of fish. Most of these charter operations operate only six months out of the year during the peak season of June through December. The charter operator contacted took 60 paid fishing charters per year, far fewer than the 166 days/year for Hawaiian charter boats. Tourism is very depressed in the off season and it is not viable to remain fully operational as operating costs are prohibitive. Most lodges must generate their own power at a cost of $2,000 plus per month of operation. That cost alone makes opening in slower months prohibitive. Total diesel bill for 6 months, including power generation, was over $30,000 for the operation interviewed for this effort, including power generation for the lodge facility. Tonga hosts two international tournaments each year: the National Billfish and Tuna Tournament and the Tuna Fest Tournament. Both tournaments are tag and release tournaments. All current charter operators practice tag and release for all billfish species and this ethic has carried over into the private boaters as well. Several operators also have a policy of no fish sales as well. The boat profiled here only retains enough fish to feed the guests while staying at the lodge. All boats that tag fish utilize the New Zealand tagging program’s tags. The profiled operator provided their annual catch information including 60 charter trips and 19 personal recreational trips, and that data is presented in Table 5. His average charter trip is 9 hours long and his average recreational trip is 4 hours long. Of the charter trips, he targeted billfish 88% of the time, yellowfin 6%, mahi-mahi 2%, and dogtooth tuna 4% of the time. Client wishes drive the targeting decision with most clients wanting to target billfish first. If the clients book a second trip or if the billfish action is slow, they switch to other pelagic species. He tags and releases 85.5% of all billfish caught, only keeping dead fish, line class records or the occasional tournament fish. Weights for released fish are estimated. Looking at Table 5, this captain harvests all tunas except small yellowfin, suggesting catch and release fishing may not be very prevalent for tuna. Across all species, this captain caught 9.8mt and released 6.8mt of fish. Across tunas, he caught 1.6mt and harvested 1.6mt. This operator utilizes a 31 foot sportfishing boat utilizing twin diesel engines with a combine horsepower larger than 600. In addition to operating a charter boat, this firm also operates a lodge providing complete fishing packages including charter fishing, rooms, food, and beverages. Enterprise level cost and return data from the 2008 fishing season was collected for this firm. The replacement value of the boat is approximately $285,000 and the replacement cost of the lodge is $715,000. The lodge is situated on 5 acres directly on the a private sand beach with excellent snorkeling and swimming. Lodging consists of individual cabins. All transfers are by boat from the local airport. The lodge sells 161 unit nights through the season implying an average of 2.63 nights per

Recreational Fishery Development Options February, 2009 _____________________________________________________________________
12
every charter boat trip. As a result, the metrics are calculated for the charter business, the lodge business, and for the entire operation. Table 5. Catch composition for one charter boat in Tonga.
Released Harvested Species Number Weight
(avg./fish)Number Weight
(avg./fish) Blue marlin 60 91.11kg 6 91.11kg Sailfish 7 29.23kg 2 29.23kg Striped marlin 1 81kg 1 81kg Yellowfin tuna 13 3kg 68 17.65kg Bigeye tuna 0 4 10.5kg Albacore tuna 0 1 18kg Skipjack tuna (bait) 0 41 2.5kg Dogtooth tuna 0 11 15kg Kawakawa (bait) 0 18 1.5kg Wahoo 0 16 13.6kg Mahi-mahi 8 4kg 49 11kg Whaler sharks 11 70kg Oceanic white tip shark 3 55kg Hammerhead shark 1 60kg
Table 6 contains the metrics for the charter boat business. Total revenue, not shown in the table, was $85,000, or a little less than $1,400/trip. Annual value added for the charter boat portion of the business was $43,555 per season and $714 per trip. This translated in to a value added ration of 51.24%. Because of the need to import almost all inputs, the net local purchases annually are $5,585 or $190 per trip. Annual employment earnings were $3,200 and the firm employed two crew for each trip. The balance of payments for the year was $53,350 and $875/trip. EBITDA was $44,085 annually and $723 per trip. Government revenue was $3,730 in 2008 and $61/trip. Finally, IRR for the charter business was 11.4%. The captain/owner does not draw a salary, but was instead paid out of the profits of the business. Table 6. Tongan Boat Metrics.
Metric Type Enterprise Per Trip Value Added for Only Charter Firms $43,555 $714 Value Added Including Support Industries n/a n/a Net Local Purchases $5,585 $190 Employment Earnings $3,200 $109 Balance of Payments $53,350 $875 EBITDA $44,085 $723 Government Revenue $3,730 $61 Charter Sector Jobs 2 0.032787 Jobs Across All Tourist Support Industries n/a n/a Value Added Ratio 51.24% IRR 11.39%

Recreational Fishery Development Options February, 2009 _____________________________________________________________________
13
Table 7 contains the metrics for the lodge business. Total revenue, not shown in the table, was $54,000 or about $335 per unit night. Annual value added for this part of the business was $27,980 per season and $459 per trip. This translated in to a value added ration of 51.81%. Because of the need to import almost all inputs, the net local purchases annually were $3,236 or $53 per trip. Annual employment earnings were $3,000 and the firm employed two staff through the season. The balance of payments for the year was $35,665 and $585/trip. EBITDA was $28,830 annually and $473 per trip. Government revenue was $3,850 in 2008 and $61/trip or $24 per unit night. Finally, IRR for the charter business was -16%. Table 8. Tongan Hotel Metrics.
Metric Type Enterprise Per Trip
Value Added for Hotel Operation $27,980 $459 Value Added Including Support Industries n/a n/a Net Local Purchases $3,236 $53 Employment Earnings $3,000 $49 Balance of Payments $35,665 $585 EBITDA $28,830 $473 Government Revenue $3,850 $63 Hotel Sector Jobs 2 0.04918 Jobs Across All Tourist Support Industries n/a n/a Value Added Ratio 51.81% IRR -16.02%
Table 8 contains the metrics for the entire business. Total revenue, not shown in the table, was $139,000 or about $2,279 per charter trip. Annual value added for this part of the business was $71,534 per season and $1,173 per trip. This translates in to a value added ration of 51.46%. Because of the need to import almost all inputs, the net local purchases annually were $8,821 or $145 per trip. Annual employment earnings were $6,200 and the firm employed 4 staff through the season. The balance of payments for the year was $89,015 and $1,459/trip. EBITDA was $72,914 annually and $1,195 per trip. Government revenue was $7,580 in 2008 and $124/trip. Finally, IRR for the entire business was -6.4%. In tables 7 and 8 the IRR’s for the lodge and for the entire operation were negative. This is driven by two factors. The capital investment cost for the hotel is quite high, given that it only operates for six months out of the year. If the lodge operated year round, the IRR for the total operation would be 13%. This assumes a doubling of charter trips to 122 trips annually and doubling of lodge occupancy to 322 unit nights. It also assumes a doubling of all variable costs, but only doubling certain fixed costs such as business travel, maintenance of the boat and lodge, advertising, and all fishing tackle. Additionally, the lodge is also used as a private residence for the charter captain and his wife. As a result it is not appropriate to include the portion of the lodge that is their private residence in the capital cost calculation.

Recreational Fishery Development Options February, 2009 _____________________________________________________________________
14
Table 8. Tongan Total Operation Metrics. Metric Type Enterprise Per Trip
Value Added for Entire Operation $71,534 $1,173 Value Added Including Support Industries n/a n/a Net Local Purchases $8,821 $145 Employment Earnings $6,200 $102 Balance of Payments $89,015 $1,459 EBITDA $72,914 $1,195 Government Revenue $7,580 $124 Charter Sector Jobs 4 0.081967 Jobs Across All Tourist Support Industries n/a n/a Value Added Ratio 51.46% IRR -6.41%
Surveying only the charter businesses only tells part of story of the economic importance of fishing tourism. The tourist themselves spend money to travel to the destination and purchase souvenirs and participate in other recreational activities which also contributes to local economies. This project did not have enough funding to conduct a survey of the tourists themselves. Looking at the analysis for Hawaii, ancillary spending by during just the fishing portion of the vacation generates an additional $723 in value added, $194 in government revenue, and supports an additional 0.01 job per trip. If you include non-fishing guests and the time not spent fishing, ancillary spending generates $1,551 in value added, $416 in government revenue, and supports 0.03 jobs per trip Tongan lodge and charter operators face many barriers to growing tourism angling. Operational costs are very high for these operations due to the high cost of imports and the lack of any utility infrastructure. Because of the lack of utility infrastructure, all lodges must generate their own power. Much of the high cost of imports is driven by customs duties and consumption taxes. For instance, importing a boat incurs a customs duty of 20% plus a 15% consumption tax, with both taxes being levied on the value of the good plus the cost of the shipping. This same tax structure applies to any other large capital expenditure such as generators. Additionally, these operators feel there is little Tongan government support for tourism citing little leadership, little strategic investment, and little overall planning for tourism development. While bed taxes are necessary to provide and maintain tourism infrastructure, current business revenues are taxed at up to 30%. Due to the lack of government support, it is felt that other islands such as Fiji, Vanuatu, Samoa, and the Cook Islands, are able to out-compete them for tourist dollars. Charter operators in Tonga are also concerned about fisheries management. They feel that commercial longlining operations catch high value recreational species like billfish, wahoo, and tuna and sell them for relatively low prices locally. This has the effect of reducing the quality of recreational trips, creating a barrier to growing a high quality recreational fishing destination. There has been one proposal in the last year to ban the commercial harvest of billfish species, thereby leaving the billfish for recreational anglers.
Recreational Fishery Development Options February, 2009 _____________________________________________________________________
15
Vanuatu Metrics Very little is known about private or for-hire recreational fisheries in Vanuatu as well. Much like Tonga, Vanuatu is surrounded by pristine waters that attract divers from around the world. Tourism is an important part of the Vanuatu economy attracting 167,000 visitors in 2007 and supplying upwards of 40% of its gross domestic product. The majority of these visitors are from Australia and New Zealand. Besides diving, Vanuatu is known for beautiful beaches, volcanoes, adventure sports, and world class offshore fishing. In 2002, the Vanuatu government began a series of tourism promotion activities including improving air connections, developing resorts, and attracting cruise ships. These measures were largely effective in increasing tourism. Vanuatu is known as a big game fishing capital and hosts the Vanuatu Marlin Classic, the PVGCFC Tusker Game Fish Classic, the Blue Marlin World Cup, the Tusker Easter Tournament, and the ITM Fishing Group Tournament. Charter boats play a large roll in international tournament fishing as international participants will charter local boats to compete. There are close to thirty charter boats operating in Vanuatu, not including resorts that hire small outboards to take guests fishing. Additionally, Vanuatu is the jumping off point for several live aboard, long range fishing charters that operate as open boat charters similar to the long range charter boats that operate out of Southern California. At least one of these boats is headquartered in New Zealand but spends May- July in the waters off Vanuatu. Also, Vanuatu is home to many center consoles boats that are marketed as jig boats. Deep jigging for tuna and other species is relatively new technique that is increasing rapidly in popularity. Vanuatu is home to a small boat association, a charter association, and at least one fishing club. This study was able to collect data across three enterprises that own and operate a combined total six sportfishing boats. Because these enterprises own one to three boats per business, the unit of analysis will be at the individual boat level using average cost and returns for a representative boat. These boats are all large sportfishing boats with single or twin diesels engines and an average horsepower of 633 horsepower. As such, this study focuses on the offshore trolling sportfishing class of charter operator and not the jig boats or mother ship operations. These six boats took 895 chartered fishing trips in 2008, averaging 149 trips per boat. The number of trips taken per boat ranged from 100 trips to 205 trips per year. These enterprises operate year round, unlike the Tonga enterprise, and the number of trips they take reflects that fact. Two enterprises interviewed, representing four vessels, target billfish primarily with tunas and other pelagic species targeted secondarily. The other operation caters to less specialized anglers and targets whatever is most abundant, including reef species. None of these businesses provide any other for-hire recreational services besides fishing. All vessels interviewed retain and sell the majority of their catch, unlike the Tongan enterprise. Average revenue from the sale of catch was $14,667. Average revenue from the charter was $122,751 per boat or approximately $822 per trip. Trip charges for these vessels ranged from slightly over $700 per trip to almost $1,400 per trip. On average, total revenues per boat, including the sale of fish, was $137,418.

Recreational Fishery Development Options February, 2009 _____________________________________________________________________
16
On average, each boat employees three people each year. Each boat hires one to two crew members for the boat, one employee to handle odd jobs around the dock, and one employee for security. None of the owner/captains draw a salary but take business profits as salary. The majority of the government revenue generated in Vanuatu come from the 12.5% value added tax (VAT) levied for all goods and services sold in the country and import duties. A small amount of government revenue is also generated through the sale of various business licenses. Table 9 contains the metrics for each boat. Annual value added was $61,405 per boat and $412 per trip. This produced a value added ration of 44.68%. Because of the need to import almost all inputs, the net local purchases annually were $13,614 or $189 per trip. This is higher than Tonga as the Vanuatu boats have higher fixed and variable costs. Annual employment earnings were $12,377 and the firm employed 3 staff. Wages are higher than in Tonga. The balance of payments for each boat for the year was $82,770 and $555/trip. EBITDA was $53,845 annually and $361 per trip. Government revenue was $7,366 in 2008 and $49/trip. Finally, IRR for the entire business was 24.75%. Table 9. Vanuatu Charter Boat Metrics
Metric Type Enterprise Per Trip Value Added for Only Charter Firms $61,405 $412 Value Added Including Support Industries n/a n/a Net Local Purchases $13,614 $189 Employment Earnings $12,377 $172 Balance of Payments $82,770 $555 EBITDA $53,845 $361 Government Revenue $7,366 $49 Charter Sector Jobs 3 0.013408 Jobs Across All Tourist Support Industries n/a n/a Value Added Ratio 44.68% IRR 24.75%
Because no survey of tourists was conducted, it is impossible to determine ancillary expenditure made by tourists during their fishing trip to Vanuatu. Assuming that visitors to Vanuatu are similar to Hawaiian visitors, the angling party spend $2,199 per trip for just the fishing portion of the trip, assuming a fishing party of three, and including all travel related expenditures including food, lodging, souvenirs, and travel costs, in addition to the amount spent on charter fishing. This is based on a trip length of four days with one day spent fishing. This level of expenditure generates and additional $1,138 in value added, $305 in government revenue, and supports 0.02 jobs per boat trip. The businesses contacted for this effort expressed concern about the various barriers they face in running and expanding their businesses. All mentioned government taxes and business restrictions as barriers. Two businesses mentioned they were concerned about current fisheries management and felt that current commercial longlining and discussions about future longlining expansion were direct threats to their livelihood. One operator is concerned about input costs, particularly fuel costs. Finally, one operator is concerned

Recreational Fishery Development Options February, 2009 _____________________________________________________________________
17
about the overall business climate in Vanuatu. Particularly, this operator felt that the government does not view charter operators as legitimate businesses earning real returns. This is a common misperception encountered in the area. Hopefully the analysis presented here will help dispel this misconception.
Comparison Across Sectors At the boat level, Tongan trips generate more value added per trip than Vanuatu and Hawaiian because Tongan captains charge considerably more for fishing trips and because of differing cost structures across the different countries. Tongan charters charge approximately $1,300/trip which is higher than either Vanuatu ($921/trip) or Hawaii ($913/trip). Total fixed and variable costs per trip are cheapest in Vanuatu at $624/trip Tongan costs are second highest at $848/trip and Hawaiian costs are highest at $ 1,148/trip. Hawaiian costs are higher than Tongan costs primarily due to higher labor costs in Hawaii. EBITDA is also ranked similarly, mostly due to the higher revenue per trip in Tonga. Hawaiian value added falls between Tongan and Vanuatu value added per trip for just the boat hire. Because most Tongan enterprise only operate six months out of the year and because capital expenditures are fairly large, IRR in Tonga is much lower at the boat level (11.4%). Vanuatu and Hawaiian IRR’s are surprisingly similar at 24.8% for Vanuatu and 23.3% for Hawaii. For the total operation in Tonga, the IRR is actually negative. If the Tongan operation were to operate for the entire year, the IRR for the charter operation and lodge combined would be positive. Again, it must be stated that only examining the charter enterprises paints a small portion of the total picture. Looking at the Hawaii analysis, the charter portion of a tourist expenditure profile represents only 29% of the value added, government revenue, and jobs generated by tourist angling. It is difficult to compare these result to the results generated in the previous longlining and purse seining reports (Philipson 2006, Philipson 2007) because it is impossible to denominate charter fishing metrics by tonnes of landed tuna. While it would be possible to generate total value added for the commercial fishing and processing sectors by looking at various current or potential harvest levels, it would be impossible to estimate totals for the recreational charter sector because estimates of the total number of charter trips does not exist. Value added ratios and IRR’s are not denominated in tonnes allowing for some limited comparisons. Unfortunately it was not possible in the previous reports to calculate these metrics for all of the operational models examined. Value added ratios in the purse seining report ranged from 1.9% to 49.6%, but the value added ratio could not be estimated for the operational model, combined domestic catching and canning, that produced the highest economics benefits using the scoring procedure (Philipson 2007). Similarly for IRR, domestic canning had an IRR or 24% and catch and transship had an IRR of 33.8%, but those were the only two operational models where IRR could be estimated. The longlining analysis (Philipson 2006) was able to estimate value added ratios and IRR’s for all operational models examined except federal licensing. Value added ratios

Recreational Fishery Development Options February, 2009 _____________________________________________________________________
18
ranged from 16.9% to 21.6%, with value added processing operations leading. IRR’s ranged from 13.0% to 28.4% again with value added processing ranking the highest. When only examining value added ratios and IRR’s, charter fishing compares favorably. From this analysis, value added ratios range from 44.7% to 51.2% and IRR’s range from 11.4% to 24.8%. The IRR of 11.4% is from Tonga for an operation that only runs for six months a year. If the Tongan operation ran year round, the IRR could reach 37% assuming a doubling of revenue, a doubling of all variable costs, and a doubling of some fixed costs.
Discussion From this analysis, recreational fishing is a viable economic development strategy, but one that potentially conflicts with commercial longlining and purse seining. Because recreational fishing is an inefficient way to harvest fish compared to industrial longlining or purse seining and because recreational anglers value healthy stocks, recreational fishing has a better chance of being a sustainable fishery development strategy. Charter fishing and other tourist support activities typically generate high value added when compared to other industries because they are labor intensive relative to inputs that must be imported. Tourism can be an excellent way to improve local economies if the locals are the business owners. Often for larger tourism development projects like resorts and hotels the investors are foreign and therefore the profits go overseas. The key is to put ownership of these businesses in local hands. Because capital expenditures are relatively low, compared to building onshore processing capacity, it is relatively less costly to increase local charter fishing capacity. While, most visitors to these countries visit to participate in many different recreational activities and rarely come for the fishing alone, quality fishing experiences factor greatly in the enjoyment of trips. Therefore it is essential to have healthy and abundant stocks of tuna and other species, professional captains and charter businesses to make tourist angling successful. In addition to extractive and minimally extractive (catch and release) uses of tuna, there are additional tourist activities that depend to some extent on tuna such as diving, sightseeing, whale watching, etc. Detailing the interplay between these other activities and tuna stocks is beyond the scope of this project. It would be possible to capture this activity if the surveys were conducted to include all tourist services that provide recreational opportunities on the ocean. As a result, if the benefits accruing to these non-extractive uses could be captured it would increase the total benefits of tourism relying on tuna resources. Healthy stocks support extractive and non-extractive tourist uses. The value added provided by non-extractive uses of tuna resources are impossible to compare to commercial fishing based on tons of fish. One potential way to make the comparison is in total at the industry level, but that is beyond the scope of this effort as it would require estimates of total effort across all tourist industries that may interact with tuna and economic profiles of those industries like the profiles discussed here. It is likely that the contribution of tuna to the value added generated by sightseeing, diving operations, or other activities are small, but should not be ignored.

Recreational Fishery Development Options February, 2009 _____________________________________________________________________
19
Recreational anglers, particularly highly specialized anglers, are sensitive to stock conditions and recreational/commercial allocation decisions. Managing for sustained commercial yield can often run contrary to maximizing recreational benefits due to recreational preferences for high encounter rates and larger fish. There has been a fair amount of research on angler preferences for stock size and composition.2 Across these publications, anglers prefer more and larger fish as expressed by their willingness to pay for larger fish and higher catch rates. Stock structures with higher abundance of larger fish have also been shown to increase effort and cause anglers to substitute away from stocks with less desirable stock structures. Healthy stocks and high abundance are critical for successful tourist fisheries. Commercial longlining has been shown to have sometimes significant bycatch of billfish and protected species, both important to tourist activities. Island economies are fragile and should focus on activities that are sustainable. Recreational fishing can be managed sustainably and provide a high degree of economic sustainability, however it is important to safeguard stocks in order to attract and retain tourist anglers. It was beyond the scope on this analysis to examine the feasibility of increasing fishing tourism. Examining the feasibility would involve determining the ability to attract more fishing visitor as well as selling additional trips to current visitors. Initial indications suggest that it would be possible to do both. A full evaluation would involve a survey of tourists, including fishing and non-fishing tourists to determine the potential to recruit new visitors and sell more trips to existing visitors. This evaluation could also be used to collect expenditure data that would detail the ancillary spending by angling tourists that is not included in this study. Part of selling additional trips to existing and new visitors is offering variety, particular in terms of species target and cost. As with the other sector reports, expanding tourism development faces many barriers. Increasing tourism fishing would involve addressing some if not all of these barriers including: initial investment; transportation infrastructure; tourist services infrastructure; availability of other tourist activities; and government support or lack of support for tourism. While investment costs to start an offshore charter business are relatively low compared to other development strategies, buying a $250,000 boat could be a significant barrier for locals. This report has only examined off-shore charters that use large, expensive boats. Many domestic US charter fisheries use much smaller, less expensive boats to target inshore and reef species. These boats in the U.S. are fiberglass, single or dual outboard boats, usually less than 30 feet in length. Usually, the cost of these boats is considerably lower than $100,000. These types of charters charge anywhere from $500 to $800 per trip depending on species target. In the very popular Cabo San Lucas, Mexico tourist fishing market, there is a thriving tourist fishery that has developed using the artisanal fishing skiff, called a panga locally. Typically these are open wood and fiberglass boats around 25 feet in length utilizing a 2 Some examples include: summer flounder (Massey et al 2006); red snapper, grouper, mahi-mahi, king mackerel (Gentner 2004); billfish (Gillis and Ditton 2002); red drum (Oh et al 2005); bluefin tuna (Stoll and Ditton 2006); aggregate big game species group that includes tunas and billfish (Gentner and Lowther 2002 and others).

Recreational Fishery Development Options February, 2009 _____________________________________________________________________
20
single small displacement outboard engine. These boats target inshore and nearshore species when conditions are rough, but also target pelagic species when the conditions warrant. Typically, these charters are half the cost of chartering a 35 foot dual engine sport fisher, with half day trips running $250 and full day trips running $500. Most nations in the region suffer from inadequate transportation infrastructure, mainly in the form of infrequent flights. Vanuatu government focused on improving this infrastructure in 2002, including increasing cruise ship business, and it was viewed as generally successful. Additionally, local governments can increase visitation through government sponsored general advertising programs. Many enterprises contacted for this effort also expressed a concern that their operations are not viewed as legitimate business, but are instead viewed as “labor’s of love” or hobbies. This misperception impacts how they are treated by their local governments. The analysis above shows that all of these businesses are earning acceptable returns.
References DBEDT. 2007. Annual visitor research report, 2007. Hawai‘i. Department of Business,
Economic Development and Tourism. Research and Economic Analysis Division. Honolulu, Hawaii. 167pp.
Gentner, B., and S. Steinback. (2008). The Economic Contribution of Marine Angler
Expenditures in the United States, 2006. U.S. Department of Commerce, NOAA Technical Memorandum NMFS-F/SPO-94.
Gentner, Brad (2004). Examining target species substitution in the face of changing
recreational fishing policies. In: What are Responsible Fisheries? Proceedings of the Twelfth Biennial Conference of the International Institute of Fisheries Economics and Trade. July 20 – 30, 2004. Tokyo, Japan.
Gentner, Brad and Alan Lowther (2002). "Evaluating Marine Sport Fisheries in the
USA." In Recreational Fisheries: Ecological, and Economic, and Social Evaluation. T.J. Pitcher and C.E. Hollingsworth eds. Blackwell Science, Oxford. Pp. 186-206.
Gillis, K.S. and R.B. Ditton. (2002). A Conjoint Analysis of US Atlantic Billfish Fishery
Management Alternatives. North American Journal of Fisheries Management. 22(4): 1218-1228.
Hamilton, M.S. and S.W. Huffman 1997. Cost-Earnings Study of Hawaii’s Small Boat
Fishery 1995-1996. University of Hawaii, Joint Institute for Marine and Atmospheric Research. JIMAR Contribution 97-314. 104pp.
Massey, M., S. Newbold, and B. Gentner. (2006). Valuing water quality changes using a
bioeconomic model of a coastal recreational fishery. Journal of Environmental Economics and Management. 52(1): 482-500.
Minnesota IMPLAN Group, Inc. 1997. IMPLAN professional: social accounting and
impact analysis software. Minnesota IMPLAN Group, Inc., Minneapolis.

Recreational Fishery Development Options February, 2009 _____________________________________________________________________
21
Oh, C., R.B. Ditton, B. Gentner, and R. Reichers. (2006). A Stated Preference Choice Approach to Understanding Angler Preferences for Management Options. Human Dimensions of Wildlife. 10(3): 173-186.
O’Malley, J.M. and E.W. Glazier. 2001. Motivations, Satisfaction and Expenditures of
Recreational Pelagic Charter Fishing Patrons in Hawaii. Joint Institute for Marine and Atmospheric Research (JIMAR). Contribution 01-339. SOEST 01-03. 56pp.
Philipson, P. (2006). An Assessment of Development Options in the Longline Fishery.
Final Report prepared for the DEVFISH Project. November, 1006.asked Philipson, P. (2007). An Assessment of the Economic Benefits for Tuna Purse Seine
Fishing and Onshore Processing for Catches. Final Report prepared for DEVADS Ltd. Port Moresby, Papua New Guinea. July 2007.
Stoll, J. and R. Ditton. (2006). Understanding Anglers’ Willingness to Pay Under
Alternative Management Regimes. Human Dimensions of Wildlife. 11(1): 27-42. Walker, J. 1997. Sociology of Hawaii charter boat fishing. Joint Institute for Marine and
Atmospheric Research (JIMAR). SOEST 97-02. 56pp.
Persons Contacted Because a small number (3 or less) of operators were contacted in Vanuatu and Tonga those operators will not be identified to protect confidentiality.

Recreational Fishery Development Options February, 2009 _____________________________________________________________________
22
Appendix A: Terms of Reference The Financial Viability and Economic Impact of Sports Fishing Charters
Introduction A key objective of FFA economic research is to provide information on tuna fishery development strategies that allows the benefits and problems of different approaches to be clearly identified by decision makers. Being able to compare the economic benefits from the different fisheries is an essential first step in capturing greater returns for the countries in the region. This study will analyse the economic impact of a fishery that is often neglected in the drive to develop a large scale tuna industry: the sport-fishing charter business which targets billfish, tuna and other pelagic species that are also caught by commercial tuna fisheries. Background The economic impact of tuna fishing in the region has not been well measured. To address this problem, the DevFish project has undertaken studies of the economic benefits of the major industrial fisheries in the region – longline and purse-seine – as well as processing of their catches. Detailed assessments have also been made of three small-scale fisheries: pumpboats in Papua New Guinea; the alia fishery in Samoa; and the small scale troll fishery in Kiribati. This study will complete the series, with assessments of the economic benefits of the sportfishing charter business of which good examples are found in Vanuatu, Tonga and elsewhere. The Question The key question involves tracing the flow of benefits to the national economy from each activity. For reasons of confidentiality of data, it is necessary to aggregate results across a number of operators, normally from more than one country. In the case of the sportfishing charter business, initial research in Fiji has raised doubts over the financial viability of some operations. The study will contrast the experience of different enterprises with the well established sport fishery in Hawaii. Issues to be addressed The analysis will estimate, at an enterprise level, the key criteria on which the economic benefits of the different operational models can be quantified. For consistency and to allow comparisons to be made between operations at different scales, values will be presented in US$ per tonne of tuna catch. It is recognized, however, that this is not entirely suitable for sport fishing operations, where catches are small, and fish are often released. Other methods of measuring impact – by enterprise, or per tourist visit, may also be used. The criteria used in DevFish studies – value added, employment earnings, contribution to balance of payments, etc. will be calculated where possible. The study will also analyse the financial viability of sport fishing charters as a business, in particular the return on investment.

Recreational Fishery Development Options February, 2009 _____________________________________________________________________
23
Recommendations on development strategies Sport fishing is often not well addressed in national plans, but can be an important part of a country’s attractiveness for a much larger tourist industry. It may also attract tourist revenues in countries or locations that are not destinations for mass tourism. There have been few studies of the constraints and problems faced by sport fishing charter operators in the region, and this study will aim to document these and suggest solutions. The fishery is vulnerable to the effects of tuna stock depletion, and may suffer from interaction with industrial fisheries. The study will briefly consider these issues and the effectiveness of mitigation measures adopted in some countries. Methodology The study will use detailed case studies in three or more countries in the region to collect additional data. Data from one enterprise in Fiji has already been obtained. The consultant will be responsible for securing information from one or more operators in Vava’u, Tonga, as well as comparative data from Hawaii. The consultant, assisted by FFA staff will endeavour to collect information from at least two more enterprises, covering at least one more country in the region. A number of angler questionnaires will also be completed, to supplement the small number already received from Fiji. The study will be implemented by an international consultant with expertise in fisheries economics particularly in the recreational fishing sector. The study will nominally require about 20 days’ work by the senior consultant, but this time will be spread over a longer period. Outputs: Within two weeks of completing field work: A draft final report, on which comments will be made within one week. Within one week of receiving these comments: A final report with three hard copies and an electronic copy in MS Word.